
Label-Free Quantitative Proteomics Analysis of Adriamycin Selected Multidrug Resistant Human Lung Cancer Cells


Abstract
:1. Introduction
2. Methodology
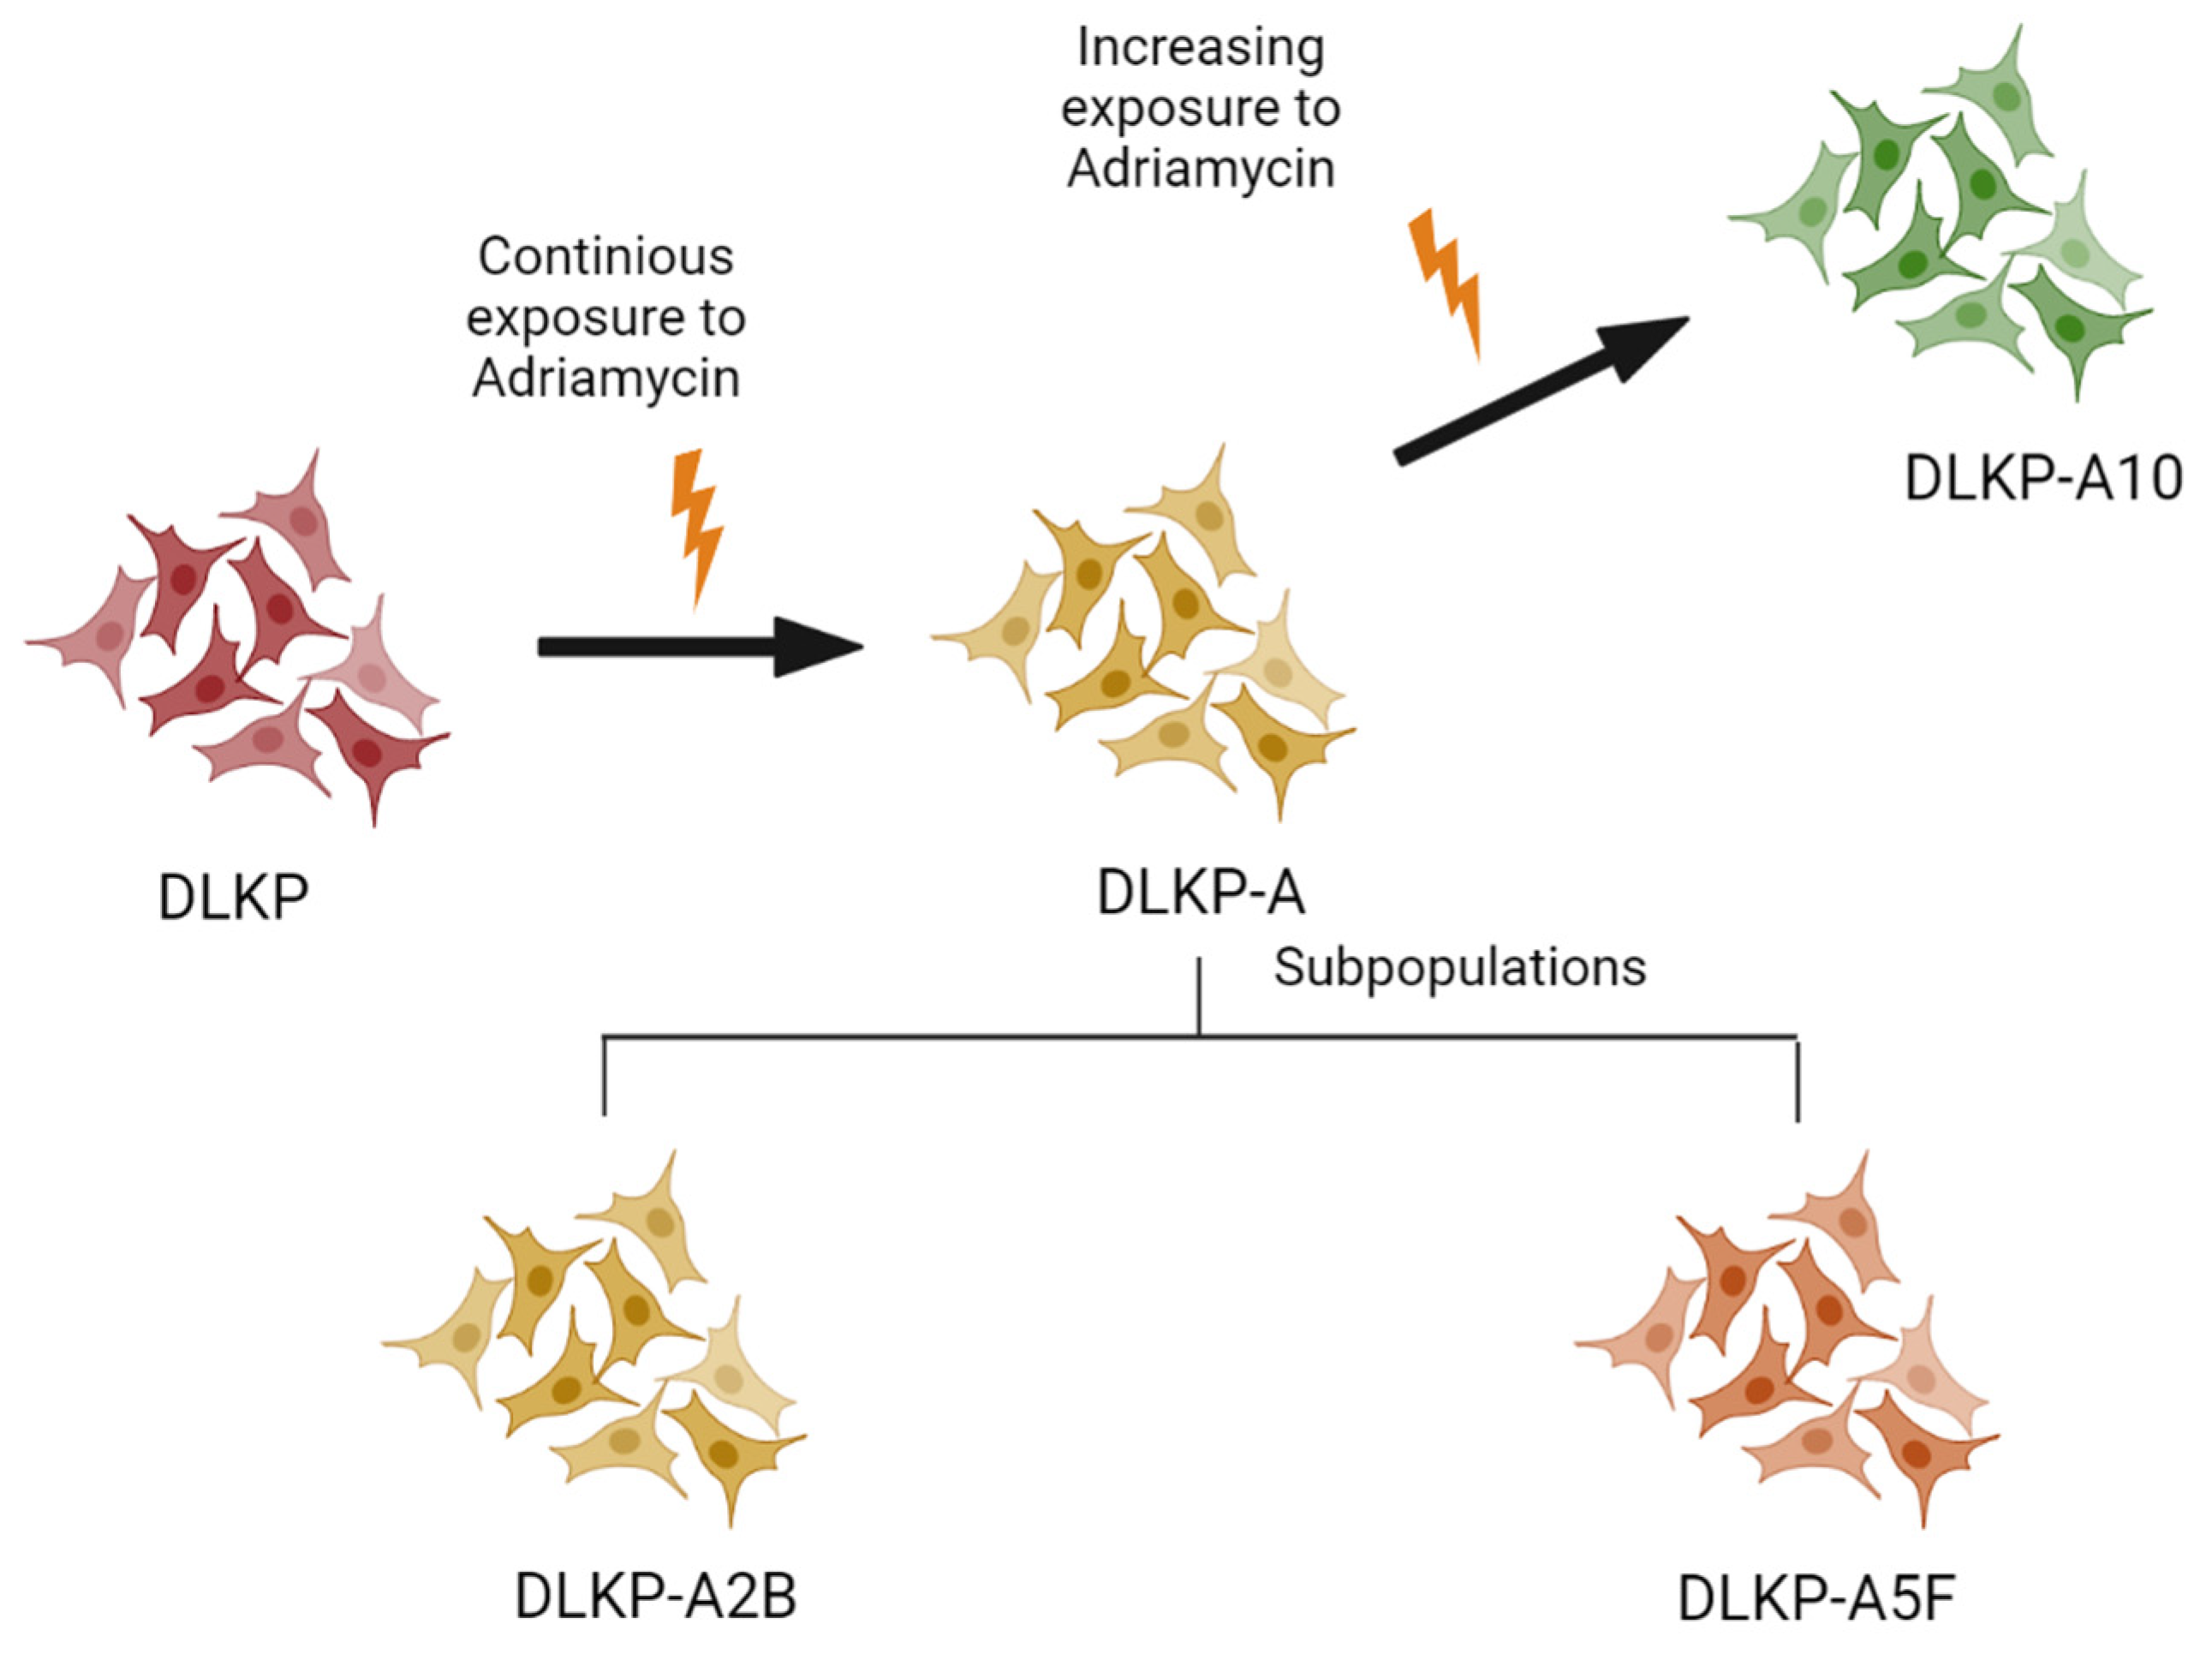
2.1. Cell Culture
2.2. Preparation of Mass Spectrometry Samples
2.3. Mass Spectrometry (the Nano LC-MS/MS)
2.4. Differential Expression (DE) Analysis
2.5. Gene Ontology
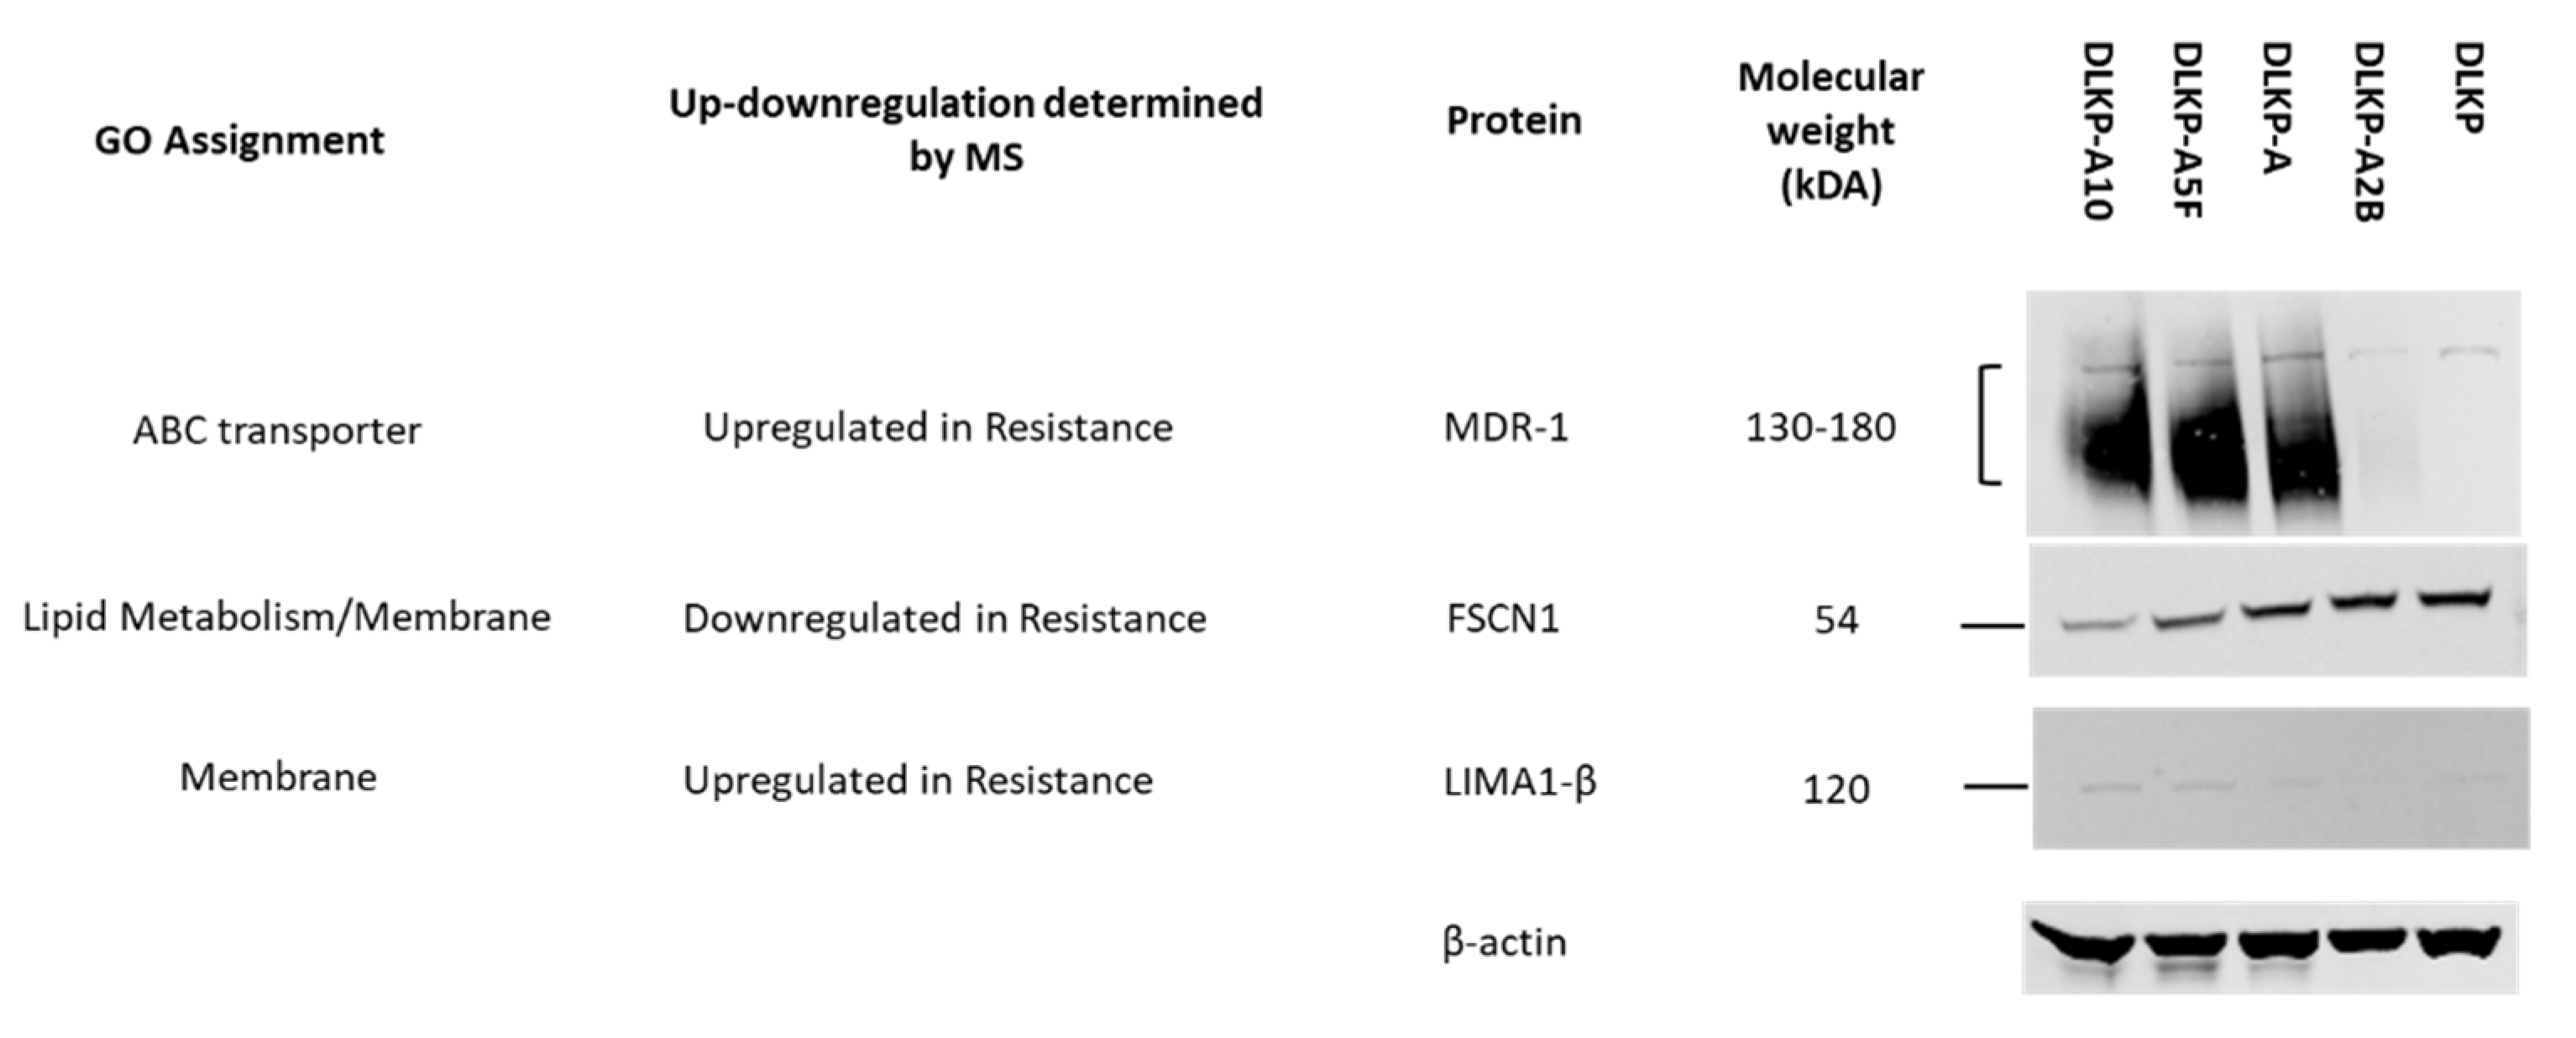
2.6. Western Blot for Validation
3. Results and Discussion
3.1. Drug Resistance in DLKP Subclones and the Role of ABC Transporters: ABCB1 and ABCC1
3.2. Interaction of ABCD1 and ABCD3-Transporter Proteins with Fatty Acid Metabolism and Peroxisome Pathway in Drug Resistance
3.3. Other ABC-Transporters and Their Expression Profiles in Drug-Resistant DLKP Subpopulations
3.4. Expression Levels of Plasma Membrane-Related Proteins in pDLKP and Its Drug-Resistant Subpopulations
3.5. Enriched Pathways and Cellular Proteome Related to Enriched Drug-Resistance Mechanisms Determined by Gene Ontology (GO) Analysis
4. Conclusions
Supplementary Materials
Author Contributions
Funding
Institutional Review Board Statement
Informed Consent Statement
Data Availability Statement
Acknowledgments
Conflicts of Interest
References
- Lung Cancer. Available online: https://www.mariekeating.ie/cancer-information/lung-cancer/ (accessed on 6 June 2022).
- Kumar, S.; Kushwaha, P.P.; Gupta, S. Emerging Targets in Cancer Drug Resistance. Cancer Drug Resist. 2019, 2, 161–177. [Google Scholar] [CrossRef] [Green Version]
- Clynes, M.; Daly, C.; NicAmhlaoibh, R.; Cronin, D.; Elliott, C.; O’Connor, R.; O’Doherty, T.; Connolly, L.; Howlett, A.; Scanlon, K. Recent Developments in Drug Resistance and Apoptosis Research. Crit. Rev. Oncol. Hematol. 1998, 28, 181–205. [Google Scholar] [CrossRef]
- Lai, G.-M.; Moscow, J.A.; Alvarez, M.G.; Fojo, A.T.; Bates, S.E. Contribution of Glutathione and Glutathione-Dependent Enzymes in the Reversal of Adriamycin Resistance in Colon Carcinoma Cell Lines. Int. J. Cancer 1991, 49, 688–695. [Google Scholar] [CrossRef]
- Noguchi, M.; Kabayama, K.; Uemura, S.; Kang, B.; Saito, M.; Igarashi, Y.; Inokuchi, J. Endogenously Produced Ganglioside GM3 Endows Etoposide and Doxorubicin Resistance by Up-Regulating Bcl-2 Expression in 3LL Lewis Lung Carcinoma Cells. Glycobiology 2006, 16, 641–650. [Google Scholar] [CrossRef]
- Clynes, M.; Redmond, A.; Moran, E.; Gilvarry, U. Multiple Drug-Resistance in Variant of a Human Non-Small Cell Lung Carcinoma Cell Line, DLKP-A. Cytotechnology 1992, 10, 75–89. [Google Scholar] [CrossRef] [PubMed]
- Clynes, M. Cellular Models for Multiple Drug Resistance in Cancer. In Vitro Cell. Dev. Biol. 1993, 29, 171–179. [Google Scholar] [CrossRef]
- Law, E.; Gilvarry, U.; Lynch, V.; Gregory, B.; Grant, G.; Clynes, M. Cytogenetic Comparison of Two Poorly Differentiated Human Lung Squamous Cell Carcinoma Lines. Cancer Genet. Cytogenet. 1992, 59, 111–118. [Google Scholar] [CrossRef]
- Keenan, J.; Murphy, L.; Henry, M.; Meleady, P.; Clynes, M. Proteomic Analysis of Multidrug-Resistance Mechanisms in Adriamycin-Resistant Variants of DLKP, a Squamous Lung Cancer Cell Line. Proteomics 2009, 9, 1556–1566. [Google Scholar] [CrossRef] [PubMed]
- Heenan, M.; O’Driscoll, L.; Cleary, I.; Connolly, L.; Clynes, M. Isolation from a Human MDR Lung Cell Line of Multiple Clonal Subpopulations Which Exhibit Significantly Different Drug Resistance. Int. J. Cancer 1997, 71, 907–915. [Google Scholar] [CrossRef]
- Cleary, I.; Doherty, G.; Moran, E.; Clynes, M. The Multidrug-Resistant Human Lung Tumour Cell Line, DLKP-A10, Expresses Novel Drug Accumulation and Sequestration Systems. Biochem. Pharmacol. 1997, 53, 1493–1502. [Google Scholar] [CrossRef]
- Benjamini, Y.; Hochberg, Y. Controlling the False Discovery Rate: A Practical and Powerful Approach to Multiple Testing. J. R. Stat. Soc. Ser. B Methodol. 1995, 57, 289–300. [Google Scholar] [CrossRef]
- Dagogo-Jack, I.; Shaw, A.T. Tumour Heterogeneity and Resistance to Cancer Therapies. Nat. Rev. Clin. Oncol. 2018, 15, 81–94. [Google Scholar] [CrossRef]
- Pikor, L.A.; Ramnarine, V.R.; Lam, S.; Lam, W.L. Genetic Alterations Defining NSCLC Subtypes and Their Therapeutic Implications. Lung Cancer 2013, 82, 179–189. [Google Scholar] [CrossRef] [Green Version]
- Robey, R.W.; Pluchino, K.M.; Hall, M.D.; Fojo, A.T.; Bates, S.E.; Gottesman, M.M. Revisiting the Role of ABC Transporters in Multidrug-Resistant Cancer. Nat. Rev. Cancer 2018, 18, 452–464. [Google Scholar] [CrossRef] [PubMed]
- Van der Deen, M.; de Vries, E.G.; Timens, W.; Scheper, R.J.; Timmer-Bosscha, H.; Postma, D.S. ATP-Binding Cassette (ABC) Transporters in Normal and Pathological Lung. Respir. Res. 2005, 6, 59. [Google Scholar] [CrossRef] [PubMed] [Green Version]
- Leonard, G.D.; Fojo, T.; Bates, S.E. The Role of ABC Transporters in Clinical Practice. Oncologist 2003, 8, 411–424. [Google Scholar] [CrossRef] [PubMed]
- Dimanche-Boitrel, M.-T.; Garrido, C.; Chauffert, B. Kinetic Resistance to Anticancer Agents. In Multiple Drug Resistance in Cancer: Cellular, Molecular and Clinical Approaches; Clynes, M., Ed.; Springer: Dordrecht, The Netherlands, 1994; pp. 347–356. ISBN 978-94-011-0826-3. [Google Scholar]
- Choi, C.-H. ABC Transporters as Multidrug Resistance Mechanisms and the Development of Chemosensitizers for Their Reversal. Cancer Cell Int. 2005, 5, 30. [Google Scholar] [CrossRef] [Green Version]
- Juliano, R.L.; Ling, V. A Surface Glycoprotein Modulating Drug Permeability in Chinese Hamster Ovary Cell Mutants. Biochim. Biophys. Acta 1976, 455, 152–162. [Google Scholar] [CrossRef]
- Dohse, M.; Robey, R.W.; Brendel, C.; Bates, S.; Neubauer, A.; Scharenberg, C. Efflux of the Tyrosine Kinase Inhibitors Imatinib and Nilotinib (AMN107) Is Mediated by ABCB1 (MDR1)-Type P-Glycoprotein. Blood 2006, 108, 1367. [Google Scholar] [CrossRef]
- Hegedus, C.; Ozvegy-Laczka, C.; Apáti, A.; Magócsi, M.; Német, K.; Orfi, L.; Kéri, G.; Katona, M.; Takáts, Z.; Váradi, A.; et al. Interaction of Nilotinib, Dasatinib and Bosutinib with ABCB1 and ABCG2: Implications for Altered Anti-Cancer Effects and Pharmacological Properties. Br. J. Pharmacol. 2009, 158, 1153–1164. [Google Scholar] [CrossRef] [Green Version]
- Gao, B.; Russell, A.; Beesley, J.; Chen, X.Q.; Healey, S.; Henderson, M.; Wong, M.; Emmanuel, C.; Galletta, L.; Johnatty, S.E.; et al. Paclitaxel Sensitivity in Relation to ABCB1 Expression, Efflux and Single Nucleotide Polymorphisms in Ovarian Cancer. Sci. Rep. 2014, 4, 4669. [Google Scholar] [CrossRef] [PubMed] [Green Version]
- Crawford, R.R.; Potukuchi, P.K.; Schuetz, E.G.; Schuetz, J.D. Beyond Competitive Inhibition: Regulation of ABC Transporters by Kinases and Protein-Protein Interactions as Potential Mechanisms of Drug-Drug Interactions. Drug Metab. Dispos. 2018, 46, 567–580. [Google Scholar] [CrossRef] [PubMed] [Green Version]
- Cole, S.P.; Bhardwaj, G.; Gerlach, J.H.; Mackie, J.E.; Grant, C.E.; Almquist, K.C.; Stewart, A.J.; Kurz, E.U.; Duncan, A.M.; Deeley, R.G. Overexpression of a Transporter Gene in a Multidrug-Resistant Human Lung Cancer Cell Line. Science 1992, 258, 1650–1654. [Google Scholar] [CrossRef] [PubMed]
- Leier, I.; Jedlitschky, G.; Buchholz, U.; Cole, S.P.; Deeley, R.G.; Keppler, D. The MRP Gene Encodes an ATP-Dependent Export Pump for Leukotriene C4 and Structurally Related Conjugates. J. Biol. Chem. 1994, 269, 27807–27810. [Google Scholar] [CrossRef]
- Jedlitschky, G.; Leier, I.; Buchholz, U.; Barnouin, K.; Kurz, G.; Keppler, D. Transport of Glutathione, Glucuronate, and Sulfate Conjugates by the MRP Gene-Encoded Conjugate Export Pump. Cancer Res. 1996, 56, 988–994. [Google Scholar] [PubMed]
- Renes, J.; de Vries, E.G.E.; Jansen, P.L.M.; Müller, M. The (Patho)Physiological Functions of the MRP Family. Drug Resist. Updates 2000, 3, 289–302. [Google Scholar] [CrossRef] [PubMed]
- Morita, M.; Imanaka, T. Peroxisomal ABC Transporters: Structure, Function and Role in Disease. Biochim. Biophys. Acta BBA Mol. Basis Dis. 2012, 1822, 1387–1396. [Google Scholar] [CrossRef] [Green Version]
- Tawbeh, A.; Gondcaille, C.; Trompier, D.; Savary, S. Peroxisomal ABC Transporters: An Update. Int. J. Mol. Sci. 2021, 22, 6093. [Google Scholar] [CrossRef]
- Koundouros, N.; Poulogiannis, G. Reprogramming of Fatty Acid Metabolism in Cancer. Br. J. Cancer 2020, 122, 4–22. [Google Scholar] [CrossRef] [Green Version]
- Hama, K.; Fujiwara, Y.; Hayama, T.; Ozawa, T.; Nozawa, K.; Matsuda, K.; Hashiguchi, Y.; Yokoyama, K. Very Long-Chain Fatty Acids Are Accumulated in Triacylglycerol and Nonesterified Forms in Colorectal Cancer Tissues. Sci. Rep. 2021, 11, 6163. [Google Scholar] [CrossRef]
- Fernández, L.P.; Merino, M.; Colmenarejo, G.; Moreno-Rubio, J.; Sánchez-Martínez, R.; Quijada-Freire, A.; Gómez de Cedrón, M.; Reglero, G.; Casado, E.; Sereno, M.; et al. Metabolic Enzyme ACSL3 Is a Prognostic Biomarker and Correlates with Anticancer Effectiveness of Statins in Non-Small Cell Lung Cancer. Mol. Oncol. 2020, 14, 3135–3152. [Google Scholar] [CrossRef] [PubMed]
- Hillebrand, M.; Gersting, S.W.; Lotz-Havla, A.S.; Schäfer, A.; Rosewich, H.; Valerius, O.; Muntau, A.C.; Gärtner, J. Identification of a New Fatty Acid Synthesis-Transport Machinery at the Peroxisomal Membrane. J. Biol. Chem. 2012, 287, 210–221. [Google Scholar] [CrossRef] [PubMed] [Green Version]
- Hoppel, C. The Role of Carnitine in Normal and Altered Fatty Acid Metabolism. Am. J. Kidney Dis. 2003, 41, S4–S12. [Google Scholar] [CrossRef]
- Longo, N.; Frigeni, M.; Pasquali, M. Carnitine transport and fatty acid oxidation. Biochim. Biophys. Acta 2016, 1863, 2422–2435. [Google Scholar] [CrossRef]
- Drury, J.; Rychahou, P.G.; He, D.; Jafari, N.; Wang, C.; Lee, E.Y.; Weiss, H.L.; Evers, B.M.; Zaytseva, Y.Y. Inhibition of Fatty Acid Synthase Upregulates Expression of CD36 to Sustain Proliferation of Colorectal Cancer Cells. Front. Oncol. 2020, 10, 1185. [Google Scholar] [CrossRef]
- Xu, S.; Chen, T.; Dong, L.; Li, T.; Xue, H.; Gao, B.; Ding, X.; Wang, H.; Li, H. Fatty Acid Synthase Promotes Breast Cancer Metastasis by Mediating Changes in Fatty Acid Metabolism. Oncol. Lett. 2021, 21, 27. [Google Scholar] [CrossRef]
- Fhu, C.W.; Ali, A. Fatty Acid Synthase: An Emerging Target in Cancer. Molecules 2020, 25, 3935. [Google Scholar] [CrossRef]
- Menendez, J.A.; Lupu, R. Fatty Acid Synthase and the Lipogenic Phenotype in Cancer Pathogenesis. Nat. Rev. Cancer 2007, 7, 763–777. [Google Scholar] [CrossRef]
- Pizer, E.S.; Wood, F.D.; Heine, H.S.; Romantsev, F.E.; Pasternack, G.R.; Kuhajda, F.P. Inhibition of Fatty Acid Synthesis Delays Disease Progression in a Xenograft Model of Ovarian Cancer. Cancer Res. 1996, 56, 1189–1193. [Google Scholar]
- Bao, L.; Wu, J.; Dodson, M.; Rojo de la Vega, E.M.; Ning, Y.; Zhang, Z.; Yao, M.; Zhang, D.D.; Xu, C.; Yi, X. ABCF2, an Nrf2 Target Gene, Contributes to Cisplatin Resistance in Ovarian Cancer Cells. Mol. Carcinog. 2017, 56, 1543–1553. [Google Scholar] [CrossRef]
- Kara, G.; Tuncer, S.; Türk, M.; Denkbaş, E.B. Downregulation of ABCE1 via SiRNA Affects the Sensitivity of A549 Cells against Chemotherapeutic Agents. Med. Oncol. 2015, 32, 103. [Google Scholar] [CrossRef]
- Jiang, W.G.; Martin, T.A.; Lewis-Russell, J.M.; Douglas-Jones, A.; Ye, L.; Mansel, R.E. Eplin-Alpha Expression in Human Breast Cancer, the Impact on Cellular Migration and Clinical Outcome. Mol. Cancer 2008, 7, 71. [Google Scholar] [CrossRef] [Green Version]
- Sanders, A.J.; Martin, T.A.; Ye, L.; Mason, M.D.; Jiang, W.G. EPLIN Is a Negative Regulator of Prostate Cancer Growth and Invasion. J. Urol. 2011, 186, 295–301. [Google Scholar] [CrossRef] [PubMed]
- Onozawa, H.; Saito, M.; Saito, K.; Kanke, Y.; Watanabe, Y.; Hayase, S.; Sakamoto, W.; Ishigame, T.; Momma, T.; Ohki, S.; et al. Annexin A1 Is Involved in Resistance to 5-FU in Colon Cancer Cells. Oncol. Rep. 2017, 37, 235–240. [Google Scholar] [CrossRef] [PubMed] [Green Version]
- Wang, Y.; Serfass, L.; Roy, M.O.; Wong, J.; Bonneau, A.M.; Georges, E. Annexin-I Expression Modulates Drug Resistance in Tumor Cells. Biochem. Biophys. Res. Commun. 2004, 314, 565–570. [Google Scholar] [CrossRef] [PubMed]
- Oshi, M.; Tokumaru, Y.; Mukhopadhyay, S.; Yan, L.; Matsuyama, R.; Endo, I.; Takabe, K. Annexin A1 Expression Is Associated with Epithelial-Mesenchymal Transition (EMT), Cell Proliferation, Prognosis, and Drug Response in Pancreatic Cancer. Cells 2021, 10, 653. [Google Scholar] [CrossRef] [PubMed]
- Belvedere, R.; Bizzarro, V.; Forte, G.; Dal Piaz, F.; Parente, L.; Petrella, A. Annexin A1 Contributes to Pancreatic Cancer Cell Phenotype, Behaviour and Metastatic Potential Independently of Formyl Peptide Receptor Pathway. Sci. Rep. 2016, 6, 29660. [Google Scholar] [CrossRef] [Green Version]
- Battista, T.; Fiorillo, A.; Chiarini, V.; Genovese, I.; Ilari, A.; Colotti, G. Roles of Sorcin in Drug Resistance in Cancer: One Protein, Many Mechanisms, for a Novel Potential Anticancer Drug Target. Cancers 2020, 12, 887. [Google Scholar] [CrossRef] [PubMed] [Green Version]
- Wendt, A.; Thompson, V.F.; Goll, D.E. Interaction of Calpastatin with Calpain: A Review. Biol. Chem. 2004, 385, 465–472. [Google Scholar] [CrossRef] [PubMed]
- Liu, D.; Fu, X.; Wang, Y.; Wang, X.; Wang, H.; Wen, J.; Kang, N. Protein Diaphanous Homolog 1 (Diaph1) Promotes Myofibroblastic Activation of Hepatic Stellate Cells by Regulating Rab5a Activity and TGFβ Receptor Endocytosis. FASEB J. 2020, 34, 7345–7359. [Google Scholar] [CrossRef] [Green Version]
- Miao, S.; Schäfer, P.; Nojszewski, J.; Meyer, F.; Windhorst, S. DIAPH1 Regulates Chromosomal Instability of Cancer Cells by Controlling Microtubule Dynamics. Eur. J. Cell Biol. 2021, 100, 151156. [Google Scholar] [CrossRef] [PubMed]
- Kita, K.; Thakkar, P.V.; Galletti, G.; Madhukar, N.; Navarro, E.V.; Barasoain, I.; Goodson, H.V.; Sackett, D.; Díaz, J.F.; Elemento, O.; et al. Imatinib Overrides Taxane Resistance by Selective Inhibition of Novel CLIP1 Variant Obstructing the Microtubule Pore. bioRxiv 2019, 838334v1. [Google Scholar] [CrossRef]
- CLIP1-LTK Fusion: A Novel Druggable Gene Fusion in NSCLC, Identified Using LC-SCRUM-Asia Genomic Screening Platform—A Step Further to Precision Medicine. Available online: https://www.amed.go.jp/en/news/20211129-01.html (accessed on 30 May 2022).
- Della Fazia, M.A.; Castelli, M.; Bartoli, D.; Pieroni, S.; Pettirossi, V.; Piobbico, D.; Viola-Magni, M.; Servillo, G. HOPS: A Novel CAMP-Dependent Shuttling Protein Involved in Protein Synthesis Regulation. J. Cell Sci. 2005, 118, 3185–3194. [Google Scholar] [CrossRef] [Green Version]
- Fu, H.; Xu, J.; Chen, J.; Li, G.; Zhao, X.; Chen, P. Microarray Analysis Reveals Tmub1 as a Cell Cycle-Associated Protein in Rat Hepatocytes. Mol. Med. Rep. 2018, 17, 4337–4344. [Google Scholar] [CrossRef] [PubMed]
- Fu, H.; Zhang, Y.; Chen, J.; Zhou, B.; Chen, G.; Chen, P. Tmub1 Suppresses Hepatocellular Carcinoma by Promoting the Ubiquitination of ΔNp63 Isoforms. Mol. Ther. Oncolytics 2020, 18, 126–136. [Google Scholar] [CrossRef] [PubMed]
- Haxho, F.; Neufeld, R.J.; Szewczuk, M.R. Neuraminidase-1: A Novel Therapeutic Target in Multistage Tumorigenesis. Oncotarget 2016, 7, 40860–40881. [Google Scholar] [CrossRef] [PubMed] [Green Version]
- Chen, L.; Yang, S.; Jakoncic, J.; Zhang, J.J.; Huang, X.-Y. Migrastatin Analogues Target Fascin to Block Tumour Metastasis. Nature 2010, 464, 1062–1066. [Google Scholar] [CrossRef] [PubMed] [Green Version]
- Zhe, N.; Wang, J.; Chen, S.; Lin, X.; Chai, Q.; Zhang, Y.; Zhao, J.; Fang, Q. Heme Oxygenase-1 Plays a Crucial Role in Chemoresistance in Acute Myeloid Leukemia. Hematology 2015, 20, 384–391. [Google Scholar] [CrossRef]
- Heasman, S.-A.; Zaitseva, L.; Bowles, K.M.; Rushworth, S.A.; Macewan, D.J. Protection of Acute Myeloid Leukaemia Cells from Apoptosis Induced by Front-Line Chemotherapeutics Is Mediated by Haem Oxygenase-1. Oncotarget 2011, 2, 658–668. [Google Scholar] [CrossRef] [PubMed] [Green Version]
- Barbazan, J.; Dunkel, Y.; Li, H.; Nitsche, U.; Janssen, K.-P.; Messer, K.; Ghosh, P. Prognostic Impact of Modulators of G Proteins in Circulating Tumor Cells from Patients with Metastatic Colorectal Cancer. Sci. Rep. 2016, 6, 22112. [Google Scholar] [CrossRef] [PubMed] [Green Version]
- Hua, Y.-Q.; Zhang, K.; Sheng, J.; Ning, Z.-Y.; Li, Y.; Shi, W.; Liu, L.-M. NUCB1 Suppresses Growth and Shows Additive Effects With Gemcitabine in Pancreatic Ductal Adenocarcinoma via the Unfolded Protein Response. Front. Cell Dev. Biol. 2021, 9, 641836. [Google Scholar] [CrossRef] [PubMed]
- Oliva, C.R.; Markert, T.; Gillespie, G.Y.; Griguer, C.E. Nuclear-Encoded Cytochrome c Oxidase Subunit 4 Regulates BMI1 Expression and Determines Proliferative Capacity of High-Grade Gliomas. Oncotarget 2015, 6, 4330–4344. [Google Scholar] [CrossRef] [PubMed] [Green Version]
- Chen, J.; Guccini, I.; Di Mitri, D.; Brina, D.; Revandkar, A.; Sarti, M.; Pasquini, E.; Alajati, A.; Pinton, S.; Losa, M.; et al. Compartmentalized Activities of the Pyruvate Dehydrogenase Complex Sustain Lipogenesis in Prostate Cancer. Nat. Genet. 2018, 50, 219–228. [Google Scholar] [CrossRef]
- Cevatemre, B.; Ulukaya, E.; Dere, E.; Dilege, S.; Acilan, C. Pyruvate Dehydrogenase Contributes to Drug Resistance of Lung Cancer Cells Through Epithelial Mesenchymal Transition. Front. Cell Dev. Biol. 2022, 9, 3745. [Google Scholar] [CrossRef] [PubMed]
- Liu, L.; Cao, J.; Zhao, J.; Li, X.; Suo, Z.; Li, H. PDHA1 Gene Knockout In Human Esophageal Squamous Cancer Cells Resulted In Greater Warburg Effect And Aggressive Features In Vitro And In Vivo. OncoTargets Ther. 2019, 12, 9899–9913. [Google Scholar] [CrossRef] [Green Version]
- Lin, S.-R.; Wen, Y.-C.; Yeh, H.-L.; Jiang, K.-C.; Chen, W.-H.; Mokgautsi, N.; Huang, J.; Chen, W.-Y.; Liu, Y.-N. EGFR-Upregulated LIFR Promotes SUCLG2-Dependent Castration Resistance and Neuroendocrine Differentiation of Prostate Cancer. Oncogene 2020, 39, 6757–6775. [Google Scholar] [CrossRef] [PubMed]
- Yang, W.; Zhou, J.; Zhang, K.; Li, L.; Xu, Y.; Ma, K.; Xie, H.; Cai, L.; Gong, Y.; Gong, K. Identification and Validation of the Clinical Roles of the VHL-Related LncRNAs in Clear Cell Renal Cell Carcinoma. J. Cancer 2021, 12, 2702–2714. [Google Scholar] [CrossRef] [PubMed]
- Xing, C.; Cai, Z.; Gong, J.; Zhou, J.; Xu, J.; Guo, F. Identification of Potential Biomarkers Involved in Gastric Cancer Through Integrated Analysis of Non-Coding RNA Associated Competing Endogenous RNAs Network. Clin. Lab. 2018, 64, 1661–1669. [Google Scholar] [CrossRef] [PubMed]
- Wu, J.; Cai, Y.; Zhao, G.; Li, M. A Ten N6-Methyladenosine-Related Long Non-Coding RNAs Signature Predicts Prognosis of Triple-Negative Breast Cancer. J. Clin. Lab. Anal. 2021, 35, e23779. [Google Scholar] [CrossRef]
- Lee, I.-N.; Yang, J.-T.; Huang, C.; Huang, H.-C.; Wu, Y.-P.; Chen, J.-C. Elevated XRCC5 Expression Level Can Promote Temozolomide Resistance and Predict Poor Prognosis in Glioblastoma. Oncol. Lett. 2021, 21, 443. [Google Scholar] [CrossRef] [PubMed]
- Piskareva, O.; Harvey, H.; Nolan, J.; Conlon, R.; Alcock, L.; Buckley, P.; Dowling, P.; Henry, M.; O’Sullivan, F.; Bray, I.; et al. The Development of Cisplatin Resistance in Neuroblastoma Is Accompanied by Epithelial to Mesenchymal Transition in Vitro. Cancer Lett. 2015, 364, 142–155. [Google Scholar] [CrossRef] [PubMed] [Green Version]
- Bau, D.-T.; Tsai, C.-W.; Wu, C.-N. Role of the XRCC5/XRCC6 Dimer in Carcinogenesis and Pharmacogenomics. Pharmacogenomics 2011, 12, 515–534. [Google Scholar] [CrossRef] [PubMed]
- Perez-Riverol, Y.; Bai, J.; Bandla, C.; García-Seisdedos, D.; Hewapathirana, S.; Kamatchinathan, S.; Kundu, D.J.; Prakash, A.; Frericks-Zipper, A.; Eisenacher, M.; et al. The PRIDE database resources in 2022: A hub for mass spectrometry-based proteomics evidences. Nucleic Acids Res. 2021, 50, D543–D552. [Google Scholar] [CrossRef] [PubMed]


| Term ID | Term Description | Observed Gene Count | Background Gene Count | False Discovery Rate |
|---|---|---|---|---|
| Enriched Biological Processes | ||||
| GO:0017144 | drug metabolic process | 112 | 622 | 8.45 × 10⁻¹⁸ |
| GO:0042493 | response to drug | 100 | 900 | 1.17 × 10⁻⁵ |
| GO:2001038 | regulation of cellular response to drug | 9 | 28 | 0.0035 |
| GO:2001024 | negative regulation of response to drug | 8 | 29 | 0.0144 |
| GO:0035690 | cellular response to drug | 33 | 310 | 0.0455 |
| Enriched Molecular Functions | ||||
| GO:0008144 | drug binding | 226 | 1710 | 7.03 × 10⁻²¹ |
| Accession | Description | Anova (p) | A2B | A | A5F | A10 |
|---|---|---|---|---|---|---|
| Differentially expressed proteins in drug related biological processes | ||||||
| P09601 | HMOX1 | 0.000186 | −3.2 | −7.9 | −34.5 | −56.1 |
| P34913 | EPHX2 | 0.000329 | 1.2 | 2.5 | 3.9 | 7.4 |
| Q02818 | NUCB1 | 4.23 × 10⁻⁵ | −1.2 | −1.9 | −2.0 | −2.8 |
| P22695 | UQCRC2 | 6.41 × 10⁻⁵ | 2.0 | 2.3 | 2.5 | 2.8 |
| P36957 | DLST | 8.11 × 10⁻⁶ | 1.6 | 1.8 | 1.9 | 2.3 |
| Q96I99 | SUCLG2 | 9.31 × 10⁻⁵ | 1.3 | 1.5 | 1.5 | 1.9 |
| P08559 | PDHA1 | 0.001339 | 1.3 | 1.5 | 1.6 | 1.7 |
| P13073 | COX4I1 | 0.000831 | −1.2 | −1.5 | −1.5 | −1.6 |
| P13010 | XRCC5 | 0.000174 | 1.0 | 1.3 | 1.4 | 1.5 |
| Differentially expressed proteins in drug related molecular functions | ||||||
| P34932 | HSPA4 | 0.000191948 | 1.3 | 1.5 | 1.6 | 1.9 |
| Q9P2J5 | LARS1 | 0.000250465 | 1.1 | 1.3 | 1.7 | 1.9 |
| O95757 | HSPA4L | 3.60 × 10⁻⁵ | 1.2 | 1.4 | 1.5 | 1.8 |
| Q08211 | DHX9 | 2.72 × 10⁻⁵ | 1.2 | 1.3 | 1.4 | 1.6 |
| P50991 | CCT4 | 0.000158646 | 1.0 | 1.3 | 1.4 | 1.6 |
| P11216 | PYGB | 0.004613192 | 1.1 | 1.2 | 1.3 | 1.7 |
| Q9UHJ6 | SHPK | 3.91 × 10⁻⁶ | 2.0 | 6.1 | 6.9 | 10.2 |
| Q16658 | FSCN1 | 7.52 × 10⁻⁷ | −1.5 | −1.5 | −3.2 | −4.7 |
| Biological/Molecular Assignment | Gene Name | DLKP vs. Resistant Max. Fold Change * | SK-MES-1 vs. Resistant Max. Fold Change | COR-23 vs. Resistant Max. Fold Change |
|---|---|---|---|---|
| Drug transport | ABCB1 | +(49.8-fold) | +(13.5-fold) | - |
| ABCC1 | +(18.8-fold) | - | +(15.1-fold) | |
| Lipid metabolism | ABCD1 | −(131.1-fold) | - | - |
| ABCD3 | +(2.0-fold) | +(4.1-fold) | - | |
| ALDH1B1 | +(2.6-fold) | - | - | |
| ALDH3A2 | +(2.6-fold) | +(4.9-fold) | - | |
| GCDH | +(4.4-fold) | - | - | |
| FASN | +(1.6-fold) | - | - | |
| ACACA | +(2-fold) | +(2.7-fold) | −(2.1-fold) | |
| CROT | +(52.8-fold) | - | - | |
| Membrane proteins | LIMA1 | +(10.7-fold) | - | −(1.5-fold) |
| SRI | +(3.1-fold) | +(4.8-fold) | +(1.6-fold) | |
| ANXA1 | +(5.1-fold) | - | +(4.6-fold) | |
| CAST | +(3.1-fold) | +(2.1-fold) | - | |
| DIAPH1 | +(3.0-fold) | −(1.2-fold) | −(3.3-fold) | |
| CLIP1 | +(3.1-fold) | +(5.2-fold) | +(1.9-fold) | |
| TMUB1 | −(6.3-fold) | - | - | |
| NEU1 | −(5.8-fold) | +(2.8-fold) | - | |
| FSCN1 | −(4.7-fold) | - | −(1.3-fold) | |
| Gene Ontology-drug metabolism related DE proteins | HMOX1 | −(56.1-fold) | - | - |
| EPHX2 | +(7.3-fold) | - | - | |
| NUCB1 | −(2.8-fold) | - | −(1.3-fold) | |
| UQCRC2 | +(2.8-fold) | +(1.2-fold) | - | |
| DLST | +(2.3-fold) | - | −(1.5-fold) | |
| SUCLG2 | +(1.9-fold) | - | - | |
| PDHA1 | +(1.7-fold) | +(2.2-fold) | - | |
| COX4I1 | −(1.6-fold) | - | +(1.3-fold) | |
| XRCC5 | +(1.5-fold) | - | - | |
| HSPA4 | +(1.9-fold) | - | - | |
| LARS1 | +(1.8-fold) | - | +(1.6-fold) | |
| HSPA4L | +(1.8-fold) | −(2.1-fold) | - | |
| DHX9 | +(1.6-fold) | - | +(1.5-fold) | |
| CCT4 | +(1.6-fold) | - | +(1.6-fold) | |
| PYGB | +(1.7-fold) | - | +(1.6-fold) | |
| SHPK | +(10.3-fold) | - | −(2.1-fold) |
Publisher’s Note: MDPI stays neutral with regard to jurisdictional claims in published maps and institutional affiliations. |
© 2022 by the authors. Licensee MDPI, Basel, Switzerland. This article is an open access article distributed under the terms and conditions of the Creative Commons Attribution (CC BY) license (https://creativecommons.org/licenses/by/4.0/).
Share and Cite
Efeoglu, E.; Henry, M.; Clynes, M.; Meleady, P. Label-Free Quantitative Proteomics Analysis of Adriamycin Selected Multidrug Resistant Human Lung Cancer Cells. Biomolecules 2022, 12, 1401. https://doi.org/10.3390/biom12101401
Efeoglu E, Henry M, Clynes M, Meleady P. Label-Free Quantitative Proteomics Analysis of Adriamycin Selected Multidrug Resistant Human Lung Cancer Cells. Biomolecules. 2022; 12(10):1401. https://doi.org/10.3390/biom12101401
Chicago/Turabian StyleEfeoglu, Esen, Michael Henry, Martin Clynes, and Paula Meleady. 2022. "Label-Free Quantitative Proteomics Analysis of Adriamycin Selected Multidrug Resistant Human Lung Cancer Cells" Biomolecules 12, no. 10: 1401. https://doi.org/10.3390/biom12101401