Article

A Distinctive γδ T Cell Repertoire in NOD Mice Weakens Immune Regulation and Favors Diabetic Disease

1
Department of Immunology and Genomic Medicine, National Jewish Health, Denver, CO 80206, USA
2
Mouse Genetics Core, National Jewish Health, Denver, CO 80206, USA
3
National Jewish Health, Denver, CO 80206, USA
4
Department of Immunology and Microbiology, University of Colorado Anschutz, Aurora, CO 80045, USA
5
Autoimmunity and Inflammation Program, Hospital for Special Surgery, New York, NY 10021, USA
*
Author to whom correspondence should be addressed.
Biomolecules 2022, 12(10), 1406; https://doi.org/10.3390/biom12101406
Submission received: 26 August 2022 / Revised: 24 September 2022 / Accepted: 27 September 2022 / Published: 1 October 2022

Abstract

:
Previous studies in mice and humans suggesting that γδ T cells play a role in the development of type 1 diabetes have been inconsistent and contradictory. We attempted to resolve this for the type 1 diabetes-prone NOD mice by characterizing their γδ T cell populations, and by investigating the functional contributions of particular γδ T cells subsets, using Vγ-gene targeted NOD mice. We found evidence that NOD Vγ4+ γδ T cells inhibit the development of diabetes, and that the process by which they do so involves IL-17 production and/or promotion of regulatory CD4+ αβ T cells (Tregs) in the pancreatic lymph nodes. In contrast, the NOD Vγ1+ cells promote diabetes development. Enhanced Vγ1+ cell numbers in NOD mice, in particular those biased to produce IFNγ, appear to favor diabetic disease. Within NOD mice deficient in particular γδ T cell subsets, we noted that changes in the abundance of non-targeted T cell types also occurred, which varied depending upon the γδ T cells that were missing. Our results indicate that while certain γδ T cell subsets inhibit the development of spontaneous type 1 diabetes, others exacerbate it, and they may do so via mechanisms that include altering the levels of other T cells.

1. Introduction

The NOD mouse strain develops type 1 autoimmune diabetes with many similarities to the human disease, and has been instrumental in investigating genetic and immunologic contributors to the disease, common autoantigens, and therapeutic interventions [1,2,3]. However, in humans, type 1 diabetes usually arises in juveniles and is more prevalent in males than in females, whereas diabetes in NOD mice usually begins to develop during adult life, and the incidence in females is approximately double that of males. In many Specific Pathogen Free (SPF) colonies (including our own), ~75% of female NOD mice develop diabetes by 30 weeks of age, as opposed to only ~40% of male NOD mice.
The question of whether γδ T cells may be involved in the development of diabetes in NOD mice has been raised repeatedly, but studies addressing it often did not agree. Although three early publications implicated γδ T cells as protectors against this disease [4,5,6], a later study instead indicated that γδ T cells promote the development of NOD diabetes [7]. We reasoned that this contradiction might be explained if in reality different γδ T cell subsets play distinct and dissimilar roles. Indeed, in other diseases, previous studies have shown functional differences between γδ T cell subsets, that often correlated with the expression of particular Vγ genes [8,9,10,11,12].
The γδ T cells of NOD mice, due to a thymic defect which decreases αβ T cell development but enhances that of γδ T cells, have been reported to be hyperproliferative and over-represented among T cells [13]. To investigate whether γδ T cells are connected with the unique propensity of the NOD strain to develop diabetes, we characterized γδ T cell populations in several tissues of the NOD mouse and compared them to those of C57BL/6 mice. In lymphoid tissues, we found several differences in NOD mice, including a greater abundance of Vγ1+ cells relative to Vγ4+ cells, a shift towards more IFNγ producing cells especially within the Vγ1+ population in the spleen, and a deficiency of IL-17-biased cells within the Vγ4+ population, particularly in the skin-draining lymph nodes. (Note: the Tonegawa nomenclature for the mouse Vγ genes is used throughout this paper [14]). In addition, a higher frequency of CD8α+ Vγ7+ cells was present among the intraepithelial lymphocytes (IELs) of the large intestine of NOD mice compared to those of B6 mice. We went on to determine the rates of spontaneous diabetes in gene-targeted NOD-background mice able to produce only γδ T cells of certain types or none at all, as compared to wildtype (wt) NOD controls. Whereas the diabetes incidence was reduced in NOD mice of both sexes lacking Vγ1+ γδ T cells, it was accelerated in female NOD mice lacking Vγ4+ cells. The finding that Vγ1+ and Vγ4+ γδ T cells can have different and opposing effects on the pathogenesis of NOD diabetes is consistent with similar observations in other mouse models of disease [8,9,10,15,16,17], and it could explain discrepancies in earlier reports regarding the role of γδ T cells in NOD diabetes [4,5,6,7]. We also explored the more immediate consequences of altering γδ T cells in NOD mice by inactivating TCR-δ or particular Vγ genes, and found other non-targeted T cell types that were also affected, along with evidence that crosstalk occurs between γδ T cell subsets which regulates their levels. Overall, our results indicate that Vγ1+ γδ T cells promote the development of NOD diabetes, whereas the Vγ4+ cells protect against it, and suggest that the mechanisms involved may include subset-specific induced alterations in the levels of other T cells.

2. Materials and Methods (Also See Supplemental Detailed Materials and Methods)

2.1. Mouse Strains

Wildtype (wt) NOD/ShiLtJ (NOD) mice were purchased from Jackson Laboratories (Bar Harbor, ME, USA) and maintained in our colony. NOD.TCRδ-/- mice lacking all γδ T cells (NOD.129-T129P2-Tcrdtm1Mom) were generated by backcrossing B6.TCRδ-/- mice (B6.129P2-Tcrdtm1Mom/J mice, Jackson Laboratories, Bar Harbor, ME, USA) [18,19] onto the NOD background. The NOD.Vγ1-/- strain, lacking all Vγ1+ cells (NOD.129-TcrVg1tm1Car), was similarly generated from B6.Vγ1-/- mice [20], as was the NOD.Vγ4/6-/- strain, lacking both Vγ4+ and Vγ6+ cells (NOD.129-TcrVg4Vg6tm1Iku), from B6.Vγ4/6-/- mice [21]. Offspring carrying the mutant allele were identified via Southern blot analysis, and homozygous strains established after at least 10 backcrosses. For NOD.Vγ4-/- mice (NOD.129-TcrVg4tm1Mat), CRISPR/Cas9 technology was used directly in fertilized NOD oocytes to delete the entire Vγ4 gene, by the Regional Mouse Genetics Core at National Jewish Health, so that no backcrossing was needed. All mutant NOD strains, once established, were housed in the same room in the National Jewish Biological Resource Center with unmodified NOD mice and maintained under SPF conditions. All mice were cared for following guidelines for normal and immune-deficient animals, and experiments conducted as outlined under National Jewish Health Institutional Animal Care and Use Committee approved protocol AS2504 to R.L.O.

2.2. Genetic Screening of Mutant Mouse Strains

After establishing backcrossed strains, genetic testing for single nucleotide polymorphisms (SNPs) known to differ between 129 strain mice and NOD mice (Jackson Laboratory, Bar Harbor, ME) showed that for NOD.TCRδ-/- mice, 98.5% of the SNPs were NOD-derived; only 2 SNPs within the Cδ locus were retained that were 129-derived. For the NOD.Vγ1-/-mice, 97.73% of the SNPs tested were NOD-derived; only 3 SNPs within the TCRγ locus were 129-derived. For the NOD.Vγ4/6-/- mice, 99.24% of the SNPs tested were NOD-derived; only 1 SNP within the TCRγ locus was 129-derived.

2.3. Diabetes Monitoring

After reaching 12 weeks of age, mice were tested weekly for blood glucose levels, using glucose test strips and a glucose meter (Clarity Diagnostics, VWR, Radnor, PA, USA) to assay a drop of blood from the tail vein. A glucose level of 250 mg/dL (14 mM) or higher twice consecutively within one week was considered diagnostic of diabetes. Mice were euthanized within 2 weeks of first testing positive for diabetes, or sooner if obviously ill, or after reaching 30 weeks of age if they failed to develop diabetes previously. To examine mice with recent-onset diabetes, mice were euthanized within 1 week of first testing positive for diabetes and used as tissue sources for experiments.

2.4. Cell Preparation

Freshly isolated unfractionated spleen and lymph node cells from individual mice were prepared as previously described [22]. The cells from 2 pancreatic lymph nodes, and from 4 skin-draining lymph nodes (2 inguinal and 2 axillary), were pooled for individual mice. Intestinal intraepithelial lymphocytes (IEL) were prepared from the colon of each mouse, based on a previously published protocol [23].

2.5. Flow Cytometry

Cell surface staining on freshly prepared unfractionated lymphocytes was carried out as previously described [22]. For intracellular cytokine staining, lymphocytes were first nonspecifically activated by culturing them in medium containing Brefeldin A (10 μg/mL), PMA (75 ng/mL) and ionomycin (1.6 μg/mL), for 4–5 h at 37 °C in air containing ~10% CO2. For transcription factor analysis, nuclear staining was carried out using freshly isolated unstimulated cells with eBioscience Permeabilization and Fixation/Permeabilization buffers as recommended by the manufacturer (ThermoFisher Scientific, Waltham, MA, USA). Samples were analyzed on an LSRII flow cytometer (Becton Dickinson Biosciences, Franklin Lakes, NJ, USA) and the FCS files processed using FlowJo 9.9 software (Becton Dickinson Biosciences, Franklin Lakes, NJ, USA).

2.6. Statistics

To determine diabetes incidence in each strain, a total of 38-46 mice per group were tested weekly for diabetes from 13 to 30 weeks of age. Survival curves were generated showing the percent that had developed type 1 diabetes by each time point, and were analyzed using GraphPad Prism 6 software (Dotmatics, Boston, MA, USA); significant differences were determined by the Log-rank (Mantel-Cox) test. For bar graphs, results from 3–14 mice per group were compared unless otherwise noted in the figure legends, and significant differences determined using the Student t-test. Significant differences are denoted in the figures as: * p < 0.05, ** p < 0.01, *** p < 0.001, and **** p < 0.0001.

3. Results

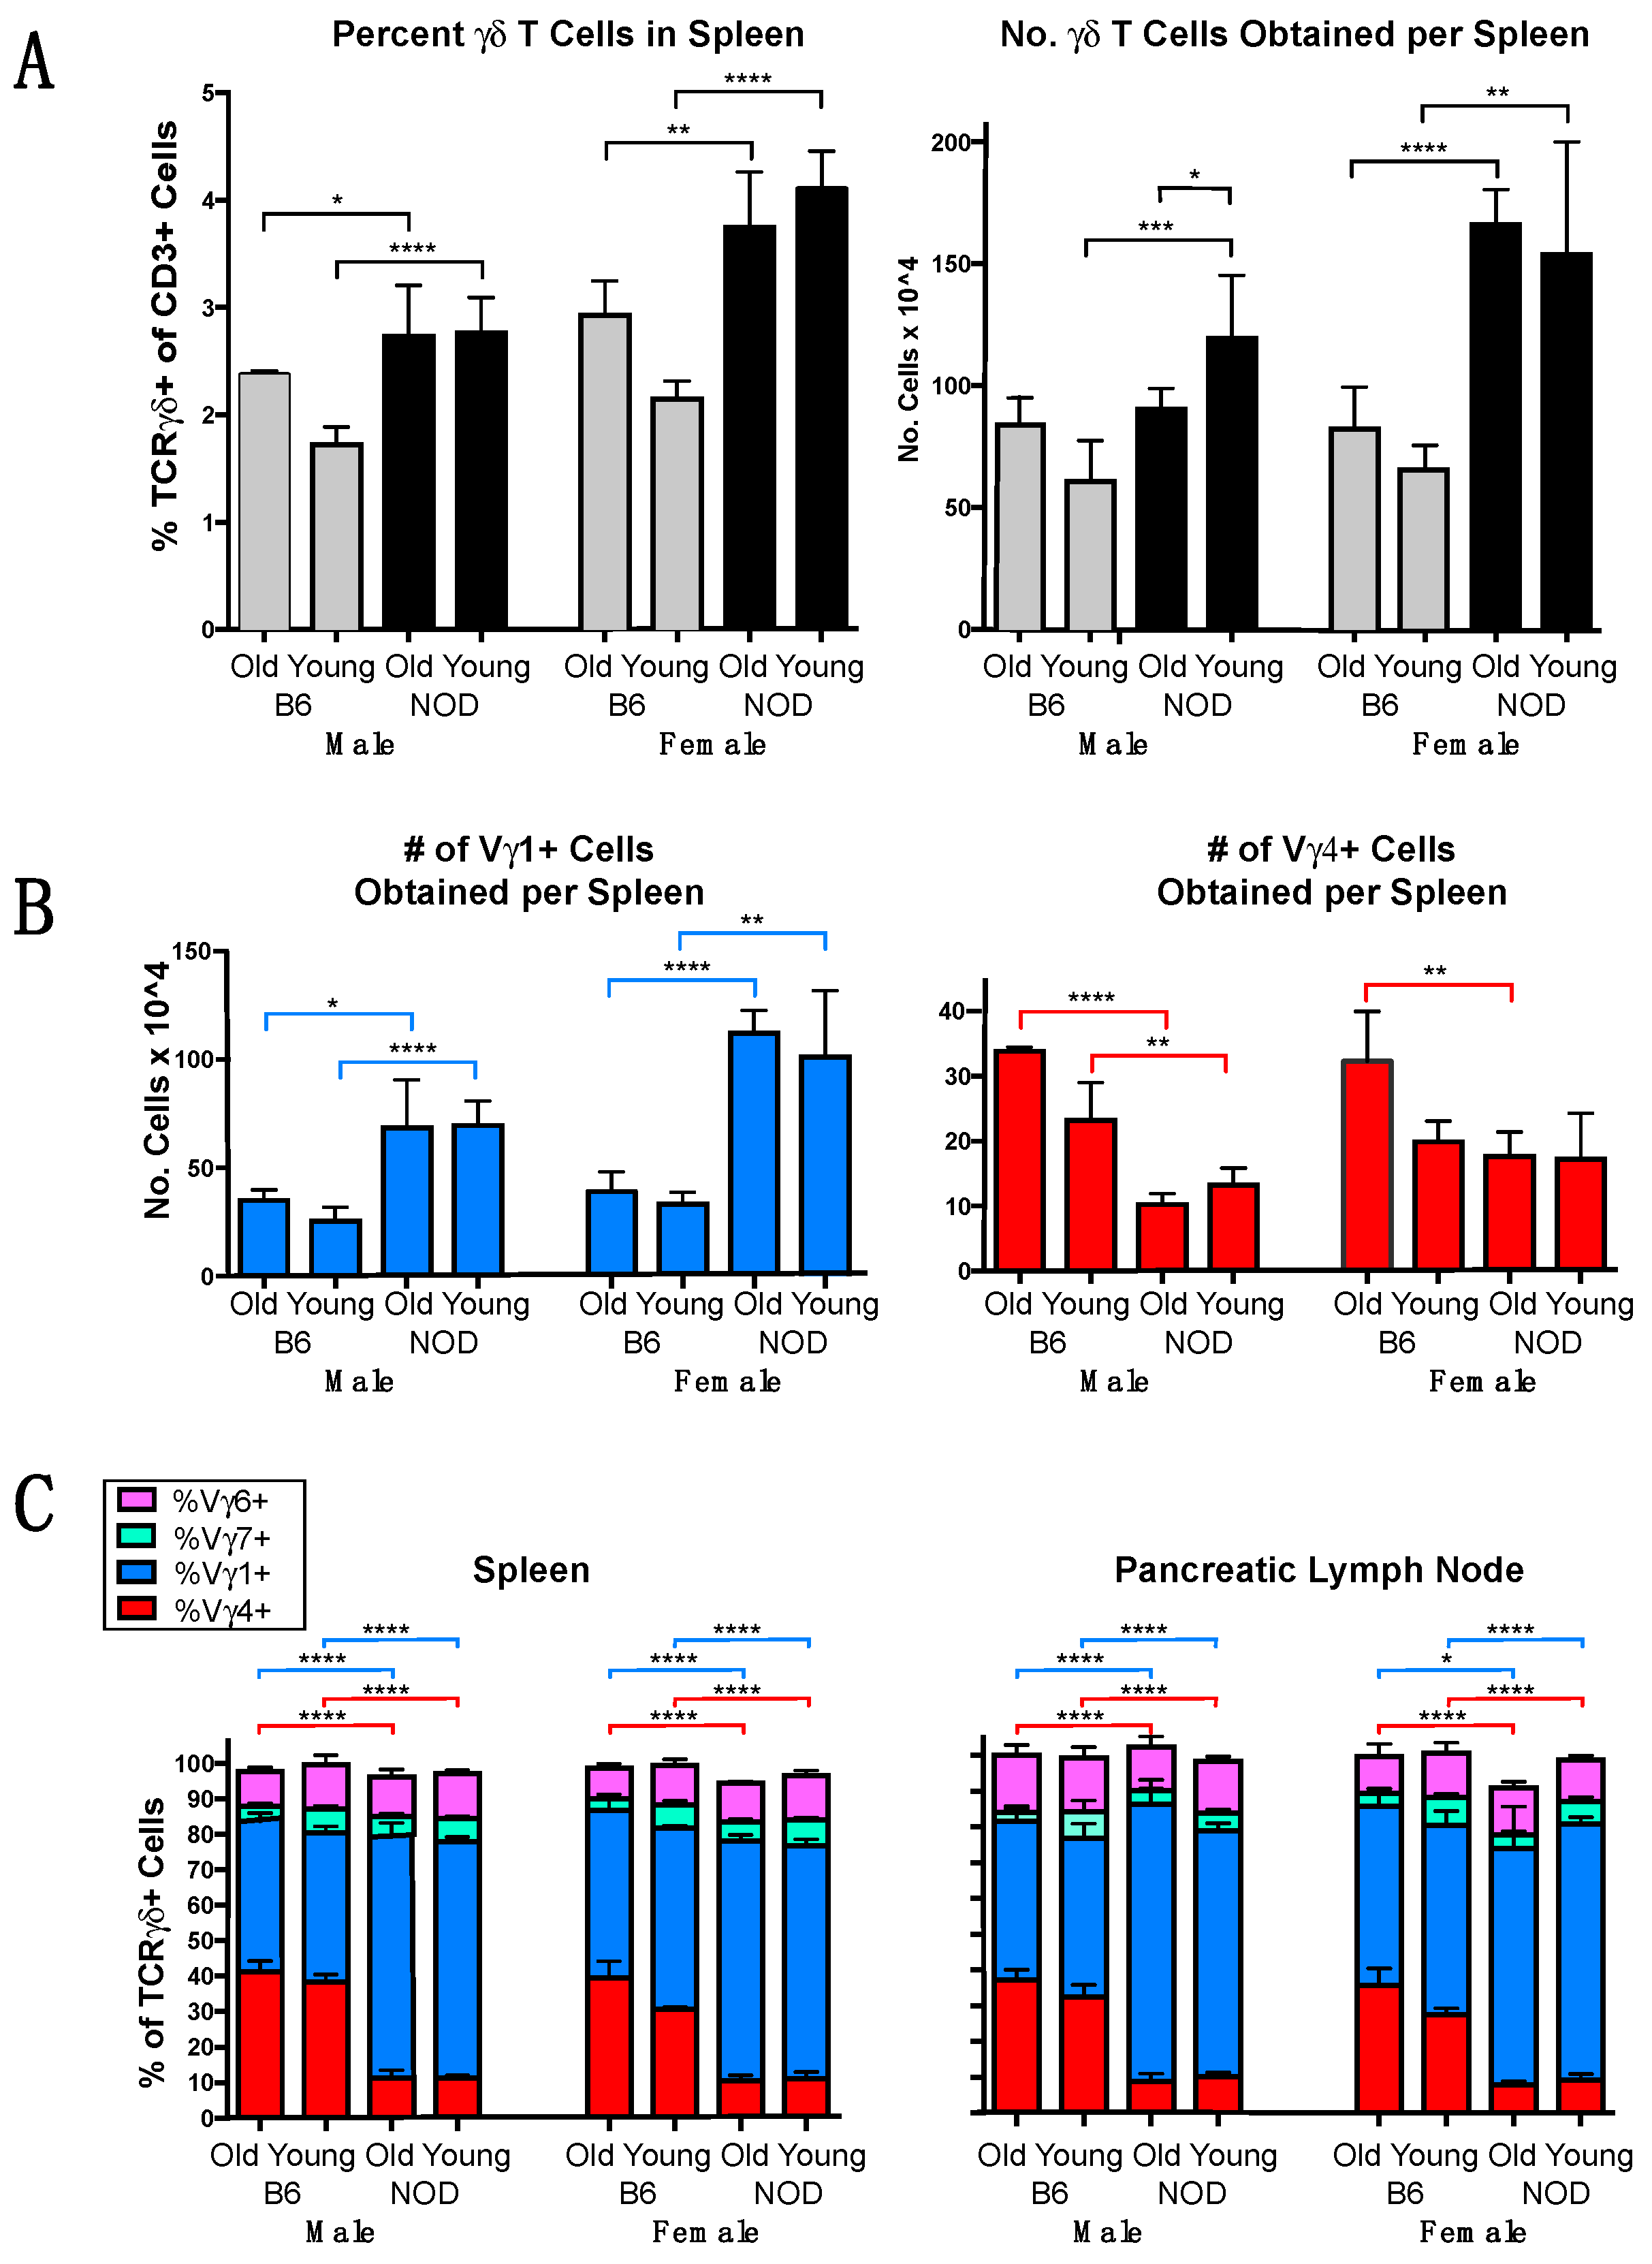
3.1. The γδ TCR Repertoire of NOD Mice Is Biased in Favor of Vγ1+ Cells

The γδ T cells were previously shown to be comparatively abundant in NOD mice, although their levels dropped after they developed diabetes [6]. We characterized the γδ T cells present in NOD mice and compared them with those of C57BL/6 mice, the strain in which γδ T cells have been most frequently studied. Because female mice often carry greater numbers of lymphocytes than males, and levels of some lymphocytes (e.g., CD4+ Tregs and memory CD8 cells) have been shown to vary with age, we compared sex-matched mice within 2 age groups, young (7–10 weeks of age) and old (12–34 weeks of age). In the spleen, γδ T cells were more common in NOD mice than in B6 mice for all groups (Figure 1A left), and the differences were highly significant among younger mice of both sexes. NOD mice also had higher total numbers of splenic γδ T cells (Figure 1A right) in all groups except for older males. In addition, greater numbers of Vγ1+ cells were recovered from the spleens of NOD mice for both sexes and age groups, with 2–3 times as many in NOD spleens than those of matched B6 controls (Figure 1B, left). Conversely, the numbers of Vγ4+ cells obtained from spleens were lower in NOD mice for all groups except for young females (Figure 1B, right). We also examined the Vγ repertoire in the spleen and pancreatic lymph nodes (Figure 1C), using monoclonal antibodies specific for Vγ1 [24], both Vγ1 and 2 [25], Vγ4 [26], Vγ5 [27], and Vγ7 [28]. An antibody specific for mouse Vγ6 was recently reported [29], but was not available for this work, so Vγ6+ cells were instead approximated as the calculated percent of CD3+ cells that stained γδ TCR+ but negative for all of the other 5 Vγs - specifically for Vγ1 and 2, Vγ4, Vγ5, and Vγ7 (Note: the Vγ3 gene is missing or essentially nonfunctional in all mouse strains so far examined [25,30]). This revealed a major difference between the two strains in the percentage of γδ T cells expressing Vγ4. Whereas B6 mice of both sexes and age-groups had substantial Vγ4+ subsets comprising 30-40% of the γδ T cells in both spleen and pancreatic lymph node, in NOD mice, the Vγ4+ fraction comprised only 10-15% (Figure 1C), and the vast majority were instead Vγ1+ (70-80%, Figure 1C). The differences were highly significant within all sex- and age-matched groups for both tissues. Vγ7+ cells and Vγ6+ cells were minor subsets of comparable prominence in the spleens and pancreatic lymph nodes of all groups, ranging from ~3–7% for Vγ7+ cells and ~9–12% Vγ6+ cells (Figure 1C), whereas Vγ+ cells, a subset that normally resides almost exclusively in the epidermis [31,32], were as expected absent or barely detected (not shown). γδ T cells expressing Vγ2 also appear to be very rare or absent in these tissues, because the percentage that stained with an antibody specific for both Vγ1 and the closely related Vγ2 gene product (clone 4B2.9 [25]) differed by an average of less than 3% from the percentage detected with a Vγ1-specific antibody (clone 2.11 [24]), which did not rise above the experimental variance of the samples (data not shown). Overall, the data showed a clear bias in the NOD γδ TCR repertoire towards Vγ1+ and against Vγ4+ cells, which in contrast constitute nearly equally predominant subsets in the spleen and pancreatic lymph nodes of B6 mice, whereas no major differences were seen for the other γδ T cells subsets.

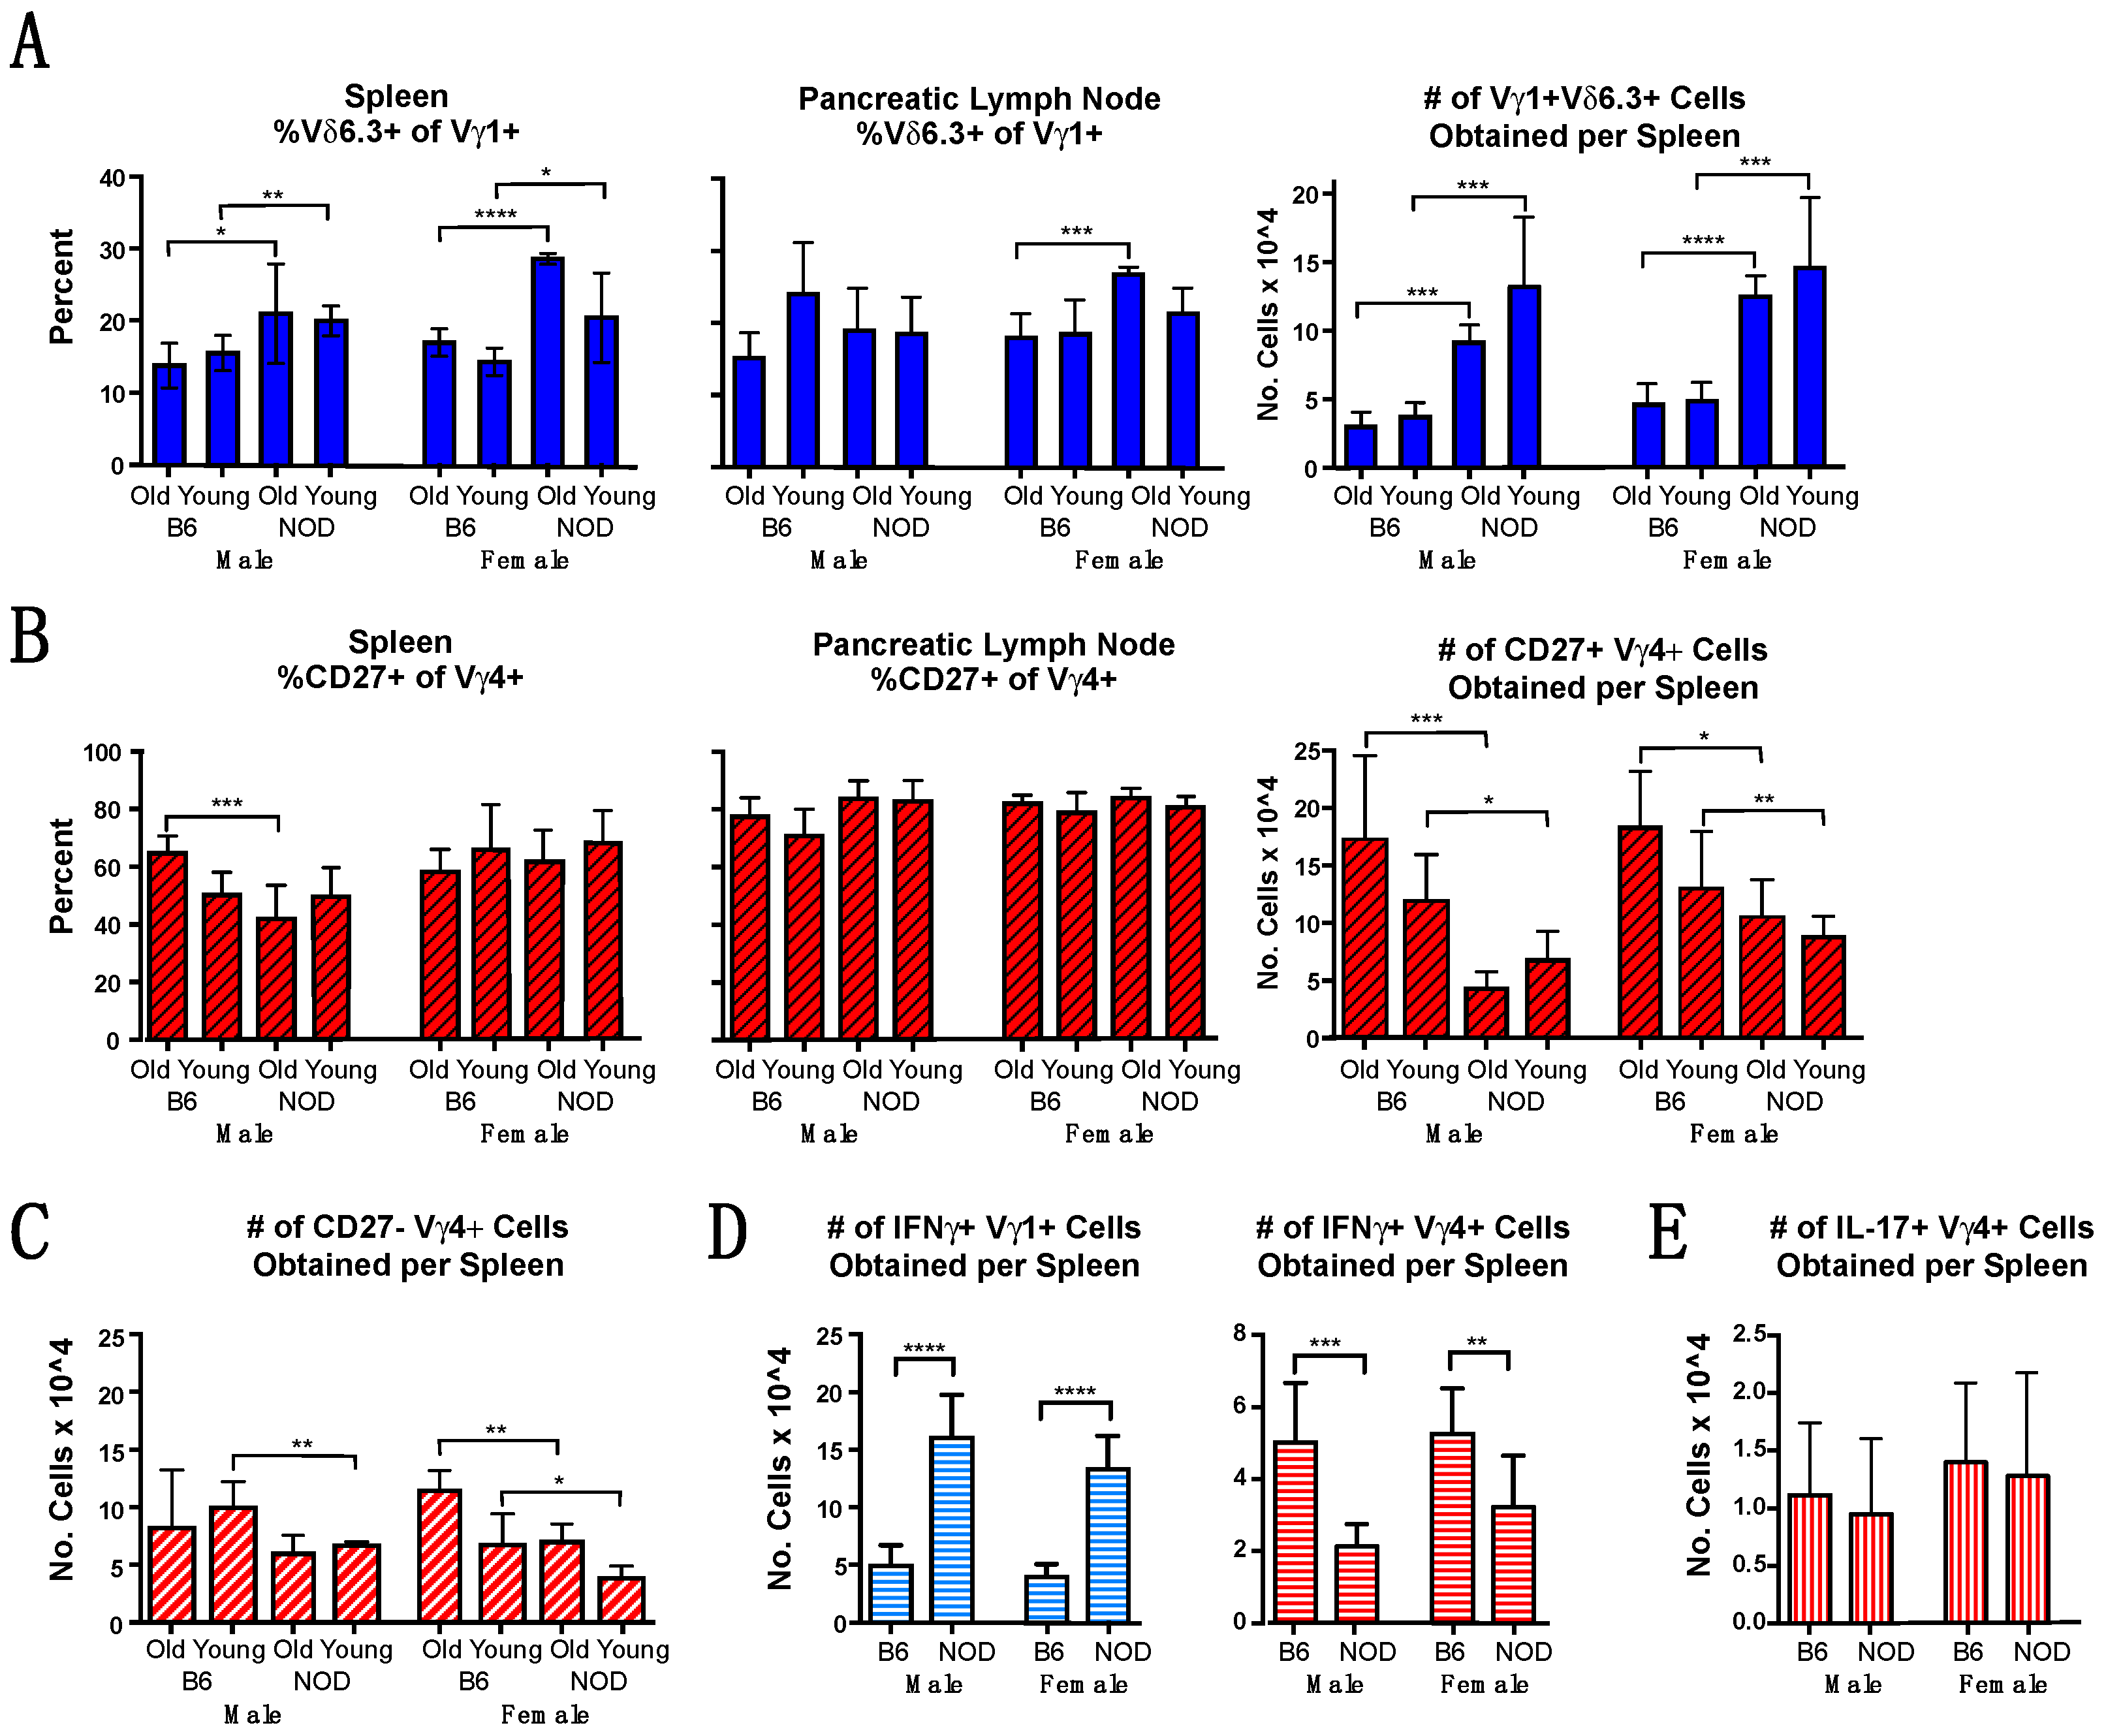
3.2. Vγ1+ and Vγ4+ γδ T Cell Subsets in NOD Mice Differ from Those in B6 Mice in Cellular Composition and Functional Bias

Within the Vγ1+ subset, a functionally distinct subpopulation has been previously described. Unlike the other Vγ1+ cells, which co-express any of a variety of Vδs and when activated are biased to produce IFNγ, those within this subpopulation usually co-express Vδ6.3 with a particular reading frame of Dδ2, and evince NKT cell-like properties, which include expression of the transcription factor PLZF, and a bias when activated to produce IL-4 instead of or as well as IFNγ [33,34,35]. Within the Vγ4+ subset, on the other hand, an IL-17 biased subpopulation has been described that tends to express high levels of CD44, is often CCR6+, but is negative for the TNFR superfamily member CD27 [16,36,37,38,39,40,41]. The expression of certain Vδ genes along with Vγ4 has also been associated with a bias to produce IL-17 [16,41,42]. In contrast, Vγ4+ cells that produce IFNγ when nonspecifically stimulated are generally positive for CD27 expression [43].
To compare functional potential, we went on to examine these subpopulations within the Vγ1+ and Vγ4+ subsets. We estimated the prevalence of the NKT-like Vγ1+ subpopulation by testing for Vδ6.3 co-expression among Vγ1+ cells in NOD vs. B6 mice. In the spleen, a higher percentage of Vγ1+ cells co-expressing Vδ6.3 was evident in all groups of NOD mice (Figure 2A left), whereas in pancreatic lymph nodes, only the older NOD females were higher. Importantly, the greater frequency in NOD mice of Vγ1Vδ6.3+ cells combined with the higher percentage of γδ T cells and of Vγ1+ cells in particular resulted in much higher absolute numbers of Vγ1Vδ6.3+ cells in NOD vs. B6 spleens for all groups (Figure 2A right). We also examined the proportion of Vγ4+ cells likely to be IFNγ-biased by looking at the percentage that co-expressed CD27, and found that roughly half of the Vγ4+ cells were CD27+ in all groups (Figure 2B left). These cells were somewhat rarer in the spleens of older NOD males, but there was no evident difference among females. In the pancreatic lymph nodes, no differences between groups were seen and the CD27+ fraction of Vγ4+ cells was uniformly higher, averaging at about 80% in all groups (Figure 2B center). However, because NOD mice had fewer numbers of total Vγ4+ spleen cells, all groups of NOD mice had smaller absolute numbers of CD27+ presumably IFNγ-biased Vγ4+ spleen cells than their B6 counterparts (Figure 2B right). The older NOD males and both groups of NOD females also had slightly fewer CD27- and presumably IL-17-biased Vγ4+ cells (Figure 2C).
We also directly tested whether the cytokine biases of Vγ1+ and Vγ4+ γδ T cells in NOD mice differ from those of B6 mice, using intracellular cytokine staining to compare the absolute numbers of spleen cells within the Vγ1+ and Vγ4+ subsets that produced IFNγ or IL-17 when nonspecifically stimulated. Though considerable variation in the percentages among individual animals was found, this did not depend upon the age of the mouse (data not shown), so for this analysis, young and old mice were analyzed together in a single group. Greater numbers of IFNγ-biased Vγ1+ cells were obtained for both male and female NOD mice, exceeding those obtained from matched B6 controls by 3–4-fold (Figure 2D, left panel). Although IFNγ-biased Vγ4+ cells were in contrast somewhat less numerous in NOD spleens (Figure 2, right panel), because of their low total Vγ4+ cell numbers, the overall numbers of IFNγ-biased γδ T cells obtained from NOD mice still substantially exceed those from B6 mice. No differences were evident in the numbers of IL-17-biased Vγ4+ spleen cells were obtained (Figure 2E), consistent with our staining results for numbers of Vγ4+ CD27- cells, which predicted only minor differences (see Figure 2C).
We also compared the Vγ1+ and Vγ4+ cells in NOD vs. B6 mice for their bias to produce IL-2, and found that NOD mice had a lower average frequency of IL-2-biased cells in both subsets, compared to B6 controls (Figure S1, triangles). A lower frequency of IFNγ-producing Vγ4+ cells was also evident in both male and female NOD mice. The two strains had similar average frequencies for Vγ1+ cells producing IFNγ and for Vγ4+ cells producing IL-17, whereas Vγ1+ cells that produced IL-17 were virtually absent in both strains (Figure S1). Thus, overall, when compared with B6 mice, NOD mice exhibited distinct cytokine biases in their splenic Vγ1+ and Vγ4+ γδ T cells, and carried more IFNγ+ Vγ1+ cells, fewer IL-2+ cells of either subset, and fewer IFNγ biased Vγ4+ cells than B6 mice. However, both strains carried comparable numbers and proportions of IL-17-biased Vγ4+ spleen cells.

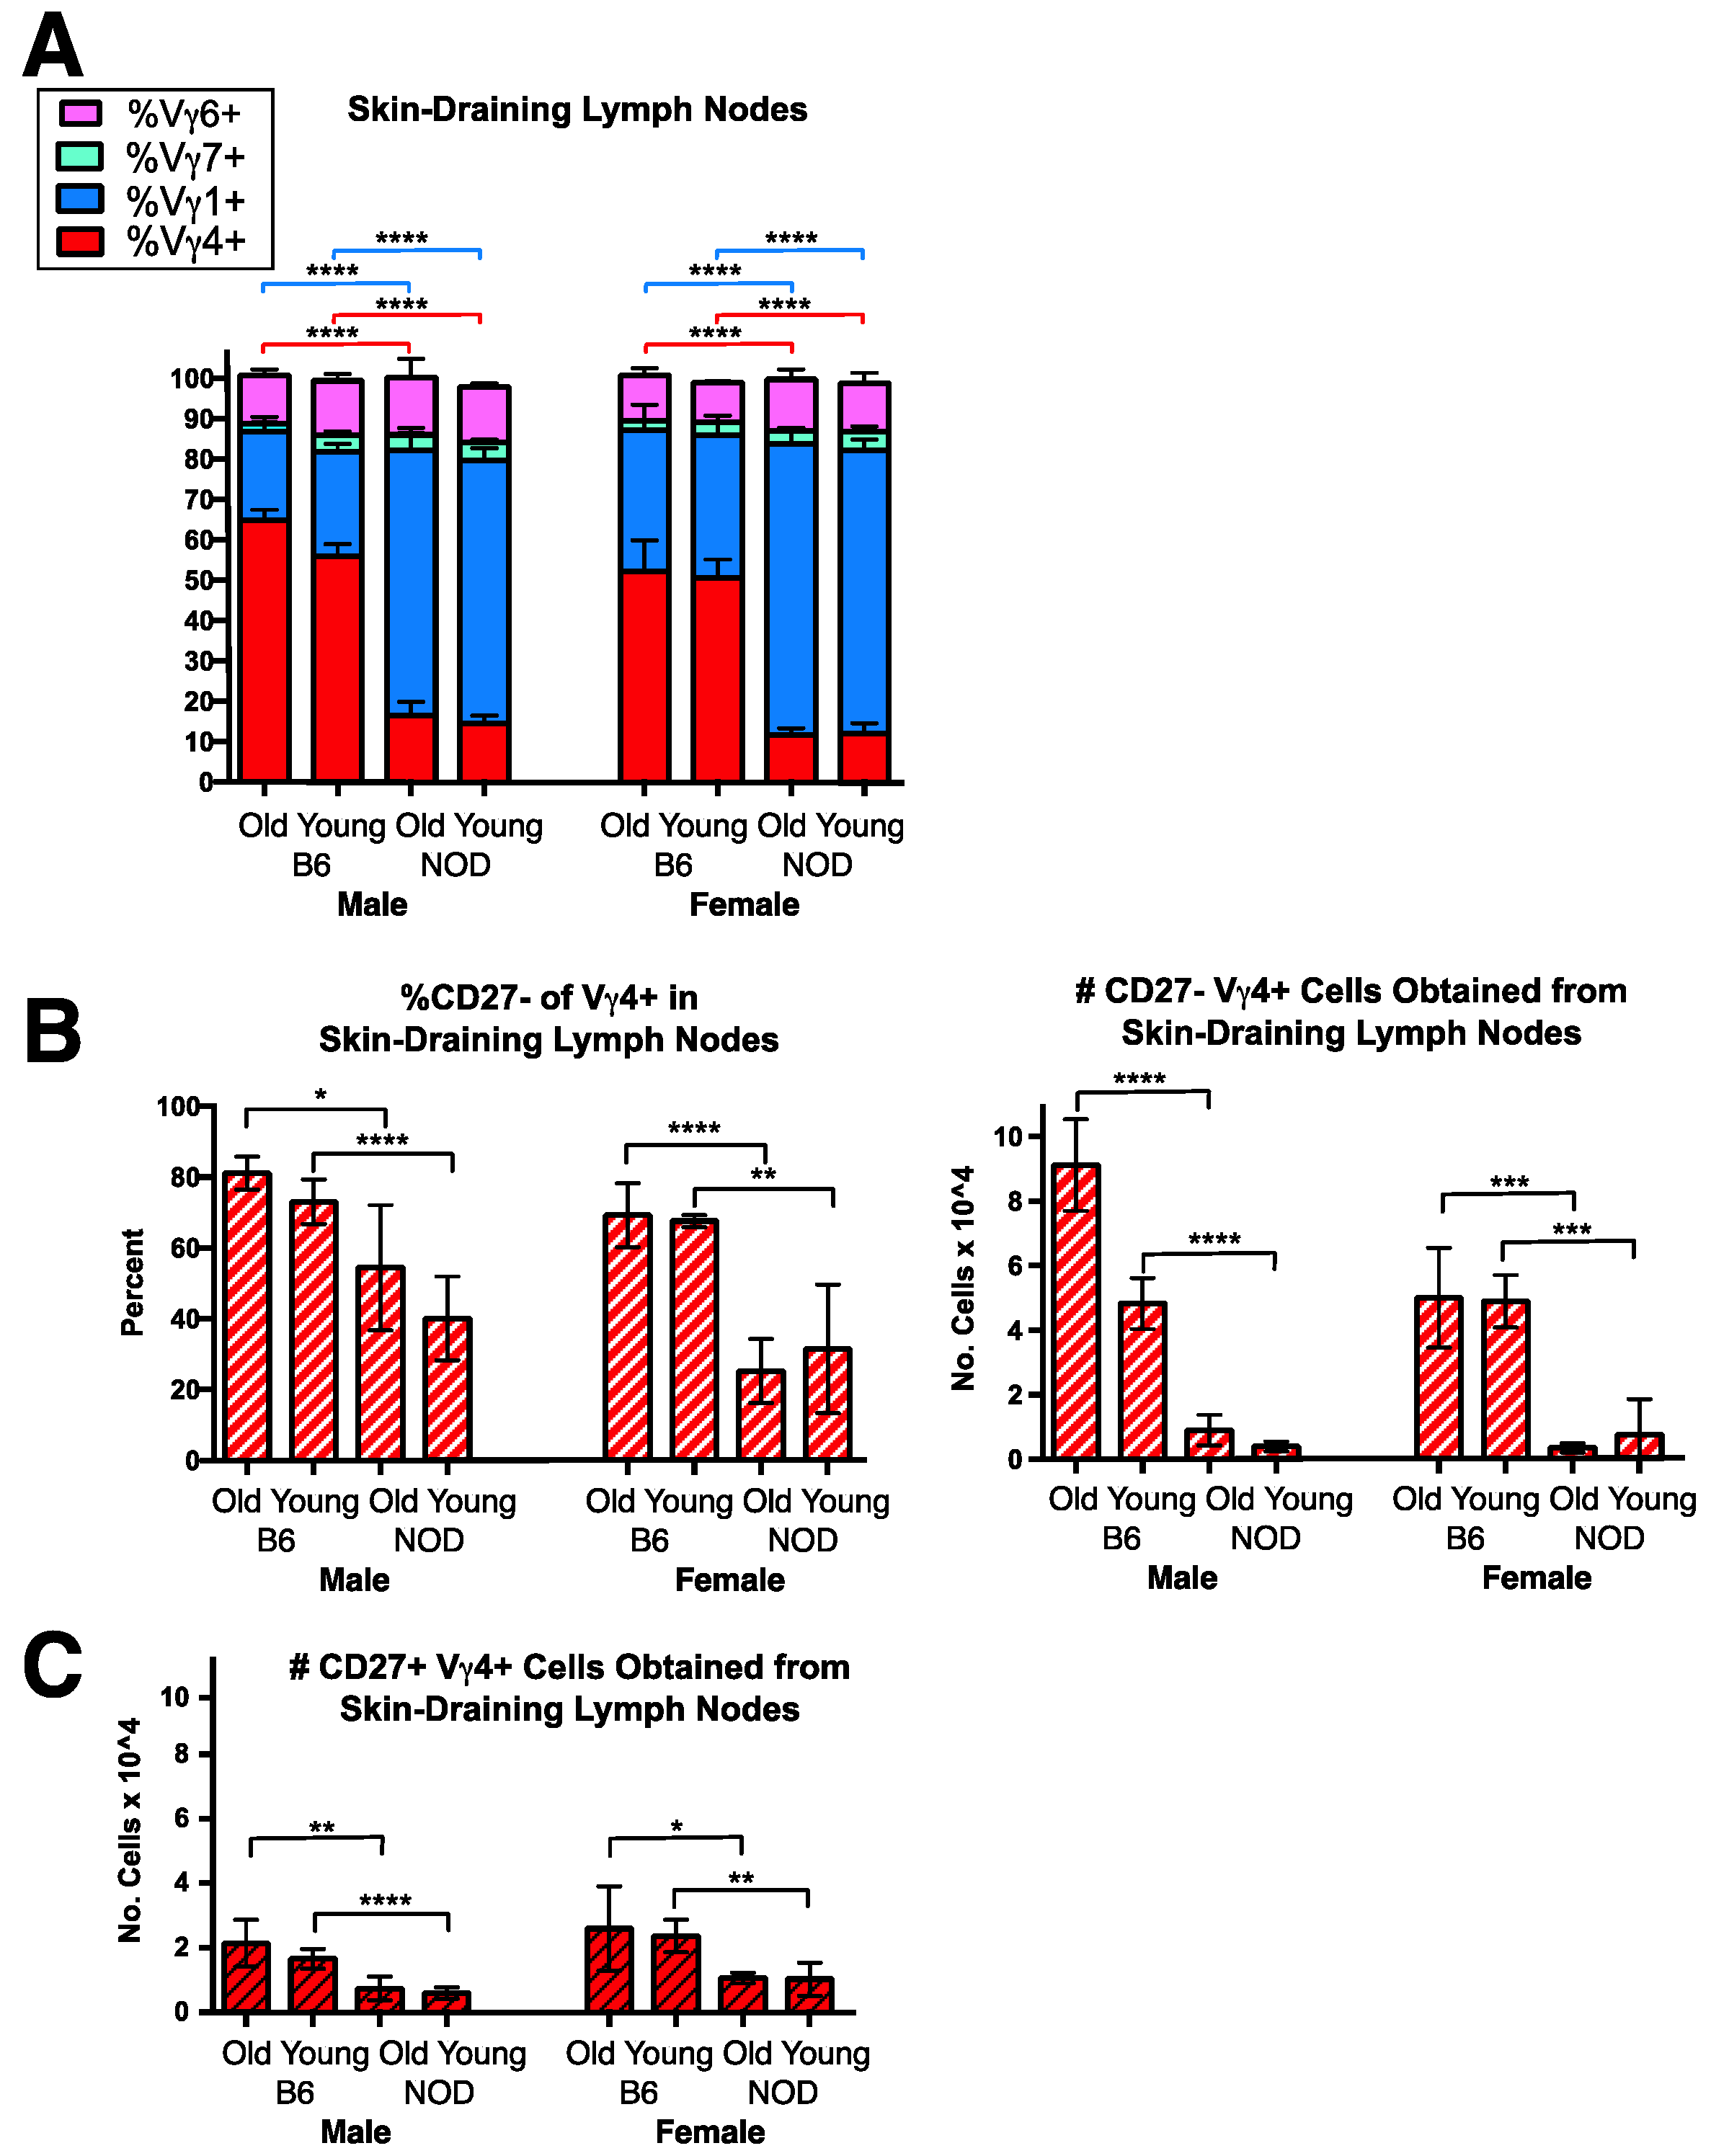
3.3. A Conspicuous Deficiency in NOD Mice of Vγ4+ IL-17-Biased Cells in Skin-Draining Lymph Nodes

Because murine Vγ4+ cells biased to produce IL-17 are known to be particularly abundant in the dermis and in skin-draining lymph nodes [16,36,40,44,45,46], we examined the status of these cells in the inguinal and axillary skin-draining lymph nodes of NOD mice (Figure 3). Consistent with published data [36,40,41], Vγ4+ cells in the skin-draining lymph nodes of B6 mice were clearly more abundant than in spleen and in fact here comprised the major γδ T cell subset, surpassing the Vγ1+ cells. However, in NOD mice, Vγ4+ γδ T cells in the skin draining lymph nodes remained a minor subset (Figure 3A), averaging only 10–15% of the total γδ T cells. The prevalence of the other two γδ T cells subsets was comparable to that seen in spleen in both strains, averaging at 10–15% for Vγ6+ cells and at 3–7% for Vγ7+ cells. As expected [45,47], the Vγ4+ subset in B6 skin-draining lymph nodes contained a large proportion of CD27-negative and presumably IL-17-biased cells comprising 70–80% of the cells (Figure 3B left). However, in NOD mice, CD27- cells were less frequent within the already smaller Vγ4+ population (Figure 3B left), and the absolute numbers of CD27-Vγ4+ cells obtained from skin-draining lymph nodes were much lower, representing a tenth or less of the number in matched B6 controls (Figure 3B right). Further characterization nonetheless showed that in NOD as in B6 mice, a majority of these CD27-Vγ4+ skin-draining lymph node cells expressed both CCR6 and high levels of CD44 (CD44-hi), further indications of an IL-17 bias [38], whereas only a minority of the Vγ4+ CD27- cells in spleen and even fewer in pancreatic lymph nodes of either strain were both CCR6+ and CD44-hi (Figure S2). NOD mice also had somewhat smaller numbers of the CD27+Vγ4+ (IFNγ-biased) subpopulation in skin-draining lymph nodes than B6 mice (Figure 3C). Clearly, the paucity of Vγ4+ γδ T cells in skin-draining lymph nodes, and particularly of those biased to produce IL-17, is a distinguishing feature of the γδ T cell repertoire in the NOD strain.

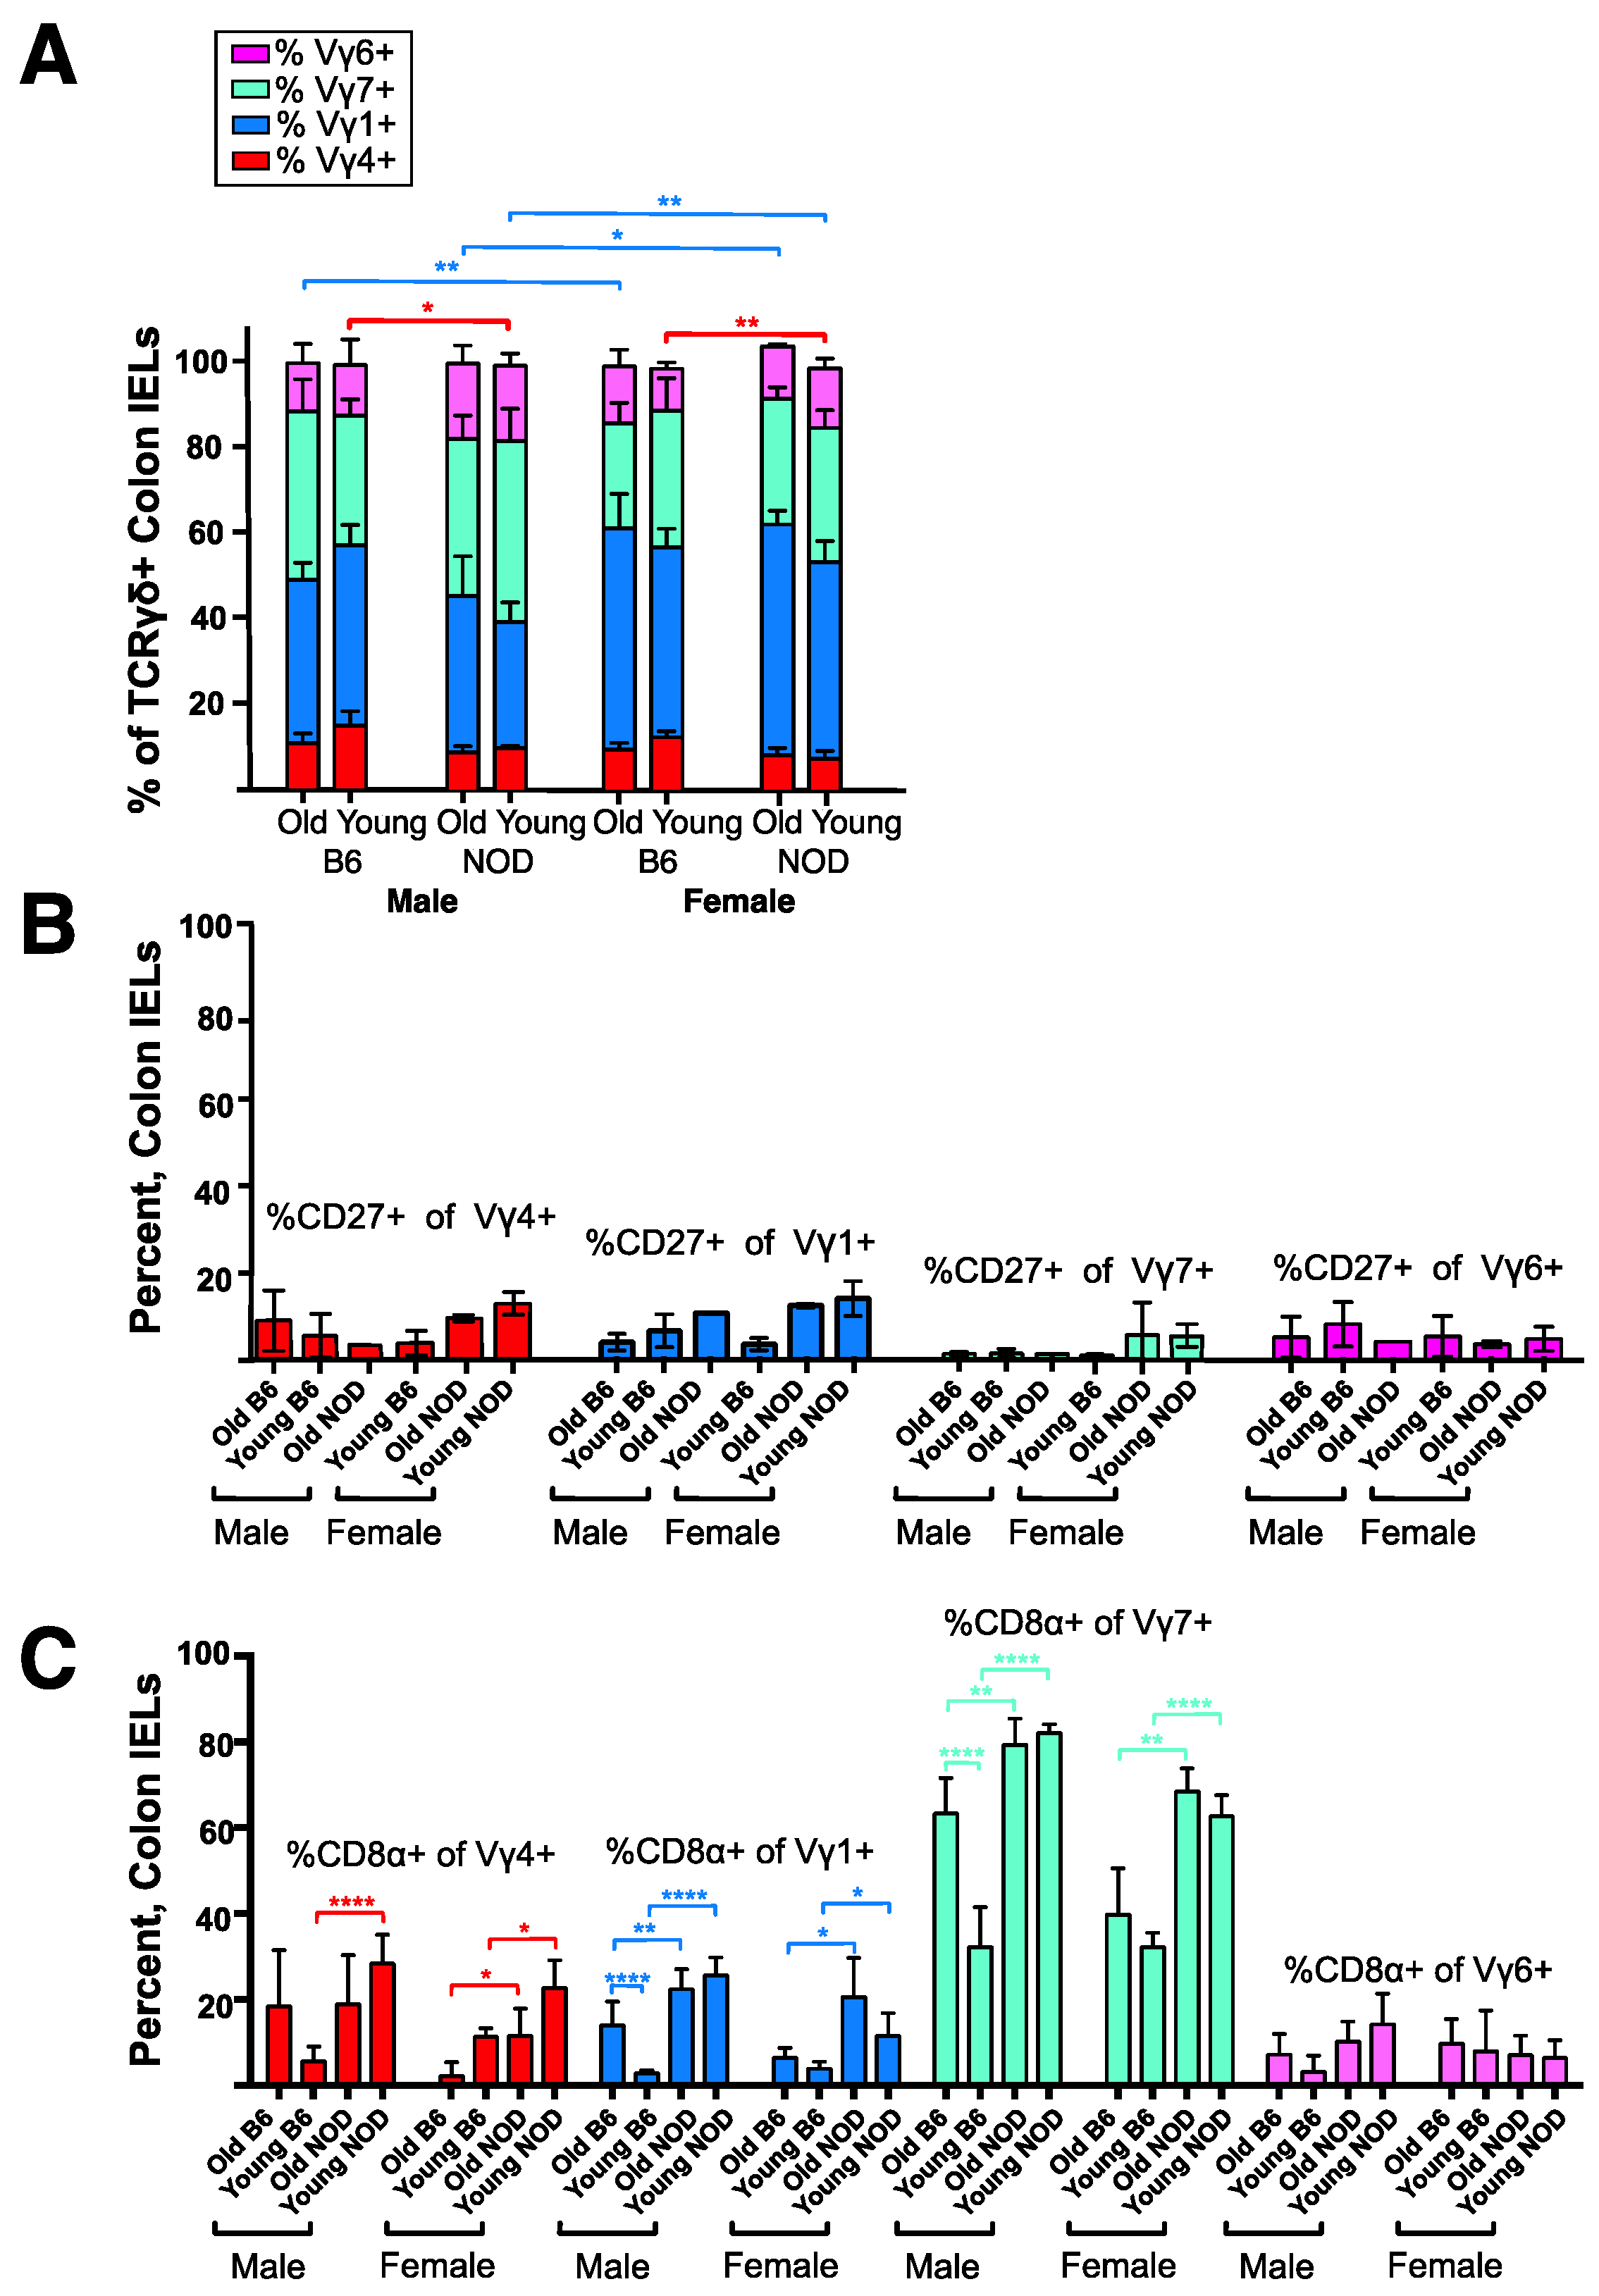
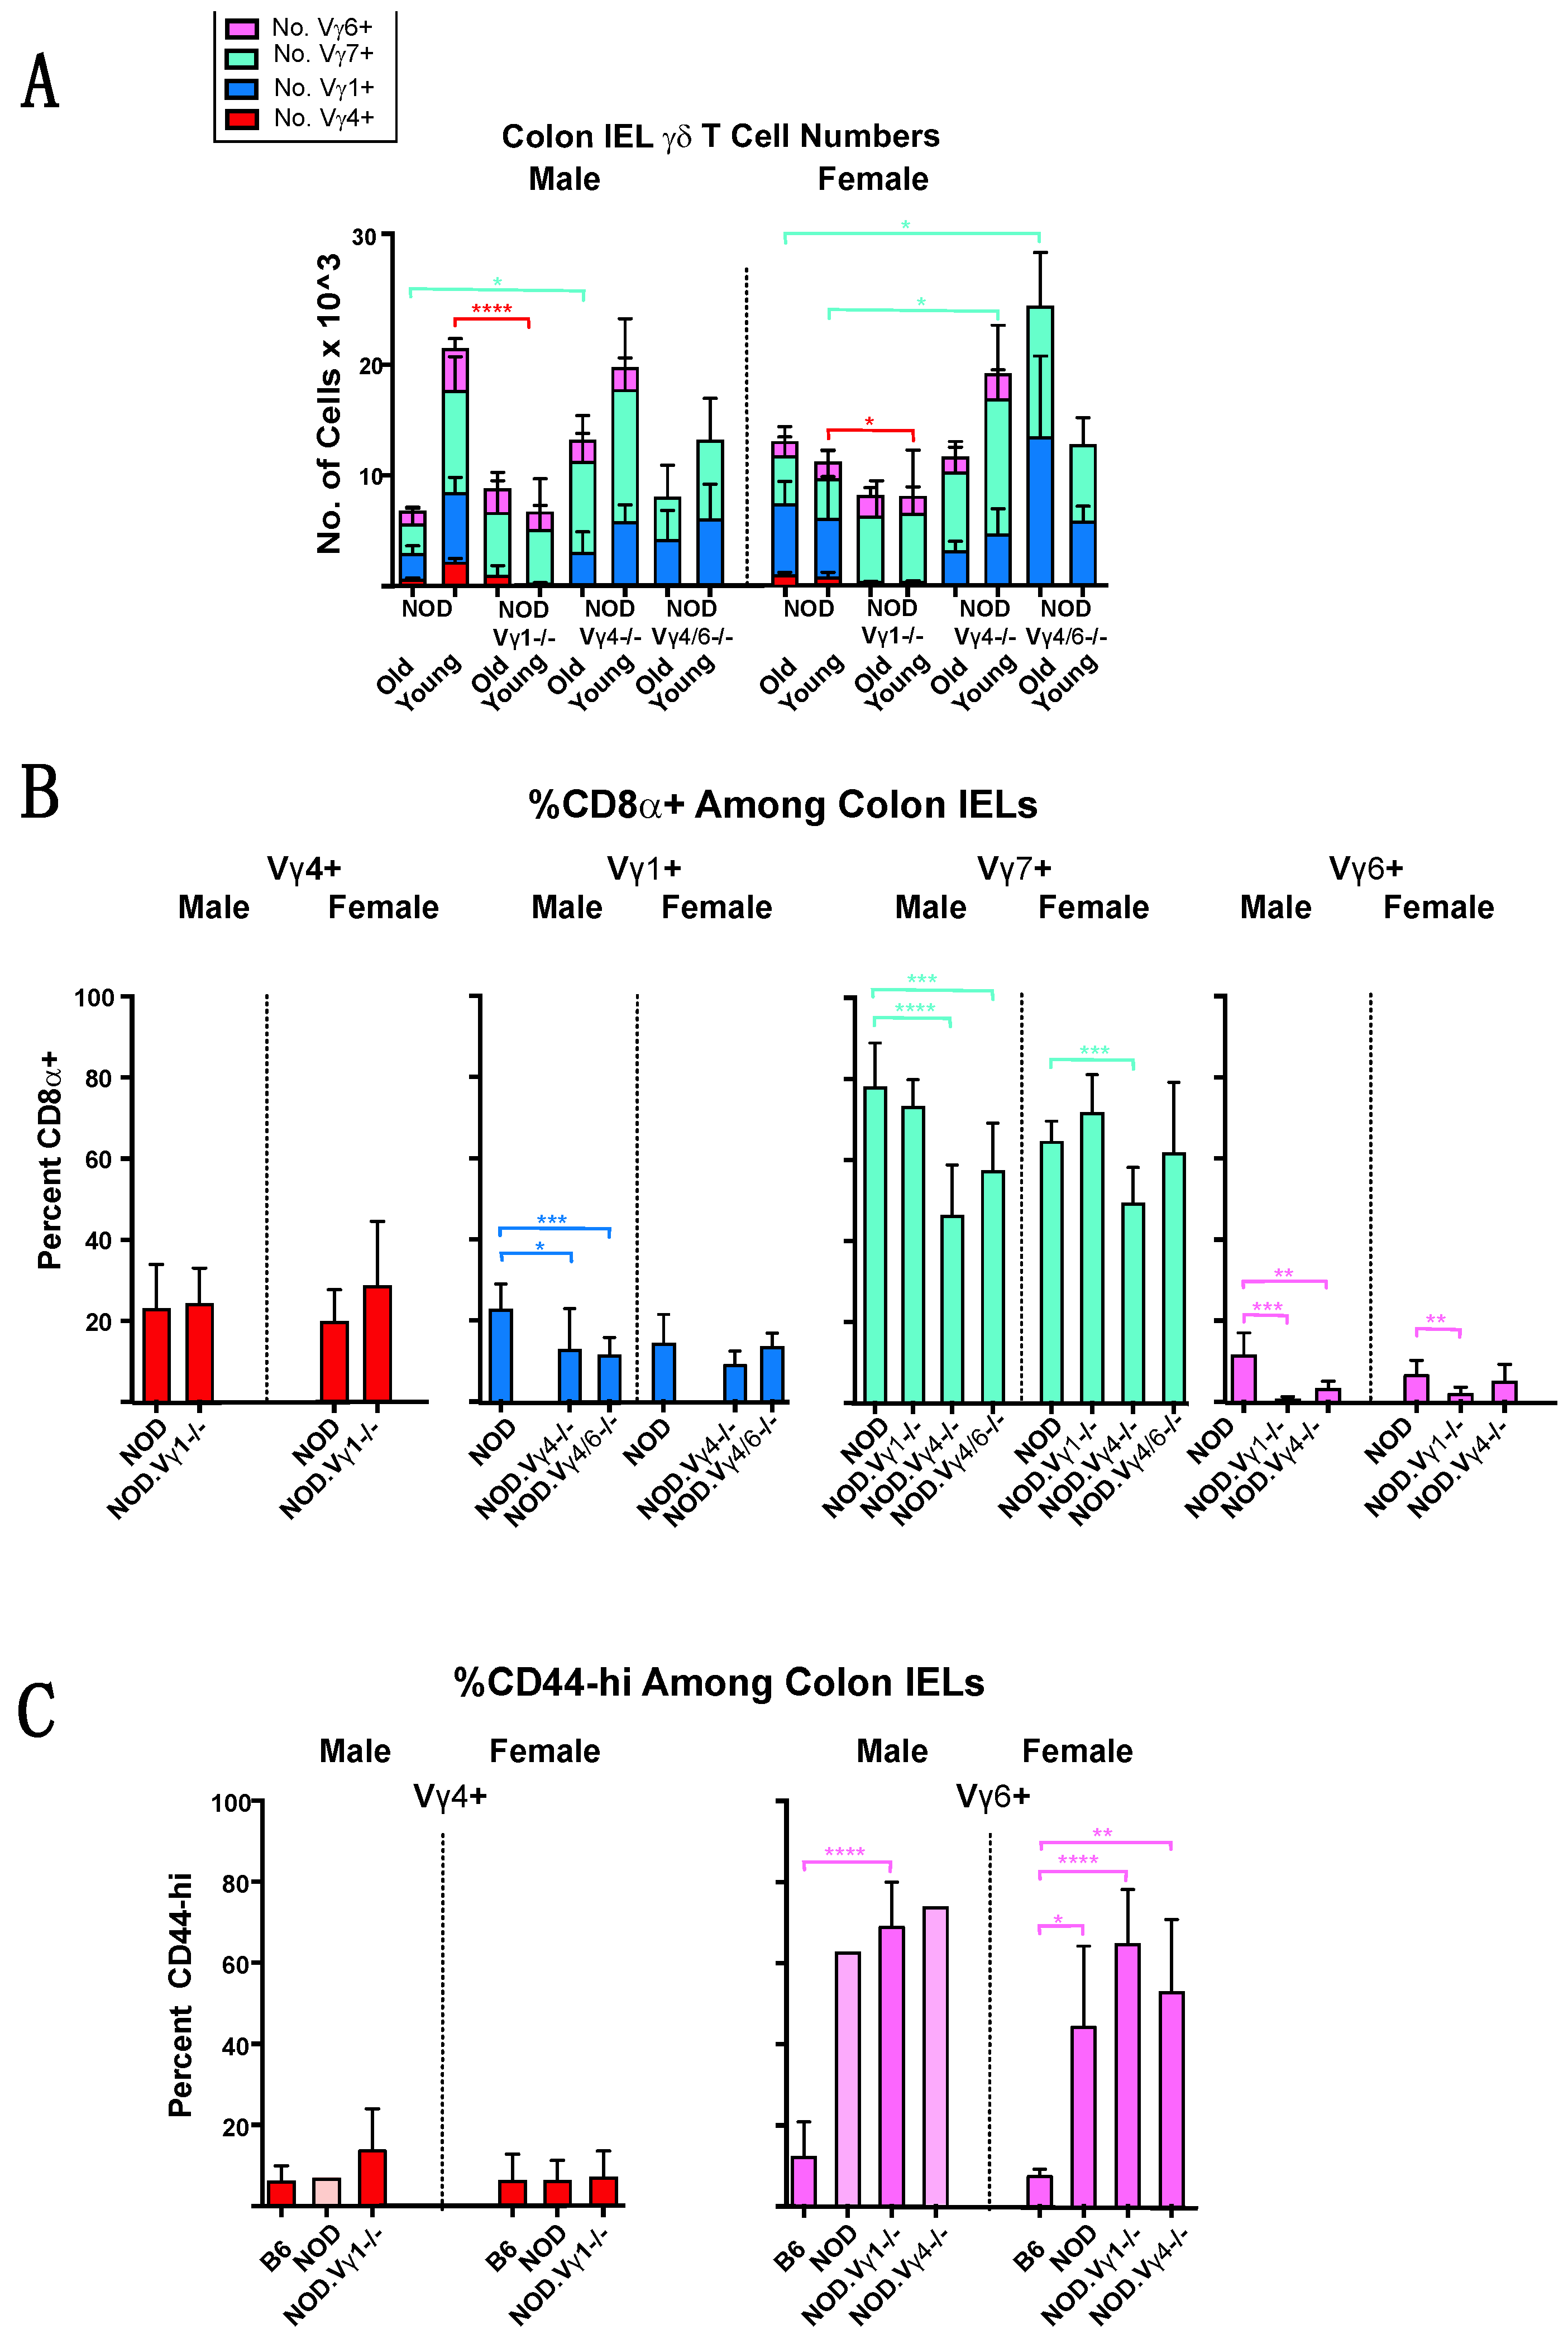
3.4. Intestinal Intraepithelial Lymphocyte (IEL) γδ T Cells Differ in CD8α Expression in NOD vs. B6 Mice

Taking into account the prominence of γδ T cells in the intestinal epithelium, and reported connections between diabetes in humans or NOD mice and the composition of the gut microbiota [48,49,50], we also characterized γδ T cells among colon IELs of NOD vs. B6 mice. The data are shown in Figure 4 and Figure S3. Despite the differences evident in spleen and skin-draining lymph nodes, the composition of colon γδ T IELs of NOD mice largely resembled those of B6 (Figure 4A), although the percentage of γδ T cells varied considerably between individuals (Figure S3A). Due to the low numbers of IELs obtained per mouse, we could not directly test colon IEL Vγ4+ cells for their bias to produce IL-17. Although the majority were CD27-, this might not be predictive of an IL-17 bias for IEL Vγ4+ cells, since CD27 expression, though common in spleen, was in any case very low among IELs for all γδ T cell subsets (Figure 4B). In contrast, larger fractions and sometimes the majority of the CD4+ and CD8+ γδ IELs were CD27+ (Figure S3B). The NKT-like Vγ1Vδ6.3+ subpopulation in contrast was less common among colon IELs than in lymphoid organs (see Figure 2A left above), representing only 5–10% in all groups (Figure S3C). Gut γδ T cells have been previously noted to be distinct in that a high proportion express the CD8α homodimer (reviewed in [51]). Except for Vγ6+ cells, we found that almost all other γδ IEL in NOD mice expressed CD8α at significantly higher frequencies than their B6 counterparts, especially the Vγ7+ IELs in NOD males in which about 80% were CD8α+ (Figure 4C). This was the only clear difference among colon IELs that we observed between the two strains.

3.5. NOD Mice Lacking Vγ1+ Cells Are Less Prone to Develop Diabetes, Whereas Those Deficient in Vγ4+ Cells Develop Accelerated Disease

Because differences in the γδ T cell compartments of B6 mice and NOD mice were already evident in young mice prior to the onset of diabetes, it seemed possible that γδ T cells could influence disease development. The two major γδ T cell subsets that were different in the lymphoid organs of NOD mice, Vγ1+ and Vγ4+ γδ T cell subsets, had been shown to affect pathogenesis in other mouse models of disease [8,9,10,12,15,16,17,52,53,54]. We therefore went on to investigate these two subsets in subsequent functional studies. Figure 5 shows the development of diabetes in γδ T cell-deficient NOD mice as they age, compared to age- and sex-matched normal NOD controls, for males and females. The NOD γδ T cell-deficient strains were generated by backcrossing gene-targeted mice of the C57BL/6J (B6) background onto the NOD background, except for the NOD.Vγ4-/- strain, which was generated directly in NOD embryos using CRISPR/Cas9 technology. We monitored mice lacking all γδ T cells or particular γδ T cell subsets (defined by expression of certain Vγ genes) weekly from 13 until 30 weeks of age. Both male and female NOD mice deficient in all γδ T cells (NOD.TCRδ-/- mice) exhibited a substantial decrease in diabetes incidence (Figure 5A), that was less pronounced than but consistent with that seen in an earlier report [7]. NOD.Vγ1-/- mice showed a similar decrease, such that only ~50% of the females and ~20% of the males developed diabetes by 30 weeks of age, compared to ~75% and 40% in matched wt female and male controls, respectively (Figure 5B). The fact that the absence of Vγ1+ cells essentially phenocopied the absence of all γδ T cells suggested that the disease-promoting γδ T cells are within the Vγ1+ subset, and perhaps only there. In marked contrast, NOD.Vγ4/6-/- mice (lacking both Vγ4+ and Vγ6+ γδ T cells), did not differ significantly from normal controls in disease incidence (Figure 5A), emphasizing a unique role for Vγ1+ γδ T cells in promoting NOD diabetes. However, they showed a slight increase in disease incidence, which could suggest that protective γδ T cells also exist.
To better reveal potential protectors, we therefore generated a new mouse strain, NOD.Vγ4-/- mice, using CRISPR/Cas9 technology, lacking Vγ4+ cells but still capable of producing the Vγ6+ subset. NOD.Vγ4-/- females showed a clear acceleration in the development of diabetes, such that by 21 weeks of age their overall incidence rose to ~75%, a level reached by wt females only at ~30 weeks of age (Figure 5B right). Diabetes incidence at the final timepoint was also somewhat higher for the NOD.Vγ4-/- females than for normal female NOD controls (84% vs. 74%). This suggests that the Vγ4+ γδ T cell population contains protective cells, at least in females, since their absence led to disease acceleration and an increase in diabetes incidence. Disease development in male NOD.Vγ4-/- mice did not differ significantly from male wt controls (Figure 5B left).

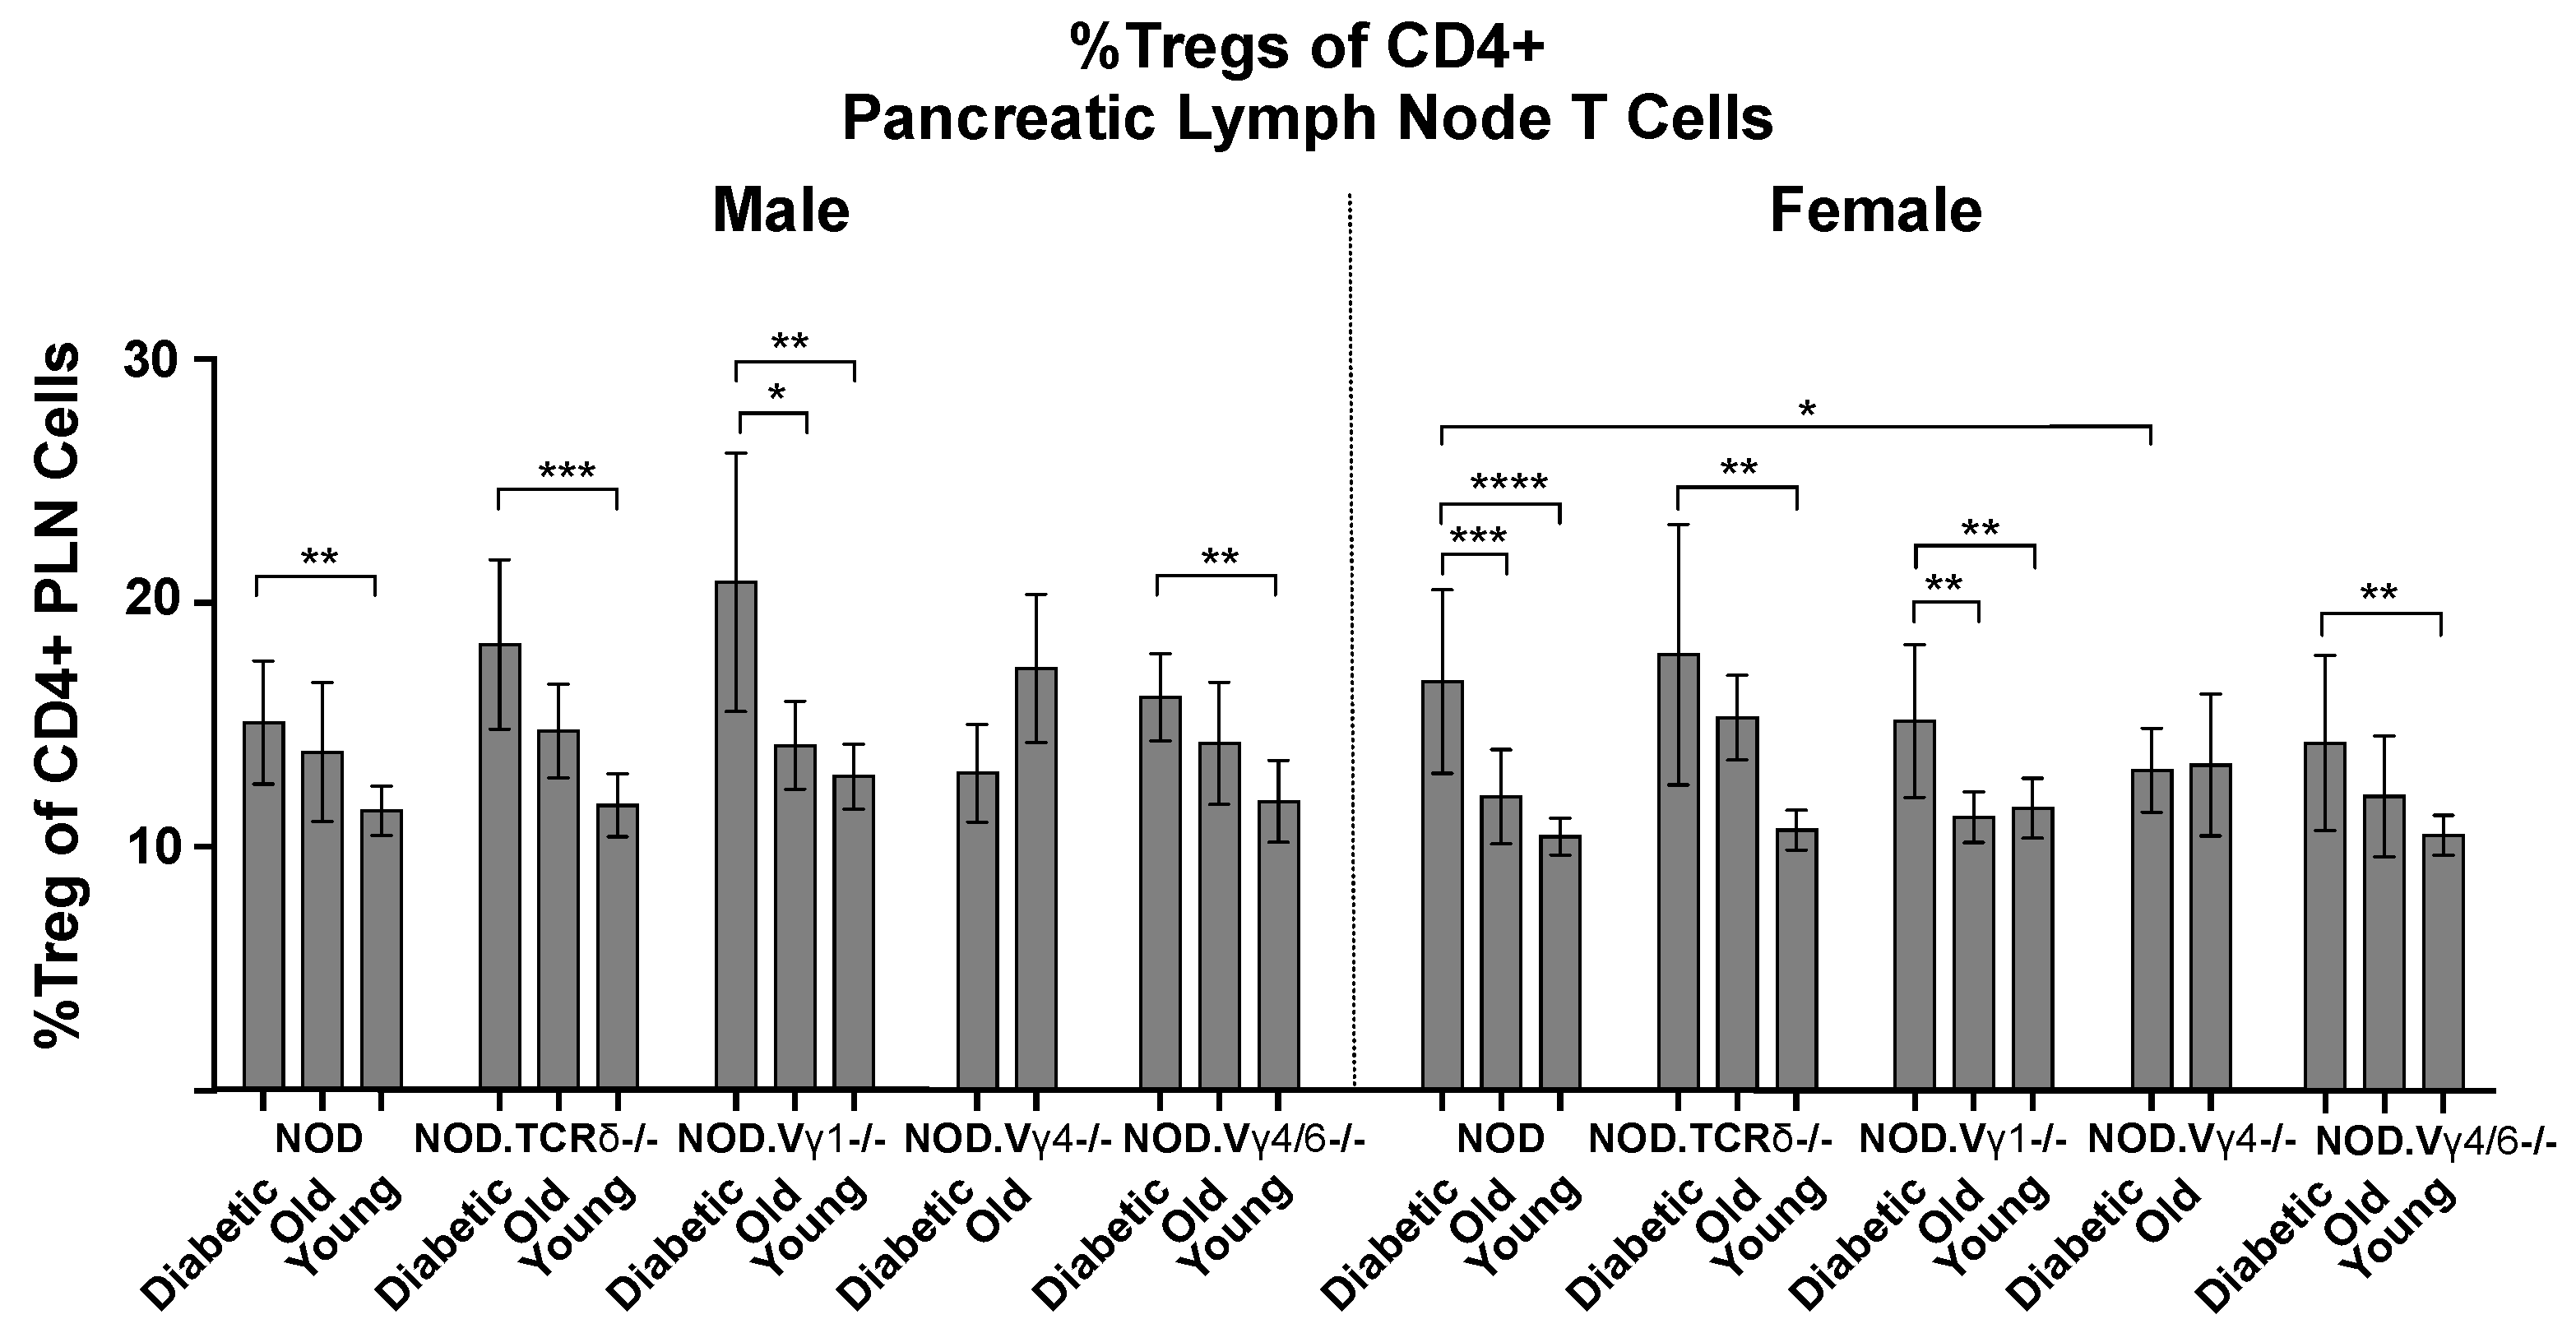
3.6. Vγ4+ γδ T Cells in NOD Mice May Provide Protection by Promoting CD4+ Tregs

With this evidence that individual γδ T cell subsets play a regulatory role in the development of NOD diabetes, we wondered if they might exert their influence through the more numerous αβ T cells. We first examined the effect of γδ T cell ablation on the overall composition of αβ T cells in young, older and diabetic NOD background mice, but found a difference only in NOD.TCRδ-/- mice, which showed a high ratio of CD4:CD8 αβ T cells due to a significant decrease in CD8+ αβ T cells (Figure S4A,B). We then looked at regulatory T cells, because other laboratories previously reported an increase in CD4+ CD25+ FoxP3+ “Tregs” in NOD mice as diabetes developed [55,56]. Consistently, though often quite variable, we saw a higher percentage of Tregs in the pancreatic lymph nodes of NOD mice following the onset of diabetes, compared to young normo-glycemic sex-matched NOD controls (Figure 6). In γδ T cell subset-deficient NOD mice, we also found higher levels of Tregs among the diabetic mice in the two strains having decreased diabetes susceptibility: the NOD.TCRδ-/- and NOD.Vγ1-/- mice. The NOD.Vγ4/6-/- mice, whose susceptibility resembled that of wt NOD controls, also showed this increase. In contrast, NOD.Vγ4-/- mice, of which the females exhibited increased hyperglycemia and accelerated disease development, showed no increase in the pancreatic lymph node Treg percentage with recent onset diabetes (Figure 6). These results suggest that Vγ4+ γδ T cells play a role in bringing about the rise in pancreas-associated Tregs that occurs as diabetes develops, and that this inhibits or slows the development of disease. The balance between Vγ4+ and Vγ1+ γδ T cells may therefore be critical in disease progression.

3.7. Changes in NOD γδ T Cell Populations Associated with the Development of Diabetes, and Evidence for Crosstalk between γδ T Cell Subsets

The number of γδ T cells in the spleen of NOD mice has been previously shown to drop with the onset of diabetes [6]. We confirmed this in the spleens of NOD mice with recent onset diabetes, compared to sex-matched older and/or younger NOD mice (Figure 7A). A similar drop in γδ T cell numbers was also seen in the spleens of NOD.Vγ4/6-/- mice that had recently developed diabetes (Figure 7A), suggesting that the decrease primarily if not exclusively involves Vγ1+ γδ T cells. We previously found that Vγ1+ γδ T cells infiltrate the pancreas of NOD mice with insulitis [57], which might explain their depletion in the spleen.
The numbers of cells representing major γδ T cell subsets (Vγ1+, 4+, 6+ and 7+ cells) in the spleen of young and older healthy wt and γδ T cell-subset-deficient NOD mice were then compared (Figure 7B), as well as the percent of each γδ T cell subset present in spleen, skin-draining and pancreatic lymph nodes (Figure S5). Whether or not they developed diabetes, NOD.Vγ1-/- mice had much-reduced overall numbers of splenic γδ T cells (Figure 7A), indicating that their other γδ T cell subsets did not at any stage expand to compensate for the absence of Vγ1+ cells. NOD.Vγ4-/- males had normal or slightly increased numbers of splenic γδ T cells (Figure 7A) which were mainly Vγ1+ cells (Figure 7B), perhaps indicating that Vγ4+ γδ T cells normally exert a weak inhibitory effect on their Vγ1+ counterparts. Compared to normal NOD controls, in NOD.Vγ1-/- mice, Vγ4+ cells as expected represented an increased percentage in all lymphoid tissues (Figure S5), as we saw previously in B6.Vγ1-/- spleens [52]. In both skin-draining and pancreatic lymph nodes, a similar increase in percentage (~2–3-fold) was also seen for the Vγ6+ and Vγ7+ subsets of NOD.Vγ1-/- mice (Figure S5, center and bottom). Oddly, however, in the spleens, the Vγ6+ percentage did not change, but instead the Vγ7+ percentage was elevated by 6–8-fold compared to normal controls (Figure S5 top). NOD.Vγ4-/- mice in contrast had largely unaltered Vγ1+ and Vγ6+ percentages in all three lymphoid tissues, but their Vγ7+ fraction was substantially elevated (Figure S5). NOD.Vγ4/6-/- mice showed yet another pattern, and had increased percentages of both Vγ1+ and Vγ7+ cells in all 3 lymphoid tissues (Figure S5), although the Vγ1+ fraction was not increased to the degree that we had noted previously in B6.Vγ4/6-/- spleens [52]. Thus, elimination of particular γδ T cell subsets by genetic ablation differentially altered the size of the remaining γδ T cell subsets, depending on which subsets were ablated, suggesting that cross-talk between γδ T cell subsets affects their survival and/or expansion.
In wt NOD mice with recent onset diabetes, but not in nondiabetic older NOD mice, we noticed a substantial decrease in the fraction of splenic Vγ1+ cells that express Vδ6.3 (which include the NKT-like γδ T cells; Figure 7C). Their actual numbers would be even more reduced because their total spleen γδ T cells numbers also dropped following diabetes onset (Figure 7A). This suggests a distinct role for the Vγ1+ NKT-like γδ T cells in the pathogenesis of NOD diabetes. Intriguingly, in the NOD.Vγ4/6-/- and NOD.Vγ4-/- mice (both of which retain Vγ1+ cells), no selective decrease in the NKT-like Vγ1+ γδ T cells was seen following diabetes onset (Figure 7C), indicating that Vγ4+ and perhaps Vγ6+ γδ T cells as well may normally regulate Vγ1+Vδ6.3+ γδ T cell levels. In support of this, NOD.Vγ4/6-/- spleens contained at all stages an increased percentage of Vγ1+ cells co-expressing Vδ6.3 (Figure 7B), as we previously reported in B6.Vγ4/6-/- mice [52].
In lymph nodes (skin-draining and pancreatic), genetic inactivation of the Vγ1 gene reduced the frequency of γδ T cells among total T cells even more than in the spleen (Figure 8). In contrast, NOD.Vγ4-/- mice had a normal γδ T cell percentage in both lymph node types, and that of NOD.Vγ4/6-/- mice was only slightly reduced.
Finally, we also examined colon IEL γδ T cells in the NOD γδ T cell-deficient mouse strains, in young and older nondiabetic mice. We included this experiment because the γδ T cell repertoire among IELs is distinct, and genetic ablation of particular γδ T cell subsets might in this setting result in unique compensatory effects on other γδ T cell subsets that could as well influence the development of diabetes. However, though variability between individuals was high, patterns seen in the spleen and lymph node largely re-emerged in the colon IELs: in NOD.Vγ1-/- mice, γδ T cell numbers overall were lower (although to a lesser degree than in spleen), whereas the other mutant strains had equal or higher numbers of γδ T cells than wt (Figure 8). In strains that retained Vγ1+ cells, Vγ7+ and Vγ1+ γδ T cells remained the largest IEL subsets (Figure 9A). The Vγ4+ subset, rarer in any case among the IELs of normal NOD mice, was even further diminished or absent in the colon IELs of NOD.Vγ1-/- mice (Figure 9A).
However, we did find colon-unique compensatory effects when we examined CD8α expression by γδ T IELs (Figure 9B). Here, in both wt and γδ T cell-deficient NOD mice, CD8α expression among colon γδ IELs was least frequent for Vγ6+ cells and most frequent for Vγ7+ cells (results for samples from each sex of each strain are presented here as a single group without further division into old and young segments, as very similar percentages were obtained for both ages). However, the percent of Vγ7+ cells expressing CD8α was much reduced in NOD.Vγ4-/- mice and somewhat also in male NOD.Vγ4/6-/- mice. A similar decrease was seen for CD8α expression on both Vγ1+ and Vγ6+ cells as well in the NOD.Vγ4-/- mice (Figure 9B), perhaps suggesting that Vγ4+ γδ T cells normally promote the survival or expansion of gut CD8α+ γδ T cells, especially those of the Vγ7+ subset.
Lastly, we asked whether either the Vγ4+ or Vγ6+ colon IELs were likely to be producers IL-17 (Figure 9C) by looking for high expression of CD44 (CD44-hi), which correlates with an IL-17 bias in these two subsets [47,58,59]. We found very few CD44-hi Vγ4+ cells in either NOD or NOD.Vγ1-/- mice. In marked contrast, for colonic Vγ6+ IELs from wt NOD, NOD.Vγ1-/- and NOD.Vγ4-/- mice, half or more were CD44hi, whereas in B6 mice they were much rarer and averaged 20% or less of the Vγ6+ cells (Figure 9C).

4. Discussion

4.1. Protective γδ T Cells in NOD Diabetes

Overall, our results indicate that NOD Vγ4+ γδ T cells inhibit the development of diabetes, and suggest that the process by which they do so involves IL-17 production and/or promotion of regulatory CD4+ αβ T cell (Treg) development in the pancreatic lymph nodes. Consistently, in a previous publication using a type 1 diabetes disease model involving adoptive transfer of diabetogenic T cells into NOD/SCID mice, the co-transfer of normal splenic γδ T cells capable of producing IL-17 was found to reduce disease incidence [6]. Although IL-17 is generally considered to be a pro-inflammatory cytokine, in several studies IL-17 appeared to suppress type 1 diabetes [48,60,61,62]. Furthermore, in other disease models, IL-17+ γδ T cells also have been shown to co-produce amphiregulin [63,64,65], a cytokine which promotes Treg development [66]. That IL-17+ Vγ4+ cells might protect by increasing Treg levels is plausible because deliberate stimulation of Tregs in NOD mice decreased the development of diabetes [67]. Moreover, γδ T cells have been shown to increase levels of Tregs in other autoimmune disease models, including inflammatory bowel disease [68], and autoimmune keratitis [69]. Here, in wt NOD mice, we indeed found that an increase in the percentage of CD4+ Tregs in the pancreatic lymph nodes follows diabetes onset (see Figure 6). Though this increase also occurred in the γδ T cell-deficient NOD strains having normal or reduced diabetes susceptibility, it was not found in NOD.Vγ4-/- female mice which exhibit accelerated diabetes (see Figure 5), consistent with the notion that Vγ4+ cells normally promote Tregs. If they do, perhaps hyaluronan, which accumulates in the pancreatic islets during type 1 diabetes in humans and in NOD mice and is known to promote the disease [70,71,72], is involved in the mechanism by which the IL-17-biased Vγ4+ cells are recruited and activated. Due to their proclivity to express high levels of CD44, for which hyaluronan is a known ligand [70], the binding of hyaluronan to CD44 could promote Vγ4+ IL-17+ T cell activation, as it does for Th17 αβ cells [73], and in this way promote increased survival of Tregs.
Why NOD.Vγ4/6-/- mice which also lack Vγ4+ cells did not also fail to expand Tregs upon diabetes onset remains unclear. However, unlike the NOD.Vγ4-/- mice, NOD.Vγ4/6-/- mice also have more Vγ1Vδ6.3+ cells, a subpopulation that in normal NOD spleens drops upon diabetes onset (see Figure 8). Perhaps the increase in these NKT-like γδ T cells in the NOD.Vγ4/6-/- strain causes Treg cells to expand, as TCR-αβ+ iNKT cells have previously been shown to do [reviewed in [74]].
Why the NOD.Vγ4-/- males do not like the females show exacerbated diabetes is also puzzling. Since the gut flora of wt male and female NOD mice differs and has been shown to be sufficient to alter their susceptibility to diabetes [49], we speculate that male vs. female intestinal microbiome differences may be responsible. This likely explained a similar scenario in a previous study, where the presence of segmented filamentous gut bacteria correlated with a reduced diabetes incidence in NOD females but not in males, even though the CD4+ Th17 cells stimulated by this organism and thought to be responsible for the decrease were similarly elevated in both sexes [48].

4.2. Pathogenic γδ T Cells in NOD Diabetes

In contrast to the protective role of the Vγ4+ cells, the NOD Vγ1+ cells appear to promote diabetes development. In a previous study on the role of γδ T cells in spontaneous diabetes [7], a larger reduction in the disease incidence of female NOD.TCRδ-/- mice was found, implying that the majority of γδ T cells promote diabetes. Here, we corroborated and extended this finding by showing reduced diabetes in both female and male NOD.TCRδ-/- mice independently backcrossed in our own facility [7]. Our finding that NOD.Vγ1-/- mice have a reduced incidence of diabetes is consistent with their result, since the vast majority of γδ T cells in the lymphoid organs of NOD mice are Vγ1+ (see Figure 1), though we also found a minor Vγ4+ population that instead has a protective effect. Indeed, we obtained very similar Kaplan–Meier curves for disease incidence when comparing NOD.TCRδ-/- mice to NOD.Vγ1-/- mice, for both sexes (see Figure 5). Why γδ T cell elimination had a somewhat weaker effect on the NOD.TCRδ-/- females in our study is unclear. It could be the result of insufficient backcrossing, although only very small amounts of residual non-NOD DNA, not linked to any known insulin-dependent diabetes risk-promoting (idd) loci [2,75], remained in our NOD.TCRδ-/- mice (see Supp. Detailed Materials and Methods, Genetic Screening), as for the NOD.TCRδ-/- mice used in the previous study [7]. However, environmental differences between the mouse colonies may have affected the disease incidence.
Many more Vγ1+ cells biased to produce IFNγ are present in NOD than in B6 mice (see Figure 2D). Given that both sexes of NOD mice lacking Vγ1+ cells had a reduced incidence of diabetes, our discovery of relatively large numbers of IFNγ-biased Vγ1+ cells in normal NOD mice suggests that these cells intensify the inflammation, and thereby exacerbate on-going autoaggressive attack on the pancreatic islets and the eventual development of diabetes. However, the NOD. Vγ1-/- mice not only lack Vγ1+ cells but also showed large decreases in the numbers of γδ T cells of all remaining subsets, except for Vγ7+ cells (see Figure 7B). For this reason, the reduced disease susceptibility in this strain could instead or as well be a consequence of secondary changes in other γδ T cells, rather than solely to the absence of Vγ1+ cells.
We previously reported γδ T cell hybridomas generated from NOD-background mice that respond to an insulin-B chain peptide, B:9-23 [76], a major autoantigen in both mouse and human type 1 diabetes that is also recognized by diabetogenic αβ T cells and B cells [77]. Hybridomas expressing both Vγ4+ and Vγ1+ TCRs were included among the insulin-peptide reactive NOD-background cells [77]. We also detected Vγ1+ cells within NOD islets in the pancreas at early stages of insulitis [57]. Thus, γδ T cells recruited to the pancreas that respond to insulin peptides could also become specifically activated during the development of diabetes. Several of the B:9-23-responsive γδ T cell hybridomas we identified expressed a Vγ1+Vδ6.3+ TCR type, and as noted above, the percentage of spleen Vγ1+ cells co-expressing Vδ6.3 dropped in NOD mice following recent diabetes onset (see Figure 7C). Perhaps a decrease in this subpopulation in the lymphoid organs occurs because these cells relocate to the pancreas. As noted above, Vγ1+Vδ6.3+ cells also represent a previously defined NKT-like subpopulation within the Vγ1+ subset which has distinct functional properties [33,34,35], and thus they could actually play a different role in diabetes development than do the other Vγ1+ cells. However, because insulin peptide specificity was not limited to Vγ1+ γδ T cells, it may not be directly related to pathogenicity.

4.3. Elimination of Particular γδ T Cell Subsets Precipitates Changes in Other T Cells

Apart from the lack of a Treg increase in NOD.Vγ4-/- mice following diabetes onset (see Figure 6), and increased prevalence of Vγ1Vδ6.3+ cells in NOD.Vγ4/6-/- mice (see Figure 7C), additional changes in the abundance of other non-targeted T cell types were found in γδ T cell-deficient NOD strains. These include a decrease in CD8+ αβ T cell numbers in NOD.TCRδ-/- mice (see Figure S4), a reduction in numbers of other non-targeted γδ T cell subsets in NOD.Vγ1-/- spleens (see Figure 7B), and a marked expansion of the Vγ7+ subset in NOD.Vγ4-/- mice (see Figure 7B). These findings may suggest that cross-talk occurs between various γδ T cell subsets and several other T cell types, including other γδ T cells.
In the large intestinal epithelium, a site in which γδ T cells are relatively abundant, we found that intraepithelial (IEL) γδ T cells of NOD mice for the most part resemble those of B6 mice, with two exceptions. First, NOD γδ IELs express CD8α at significantly higher frequencies, particularly within the Vγ7+ subset, the predominant γδ T cell subset found in colon IELs in both strains (see Figure 9B). Second, the majority of NOD-derived Vγ6+ colon IELs appear to be IL-17 biased because of their CD44-hi phenotype, unlike those of B6 mice See Figure 9C). Insufficient gut CD8α+ Vγ7+ γδ T cell numbers might contribute to the diabetes acceleration, since these cells were decreased in NOD.Vγ4-/- mice (see Figure 9B), but IL-17-biased Vγ6+ gut IELs probably do not, because they did not differ substantially from those of wt NOD mice in any of the γδ T cell-deficient NOD strains.

4.4. The Role of γδ T Cells in Human Type 1 Diabetes

In humans, several studies have shown that γδ T cells, including Vγ9Vδ2+ γδ T cells [78] and CD8+ γδ T cells [79,80,81], increase prior to disease onset in diabetes-prone individuals, and decrease with disease exacerbation [78,79,80,81,82,83]. However, whether such observations indicate that γδ cells protect against the development of diabetes in humans, or instead that their expansion is merely a passive marker brought about by other processes as diabetes develops, is unclear. Our study provides evidence that in type 1 diabetes in mice, some γδ T cells actively promote disease development, while others protect against it. Our results further suggest that γδ T cells at least in part influence NOD diabetes by inducing changes in the levels of other T cells, including CD4+ Tregs as well as other γδ T cell subsets. In human type 1 diabetes, γδ T cells might influence diabetes development in similar ways.

Supplementary Materials

The following supporting information can be downloaded at: https://www.mdpi.com/article/10.3390/biom12101406/s1. Figure S1: Comparison of γδ T cell subsets producing IFNγ, IL-17, and IL-2 in NOD vs. B6 mice; Figure S2: Identification of IL-17-biased Vγ4+ cells in NOD vs. B6 mice; Figure S3: Colon IELs from NOD vs. B6 mice; Figure S4: Major T cell populations in NOD-background γδ T cell-deficient vs. wt NOD mice in those with recent-onset diabetes vs. nondiabetic old and young mice; Figure S5: The γδ T cell repertoire of NOD-background γδ T cell subset-deficient vs. wt NOD mice in lymphoid organs; and Detailed Materials and Methods S1 [84,85,86,87,88,89].

Author Contributions

Conceptualization, R.L.O.; Funding acquisition, R.L.O.; Investigation, R.L.O., M.K.A., N.J. and S.P.; Resources, J.M.; Writing—review and editing, R.L.O., W.K.B. All authors have read and agreed to the published version of the manuscript.

Funding

This work was supported by grants to R.L.O., including National Institutes of Health grants R21AI097962, R56AI077594, and R01 EY021199, by Basic Science Award 7-11-BS-107 from the American Diabetes Association, and by a 2018 internal grant (Natalie V. Zucker Award) from National Jewish Health.

Data Availability Statement

Not applicable.

Acknowledgments

We thank Rachel Friedman and Robin Lindsay for advice and assistance in isolating pancreatic lymph nodes, and Josh Loomis and Shirley Sobus for assistance and advice in flow cytometry. This paper is dedicated to the memory of George Eisenbarth, who inspired, encouraged, and consistently supported this project.

Conflicts of Interest

The authors report there is no competing interest to declare.

Abbreviations

T cell Receptor: TCR, wild type: wt, intestinal intraepithelial lymphocytes: IELs, CD4+ αβ T regulatory cells: Tregs, CD4+ αβ+ IL-17-biased T-helper: Th17, specific pathogen-free: SPF, single nucleotide polymorphism: SNP, Natural Killer-like T cells: NKT.

References

  1. Kachapati, K.; Adams, D.; Bednar, K.; Ridgway, W.M. The non-obese diabetic (NOD) mouse as a model of human type 1 diabetes. Methods Mol. Biol. 2012, 933, 3–16. [Google Scholar] [PubMed]
  2. Driver, J.P.; Chen, Y.G.; Mathews, C.E. Comparative genetics: Synergizing human and NOD mouse studies for identifying genetic causation of type 1 diabetes. Rev. Diabet. Stud. 2012, 9, 169–187. [Google Scholar] [CrossRef] [PubMed] [Green Version]
  3. Pearson, J.A.; Wong, F.S.; Wen, L. The importance of the Non Obese Diabetic (NOD) mouse model in autoimmune diabetes. J. Autoimmun. 2016, 66, 76–88. [Google Scholar] [CrossRef] [Green Version]
  4. Harrison, L.C.; Dempsey-Collier, M.; Kramer, D.R.; Takahashi, K. Aerosol insulin induced regulatory CD8 γδ T cells that prevent murine insulin-dependent diabetes. J. Exp. Med. 1996, 184, 2167–2174. [Google Scholar] [CrossRef] [PubMed] [Green Version]
  5. Locke, N.R.; Stankovic, S.; Funda, D.P.; Harrison, L.C. TCR γδ intraepithelial lymphocytes are required for self-tolerance. J. Immunol. 2006, 176, 6553–6559. [Google Scholar] [CrossRef] [PubMed] [Green Version]
  6. Han, G.; Wang, R.; Chen, G.; Wang, J.; Xu, R.; Wang, L.; Feng, J.; Li, X.; Guo, R.; Fu, L.; et al. Interleukin-17-producing γδ T cells protect NOD mice from type 1 diabetes through a mechnism involving transforming gowth factor-β. Immunology 2009, 129, 197–206. [Google Scholar] [CrossRef] [PubMed]
  7. Markle, J.G.; Mortin-Toth, S.; Wong, A.S.; Geng, L.; Hayday, A.; Danska, J.S. γδ T cells are essential effectors of type 1 diabetes in the nonobese diabetic mouse model. J. Immunol. 2013, 190, 5392–5401. [Google Scholar] [CrossRef] [Green Version]
  8. Huber, S.A.; Graveline, D.; Newell, M.K.; Born, W.K.; O’Brien, R.L. Vγ1+ T cells suppress and Vγ4+ T cells promote susceptibility to coxsackievirus B3-induced myocarditis in mice. J. Immunol. 2000, 165, 4174–4181. [Google Scholar] [CrossRef] [Green Version]
  9. Hahn, Y.S.; Taube, C.; Jin, N.; Sharp, L.; Wands, J.M.; Aydintug, M.K.; Lahn, M.; Huber, S.A.; O’Brien, R.L.; Gelfand, E.W.; et al. Different potential of γδ T cell subsets in regulating airway responsiveness: Vγ1+ cells, but not Vγ4+ cells, promote airway hyperreactivity, Th-2 cytokines and airway inflammation. J. Immunol. 2004, 172, 12894–12902. [Google Scholar] [CrossRef] [Green Version]
  10. He, W.; Hao, J.; Dong, S.; Gao, Y.; Tao, J.; Chi, H.; Flavell, R.; O’Brien, R.L.; Born, W.K.; Craft, J.; et al. Naturally activated Vγ4 γδ T cells play a protective role in tumor immunity through expression of eomesodermin. J. Immunol. 2010, 185, 126–133. [Google Scholar] [CrossRef] [Green Version]
  11. Narayan, K.; Sylvia, K.E.; Malhotra, N.; Yin, C.C.; Martens, G.; Vallerskog, T.; Kornfeld, H.; Xiong, N.; Cohen, N.R.; Brenner, M.B.; et al. Intrathymic programming of effector fates in three molecularly distinct γδ T cell subtypes. Nat. Immunol. 2012, 13, 511–518. [Google Scholar] [CrossRef] [Green Version]
  12. Blink, S.E.; Caldis, M.W.; Goings, G.E.; Harp, C.T.; Malissen, B.; Prinz, I.; Xu, D.; Miller, S.D. γδ T cell subsets play opposing roles in regulating experimental autoimmune encephalomyelitis. Cell. Immunol. 2014, 290, 39–51. [Google Scholar] [CrossRef] [PubMed] [Green Version]
  13. Feng, N.; Vegh, P.; Rothenberg, E.V.; Yui, M.A. Lineage divergence at the first TCR-dependent checkpoint: Preferential γδ and impaired αβ T cell development in nonobese diabetic mice. J. Immunol. 2011, 186, 826–837. [Google Scholar] [CrossRef] [PubMed] [Green Version]
  14. Heilig, J.S.; Tonegawa, S. Diversity of murine gamma genes and expression in fetal and adult T lymphocytes. Nature 1986, 322, 836–840. [Google Scholar] [CrossRef] [PubMed]
  15. O’Brien, R.L.; Yin, X.; Huber, S.A.; Ikuta, K.; Born, W.K. Depletion of a γδ T cell subset can increase host resistance to a bacterial infection. J. Immunol. 2000, 165, 6472–6479. [Google Scholar] [CrossRef] [Green Version]
  16. Roark, C.L.; French, J.D.; Taylor, M.A.; Bendele, A.M.; Born, W.K.; O’Brien, R.L. Exacerbation of collagen-induced arthritis by oligoclonal, IL-17-producing γδ T cells. J. Immunol. 2007, 179, 5576–5583. [Google Scholar] [CrossRef] [Green Version]
  17. Hao, J.; Dong, S.; Xia, S.; He, W.; Jia, H.; Zhang, S.; Wei, J.; O’Brien, R.L.; Born, W.K.; Wu, Z.; et al. Regulatory role of Vγ1 γδ T cells in tumor immunity through IL-4 production. J. Immunol. 2011, 187, 4979–4986. [Google Scholar] [CrossRef] [Green Version]
  18. Itohara, S.; Mombaerts, P.; Lafaille, J.; Iacomini, J.; Nelson, A.; Clarke, A.R.; Hooper, M.L.; Farr, A.; Tonegawa, S. T cell receptor δ gene mutant mice: Independent generation of αβ T cells and programmed rearrangements of γδ TCR genes. Cell 1993, 72, 337–348. [Google Scholar] [CrossRef]
  19. Mombaerts, P.; Arnoldi, J.; Russ, F.; Tonegawa, S.; Kaufmann, S.H.E. Different roles of αβ and γδ T cells in immunity against an intracellular bacterial pathogen. Nature 1993, 365, 53–56. [Google Scholar] [CrossRef]
  20. Andrew, E.M.; Newton, D.J.; Dalton, J.E.; Egan, C.E.; Goodwin, S.J.; Tramonti, D.; Scott, P.; Carding, S.R. Delineation of the function of a major γδ T cell subset during infection. J. Immunol. 2005, 175, 1741–1750. [Google Scholar] [CrossRef] [Green Version]
  21. Sunaga, S.; Maki, K.; Komagata, Y.; Miyazaki, J.-I.; Ikuta, K. Developmentally ordered V-J recombination in mouse T cell receptor γ locus is not perturbed by targeted deletion of the Vγ4 gene. J. Immunol. 1997, 158, 4223–4228. [Google Scholar] [PubMed]
  22. French, J.D.; Roark, C.L.; Born, W.K.; O’Brien, R.L. γδ T lymphocyte homeostasis is negatively regulated by β2-microglobulin. J. Immunol. 2009, 182, 1892–1900. [Google Scholar] [CrossRef] [PubMed] [Green Version]
  23. Weigmann, B.; Tubbe, I.; Seidel, D.; Nicolaev, A.; Becker, C.; Neurath, M.F. Isolation and subsequent analysis of murine lamina propria mononuclear cells from colonic tissue. Nat. Protoc. 2007, 2, 2307–2311. [Google Scholar] [CrossRef] [PubMed]
  24. Pereira, P.; Gerber, D.; Huang, S.Y.; Tonegawa, S. Ontogenic development and tissue distribution of Vγ1-expressing γ/δ T lymphocytes in normal mice. J. Exp. Med. 1995, 182, 1921–1930. [Google Scholar] [CrossRef] [PubMed] [Green Version]
  25. Pereira, P.; Boucontet, L. Rates of recombination and chain pair biases greatly influence the primary γδ TCR repertoire in the thymus of adult mice. J. Immunol. 2004, 173, 3261–3270. [Google Scholar] [CrossRef] [Green Version]
  26. Dent, A.L.; Matis, L.A.; Hooshmand, F.; Widacki, S.M.; Bluestone, J.A.; Hedrick, S.M. Self-reactive γδ cells are eliminated in the thymus. Nature 1990, 343, 714–719. [Google Scholar] [CrossRef]
  27. Havran, W.L.; Grell, S.; Duwe, G.; Kimura, J.; Wilson, A.; Kruisbeek, A.M.; O’Brien, R.L.; Born, W.; Tigelaar, R.E.; Allison, J.P. Limited diversity of TCR γ-chain expression of murine Thy-1+ dendritic epidermal cells revealed by Vγ3-specific monoclonal antibody. Proc. Natl. Acad. Sci. USA 1989, 86, 4185–4189. [Google Scholar] [CrossRef] [Green Version]
  28. Goodman, T.; LeCorre, R.; Lefrancois, L. A T-cell receptor γδ-specific monoclonal antibody detects a Vγ5 region polymorphism. Immunogenetics 1992, 35, 65–68. [Google Scholar] [CrossRef]
  29. Hatano, S.; Tun, X.; Noguchi, N.; Yue, D.; Yamada, H.; Sun, X.; Matsumoto, M.; Yoshikai, Y. Development of a new monoclonal antibody specific to mouse Vγ6 chain. Life Sci. Alliance 2019, 2, e201900363. [Google Scholar] [CrossRef] [Green Version]
  30. Pereira, P.; Gerber, D.; Regnault, A.; Huang, S.Y.; Hermitte, V.; Coutinho, A.; Tonegawa, S. Rearrangement and expression of Vγ1, Vγ2 and Vγ3 TCR γ genes in C57BL/6 mice. Internat. Immunol. 1996, 8, 83–90. [Google Scholar] [CrossRef] [Green Version]
  31. Asarnow, D.M.; Kuziel, W.A.; Bonyhadi, M.; Tigelaar, R.E.; Tucker, P.W.; Allison, J.P. Limited diversity of γδ antigen receptor genes of Thy-1+ dendritic epidermal cells. Cell 1988, 55, 837–847. [Google Scholar] [CrossRef]
  32. Havran, W.L.; Chien, Y.H.; Allison, J.P. Recognition of self antigens by skin-derived T cells with invariant γδ antigen receptors. Science 1991, 252, 1430–1432. [Google Scholar] [CrossRef] [PubMed]
  33. Gerber, D.J.; Azuara, V.; Levraud, J.P.; Huang, S.Y.; Lembezat, M.P.; Pereira, P. IL-4-producing γδ T cells that express a very restricted TCR repertoire are preferentially localized in liver and spleen. J. Immunol. 1999, 163, 3076–3082. [Google Scholar]
  34. Kreslavsky, T.; Savage, A.K.; Hobbs, R.; Gounari, F.; Bronson, R.; Pereira, P.; Pandolfi, P.P.; Bendelac, A.; von Boehmer, H. TCR-inducible PLZF transcription factor required for innate phenotype of a subset of γδ T cells with restricted TCR diversity. Proc. Natl. Acad. Sci. USA 2009, 106, 12453–12458. [Google Scholar] [CrossRef] [PubMed] [Green Version]
  35. Pereira, P.; Berthault, C.; Burlen-Defranoux, O.; Boucontet, L. Critical role of TCR specificity in the development of Vγ1Vδ6.3+ innate NKTγδ cells. J. Immunol. 2013, 191, 1716–1723. [Google Scholar] [CrossRef] [PubMed] [Green Version]
  36. Kisielow, J.; Kopf, M.; Karjalainen, K. SCART scavenger receptors identify a novel subset of adult γδ T cells. J. Immunol. 2008, 181, 1710–1716. [Google Scholar] [CrossRef] [Green Version]
  37. Hamada, S.; Umemura, M.; Shiono, T.; Tanaka, K.; Yahagi, A.; Begum, M.D.; Oshiro, K.; Okamoto, Y.; Watanabe, H.; Kawakami, K.; et al. IL-17A produced by γδ T cells plays a critical role in innate immunity against Listeria monocytogenes infection in the liver. J. Immunol. 2008, 181, 3456–3463. [Google Scholar] [CrossRef] [Green Version]
  38. Haas, J.D.; Gonzalez, F.H.; Schmitz, S.; Chennupati, V.; Fohse, L.; Kremmer, E.; Forster, R.; Prinz, I. CCR6 and NK1.1 distinguish between IL-17A and IFN-γ-producing γδ effector T cells. Eur. J. Immunol. 2009, 39, 3488–3497. [Google Scholar] [CrossRef]
  39. Okamoto-Yoshida, Y.; Umemura, M.; Yahagi, A.; O’Brien, R.L.; Ikuta, K.; Kishihara, K.; Hara, H.; Nakae, S.; Iwakura, Y.; Matsuzaki, G. Essential role of interleukin-17A in the formation of a mycobacterial infection-induced granuloma in the lung. J. Immunol. 2010, 184, 4414–4422. [Google Scholar] [CrossRef] [Green Version]
  40. Gray, E.E.; Suzuki, K.; Cyster, J.G. Cutting edge: Identification of a motile IL-17-producing γδ T cell population in the dermis. J. Immunol. 2011, 186, 6091–6095. [Google Scholar] [CrossRef] [Green Version]
  41. Roark, C.L.; Huang, Y.; Jin, N.; Aydintug, M.K.; Casper, T.; Sun, D.; Born, W.K.; O’Brien, R.L. A canonical Vγ4Vδ4+ γδ T cell population with distinct stimulation requirements which promotes the Th17 response. Immunol. Res. 2013, 55, 217–230. [Google Scholar] [CrossRef] [PubMed] [Green Version]
  42. Kashani, E.; Fohse, L.; Raha, S.; Sandrock, I.; Oberdorfer, L.; Koenecke, C.; Suerbaum, S.; Weiss, S.; Prinz, I. A clonotypic Vγ4Jγ1/Vδ5Dδ2Jδ1 innate γδ T-cell population restricted to the CCR6+ CD27-subset. Nat. Commun. 2015, 6, 6477. [Google Scholar] [CrossRef] [Green Version]
  43. Ribot, J.C.; de Barros, A.; Fang, D.J.; Neves, J.F.; Peperzak, V.; Roberts, S.J.; Girardi, M.; Borst, J.; Hayday, A.C.; Pennington, D.J.; et al. CD27 is a thymic determinant of the balance between interferon-γ and interleukin 17-producing γδ T cell subsets. Nat. Immunol. 2009, 10, 427–436. [Google Scholar] [CrossRef] [Green Version]
  44. Sumaria, N.; Roediger, B.; Ng, L.G.; Qin, J.; Pinto, R.; Cavanagh, L.L.; Shklovskaya, E.; Fazekas de St Groth, B.; Triccas, J.A.; Weninger, W. Cutaneous immunosurveillance by self-renewing dermal γδ T cells. J. Exp. Med. 2011, 208, 505–518. [Google Scholar] [CrossRef] [PubMed] [Green Version]
  45. Cai, Y.; Shen, X.; Ding, C.; Qi, C.; Li, K.; Li, X.; Jala, V.R.; Zhang, H.G.; Wang, T.; Zheng, J.; et al. Pivotal role of dermal IL-17-producing γδ T cells in skin inflammation. Immunity 2011, 35, 596–610. [Google Scholar] [CrossRef] [PubMed] [Green Version]
  46. Ramirez-Valle, F.; Gray, E.E.; Cyster, J.G. Inflammation induces dermal Vγ4+ γδ T17 memory-like cells that travel to distant skin and accelerate secondary IL-17-driven responses. Proc. Natl. Acad. Sci. USA 2015, 112, 8046–8051. [Google Scholar] [CrossRef] [PubMed] [Green Version]
  47. Tan, L.; Sandrock, I.; Odak, I.; Aizenbud, Y.; Wilharm, A.; Barros-Martins, J.; Tabib, Y.; Borchers, A.; Amado, T.; Gangoda, L.; et al. Single-cell transcriptomics identifies the adaptation of Scart1(+) Vγ6(+) T cells to skin residency as activated effector cells. Cell Rep. 2019, 27, 3657–3671.e3654. [Google Scholar] [CrossRef] [PubMed] [Green Version]
  48. Kriegel, M.A.; Sefik, E.; Hill, J.A.; Wu, H.J.; Benoist, C.; Mathis, D. Naturally transmitted segmented filamentous bacteria segregate with diabetes protection in nonobese diabetic mice. Proc. Natl. Acad. Sci. USA 2011, 108, 11548–11553. [Google Scholar] [CrossRef] [Green Version]
  49. Markle, J.G.; Frank, D.N.; Mortin-Toth, S.; Robertson, C.E.; Feazel, L.M.; Rolle-Kampczyk, U.; von Bergen, M.; McCoy, K.D.; Macpherson, A.J.; Danska, J.S. Sex differences in the gut microbiome drive hormone-dependent regulation of autoimmunity. Science 2013, 339, 1084–1088. [Google Scholar] [CrossRef] [Green Version]
  50. Sorini, C.; Cosorich, I.; Lo Conte, M.; De Giorgi, L.; Facciotti, F.; Lucianò, R.; Rocchi, M.; Ferrarese, R.; Sanvito, F.; Canducci, F.; et al. Loss of gut barrier integrity triggers activation of islet-reactive T cells and autoimmune diabetes. Proc. Natl. Acad. Sci. USA 2019, 116, 15140–15149. [Google Scholar] [CrossRef] [Green Version]
  51. Ma, H.; Tao, W.; Zhu, S. T lymphocytes in the intestinal mucosa: Defense and tolerance. Cell. Mol. Immunol. 2019, 16, 216–224. [Google Scholar] [CrossRef] [PubMed] [Green Version]
  52. Huang, Y.; Heiser, R.A.; Detanico, T.O.; Getahun, A.; Kirchenbaum, G.A.; Casper, T.L.; Aydintug, M.K.; Carding, S.R.; Ikuta, K.; Huang, H.; et al. γδ T cells affect IL-4 production and B-cell tolerance. Proc. Natl. Acad. Sci. USA 2015, 112, E39–E48. [Google Scholar] [CrossRef] [PubMed] [Green Version]
  53. Huang, Y.; Getahun, A.; Heiser, R.A.; Detanico, T.O.; Aviszus, K.; Kirchenbaum, G.A.; Casper, T.L.; Huang, C.; Aydintug, M.K.; Carding, S.R.; et al. γδ T cells shape preimmune peripheral B cell populations. J. Immunol. 2016, 196, 217–231. [Google Scholar] [CrossRef] [Green Version]
  54. Daley, D.; Zambirinis, C.P.; Seifert, L.; Akkad, N.; Mohan, N.; Werba, G.; Barilla, R.; Torres-Hernandez, A.; Hundeyin, M.; Mani, V.R.; et al. γδ T cells support pancreatic oncogenesis by restraining αβ T cell activation. Cell 2016, 166, 1485–1499.e1415. [Google Scholar] [CrossRef] [PubMed] [Green Version]
  55. Herman, A.E.; Freeman, G.J.; Mathis, D.; Benoist, C. CD4+CD25+ T regulatory cells dependent on ICOS promote regulation of effector cells in the prediabetic lesion. J. Exp. Med. 2004, 199, 1479–1489. [Google Scholar] [CrossRef]
  56. Spence, A.; Tang, Q. Restoring regulatory T cells in Type 1 Diabetes. Curr. Diab. Rep. 2016, 16, 110. [Google Scholar] [CrossRef] [Green Version]
  57. Aydintug, M.K.; Zhang, L.; Wang, C.; Liang, D.; Wands, J.M.; Michels, A.W.; Hirsch, B.; Day, B.J.; Zhang, G.; Sun, D.; et al. γδ T cells recognize the insulin B: 9–23 peptide antigen when it is dimerized through thiol oxidation. Mol. Immunol. 2014, 60, 116–128. [Google Scholar] [CrossRef] [Green Version]
  58. Cai, Y.; Xue, F.; Fleming, C.; Yang, J.; Ding, C.; Ma, Y.; Liu, M.; Zhang, H.G.; Zheng, J.; Xiong, N.; et al. Differential developmental requirement and peripheral regulation for dermal Vγ4 and Vγ6 T17 cells in health and inflammation. Nat. Commun. 2014, 5, 3986. [Google Scholar] [CrossRef] [Green Version]
  59. Lu, Y.; Cao, X.; Zhang, X.; Kovalovsky, D. PLZF controls the development of fetal-derived IL-17+Vγ6+ γδ T cells. J. Immunol. 2015, 195, 4273–4281. [Google Scholar] [CrossRef] [Green Version]
  60. Nikoopour, E.; Schwartz, J.A.; Huszarik, K.; Sandrock, C.; Krougly, O.; Lee-Chan, E.; Singh, B. Th17 polarized cells from nonobese diabetic mice following mycobacterial adjuvant immunotherapy delay type 1 diabetes. J. Immunol. 2010, 184, 4779–4788. [Google Scholar] [CrossRef]
  61. Lau, K.; Benitez, P.; Ardissone, A.; Wilson, T.D.; Collins, E.L.; Lorca, G.; Li, N.; Sankar, D.; Wasserfall, C.; Neu, J.; et al. Inhibition of type 1 diabetes correlated to a Lactobacillus johnsonii N6.2-mediated Th17 bias. J. Immunol. 2011, 186, 3538–3546. [Google Scholar] [CrossRef] [PubMed] [Green Version]
  62. Bellemore, S.M.; Nikoopour, E.; Schwartz, J.A.; Krougly, O.; Lee-Chan, E.; Singh, B. Preventative role of interleukin-17 producing regulatory T helper type 17 (Treg 17) cells in type 1 diabetes in non-obese diabetic mice. Clin. Exp. Immunol. 2015, 182, 261–269. [Google Scholar] [CrossRef] [PubMed] [Green Version]
  63. Krishnan, S.; Prise, I.E.; Wemyss, K.; Schenck, L.P.; Bridgeman, H.M.; McClure, F.A.; Zangerle-Murray, T.; O’Boyle, C.; Barbera, T.A.; Mahmood, F.; et al. Amphiregulin-producing γδ T cells are vital for safeguarding oral barrier immune homeostasis. Proc. Natl. Acad. Sci. USA 2018, 115, 10738–10743. [Google Scholar] [CrossRef] [PubMed] [Green Version]
  64. Guo, X.J.; Dash, P.; Crawford, J.C.; Allen, E.K.; Zamora, A.E.; Boyd, D.F.; Duan, S.; Bajracharya, R.; Awad, W.A.; Apiwattanakul, N.; et al. Lung γδ T cells mediate protective responses during neonatal influenza infection that are associated with Type 2 immunity. Immunity 2018, 49, 531–544.e536. [Google Scholar] [CrossRef] [PubMed] [Green Version]
  65. Kohlgruber, A.C.; Gal-Oz, S.T.; LaMarche, N.M.; Shimazaki, M.; Duquette, D.; Nguyen, H.N.; Mina, A.I.; Paras, T.; Tavakkoli, A.; von Andrian, U.; et al. γδ T cells producing interleukin-17A regulate adipose regulatory T cell homeostasis and thermogenesis. Nat. Immunol. 2018, 19, 464–474. [Google Scholar] [CrossRef]
  66. Zaiss, D.M.; van Loosdregt, J.; Gorlani, A.; Bekker, C.P.; Gröne, A.; Sibilia, M.; van Bergen en Henegouwen, P.M.; Roovers, R.C.; Coffer, P.J.; Sijts, A.J. Amphiregulin enhances regulatory T cell-suppressive function via the epidermal growth factor receptor. Immunity 2013, 38, 275–284. [Google Scholar] [CrossRef] [Green Version]
  67. Kuhn, C.; Rezende, R.M.; da Cunha, A.P.; Valette, F.; Quintana, F.J.; Chatenoud, L.; Weiner, H.L. Mucosal administration of CD3-specific monoclonal antibody inhibits diabetes in NOD mice and in a preclinical mouse model transgenic for the CD3 epsilon chain. J. Autoimmun. 2017, 76, 115–122. [Google Scholar] [CrossRef]
  68. Rezende, R.M.; da Cunha, A.P.; Kuhn, C.; Rubino, S.; M’Hamdi, H.; Gabriely, G.; Vandeventer, T.; Liu, S.; Cialic, R.; Pinheiro-Rosa, N.; et al. Identification and characterization of latency-associated peptide-expressing γδ T cells. Nat. Commun. 2015, 6, 8726. [Google Scholar] [CrossRef] [Green Version]
  69. Huang, Y.; Yang, Z.; Huang, C.; McGowan, J.; Casper, T.; Sun, D.; Born, W.K.; O’Brien, R.L. γδ T cell-dependent regulatory T cells prevent the development of autoimmune keratitis. J. Immunol. 2015, 195, 5572–5581. [Google Scholar] [CrossRef] [Green Version]
  70. Nagy, N.; Kuipers, H.F.; Marshall, P.L.; Wang, E.; Kaber, G.; Bollyky, P.L. Hyaluronan in immune dysregulation and autoimmune diseases. Matrix Biol. 2019, 78–79, 292–313. [Google Scholar] [CrossRef]
  71. Li, C.R.; Mueller, E.E.; Bradley, L.M. Targeting CD44 augments the efficacy of Tregs in autoimmune diabetes. Immunol. Lett. 2015, 163, 199–205. [Google Scholar] [CrossRef] [PubMed] [Green Version]
  72. Bollyky, P.L.; Bogdani, M.; Bollyky, J.B.; Hull, R.L.; Wight, T.N. The role of hyaluronan and the extracellular matrix in islet inflammation and immune regulation. Curr. Diab. Rep. 2012, 12, 471–480. [Google Scholar] [CrossRef] [PubMed] [Green Version]
  73. Schumann, J.; Stanko, K.; Schliesser, U.; Appelt, C.; Sawitzki, B. Differences in CD44 surface expression levels and function discriminates IL-17 and IFN-γ producing helper T cells. PLoS ONE 2015, 10, e0132479. [Google Scholar]
  74. Tard, C.; Rouxel, O.; Lehuen, A. Regulatory role of natural killer T cells in diabetes. Biomed. J. 2015, 38, 484–495. [Google Scholar] [CrossRef] [PubMed]
  75. Gao, P.; Jiao, Y.; Xiong, Q.; Wang, C.Y.; Gerling, I.; Gu, W. Genetic and molecular basis of QTL of diabetes in mouse: Genes and polymorphisms. Curr. Genom. 2008, 9, 324–337. [Google Scholar] [CrossRef] [PubMed] [Green Version]
  76. Zhang, L.; Jin, N.; Nakayama, M.; O’Brien, R.L.; Eisenbarth, G.S.; Born, W.K. γδ T cell receptors confer autonomous responsiveness to the insulin-peptide B: 9–23. J. Autoimmun. 2010, 34, 478–484. [Google Scholar] [CrossRef] [Green Version]
  77. Zhang, L.; Nakayama, M.; Eisenbarth, G.S. Insulin as an autoantigen in NOD/human diabetes. Curr. Opin. Immunol. 2008, 20, 111–118. [Google Scholar] [CrossRef] [Green Version]
  78. Lang, F.P.; Pollock, B.H.; Riley, W.J.; Maclaren, N.K.; Barrett, D.J. The temporal association between γδ T cells and the natural history of insulin-dependent diabetes. J. Autoimmun. 1993, 6, 107–119. [Google Scholar] [CrossRef]
  79. Gyarmati, J.; Szekeres-Bartho, J.; Fischer, B.; Soltesz, G. Fetal type lymphocytes in insulin dependent diabetes mellitus. Autoimmunity 1999, 30, 63–69. [Google Scholar] [CrossRef]
  80. Kretowski, A.; Mysliwiec, J.; Szelachowska, M.; Turowski, D.; Wysocka, J.; Kowalska, I.; Kinalska, I. γδ T-cells alterations in the peripheral blood of high risk diabetes type 1 subjects with subclinical pancreatic B-cells impairment. Immunol. Lett. 1999, 68, 289–293. [Google Scholar] [CrossRef]
  81. Kretowski, A.; Mysliwiec, J.; Kinalska, I. Abnormal distribution of γδ T lymphocytes in Graves’ disease and insulin-dependent diabetes type 1. Arch. Immunol. Ther. Exp. 2000, 48, 39–42. [Google Scholar]
  82. Lang, F.P.; Schatz, D.A.; Pollock, B.H.; Riley, W.J.; Maclaren, N.K.; Dumont-Driscoll, M.; Barrett, D.J. Increased T lymphocytes bearing the γδ T cell receptor in subjects at high risk for insulin dependent diabetes. J. Autoimmun. 1991, 4, 925–933. [Google Scholar] [CrossRef]
  83. Zubkiewicz-Kucharska, A.; Noczynska, A. Abnormal Distribution of γδ T lymphocytes and their subsets in Type 1 diabetes. Adv. Clin. Exp. Med. 2016, 25, 665–6671. [Google Scholar] [CrossRef] [PubMed] [Green Version]
  84. Mishell, R.I.; Dutton, R.W. Immunization of dissociated spleen cell cultures from normal mice. J. Exp. Med. 1967, 67, 423–442. [Google Scholar] [CrossRef] [Green Version]
  85. Goodman, T.; Lefrancois, L. Intraepithelial lymphocytes: Anatomical site, not T cell receptor form, dictates phenotype and function. J. Exp. Med. 1989, 170, 1569–1581. [Google Scholar] [CrossRef] [Green Version]
  86. Belles, C.; Kuhl, A.L.; Donoghue, A.J.; Sano, Y.; O’Brien, R.L.; Born, W.; Bottomly, K.; Carding, S.R. Bias in the γδ T cell response to Listeria monocytogenes. Vδ6.3+ cells are a major component of the γδ T cell response to Listeria monocytogenes. J. Immunol. 1996, 156, 4280–4289. [Google Scholar]
  87. Dialynas, D.P.; Quan, Z.S.; Wall, K.A.; Pierres, A.; Quintans, J.; Loken, M.R.; Pierres, M.; Fitch, F.W. Characterization of the murine T cell surface molecule, designated L3T4, identified by monoclonal antibody GK1.5: Similarity of L3T4 to the human Leu-3/T4 molecule. J. Immunol. 1983, 131, 2445–2451. [Google Scholar]
  88. Unkeless, J.C. Characterization of a monoclonal antibody directed against mouse macrophage and lymphocyte Fc receptors. J. Exp. Med. 1979, 150, 580–588. [Google Scholar] [CrossRef] [Green Version]
  89. O’Brien, R.L.; Fu, Y.-X.; Cranfill, R.; Dallas, A.; Reardon, C.; Lang, J.; Carding, S.R.; Kubo, R.; Born, W. Heat shock protein Hsp-60 reactive γδ cells: A large, diversified T lymphocyte subset with highly focused specificity. Proc. Natl. Acad. Sci. USA 1992, 89, 4348–4352. [Google Scholar] [CrossRef] [Green Version]
Figure 1. The γδ T cell repertoire in lymphoid organs of NOD mice compared to that of C57BL/6 (B6) mice. γδ T cells from individual NOD vs. B6 mice were characterized by flow cytometry, and compared within age and sex-matched groups. Young mice were between 7–10 weeks of age, older mice were between 12–34 weeks of age. For each group, samples from 4–12 mice were analyzed. (A). The mean percent of γδ T cells in spleen (left panel) and average number of γδ T cell obtained per spleen (right panel). (B). The average number of Vγ1+ (left) and Vγ4+ cells (right) recovered from each spleen. (C). The mean percentage of each Vγ-defined γδ T cell subset is shown as a fraction of all γδ TCR+ cells, in spleen (left) and pancreatic lymph node (right). Here, and in subsequent figures, sgnifcant differences are designated as: * p < 0.05, ** p < 0.01, *** p < 0.001, and **** p < 0.0001.
Biomolecules 12 01406 g001
Figure 2. Subpopulations within the Vγ1+ and Vγ4+ subsets in NOD vs. B6 mice. For each group in (AC), samples from 4–12 individual mice were analyzed by flow cytometry. For (DE), spleen cells were nonspecifically stimulated with PMA/ionomycin before staining for flow cytometry; samples from 6–13 mice were analyzed for each group. (A). Mean percent of Vγ1+ cells co-expressing Vδ6.3 in spleen (left) and pancreatic lymph nodes (center), and average number of Vγ1Vδ6.3 cells recovered from spleens in each group (right). (B). Mean percent of Vγ4+ cells expressing CD27 in spleen (left) and pancreatic lymph nodes (center), and average number of CD27+ Vγ4+ cells recovered from spleen (right). (C). Average number of CD27- Vγ4+ cells recovered from each spleen. (D). Numbers of spleen cells that expressed IFNγ for each sample, within Vγ1+ cells (left), and Vγ4+ cells (right). (E). Number of Vγ4+ spleen cells expressing IL-17 for each sample. * p < 0.05, ** p < 0.01, *** p < 0.001, and **** p < 0.0001.
Biomolecules 12 01406 g002
Figure 3. The γδ T cell repertoire in skin-draining lymph nodes of NOD and B6 mice. Results of samples from 4–12 individual mice were analyzed by flow cytometry for each group. (A). The mean percentage of each Vγ-defined γδ T cell subset is shown for each group, as a fraction of all γδ TCR+ cells within skin-draining lymph nodes. (B). The mean percentage of Vγ4+ cells that failed to stain with CD27 is shown for each group as a fraction of all Vγ4+ cells (left), and the average number of CD27- Vγ4+ cells obtained per mouse from the 4 pooled skin-draining lymph nodes (right). (C). Average numbers of CD27+ Vγ4+ cells obtained from 4 pooled skin-draining lymph nodes. * p < 0.05, ** p < 0.01, *** p < 0.001, and **** p < 0.0001.
Biomolecules 12 01406 g003
Figure 4. Comparison of colon intraepithelial lymphocyte (IEL) derived T cells in NOD vs. B6 mice. Results for samples from 3–7 mice per group analyzed by flow cytometry, except for C in which only 2 old B6 males, 2 old NOD females, and 1 old NOD male were available for the analysis (errors bars for old B6 male and old NOD female groups show the range obtained rather than the sample standard deviation). (A). The mean percentage of each of four Vγ-defined γδ T cell subsets as a fraction of all γδ TCR+ cells, among the IELs obtained from individual colons. (B). Within each group, the mean percentage of CD27+ cells was relatively low for colon IELs of the Vγ1, Vγ4, Vγ7, and Vγ6 subsets. Scale matches that used in C. (C). Within each group, the mean percentage of CD8α+ cells for colon IELs of the Vγ1, Vγ4, Vγ7, and Vγ6 subsets was generally higher in NOD mice than in matched B6 controls. * p < 0.05, ** p < 0.01, and **** p < 0.0001.
Biomolecules 12 01406 g004
Figure 5. The incidence of spontaneous diabetes in γδ T cell subset-deficient NOD mice. Mice were monitored weekly for non-fasting blood glucose levels. Kaplan–Meier plots for each strain show the percent of the mice that had tested positive for diabetes by the indicated week of age, tested between 13–30 weeks of age, for males (left) and females (right). For each group, 38–46 mice were analyzed. (A). Results from male and female NOD.TCRδ-/- mice and NOD.Vγ4/6-/- mice juxtaposed to those from wt NOD controls during a similar time period. (B). Results from male and female NOD.Vγ4-/- and NOD.Vγ1-/- mice juxtaposed to those from the wt NOD controls during a similar time period. * p < 0.05, ** p < 0.01, *** p < 0.001, **** p < 0.0001, ns: not significant.
Biomolecules 12 01406 g005
Figure 6. The mean percentage of Tregs present among CD4+ αβ T cells in the pancreatic lymph nodes of NOD-background γδ T cell subset-deficient vs. wt NOD mice. Results from mice with recent-onset diabetes were compared to both young and older sex-matched mice, within and between strains. For each group, samples from 3–16 mice were analyzed by flow cytometry, except for two groups, diabetic male NOD.Vγ1-/- mice and diabetic male NOD.TCRδ-/- mice, in which diabetes generally developed very rarely and only 2 mice were available (errors bars for these 2 groups show the range obtained rather than the sample standard deviation). * p < 0.05, ** p < 0.01, *** p < 0.001, and **** p < 0.0001.
Biomolecules 12 01406 g006
Figure 7. Analysis of γδ in the spleens of NOD-Vγ-deficient mouse strains, compared to those of wt NOD controls. See Figure 6 legend for description of mice used. (A). Average number of γδ T cells obtained per spleen. (B). The average number of cells obtained of each Vγ-defined γδ T cell subset from spleens. (C). Mean percentage of spleen Vγ1+ γδ T cells that co-expressed Vδ6.3. * p < 0.05, ** p < 0.01, *** p < 0.001, and **** p < 0.0001.
Biomolecules 12 01406 g007
Figure 8. The γδ T cell percentage in skin draining and pancreatic lymph nodes of NOD-background γδ T cell subset-deficient vs. wt NOD mice. For each group, results of samples from 3–12 mice were analyzed. Results from skin-draining lymph nodes (top) and pancreatic lymph nodes (bottom) are shown. * p < 0.05, ** p < 0.01, *** p < 0.001, and **** p < 0.0001.
Biomolecules 12 01406 g008
Figure 9. The γδ cells remaining in NOD-background γδ T cell subset-deficient vs. wt NOD mice among colon IELs. For (AC), samples from 3–14 individual mice were analyzed per group, except in C where only a single male NOD and a single male NOD.Vγ4-/- mouse were available for the analysis. (A). The average number of cells obtained for each Vγ-defined γδ T cell subset, in colon IELs. (B). The mean percentage of CD8α+ cells in four Vγ-defined γδ T cell subsets, among colon IELs. (C). Mean percentages of colon Vγ4+ IELs (left) and colon Vγ6+ IELs that express high levels of CD44. Bars in a lighter hue denote data from a single mouse, and are shown for comparison. * p < 0.05, ** p < 0.01, *** p < 0.001, and **** p < 0.0001.
Biomolecules 12 01406 g009
Publisher’s Note: MDPI stays neutral with regard to jurisdictional claims in published maps and institutional affiliations.

