Abstract
Glaucomatous optic neuropathy is a common cause for blindness. An elevated intraocular pressure is the main risk factor, but also a contribution of the immune system seems likely. In the experimental autoimmune glaucoma model used here, systemic immunization with an optic nerve homogenate antigen (ONA) leads to retinal ganglion cell (RGC) and optic nerve degeneration. We processed retinae for quantitative real-time PCR and immunohistology 28 days after immunization. Furthermore, we performed mRNA profiling in this model for the first time. We detected a significant RGC loss in the ONA retinae. This was accompanied by an upregulation of mRNA expression of genes belonging to the heat shock protein family. Furthermore, mRNA expression levels of the genes of the immune system, such as C1qa, C1qb, Il18, and Nfkb1, were upregulated in ONA animals. After laser microdissection, inner retinal layers were used for mRNA microarrays. Nine of these probes were significantly upregulated in ONA animals (p < 0.05), including Hba-a1 and Cxcl10, while fifteen probes were significantly downregulated in ONA animals (p < 0.05), such as Gdf15 and Wwox. Taken together, these findings provide further insights into the pivotal role of the immune response in glaucomatous optic neuropathy and could help to identify novel diagnostic or therapeutic strategies.
1. Introduction
Among adults, one of the most common causes for visual impairment is glaucoma [1,2]. In this disease, a loss of retinal ganglion cells (RGCs) and optic nerve degeneration lead to progressive visual field loss, which, untreated, can end in blindness [3].
Although elevated intraocular pressure (IOP) is a major risk factor, other mechanisms seem also to be responsible for the onset and progression of glaucomatous damage. Around 30–40% of Caucasians develop glaucoma with an IOP in the normal range [4,5]. At the molecular level, it has clearly been shown that oxidative stress [6], ischemia [7,8], or excitotoxicity [9,10] contribute to the neurodegenerative processes. Furthermore, immunological alterations seem to play a crucial role in the pathogenesis of glaucoma [11,12]. For example, several heat shock proteins (HSPs), such as HSP27, HSP60, or αA- and αB-crystallin, were upregulated in patients diagnosed with normal-tension glaucoma [13,14]. Furthermore, an enhanced immunoreactivity against HSP27 and HSP60 antibodies was observed in human donor retinae from patients with and without elevated IOP compared to respective controls [15]. Among other functions, HSPs can stimulate both the innate and the adaptive immune system [16,17]. As part of the innate immune response, activation of the complement system can be observed in glaucoma patients. For instance, the complement factor 3 (C3) is upregulated in the aqueous humor of patients with primary open-angle glaucoma (POAG), particularly in those during disease progression [18,19]. Moreover, complement proteins, including C3 or proteins associated with the lectin pathway, were found in retinae and sera of POAG patients [6,20].
To determine the relation of an altered immune response and glaucomatous optic neuropathy more precisely, the experimental autoimmune glaucoma model (EAG) was established. In this model, systemic immunization with ocular antigens, such as the optic nerve homogenate antigen (ONA) or HSP27, led to optic nerve and RGC degeneration in rats as well as in mice [21,22,23,24]. This was accompanied by an activation of the immune system, particularly, a complement and microglia response [21,22,25].
Interestingly, we were able to make these observations not only on protein, but also on an mRNA level. For example, two weeks after ONA immunization, an upregulation of C3 as well as of phosphacan (Ptprz1), part of the extracellular matrix, could be detected using RT-qPCR [25,26].
To underline our previous findings, DNA microarray analysis was performed. This “top-down” approach enables the investigation of altered gene expression on a primary molecular level. For the first time, primary mRNA alterations that may play a role in the development of glaucomatous optic neuropathy were identified here in a pressure independent EAG model. Overall, our remarkable results may contribute to the development of glaucoma disease markers and novel therapies.
2. Materials and Methods
2.1. Animals and Immunizations
Animal experiments and animal care procedures adhered to the ARVO Statement for Use of Animals in Research and the animal care committee of North Rhine-Westphalia (approval codes: 84-02.04.2013.A291 and 81-02.04.2018.A071). In this study, six-week-old male Lewis rats (Charles River; Sulzfeld, Germany) were included. All animals had unlimited access to food and water and were kept on a light–dark cycle (12 h:12 h). Health checks and eye exams were performed regularly.
Systemic immunization of rats was performed as described previously [27] (Figure 1A). Rats received an intraperitoneal injection with 8 mg/mL ONA mixed with incomplete Freund’s adjuvant (500 µL) plus 3 µg pertussis toxin (both Sigma Aldrich, St. Louis, MO, USA) [28]. The animals of the control group were injected with a sodium chloride solution in Freund’s adjuvant and pertussis toxin. Animals were sacrificed 28 days after immunization.
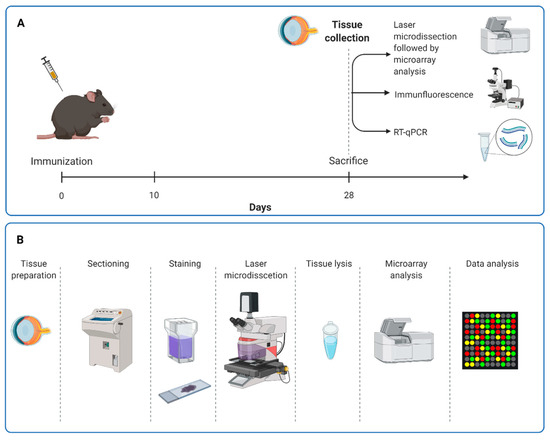
Figure 1.
Study design. (A) Rats received an intraperitoneal injection with ONA or sodium chloride solution. At 28 days after immunization, the animals were sacrificed, and laser microdissection of the retina followed by microarray analyses were performed. Furthermore, immunohistological staining and RT-qPCR analyses were carried out. (B) For microarray analyses, eyes were removed and retinal cross-sections provided. Cresyl violet staining was used to visualize retinal layers, especially neuronal cells. GCL, IPL, and INL were labeled and dissected out by a laser. After dry collection, RNA was isolated for microarray analysis. GCL = ganglion cell layer; IPL = inner plexiform layer; INL = inner nuclear layer.
2.2. Electroretinography
At 28 days after immunization, electroretinogram (ERG) measurements were performed (n = 8 eyes/group). Therefore, rats were dark-adapted the night before the analyses. The function of the retina was monitored using full-field flash electroretinography (HMsERG system; OcuScience, Henderson, NV, USA) [8,28]. Scotopic flash ERGs were recorded at 0.1, 0.3, 1, 3, 10, and 25 cd.s/m2. Signals obtained from the corneal surface were amplified, digitized, averaged, and stored using commercial software (ERGView 4.380R; OcuScience) for later analysis. Data were filtered with 50 Hz before evaluating amplitudes of the a- and b-wave and statistical analyses were performed using Statistica (V13; Dell, Tulsa, OK, USA).
2.3. Quantitative Real-Time PCR
For RNA preparation, retinae were isolated and transferred to lysis buffer containing 2-mercaptoethanol (Sigma-Aldrich, n = 3–4 eyes/group). Total RNA was extracted using the GeneElute Mammalian Total RNA Miniprep Kit according to the manufacturer’s instructions (Sigma-Aldrich) and digested with RNase-free DNase I (Sigma-Aldrich). Quality and quantity of RNA were determined using a NanoDrop ONE (Thermo Fisher Scientific, Waltham, MA, USA). Total RNA (1 µg) was used for reverse transcription using a cDNA synthesis kit (Thermo Fisher Scientific).
Designed oligonucleotides are listed in Table 1. Real-time PCR (PikoReal RT-qPCR Cycler, Thermo Fisher Scientific) analyses were performed using DyNAmo Flash SYBR Green (Thermo Fisher Scientific). Oligonucleotide concentration was optimized to a final concentration of 200 nM and combined with 200 ng of retinal cDNA per well. Two reactions were set up per RNA sample (duplicates) with an end volume of 20 µL per single reaction. Each RT-qPCR was performed in duplicates from each retina (n = 3–4/group). The average threshold cycle (Ct) values of the two independent sets were used to calculate the ratios for the target genes. The Ct values of two reference genes (Actb and Ppid) were considered [28].

Table 1.
Sequences of oligonucleotide pairs. The listed primer pairs were used in quantitative real-time PCR experiments, while Actb and Ppid served as housekeeping genes. The predicted amplicon sizes are given. F = forward, R = reverse, bp = base pair.
2.4. Immunohistology of Retinal Sections
After 28 days, eyes were enucleated and fixed for 1 h in 4% paraformaldehyde (n = 7 eyes/group). Following a 30% sucrose treatment, they were embedded in Tissue Tek (Thermo Fisher Scientific). Cross-sections (10 µm thickness) were cut with a cryostat and mounted onto Superfrost Plus (both Thermo Fisher Scientific) or Histobond slides (Paul Marienfeld GmbH&Co KG., Lauda-Königshofen, Germany) for further immunohistological analysis.
Specific immunofluorescent antibodies were used to identify the different cell types in the retina (n = 7/group). Concisely, retinal sections were blocked with a solution containing 20% donkey serum/10% goat serum, and 0.1–0.2% Triton-X in PBS. Then, 1% bovine serum albumin was added in specific stains. The primary antibodies were incubated overnight at room temperature (Table 2). Incubation with corresponding secondary antibodies was performed for 1 h the next day (Table 2). Nuclear staining with 4′,6-diamidino-2-phenylindole (DAPI) was carried out for better orientation on the slides. Negative controls for all stains were obtained by only applying the secondary antibodies.
Table 2.
Primary and secondary antibodies used for immunohistology.
2.5. Evaluation of Immunohistological Stainings
Images of retinal cross-sections were acquired using an Axio Imager M2 microscope (Zeiss, Oberkochen, Germany). Per cross-sections, four images (two central and two peripheral) were taken. Subsequently, equal areas of each image were cut out (Corel Paint Shop Pro X8, Corel Corporation, Ottawa, ON, Canada). Furthermore, the number of RBPMS+, C1q+, and NFκB+ cells was counted in the ganglion cell layer (GCL) using ImageJ software (National Institute of Health, Bethesda, MD, USA).
The positive staining area of GFAP and HSP25 was measured using an ImageJ macro as described previously [29,30]. Briefly, images were transferred into grayscale (32-bit) and a defined rolling ball radius (GFAP and HSP25: 50 pixels) was subtracted to minimize background interference. Furthermore, a suitable lower threshold was determined for each picture, which was achieved when the grey scale picture corresponded to the original one. At the end, the mean value was calculated, and this number was used for the final analyses (GFAP: 11.11; HSP25: 17.59). The upper threshold was set as the highest number out of all pictures (GFAP and HSP25: 255.00). Between these defined lower and upper thresholds, the percentage of the labeled area was measured.
2.6. Sample Preparation for mRNA Microarrays
All operational steps were performed under sterile RNAse free conditions. After enucleation, the eyes were immediately frozen in liquid nitrogen. To obtain retinal cross-sections, the frozen eye was placed on a platelet with the help of NEG-50 Tissue Tek medium (Thermo Fisher Scientific, Waltham, MA, USA). Then, 20 μm thick cross-sections were cut using a cryostat with a fixed knife holder (−24 °C object temperature and −20 °C chamber temperature; Thermo Fisher Scientific) and taken up on 1.0 PET NF membrane slides optimized for laser microdissection (Zeiss) and dried for 2 min by −20 °C. Sections were stored at −80 °C until further use. Subsequently, sections were stained using cresyl violet as described in detail before by Aring et al. 2018 [31]. Briefly, the tissue was dipped in 70% ethanol for 2 min. Then, the tissue was first immersed in a cresyl violet staining solution (1% (w/v) cresyl violet in 50% ethanol) and then, in 100% ethanol for 30 s (Figure 1B).
The laser microdissection was performed as described before by Plum et al., 2016, with minor changes (n = 3 eyes/group) [32]. With the use of the bright field microscope of the laser microdissection device (PALM Micro Beam, P.A.L.M.-System, Zeiss), the retinal layers of interest (GCL, inner plexiform layer (IPL) and inner nuclear layer (INL)) were marked using software supplied by the manufacturer (PALMRobo 4.6 pro, Zeiss). Then, a reaction tube (AdhesiveCap 500 opaque, Zeiss) was applied to the instrument and directly placed above the slide. The retinal regions of interest were cut and catapulted with a laser into the sample cap. Finally, the samples contained about 13,000.00 µm2 of retinal tissue. The collected tissue was removed from the lid of the reaction tube with the help of a lysis buffer (RNAqueous Micro Kit, Ambion, now Thermo Fisher Scientific). After placing the 10 µL buffer on the surface of the cap, the reaction tube was closed and turned upside down for 30 min to allow the buffer to detach the cut material from the silicone layer. After the incubation time, the sample was shortly centrifuged down and frozen until further processing. In order to perform microarray analysis, the RNA was isolated using the RNAqueous Micro Kit according to the manufacturer’s instructions and stored at −80 °C until further usage (Figure 1B).
2.7. Microarray Analyses
For microarray analyses, we followed the steps as described previously by Puscz et al. [33]. Each RNA sample (100 ng) was hybridized to Agilent whole-genome expression microarrays (Rat GE 4x44K, v3 G2514F, AMADID 028282, Agilent Technologies, Santa Clara, CA, USA). The next steps, including RNA labeling, hybridization, and washing, were carried out according to the instructions of the manufacturer. A DNA microarray scanner (Agilent G2505C) was used to acquire images of the hybridized microarrays. Subsequently, features were extracted using the Agilent Feature Extraction image analysis software (AFE; version A.10.7.3.1) with default protocols and settings. The generated single intensity measure for each feature, referred to as the total gene signal (TGS), was used for further data analyses using the GeneSpring GX software package (Version 14.9.1). AFE–TGS were normalized by the quantile method and data were than filtered on normalized expression values.
Duplicates were carried out for each sample. To identify differentially expressed genes, we included only entities where at least 4 out of the total number of samples had values within the selected cut-off (50th–100th percentile) for subsequent data analysis process. This resulted in 345 differentially expressed genes (GeneSpring GX software package version 14.9.1). At the end, only mRNAs with a p-value below p < 0.050 were further considered in the microarray analysis (Supplement Table S1).
2.8. Statistics
For RT-qPCR analyses, the relative expression values were presented as median ± quartile ± minimum/maximum. Data were assessed by Pairwise Fixed Reallocation Randomization Test© using REST© software (Qiagen, Hilden, Germany) [34]. ERG and immunohistology data are presented as mean±SEM unless otherwise noted. Microarray data are shown as normalized fluorescence intensity. The ONA group was compared to the controls using two-tailed Student’s t-test using Statistica. P-values below p < 0.05 were considered statistically significant with * p < 0.05; ** p < 0.01, and *** p < 0.001.
3. Results
3.1. No Functional Alterations after Immunization, but Loss of Retinal Ganglion Cells
ERG measurements were performed in control as well as ONA animals 28 days after immunization. The results revealed that the a-wave amplitude, reflecting the photoreceptor response, was not altered at any light intensity between both groups (p > 0.05; Figure 2A). Furthermore, the amplitudes of the b-wave, which reflect the inner nuclear layer response, were not different between control and ONA animals at all measured light intensities (p > 0.05; Figure 2B).
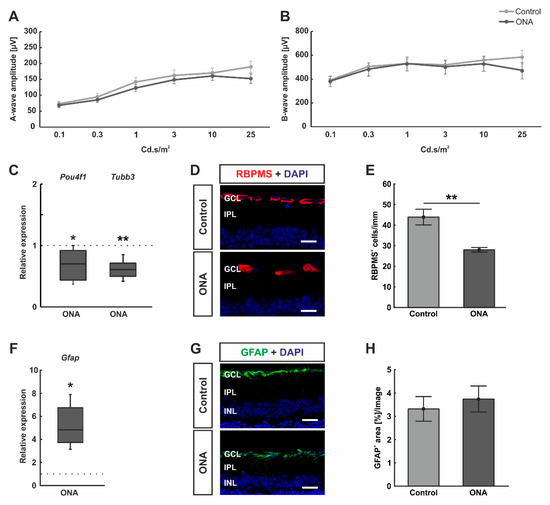
Figure 2.
No functional alteration, but loss of retinal ganglion cells after immunization. (A) Electrophysiological analyses were performed 28 days after ONA immunization. The response of the photoreceptors is depicted as the a-wave amplitude. At all measured light intensities, the a-wave amplitudes did not differ between ONA and control animals. (B) In addition, the b-wave amplitudes, which reflect the response of the inner nuclear cells, were not altered in ONA retinae compared to control ones at all light intensities. (C) RT-qPCR analyses revealed a significant downregulation of Pou4f1 (p = 0.036) and Tubb3 mRNA expression levels (p = 0.006) in ONA rats. (D) RGCs were labelled against anti-RBPMS (red) and cell nuclei were counterstained with DAPI (blue). (E) The number of RGCs were significantly decreased in ONA animals compared to controls (p = 0.004). (F) Gfap mRNA expression levels were significantly upregulated after ONA immunization (p = 0.027). (G) Retinal cross-sections were stained against anti-GFAP (astrocytes; green) and DAPI (cell nuclei; blue). (H) The GFAP+ staining area was not altered between ONA and control animals. Scale bars: 20 µm. GCL = ganglion cell layer; IPL = inner plexiform layer; INL = inner nuclear layer. Values for RT-qPCR are median ± quartile ± minimum/maximum and values for ERG and immunofluorescence are mean ± SEM. The dotted lines in (C,F) represent the relative expression of the control group. * p < 0.05, ** p < 0.01.
Furthermore, the mRNA expression levels of Pou4f1 and Tubb3 (marker for RGCs) were investigated. We could demonstrate a significant downregulation of Pou4f1 (0.70-fold expression; p = 0.036) and Tubb3 mRNA levels (0.61-fold expression; p = 0.006; Figure 1C) in ONA retinae. Additionally, the number of RGCs was elaborated using a specific anti-RBPMS staining (Figure 2D). A significant decrease of RBPMS+ RGCs was detected in ONA animals (28.08 ± 1.11 cells/mm) compared to controls (43.90 ± 3.81 cells/mm; p = 0.002; Figure 2E).
In addition, RT-qPCR analyses revealed an upregulation of Gfap mRNA expression levels in ONA rats (4.83-fold expression; p = 0.027; Figure 2F). Astrocytes were further evaluated by staining against anti-GFAP (Figure 2G). The GFAP+ staining area revealed no differences between the ONA (3.74 ± 0.57 area [%]/image) and control animals (3.32 ± 0.53 area [%]/image; p = 0.594; Figure 2H).
3.2. Regulation of HSPs after ONA Immunization
The mRNA expression levels of different HSPs were examined by RT-qPCR analyses. The relative expression of Hspb1 (HSP27) was significantly upregulated in ONA retinae (2.69-fold expression; p = 0.036). In addition, the mRNA expression of Dnajb1 (HSP40; 2.53-fold expression; p = 0.038) and Hspa4 (HSP70; 2.59-fold expression; p < 0.001) were upregulated in ONA animals compared to controls. Hsp90aa1 (HSP90) mRNA expression, on the other hand, was not altered after ONA immunization (1.33-fold expression; p = 0.102; Figure 3A).
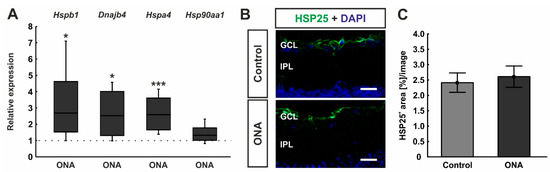
Figure 3.
Upregulation of heat shock proteins after immunization. (A) The relative expression of Hspb1 (HSP27) was significantly upregulated in ONA retinae (p = 0.036). In addition, the mRNA expression of Dnajb1 (HSP40; p = 0.038) and Hspa4 (HSP70; p < 0.001) were upregulated in ONA retinae compared to controls. The mRNA expression levels of Hsp90aa1 (HSP90) were not altered after ONA immunization. (B) Retinal cross-sections were labelled against anti-HSP25 (green; rat homologue for HSP27), while cell nuclei were counterstained with DAPI (blue). (C) The HSP25+ area was similar in ONA and control animals. Scale bars: 20 µm. GCL = ganglion cell layer; IPL = inner plexiform layer. Values for RT-qPCR are median± quartile ± minimum/maximum and values for immunofluorescence are mean ± SEM. The dotted line in (A) represents the relative expression of the control group. * p < 0.05, *** p < 0.001.
3.3. Involvement of Classical Complement Pathway
RT-qPCR analyses of classical pathway components showed a trend towards an upregulation in the mRNA expression levels of C1qa in the ONA retinae (1.42-fold expression; p = 0.052). A significant upregulation of C1qb mRNA expression was noted in ONA rats (2.59-fold expression; p = 0.037; Figure 4A).
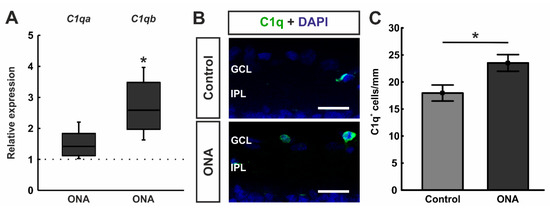
Figure 4.
Enhancement of classical pathway components. (A) RT-qPCR analyses revealed a trend towards an upregulation in the mRNA expression levels of C1qa in ONA retinae (p = 0.052), while a significant upregulation of C1qb mRNA expression levels was detected in ONA animals (p = 0.037). (B) A C1q antibody was applied to retinal cross-section (green). DAPI counterstained cell nuclei (blue). (C) We noted significantly more C1q+ cells in the GCL of ONA animals compared to controls (p = 0.023). Scale bars: 20 µm. GCL = ganglion cell layer; IPL = inner plexiform layer. Values for RT-qPCR are median ± quartile ± minimum/maximum and values for immunofluorescence are mean ± SEM. The dotted line in (A) represents the relative expression of the control group. * p < 0.05.
3.4. Increased Inflammatory Cytokines
Different inflammatory cytokines were elaborated in RT-qPCR analyses. The mRNA expression levels of Il11 tended towards an upregulation after ONA immunization (1.57-fold expression; p = 0.068). A significant upregulation was noted in the mRNA expression levels of Il18 (1.83-fold expression; p = 0.029) as well as Il33 (1.41-fold expression; p = 0.041; Figure 5A).
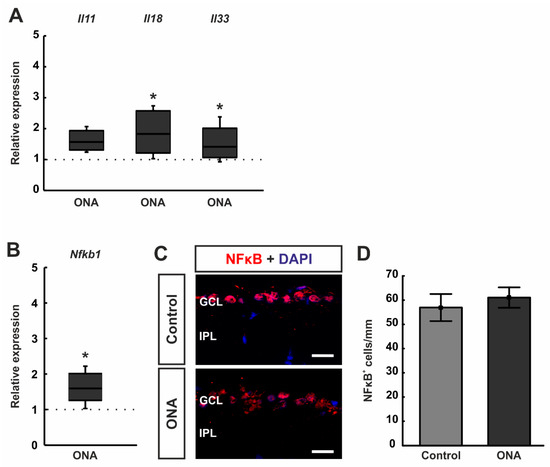
Figure 5.
Upregulation of inflammatory cytokines. (A) The mRNA expression levels of Il11 tended towards an upregulation after ONA immunization (p = 0.068). A significant upregulation was noted in the mRNA expression levels of Il18 (p = 0.029) and Il33 (p = 0.041) in ONA retinae. (B) RT-qPCR analyses of Nfkb1 mRNA levels revealed a significant upregulation in ONA retinae (p = 0.012). (C) Retinae were stained against anti-NFκB (green), while DAPI (blue) labelled cell nuclei. (D) The number of NFκB+ cells were not altered between both groups. Scale bars: 20 µm. GCL = ganglion cell layer; IPL = inner plexiform layer. Values for RT-qPCR are median ± quartile ± minimum/maximum and values for immunofluorescence are mean ± SEM. The dotted lines in (A,B) represent the relative expression of the control group. * p < 0.05.
Additionally, RT-qPCR analyses of mRNA levels of the transcription factor Nfkb1 revealed a significant upregulation in the ONA retinae (1.59-fold expression; p = 0.012; Figure 5B).
3.5. Regulated Genes in Microarray Analysis
RNA was isolated from the inner layers (GCL, IPL, and INL) of individual retinae from both groups. T-test (p < 0.050) revealed 24 significant expression differences between the ONA and control animals. Nine of these probes were upregulated (Table 3; Figure 6) in EAG animals, while fifteen were downregulated (Table 4; Figure 7).
Table 3.
Oligonucleotide probes, which were found upregulated in ONA animals.
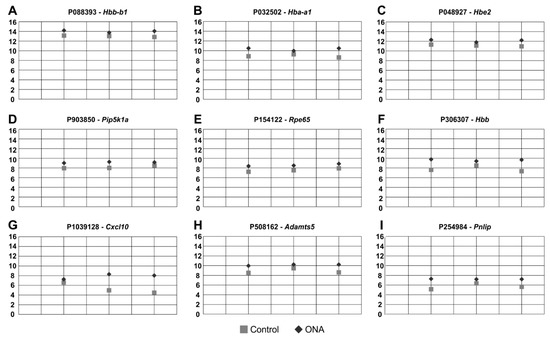
Figure 6.
Upregulated oligonucleotide probes. (A–I) These nine oligonucleotide probes were found upregulated in ONA animals following microarray analysis of the inner retinal layers. All plots display the normalized fluorescence intensity (y-axis) of ONA and control animals (x-axis).
Table 4.
Oligonucleotide probes, which were found downregulated in ONA animals.
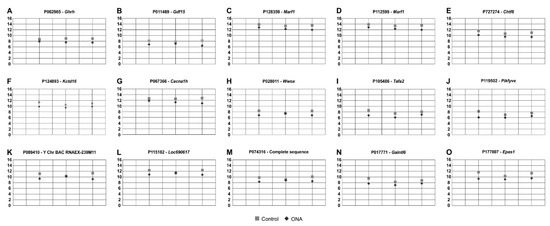
Figure 7.
Downregulated regulated oligonucleotide probes. (A–O) The 15 oligonucleotide probes found downregulated in ONA rats following microarray analysis of the inner retinal layers. All plots display the normalized fluorescence intensity (y-axis) of ONA and control animals (x-axis).
Based on the results of the microarray assays, we performed additional RT-qPCR analyses of the most up- and downregulated genes (p < 0.05). Amongst others, Hba-a1 (p = 0.006), Hbe2 (p = 0.009), and Cxcl10 (p = 0.039) were found upregulated in the ONA retinae in the microarray analysis.
RT-qPCR analysis revealed no alterations in mRNA expression levels of Hba-a1 in ONA retinae (0.64-fold expression; p = 0.202; Figure 8A). Additionally, Hbe2 mRNA expression levels were unaltered after ONA immunization (2.28-fold expression; p = 0.204; Figure 8B). An upregulation of the mRNA expression levels of Cxcl10 was found in the ONA group in RT-qPCR experiments (2.33-fold expression; p = 0.033; Figure 8C).
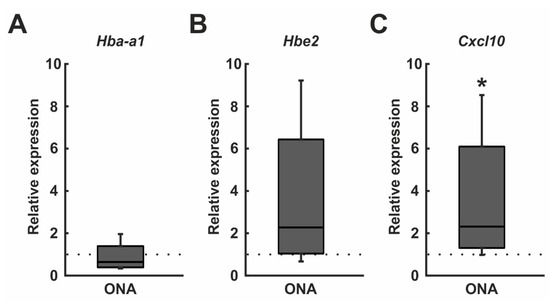
Figure 8.
Cxcl10 upregulation. (A) RT-qPCR analyses revealed no differences in the Hba-a1 mRNA levels in ONA retinae. (B) The mRNA expression levels of Hbe2 were unaltered after ONA immunization. (C) An upregulation of the Cxcl10 mRNA expression levels was found in the ONA group (p = 0.033). Values are median ± quartile ± minimum/maximum. The dotted lines represent the relative expression of the control group. * p < 0.05.
As mentioned, in the microarray assays, 15 oligonucleotide probes were downregulated in the ONA retinae, for example Ghrh (p = 0.002), Gdf15 (p = 0.011), and Wwox (p = 0.030; Table 4; Figure 7).
The subsequent RT-qPCR analyses of Ghrh mRNA levels revealed a trend towards a downregulation in the ONA retinae (0.35-fold expression; p = 0.074; Figure 9A). After ONA immunization, the mRNA expression levels of Gdf15 were significantly decreased (0.12-fold expression; p = 0.016; Figure 9B). It was also found that the mRNA expression levels of Wwox were downregulated in the ONA group (0.24-fold expression; p = 0.002; Figure 9C).
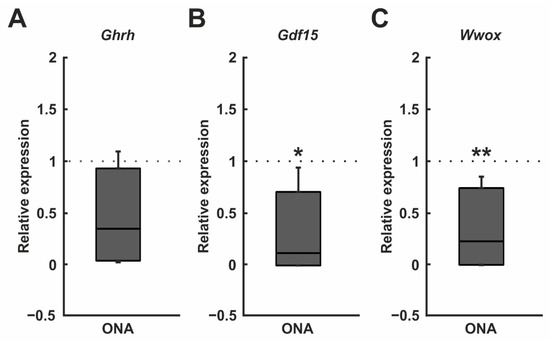
Figure 9.
Downregulation of Gdf15 and Wwox. (A) RT-qPCR analyses of Ghrh mRNA levels revealed no significant differences between both groups. (B) The mRNA expression levels of Gdf15 were downregulated in the ONA samples (p = 0.016). (C) A downregulation of the Wwox mRNA expression was detected in the ONA group (p = 0.002). Values are median ± quartile ± minimum/maximum. The dotted lines represent the relative expression of the control group. * p < 0.05, ** p < 0.01.
4. Discussion
Glaucoma is currently the second most common cause of blindness worldwide and occurs mainly in the elderly [35]. Due to an aging society, there will be an increase of severe visual impairment and blindness in the coming years. By 2040, the projected number of people suffering from glaucoma will rise to about 7.8 million in Europe alone [36]. For this reason, there is an urgent need for developing curative therapies. Currently, only symptomatic, but no disease-modifying treatment options are available. The treatment focus has been on IOP lowering. However, there are also glaucoma forms without elevated IOP, or patients treated with IOP-lowering therapy that still show disease progression. In addition, medical IOP-lowering treatment has serious side effects which leads to poor patient compliance [37]. To identify novel treatment options in the future, a better understanding of underlying pathomechanisms is needed.
As shown previously, ONA immunization in rats leads to a loss of RGCs after 28 days [21,24], which was also observed in the current study. Retinal function, measured with ERG, was not altered in the ONA animals. However, the function of RGCs should be investigated in future studies by using either pattern ERG or the photopic negative response as both techniques are better suited for this purpose. The decline of RGCs in the ONA group in our study was accompanied by a significant upregulation of Gfap mRNA levels, while the measured GFAP+ area was not altered. Noristani et al. showed significantly more GFAP protein using Western blot, but not by immunohistological staining 28 days after ONA immunization [21]. Moreover, in the transgenic “Connective Tissue Growth Factor” (CTGF) POAG mouse model, alterations in the GFAP expression could only be observed by RT-qPCR [38]. It seems that for analyses of macroglia, the evaluation of antibody staining is not sufficient to detect changes. Nonetheless, the increase in Gfap mRNA levels revealed a possible reactive gliosis, which occurs in many retinal diseases [39,40,41].
In the EAG model, a wide range of the immune responses have already been investigated. The study results include an activation of microglia and the complement system [21,25]. Furthermore, HSPs were reported to be involved in glaucomatous neurodegeneration in the EAG model [23,30,42]. HSPs belong to a superfamily of stress proteins. The superfamily can be subdivided into several subfamilies, based on their molecular weight. Primarily, HSPs occur under physiological conditions as chaperones and can have antiapoptotic activities [43,44]. Furthermore, they can stimulate the innate as well as the adaptive immune system [16,17]. In our study, an upregulation of HSP27 (Hspb1), HSP40 (Dnaj4), and HSP70 (Hspa4) was noted in ONA retinae 28 days after immunization. Generally, HSPs are thought to have protective functions, such as stabilization of proteins and the reduction of apoptosis [45]. HSP70 is one of the larger proteins found in the cytosol, endoplasmic reticulum, mitochondria, nucleus, and in the extracellular environment [46]. HSP27, on the other hand, is one of the small HSPs and is ubiquitously expressed and involved in several biological functions [47]. Cytochrome c-mediated activation of caspases in the cytosol can be inhibited by HSP intracellularly [48] and extracellularly and serves as a signaling molecule and binds to membrane receptors [49]. As reviewed by Tsai et al., HSP27 and HSP70 are already strongly connected to glaucoma disease [50]. In patients with normal tension glaucoma (NTG), an enhanced serum immunoreactivity against several antibodies was noted, including HSP27 [51]. Furthermore, in serum samples of POAG and NTG patients, antibodies against HSP27 were detected among others [52]. In rats, immunization with HSP27 ultimately led to glaucomatous neurodegeneration without IOP elevation [23,53]. Additionally, the local administration of HSP27 by intravitreal injections degenerates RGCs and optic nerves [54]. In the case of HSP70, an upregulation was detected in aqueous humor samples of NTG patients [13]. In POAG, higher HSP70 levels were noted in serum specimens [55]. The gained results from our study as well as the current literature underline the pivotal role of HSPs in glaucoma disease. Whether they act neuroprotective or neurodestructive needs to be determined in future studies using specific inhibitors. Studies revealed that HSP70 can act as “chaperokine”, meaning it can act as chaperone as well as cytokine. HSP70 is able to induce the activation of the classical complement pathway independently from antibodies [56]. In the EAG model, an activation of the complement system could be detected previously [25,57]. While prior to RGC loss, the lectin pathway seems to activate the complement cascade, we now revealed that later, the classical pathway is also involved.
In contrast to HSP27 and HSP70, little is known about HSP40 in glaucoma. However, in rheumatic arthritis, oral HSP40 application leads to reduction of disease symptoms, which is most likely due to a reduction of proinflammatory cytokines in addition to an increased production of regulatory cytokines [58].
Hence, it seems likely that there is a connection between the response of HSP70 and the complement system in our IOP-independent glaucoma model. A contribution of the complement response in glaucomatous optic neuropathy was intensively investigated over the last few years. It could be shown that not only in glaucoma animal models with and without IOP elevation [25,59,60,61], but also in human glaucoma [6,19], the complement system triggers degeneration. These results suggest that it could serve as a disease marker in the future. An activation of the complement response can engage in the regulation of an inflammatory reaction [62]. In our study, we noted an upregulation of Il18 and Il33 mRNA levels after ONA immunization. Both interleukins belong to the IL1 cytokine family [63]. An increase in IL18 was also observed in an induced ocular hypertension model [64] as well as in high-pressure DBA2/J mice [65], suggesting a role of this interleukin in glaucoma pathogenesis. Unlike other members of the IL1 family, IL33 is constitutively expressed, for example, in glia as well as in some immune cells [66]. For glaucoma, the role of IL33 was not investigated yet. In an experimental uveitis model, IL33 attenuated the development of the disease [67]. In retinal pigment epithelium cells (RPE), IL33 seems to be a key regulator for metabolism and primary RPE cells from IL33-/- mice had significant changes in the structure of mitochondria [68]. Furthermore, IL33 can induce NFκB. This is in accordance with our results since we also found a significant upregulation of Nfkb1 mRNA levels in ONA retinae.
In this study, we additionally used mRNA profiling to elucidate the relevance of specific markers. In a previous study on photoreceptor degeneration in a mouse model, it was shown that microarray analysis is feasible to perform gene expression analysis [69]. Thereby, they used Cngb1−/− mice to investigate the extent of microglia activation in retinal degeneration as well as gene expressions of Cngb1−/− and respective wildtype animals. In our study, we were able to detect significant expression differences between the ONA and control animals for the first time. A significant upregulation of 9 of these genes and a downregulation of 15 genes in EAG animals was verified (p < 0.050). These results indicate the importance of several genes involved in glaucoma. To further investigate those found changes, we performed RT-qPCR to explore if these changes also occur on the mRNA level of the total retina. We observed an increase in Cxcl10 mRNA expression level in the ONA group. It is known that Cxcl10 has a role in the recruitment of inflammatory cells and neurodegenerative diseases [70]. In a more recent study, Cxl10 expression levels were significantly elevated in traumatic optic neuropathy in 8 to 12-week-old mice. Additionally, this demonstrated that Cxcl10 plays a role in leukocyte recruitment and neuronal injury [71]. Additionally, in high-pressure βB1-CTGF mice, an upregulation of Cxcl10 was noted in the transgenic animals, which was accompanied by an activation of the complement system by the classical pathway [59]. In the study presented here, similar pathways seem to be involved in glaucomatous damage.
Furthermore, we observed a downregulation of the mRNA expression levels of Gdf15. Gdf15 is associated with RGC death [72]. In an in vivo mouse model, the intravitreal injection of GDF15 suppressed RGC loss in the mice and was, therefore, thought to have a protective effect on RGCs [73]. In a study by Ban et al., Gdf15 expression was specifically increased in the retina after acute RGC axon injury and in a chronic mouse glaucoma model [72]. Gdf15 may be a good marker to screen for glaucomatous neurodegeneration. However, further studies are needed to gain more detailed knowledge about Gdf15. In addition, we observed a downregulation of the mRNA expression level of Wwox. Targeted disruption of Wwox is known to cause neurodevelopmental abnormalities in mice. These include, among others, abnormal neuronal differentiation, migration of the central nervous system, degenerative alteration, and optic nerve atrophy [74]. In another study, analyses were collected from a family affected by multiple pre- and postnatal abnormalities, including severe neurodevelopmental disorders and refractory epilepsy [75]. A segregating homozygous Wwox mutation was detected in this family, resulting in defective architecture of granular and molecular cell layers [75]. The findings of previous studies and our results have in common that loss of Wwox can affect and alter various components of the central nervous system, suggesting a regulatory role of Wwox in the retina.
5. Conclusions
In this study, we noted a significant loss of RGC in ONA retinae. Using DNA microarray for the first time, we detected novel oligonucleotide probes, which might contribute to glaucomatous neuropathy. Furthermore, we observed an upregulation of mRNA expression levels of HSP family genes. Moreover, mRNA expression levels of genes involved in the regulation of the immune system, such as C1qb, Nfkb1, and Cxcl10, were increased in ONA animals. Collectively, these findings provide further insight into the central role of the immune response in glaucomatous optic neuropathy, which could lead to new diagnostic and therapeutic options.
Supplementary Materials
The following supporting information can be downloaded at: https://www.mdpi.com/article/10.3390/biom12101538/s1, Supplement Table S1: Raw data of microarray analysis.
Author Contributions
Conceptualization, S.C.J. and C.M.; formal analysis, S.R., A.S., P.G., A.G. and C.M.; methodology, S.R., A.S., P.G., A.G., S.A.H., S.K., C.T., H.B.D., K.M., C.M. and S.C.J.; investigation, S.R., A.S., P.G., A.G., S.K. and C.M.; resources, K.M., C.M. and S.C.J.; writing—original draft preparation, S.R., A.S., C.M. and S.C.J.; writing—review and editing, T.T., S.A.H., C.T., K.M., H.B.D., C.M. and S.C.J.; visualization, S.R., A.S., C.M. and S.C.J.; supervision, S.C.J. and C.M.; project administration, S.R., S.C.J. and C.M.; funding acquisition, S.R., T.T., C.M. and S.C.J. All authors have read and agreed to the published version of the manuscript.
Funding
The research was founded by the Georgius-Agricola-Stiftung-Ruhr (Ruhr-University Bochum, Germany), the HUPO Brain Proteome Project (HBPP), PURE, a project of North Rhine-Westphalia, a federal German state, and the Deutsche Forschungsgemeinschaft (DFG, Germany, RE-4543/1-1). We acknowledge support by the Open Access Publication Funds of the Ruhr-Universität Bochum.
Institutional Review Board Statement
The study was conducted in accordance with the Declaration of Helsinki and approved by the animal care committee of North Rhine-Westphalia, Germany (approval codes: 84-02-04.2013_A291 and 81-02-04.2018_A071).
Informed Consent Statement
Not applicable.
Data Availability Statement
Not applicable.
Acknowledgments
We would like to thank Jessica Brockmann for excellent technical support.
Conflicts of Interest
The authors declare no conflict of interest.
References
- Tham, Y.C.; Li, X.; Wong, T.Y.; Quigley, H.A.; Aung, T.; Cheng, C.Y. Global prevalence of glaucomaand projections of glaucoma burdenthrough 2040: A systematic review and meta-analysis. Ophthalmology 2014, 121, 2081–2090. [Google Scholar] [CrossRef]
- Burton, M.J.; Ramke, J.; Marques, A.P.; Bourne, R.R.A.; Congdon, N.; Jones, I.; Ah Tong, B.A.M.; Arunga, S.; Bachani, D.; Bascaran, C.; et al. The Lancet Global Health Commission on Global Eye Health: Vision beyond 2020. Lancet Global Health 2021, 9, e489–e551. [Google Scholar] [CrossRef]
- European Glaucoma Society Terminology and Guidelines for Glaucoma, 5th Edition. Br. J. Ophthalmol. 2021, 105, 1–169. [CrossRef]
- Sommer, A.; Tielsch, J.M.; Katz, J.; Quigley, H.A.; Gottsch, J.D.; Javitt, J.; Singh, K. Relationship between intraocular pressure and primary open angle glaucoma among white and black Americans. The Baltimore Eye Survey. Arch. Ophthalmol. 1991, 109, 1090–1095. [Google Scholar] [CrossRef] [PubMed]
- Klein, B.E.; Klein, R.; Sponsel, W.E.; Franke, T.; Cantor, L.B.; Martone, J.; Menage, M.J. Prevalence of glaucoma. The Beaver Dam Eye Study. Ophthalmology 1992, 99, 1499–1504. [Google Scholar] [CrossRef]
- Tezel, G.; Yang, X.; Luo, C.; Kain, A.D.; Powell, D.W.; Kuehn, M.H.; Kaplan, H.J. Oxidative stress and the regulation of complement activation in human glaucoma. Investig. Ophthalmol. Vis. Sci. 2010, 51, 5071–5082. [Google Scholar] [CrossRef] [PubMed]
- Almasieh, M.; Wilson, A.M.; Morquette, B.; Cueva Vargas, J.L.; Di Polo, A. The molecular basis of retinal ganglion cell death in glaucoma. Prog. Retin. Eye Res. 2012, 31, 152–181. [Google Scholar] [CrossRef] [PubMed]
- Palmhof, M.; Frank, V.; Rappard, P.; Kortenhorn, E.; Demuth, J.; Biert, N.; Stute, G.; Dick, H.B.; Joachim, S.C. From Ganglion Cell to Photoreceptor Layer: Timeline of Deterioration in a Rat Ischemia/Reperfusion Model. Front. Cell Neurosci. 2019, 13, 174. [Google Scholar] [CrossRef]
- Kuehn, S.; Rodust, C.; Stute, G.; Grotegut, P.; Meissner, W.; Reinehr, S.; Dick, H.B.; Joachim, S.C. Concentration-Dependent Inner Retina Layer Damage and Optic Nerve Degeneration in a NMDA Model. J. Mol. Neurosci. 2017, 63, 283–299. [Google Scholar] [CrossRef] [PubMed]
- Lambuk, L.; Jafri, A.J.A.; Iezhitsa, I.; Agarwal, R.; Bakar, N.S.; Agarwal, P.; Abdullah, A.; Ismail, N.M. Dose-dependent effects of NMDA on retinal and optic nerve morphology in rats. Int. J. Ophthalmol. 2019, 12, 746–753. [Google Scholar] [CrossRef] [PubMed]
- Bell, K.; Und Hohenstein-Blaul, N.V.T.; Teister, J.; Grus, F. Modulation of the Immune System for the Treatment of Glaucoma. Curr. Neuropharmacol. 2018, 16, 942–958. [Google Scholar] [CrossRef] [PubMed]
- Grus, F.H.; Joachim, S.C.; Hoffmann, E.M.; Pfeiffer, N. Complex autoantibody repertoires in patients with glaucoma. Mol. Vis. 2004, 10, 132–137. [Google Scholar] [PubMed]
- Joachim, S.C.; Bruns, K.; Lackner, K.J.; Pfeiffer, N.; Grus, F.H. Antibodies to alpha B-crystallin, vimentin, and heat shock protein 70 in aqueous humor of patients with normal tension glaucoma and IgG antibody patterns against retinal antigen in aqueous humor. Curr. Eye Res. 2007, 32, 501–509. [Google Scholar] [CrossRef] [PubMed]
- Wax, M.B.; Tezel, G.; Saito, I.; Gupta, R.S.; Harley, J.B.; Li, Z.; Romano, C. Anti-Ro/SS-A positivity and heat shock protein antibodies in patients with normal-pressure glaucoma. Am. J. Ophthalmol. 1998, 125, 145–157. [Google Scholar] [CrossRef]
- Tezel, G.; Hernandez, R.; Wax, M.B. Immunostaining of heat shock proteins in the retina and optic nerve head of normal and glaucomatous eyes. Arch. Ophthalmol. 2000, 118, 511–518. [Google Scholar] [CrossRef]
- Srivastava, P. Roles of heat-shock proteins in innate and adaptive immunity. Nat. Rev. Immunol. 2002, 2, 185–194. [Google Scholar] [CrossRef] [PubMed]
- Binder, R.J. Functions of heat shock proteins in pathways of the innate and adaptive immune system. J. Immunol. 2014, 193, 5765–5771. [Google Scholar] [CrossRef]
- Liu, H.; Anders, F.; Funke, S.; Mercieca, K.; Grus, F.; Prokosch, V. Proteome alterations in aqueous humour of primary open angle glaucoma patients. Int. J. Ophthalmol. 2020, 13, 176–179. [Google Scholar] [CrossRef]
- Hubens, W.H.G.; Beckers, H.J.M.; Gorgels, T.; Webers, C.A.B. Increased ratios of complement factors C3a to C3 in aqueous humor and serum mark glaucoma progression. Exp. Eye Res. 2021, 204, 108460. [Google Scholar] [CrossRef] [PubMed]
- Boehm, N.; Beck, S.; Lossbrand, U.; Pfeiffer, N.; Grus, F.H. Analysis of Complement Proteins in Retina and Sera of Glaucoma Patients. Investig. Ophthalmol. Vis. Sci. 2010, 51, 5221. [Google Scholar]
- Noristani, R.; Kuehn, S.; Stute, G.; Reinehr, S.; Stellbogen, M.; Dick, H.B.; Joachim, S.C. Retinal and Optic Nerve Damage is Associated with Early Glial Responses in an Experimental Autoimmune Glaucoma Model. J. Mol. Neurosci. 2016, 58, 470–482. [Google Scholar] [CrossRef] [PubMed]
- Reinehr, S.; Reinhard, J.; Wiemann, S.; Hesse, K.; Voss, C.; Gandej, M.; Dick, H.B.; Faissner, A.; Joachim, S.C. Transfer of the Experimental Autoimmune Glaucoma Model from Rats to Mice-New Options to Study Glaucoma Disease. Int. J. Mol. Sci. 2019, 20, 2563. [Google Scholar] [CrossRef] [PubMed]
- Wax, M.B.; Tezel, G.; Yang, J.; Peng, G.; Patil, R.V.; Agarwal, N.; Sappington, R.M.; Calkins, D.J. Induced autoimmunity to heat shock proteins elicits glaucomatous loss of retinal ganglion cell neurons via activated T-cell-derived fas-ligand. J. Neurosci. 2008, 28, 12085–12096. [Google Scholar] [CrossRef] [PubMed]
- Laspas, P.; Gramlich, O.W.; Muller, H.D.; Cuny, C.S.; Gottschling, P.F.; Pfeiffer, N.; Dick, H.B.; Joachim, S.C.; Grus, F.H. Autoreactive antibodies and loss of retinal ganglion cells in rats induced by immunization with ocular antigens. Investig. Ophthalmol. Vis. Sci. 2011, 52, 8835–8848. [Google Scholar] [CrossRef] [PubMed]
- Reinehr, S.; Reinhard, J.; Gandej, M.; Kuehn, S.; Noristani, R.; Faissner, A.; Burkhard Dick, H.; Joachim, S.C. Simultaneous Complement Response via Lectin Pathway in Retina and Optic Nerve in an Experimental Autoimmune Glaucoma Model. Front. Cell Neurosci. 2016, 10, 140. [Google Scholar] [CrossRef]
- Reinehr, S.; Reinhard, J.; Wiemann, S.; Stute, G.; Kuehn, S.; Woestmann, J.; Dick, H.B.; Faissner, A.; Joachim, S.C. Early remodelling of the extracellular matrix proteins tenascin-C and phosphacan in retina and optic nerve of an experimental autoimmune glaucoma model. J. Cell Mol. Med. 2016, 20, 2122–2137. [Google Scholar] [CrossRef] [PubMed]
- Joachim, S.C.; Reinehr, S.; Kuehn, S.; Laspas, P.; Gramlich, O.W.; Kuehn, M.; Tischoff, I.; von Pein, H.D.; Dick, H.B.; Grus, F.H. Immune response against ocular tissues after immunization with optic nerve antigens in a model of autoimmune glaucoma. Mol. Vis. 2013, 19, 1804–1814. [Google Scholar] [PubMed]
- Reinehr, S.; Gomes, S.C.; Gassel, C.J.; Asaad, M.A.; Stute, G.; Schargus, M.; Dick, H.B.; Joachim, S.C. Intravitreal Therapy Against the Complement Factor C5 Prevents Retinal Degeneration in an Experimental Autoimmune Glaucoma Model. Front. Pharmacol. 2019, 10, 1381. [Google Scholar] [CrossRef]
- Benning, L.; Reinehr, S.; Grotegut, P.; Kuehn, S.; Stute, G.; Dick, H.B.; Joachim, S.C. Synapse and Receptor Alterations in Two Different S100B-Induced Glaucoma-Like Models. Int. J. Mol. Sci. 2020, 21, 6998. [Google Scholar] [CrossRef]
- Reinehr, S.; Kuehn, S.; Casola, C.; Koch, D.; Stute, G.; Grotegut, P.; Dick, H.B.; Joachim, S.C. HSP27 immunization reinforces AII amacrine cell and synapse damage induced by S100 in an autoimmune glaucoma model. Cell Tissue Res. 2018, 371, 237–249. [Google Scholar] [CrossRef] [PubMed]
- Aring, L.; Steinbach, S.; Marcus, K.; May, C. Isolation of Distinct Types of Neurons from Fresh Brain Tissue Using Laser Microdissection in Combination with High-Performance Liquid Chromatography-Mass Spectrometry. Methods Mol. Biol. 2018, 1723, 247–260. [Google Scholar] [CrossRef] [PubMed]
- Plum, S.; Steinbach, S.; Attems, J.; Keers, S.; Riederer, P.; Gerlach, M.; May, C.; Marcus, K. Proteomic characterization of neuromelanin granules isolated from human substantia nigra by laser-microdissection. Sci. Rep. 2016, 6, 37139. [Google Scholar] [CrossRef] [PubMed]
- Puscz, F.; Dadras, M.; Dermietzel, A.; Jacobsen, F.; Lehnhardt, M.; Behr, B.; Hirsch, T.; Kueckelhaus, M. A chronic rejection model and potential biomarkers for vascularized composite allotransplantation. PLoS ONE 2020, 15, e0235266. [Google Scholar] [CrossRef] [PubMed]
- Pfaffl, M.W.; Horgan, G.W.; Dempfle, L. Relative expression software tool (REST) for group-wise comparison and statistical analysis of relative expression results in real-time PCR. Nucleic Acids Res. 2002, 30, e36. [Google Scholar] [CrossRef] [PubMed]
- Rossetti, L.; Digiuni, M.; Montesano, G.; Centofanti, M.; Fea, A.M.; Iester, M.; Frezzotti, P.; Figus, M.; Ferreras, A.; Oddone, F.; et al. Blindness and Glaucoma: A Multicenter Data Review from 7 Academic Eye Clinics. PLoS ONE 2015, 10, e0136632. [Google Scholar] [CrossRef]
- Wolfram, C.; Schuster, A.K.; Elflein, H.M.; Nickels, S.; Schulz, A.; Wild, P.S.; Beutel, M.E.; Blettner, M.; Munzel, T.; Lackner, K.J.; et al. The Prevalence of Visual Impairment in the Adult Population. Dtsch. Arztebl Int. 2019, 116, 289–295. [Google Scholar] [CrossRef]
- Gupta, D.; Chen, P.P. Glaucoma. Am. Fam. Physician 2016, 93, 668–674. [Google Scholar]
- Reinehr, S.; Koch, D.; Weiss, M.; Froemel, F.; Voss, C.; Dick, H.B.; Fuchshofer, R.; Joachim, S.C. Loss of retinal ganglion cells in a new genetic mouse model for primary open-angle glaucoma. J. Cell Mol. Med. 2019, 23, 5497–5507. [Google Scholar] [CrossRef]
- Garcia, M.; Vecino, E. Role of Muller glia in neuroprotection and regeneration in the retina. Histol. Histopathol. 2003, 18, 1205–1218. [Google Scholar] [CrossRef]
- Bringmann, A.; Pannicke, T.; Grosche, J.; Francke, M.; Wiedemann, P.; Skatchkov, S.N.; Osborne, N.N.; Reichenbach, A. Muller cells in the healthy and diseased retina. Prog. Retin. Eye Res. 2006, 25, 397–424. [Google Scholar] [CrossRef]
- Galan, A.; Dergham, P.; Escoll, P.; de-la-Hera, A.; D’Onofrio, P.M.; Magharious, M.M.; Koeberle, P.D.; Frade, J.M.; Saragovi, H.U. Neuronal injury external to the retina rapidly activates retinal glia, followed by elevation of markers for cell cycle re-entry and death in retinal ganglion cells. PLoS ONE 2014, 9, e101349. [Google Scholar] [CrossRef]
- Casola, C.; Schiwek, J.E.; Reinehr, S.; Kuehn, S.; Grus, F.H.; Kramer, M.; Dick, H.B.; Joachim, S.C. S100 Alone Has the Same Destructive Effect on Retinal Ganglion Cells as in Combination with HSP 27 in an Autoimmune Glaucoma Model. J. Mol. Neurosci. 2015, 56, 228–236. [Google Scholar] [CrossRef] [PubMed]
- Lindquist, S.; Craig, E.A. The heat-shock proteins. Annu. Rev. Genet. 1988, 22, 631–677. [Google Scholar] [CrossRef]
- Michel, G.P.; Starka, J. Effect of ethanol and heat stresses on the protein pattern of Zymomonas mobilis. J. Bacteriol. 1986, 165, 1040–1042. [Google Scholar] [CrossRef]
- Kampinga, H.H.; Hageman, J.; Vos, M.J.; Kubota, H.; Tanguay, R.M.; Bruford, E.A.; Cheetham, M.E.; Chen, B.; Hightower, L.E. Guidelines for the nomenclature of the human heat shock proteins. Cell Stress Chaperones 2009, 14, 105–111. [Google Scholar] [CrossRef] [PubMed]
- Kampinga, H.H.; Craig, E.A. The HSP70 chaperone machinery: J proteins as drivers of functional specificity. Nat. Rev. Mol. Cell Biol. 2010, 11, 579–592. [Google Scholar] [CrossRef]
- Jakob, U.; Gaestel, M.; Engel, K.; Buchner, J. Small heat shock proteins are molecular chaperones. J. Biol. Chem. 1993, 268, 1517–1520. [Google Scholar] [CrossRef]
- Bruey, J.M.; Ducasse, C.; Bonniaud, P.; Ravagnan, L.; Susin, S.A.; Diaz-Latoud, C.; Gurbuxani, S.; Arrigo, A.P.; Kroemer, G.; Solary, E.; et al. Hsp27 negatively regulates cell death by interacting with cytochrome c. Nat. Cell Biol. 2000, 2, 645–652. [Google Scholar] [CrossRef]
- Jin, C.; Cleveland, J.C.; Ao, L.; Li, J.; Zeng, Q.; Fullerton, D.A.; Meng, X. Human myocardium releases heat shock protein 27 (HSP27) after global ischemia: The proinflammatory effect of extracellular HSP27 through toll-like receptor (TLR)-2 and TLR4. Mol. Med. 2014, 20, 280–289. [Google Scholar] [CrossRef]
- Tsai, T.; Grotegut, P.; Reinehr, S.; Joachim, S.C. Role of Heat Shock Proteins in Glaucoma. Int. J. Mol. Sci. 2019, 20, 5160. [Google Scholar] [CrossRef]
- Wax, M.B.; Tezel, G.; Edward, P.D. Clinical and ocular histopathological findings in a patient with normal-pressure glaucoma. Arch. Ophthalmol. 1998, 116, 993–1001. [Google Scholar] [CrossRef][Green Version]
- Tezel, G.; Seigel, G.M.; Wax, M.B. Autoantibodies to small heat shock proteins in glaucoma. Investig. Ophthalmol. Vis. Sci. 1998, 39, 2277–2287. [Google Scholar]
- Joachim, S.C.; Grus, F.H.; Kraft, D.; White-Farrar, K.; Barnes, G.; Barbeck, M.; Ghanaati, S.; Cao, S.; Li, B.; Wax, M.B. Complex antibody profile changes in an experimental autoimmune glaucoma animal model. Investig. Ophthalmol. Vis. Sci. 2009, 50, 4734–4742. [Google Scholar] [CrossRef]
- Grotegut, P.; Kuehn, S.; Dick, H.B.; Joachim, S.C. Destructive Effect of Intravitreal Heat Shock Protein 27 Application on Retinal Ganglion Cells and Neurofilament. Int. J. Mol. Sci. 2020, 21, 549. [Google Scholar] [CrossRef]
- Boehm, N.; Wolters, D.; Thiel, U.; Lossbrand, U.; Wiegel, N.; Pfeiffer, N.; Grus, F.H. New insights into autoantibody profiles from immune privileged sites in the eye: A glaucoma study. Brain Behav Immun. 2012, 26, 96–102. [Google Scholar] [CrossRef]
- Prohaszka, Z.; Singh, M.; Nagy, K.; Kiss, E.; Lakos, G.; Duba, J.; Fust, G. Heat shock protein 70 is a potent activator of the human complement system. Cell Stress Chaperones 2002, 7, 17–22. [Google Scholar] [CrossRef]
- Reinehr, S.; Reinhard, J.; Gandej, M.; Gottschalk, I.; Stute, G.; Faissner, A.; Dick, H.B.; Joachim, S.C. S100B immunization triggers NFκB and complement activation in an autoimmune glaucoma model. Sci. Rep. 2018, 8, 9821. [Google Scholar] [CrossRef]
- Prakken, B.J.; Samodal, R.; Le, T.D.; Giannoni, F.; Yung, G.P.; Scavulli, J.; Amox, D.; Roord, S.; de Kleer, I.; Bonnin, D.; et al. Epitope-specific immunotherapy induces immune deviation of proinflammatory T cells in rheumatoid arthritis. Proc. Natl. Acad. Sci. USA 2004, 101, 4228–4233. [Google Scholar] [CrossRef]
- Reinehr, S.; Doerner, J.D.; Mueller-Buehl, A.M.; Koch, D.; Fuchshofer, R.; Dick, H.B.; Joachim, S.C. Cytokine and Complement Response in the Glaucomatous betaB1-CTGF Mouse Model. Front. Cell Neurosci. 2021, 15, 718087. [Google Scholar] [CrossRef]
- Kuehn, M.H.; Kim, C.Y.; Ostojic, J.; Bellin, M.; Alward, W.L.; Stone, E.M.; Sakaguchi, D.S.; Grozdanic, S.D.; Kwon, Y.H. Retinal synthesis and deposition of complement components induced by ocular hypertension. Exp. Eye Res. 2006, 83, 620–628. [Google Scholar] [CrossRef]
- Krishnan, A.; Kocab, A.J.; Zacks, D.N.; Marshak-Rothstein, A.; Gregory-Ksander, M. A small peptide antagonist of the Fas receptor inhibits neuroinflammation and prevents axon degeneration and retinal ganglion cell death in an inducible mouse model of glaucoma. J. Neuroinflamm. 2019, 16, 184. [Google Scholar] [CrossRef]
- Markiewski, M.M.; Lambris, J.D. The role of complement in inflammatory diseases from behind the scenes into the spotlight. Am. J. Pathol. 2007, 171, 715–727. [Google Scholar] [CrossRef]
- Matarazzo, L.; Hernandez Santana, Y.E.; Walsh, P.T.; Fallon, P.G. The IL-1 cytokine family as custodians of barrier immunity. Cytokine 2022, 154, 155890. [Google Scholar] [CrossRef]
- Levkovitch-Verbin, H.; Waserzoog, Y.; Vander, S.; Makarovsky, D.; Piven, I. Minocycline upregulates pro-survival genes and downregulates pro-apoptotic genes in experimental glaucoma. Graefes Arch. Clin Exp. Ophthalmol. 2014, 252, 761–772. [Google Scholar] [CrossRef]
- Zhou, X.; Li, F.; Kong, L.; Chodosh, J.; Cao, W. Anti-inflammatory effect of pigment epithelium-derived factor in DBA/2J mice. Mol. Vis. 2009, 15, 438–450. [Google Scholar]
- Liew, F.Y.; Girard, J.P.; Turnquist, H.R. Interleukin-33 in health and disease. Nat. Rev. Immunol. 2016, 16, 676–689. [Google Scholar] [CrossRef]
- Barbour, M.; Allan, D.; Xu, H.; Pei, C.; Chen, M.; Niedbala, W.; Fukada, S.Y.; Besnard, A.G.; Alves-Filho, J.C.; Tong, X.; et al. IL-33 attenuates the development of experimental autoimmune uveitis. Eur. J. Immunol. 2014, 44, 3320–3329. [Google Scholar] [CrossRef]
- Scott, L.M.; Vincent, E.E.; Hudson, N.; Neal, C.; Jones, N.; Lavelle, E.C.; Campbell, M.; Halestrap, A.P.; Dick, A.D.; Theodoropoulou, S. Interleukin-33 regulates metabolic reprogramming of the retinal pigment epithelium in response to immune stressors. JCI insight 2021, 6, e129429. [Google Scholar] [CrossRef]
- Blank, T.; Goldmann, T.; Koch, M.; Amann, L.; Schon, C.; Bonin, M.; Pang, S.; Prinz, M.; Burnet, M.; Wagner, J.E.; et al. Early Microglia Activation Precedes Photoreceptor Degeneration in a Mouse Model of CNGB1-Linked Retinitis Pigmentosa. Front. Immunol. 2017, 8, 1930. [Google Scholar] [CrossRef]
- Lacotte, S.; Brun, S.; Muller, S.; Dumortier, H. CXCR3, inflammation, and autoimmune diseases. Ann. N. Y. Acad. Sci. 2009, 1173, 310–317. [Google Scholar] [CrossRef]
- Ha, Y.; Liu, H.; Zhu, S.; Yi, P.; Liu, W.; Nathanson, J.; Kayed, R.; Loucas, B.; Sun, J.; Frishman, L.J.; et al. Critical Role of the CXCL10/C-X-C Chemokine Receptor 3 Axis in Promoting Leukocyte Recruitment and Neuronal Injury during Traumatic Optic Neuropathy Induced by Optic Nerve Crush. Am. J. Pathol. 2017, 187, 352–365. [Google Scholar] [CrossRef]
- Ban, N.; Siegfried, C.J.; Lin, J.B.; Shui, Y.B.; Sein, J.; Pita-Thomas, W.; Sene, A.; Santeford, A.; Gordon, M.; Lamb, R.; et al. GDF15 is elevated in mice following retinal ganglion cell death and in glaucoma patients. JCI Insight 2017, 2, e91455. [Google Scholar] [CrossRef]
- Iwata, Y.; Inagaki, S.; Morozumi, W.; Nakamura, S.; Hara, H.; Shimazawa, M. Treatment with GDF15, a TGFbeta superfamily protein, induces protective effect on retinal ganglion cells. Exp. Eye Res. 2021, 202, 108338. [Google Scholar] [CrossRef]
- Cheng, Y.Y.; Chou, Y.T.; Lai, F.J.; Jan, M.S.; Chang, T.H.; Jou, I.M.; Chen, P.S.; Lo, J.Y.; Huang, S.S.; Chang, N.S.; et al. Wwox deficiency leads to neurodevelopmental and degenerative neuropathies and glycogen synthase kinase 3beta-mediated epileptic seizure activity in mice. Acta Neuropathol. Commun. 2020, 8, 6. [Google Scholar] [CrossRef]
- Iacomino, M.; Baldassari, S.; Tochigi, Y.; Kosla, K.; Buffelli, F.; Torella, A.; Severino, M.; Paladini, D.; Mandara, L.; Riva, A.; et al. Loss of Wwox Perturbs Neuronal Migration and Impairs Early Cortical Development. Front. Neurosci. 2020, 14, 644. [Google Scholar] [CrossRef]


Publisher’s Note: MDPI stays neutral with regard to jurisdictional claims in published maps and institutional affiliations. |
© 2022 by the authors. Licensee MDPI, Basel, Switzerland. This article is an open access article distributed under the terms and conditions of the Creative Commons Attribution (CC BY) license (https://creativecommons.org/licenses/by/4.0/).