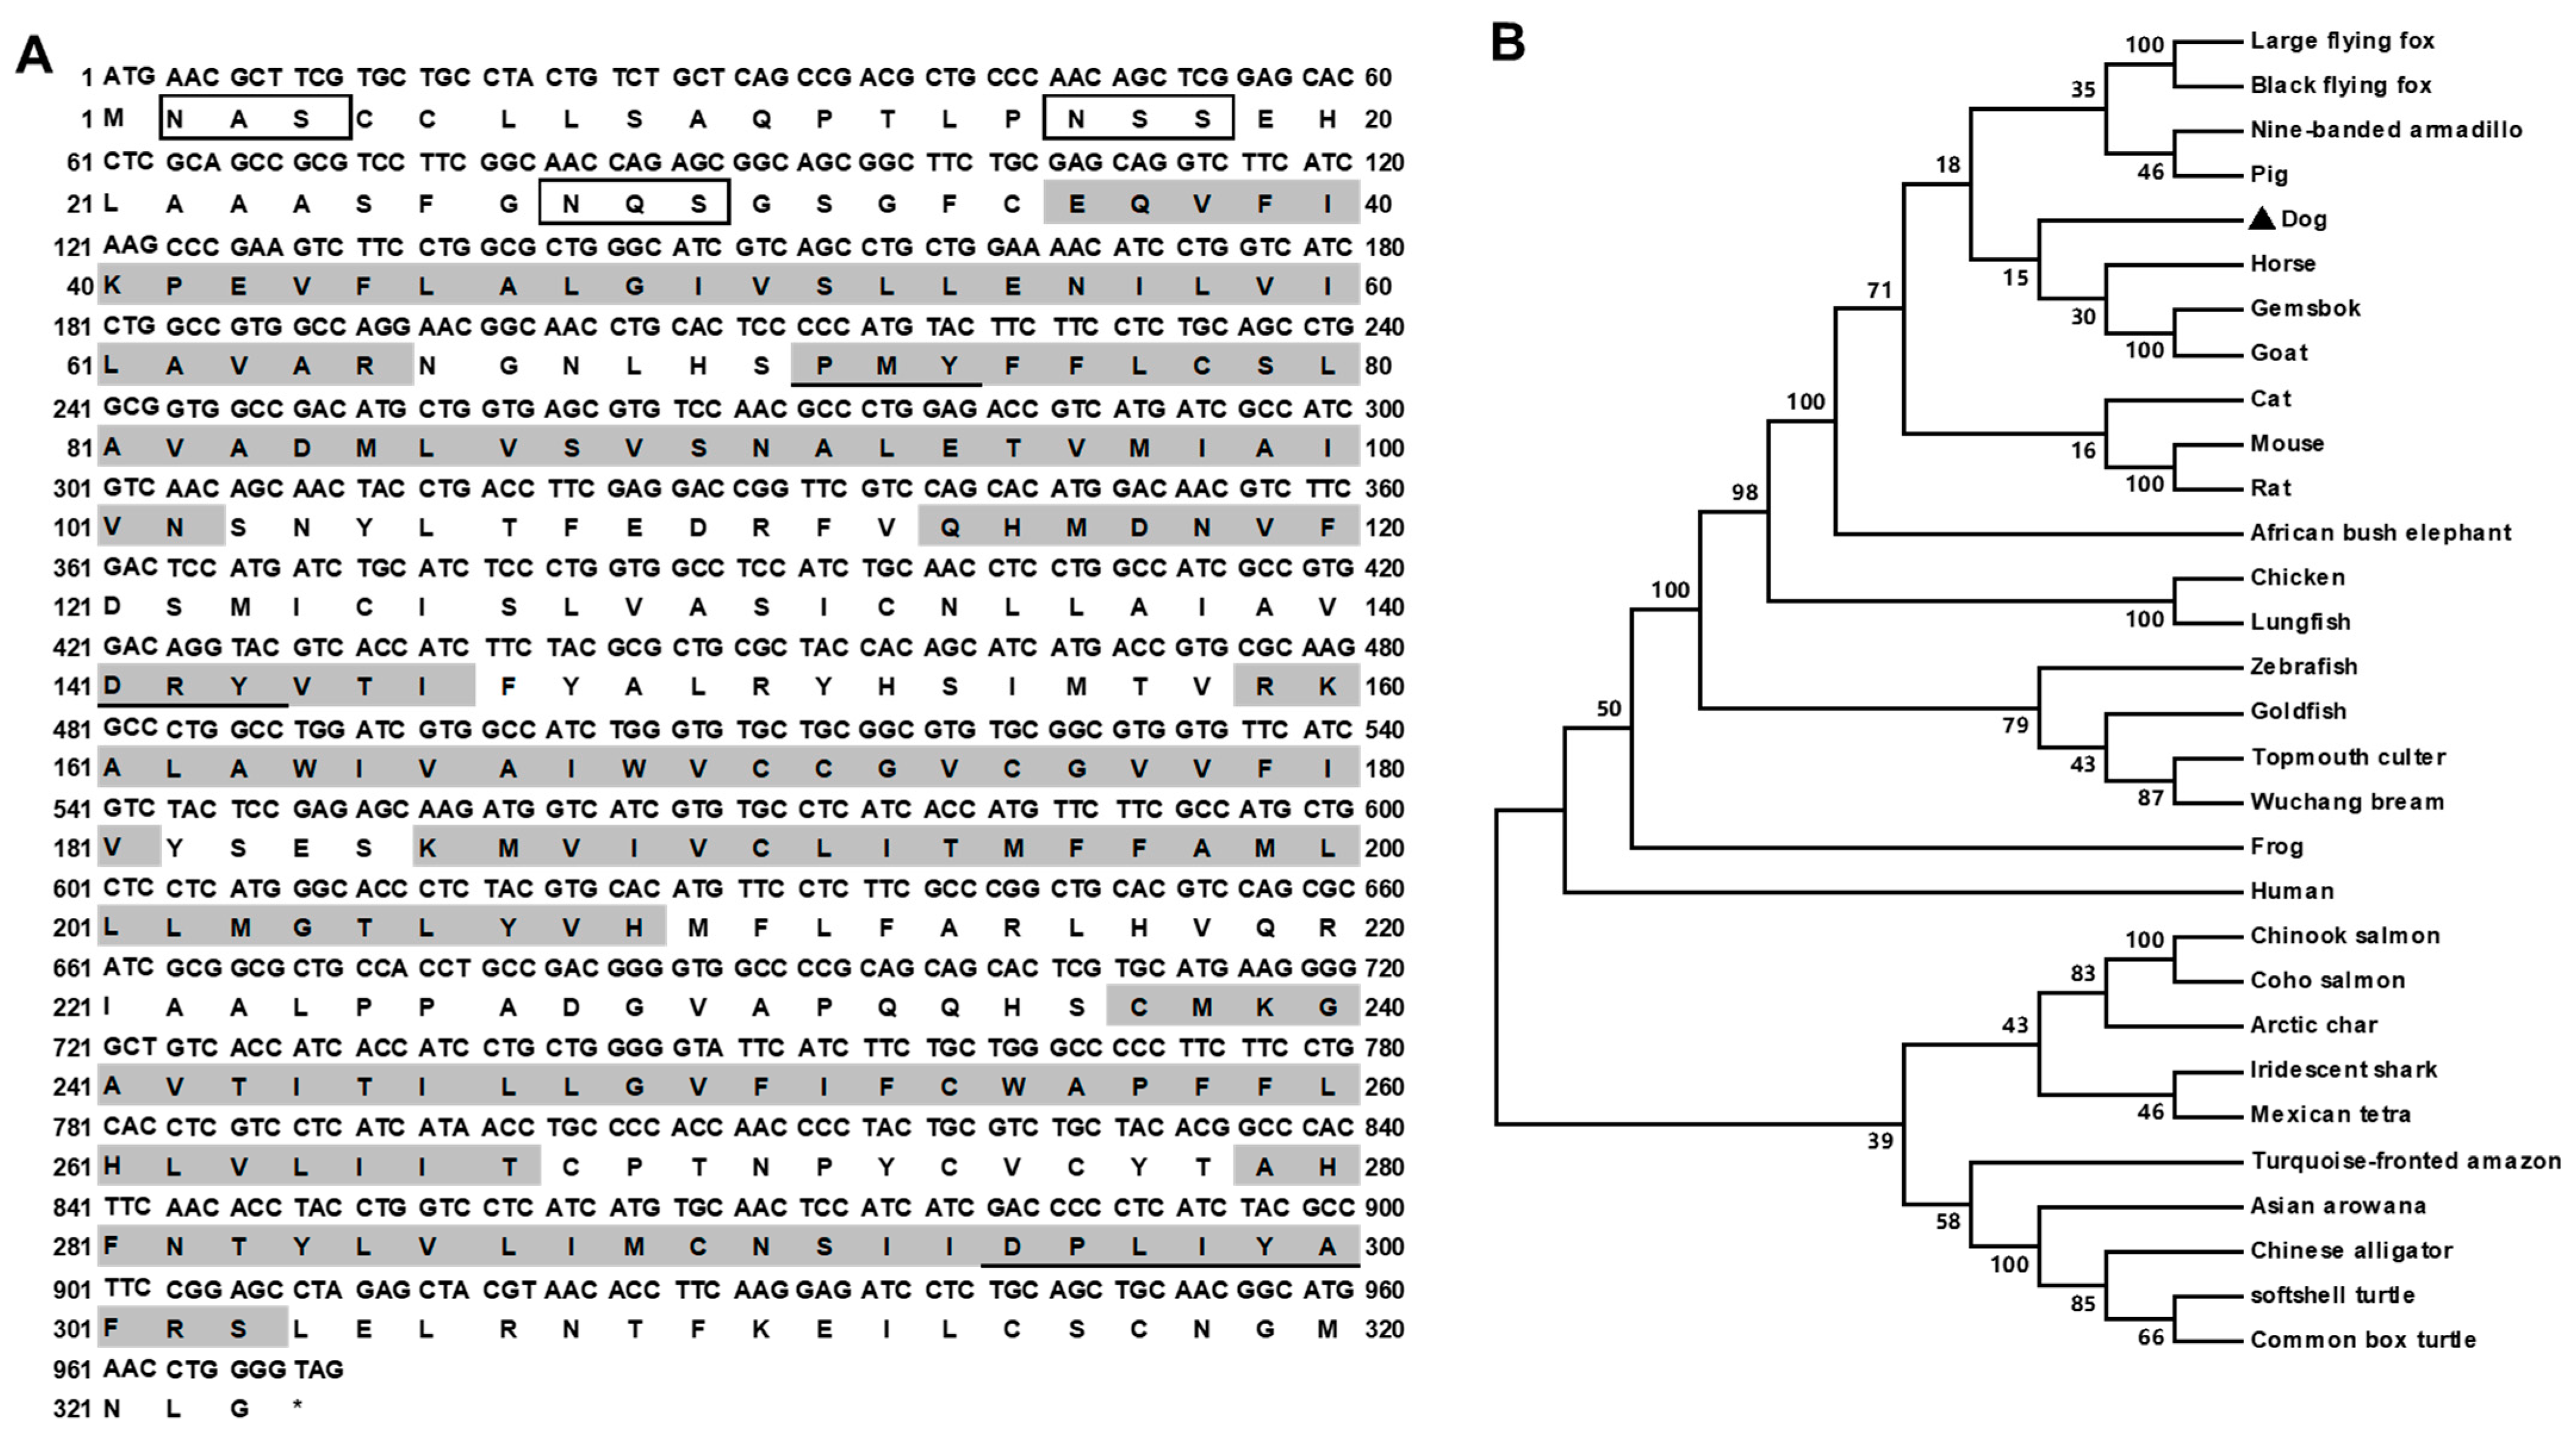
Figure 1.
Nucleotide and deduced amino acid sequences (A) and phylogenetic tree (B) of cMC3R. Positions of nucleotide and amino acid sequences are indicated on both sides. N-linked glycosylation sites are present in open boxes. Shaded boxes show putative TMD1-7. The conserved motifs (PMY, DRY and DPxxY) are underlined. Asterisk (*) shows stop codon. The tree was constructed by the neighbor-joining (NJ) method. Numbers at nodes indicate the bootstrap value, as percentages, obtained for 1000 replicates. Black dot denotes canine MC3R. MC3Rs: Canis lupus familiaris (dog, NM_001135124.1), Capra hircus (goat, XP_005688382.1), Xenopus tropicalis (frog, XP_002935436.1), Culter alburnus (topmouth culter, MT419813), Carassius auratus (goldfish, BAJ83473.1), Danio rerio (zebrafish, AAO24744.1), Homo sapiens (human, NP_063941.3), Sus scrofa (pig, AFK25142.1), Mus musculus (mouse, AAI03670.1), Gallus gallus (chicken, XP_004947293.1), Rattus norvegicus (rat, NP_001020441.3), Pangasianodon hypophthalmus (iridescent shark, XP_026770221.1), Equus caballus (horse, NP_001243901.1), Pteropus vampyrus (large flying fox, XP_011368476.1), Pteropus alecto (black flying fox, XP_006921991.1), Felis catus (cat, XP_023106851.1), Loxodonta africana (African bush elephant, XP_003419952.1), Salvelinus alpinus (Arctic char, XP_023994975.1), Pelodiscus sinensis (Chinese softshell turtle, XP_006129463.1), and Alligator sinensis (Chinese alligator, XP_006018246.1).
![Biomolecules 12 01608 g001]()
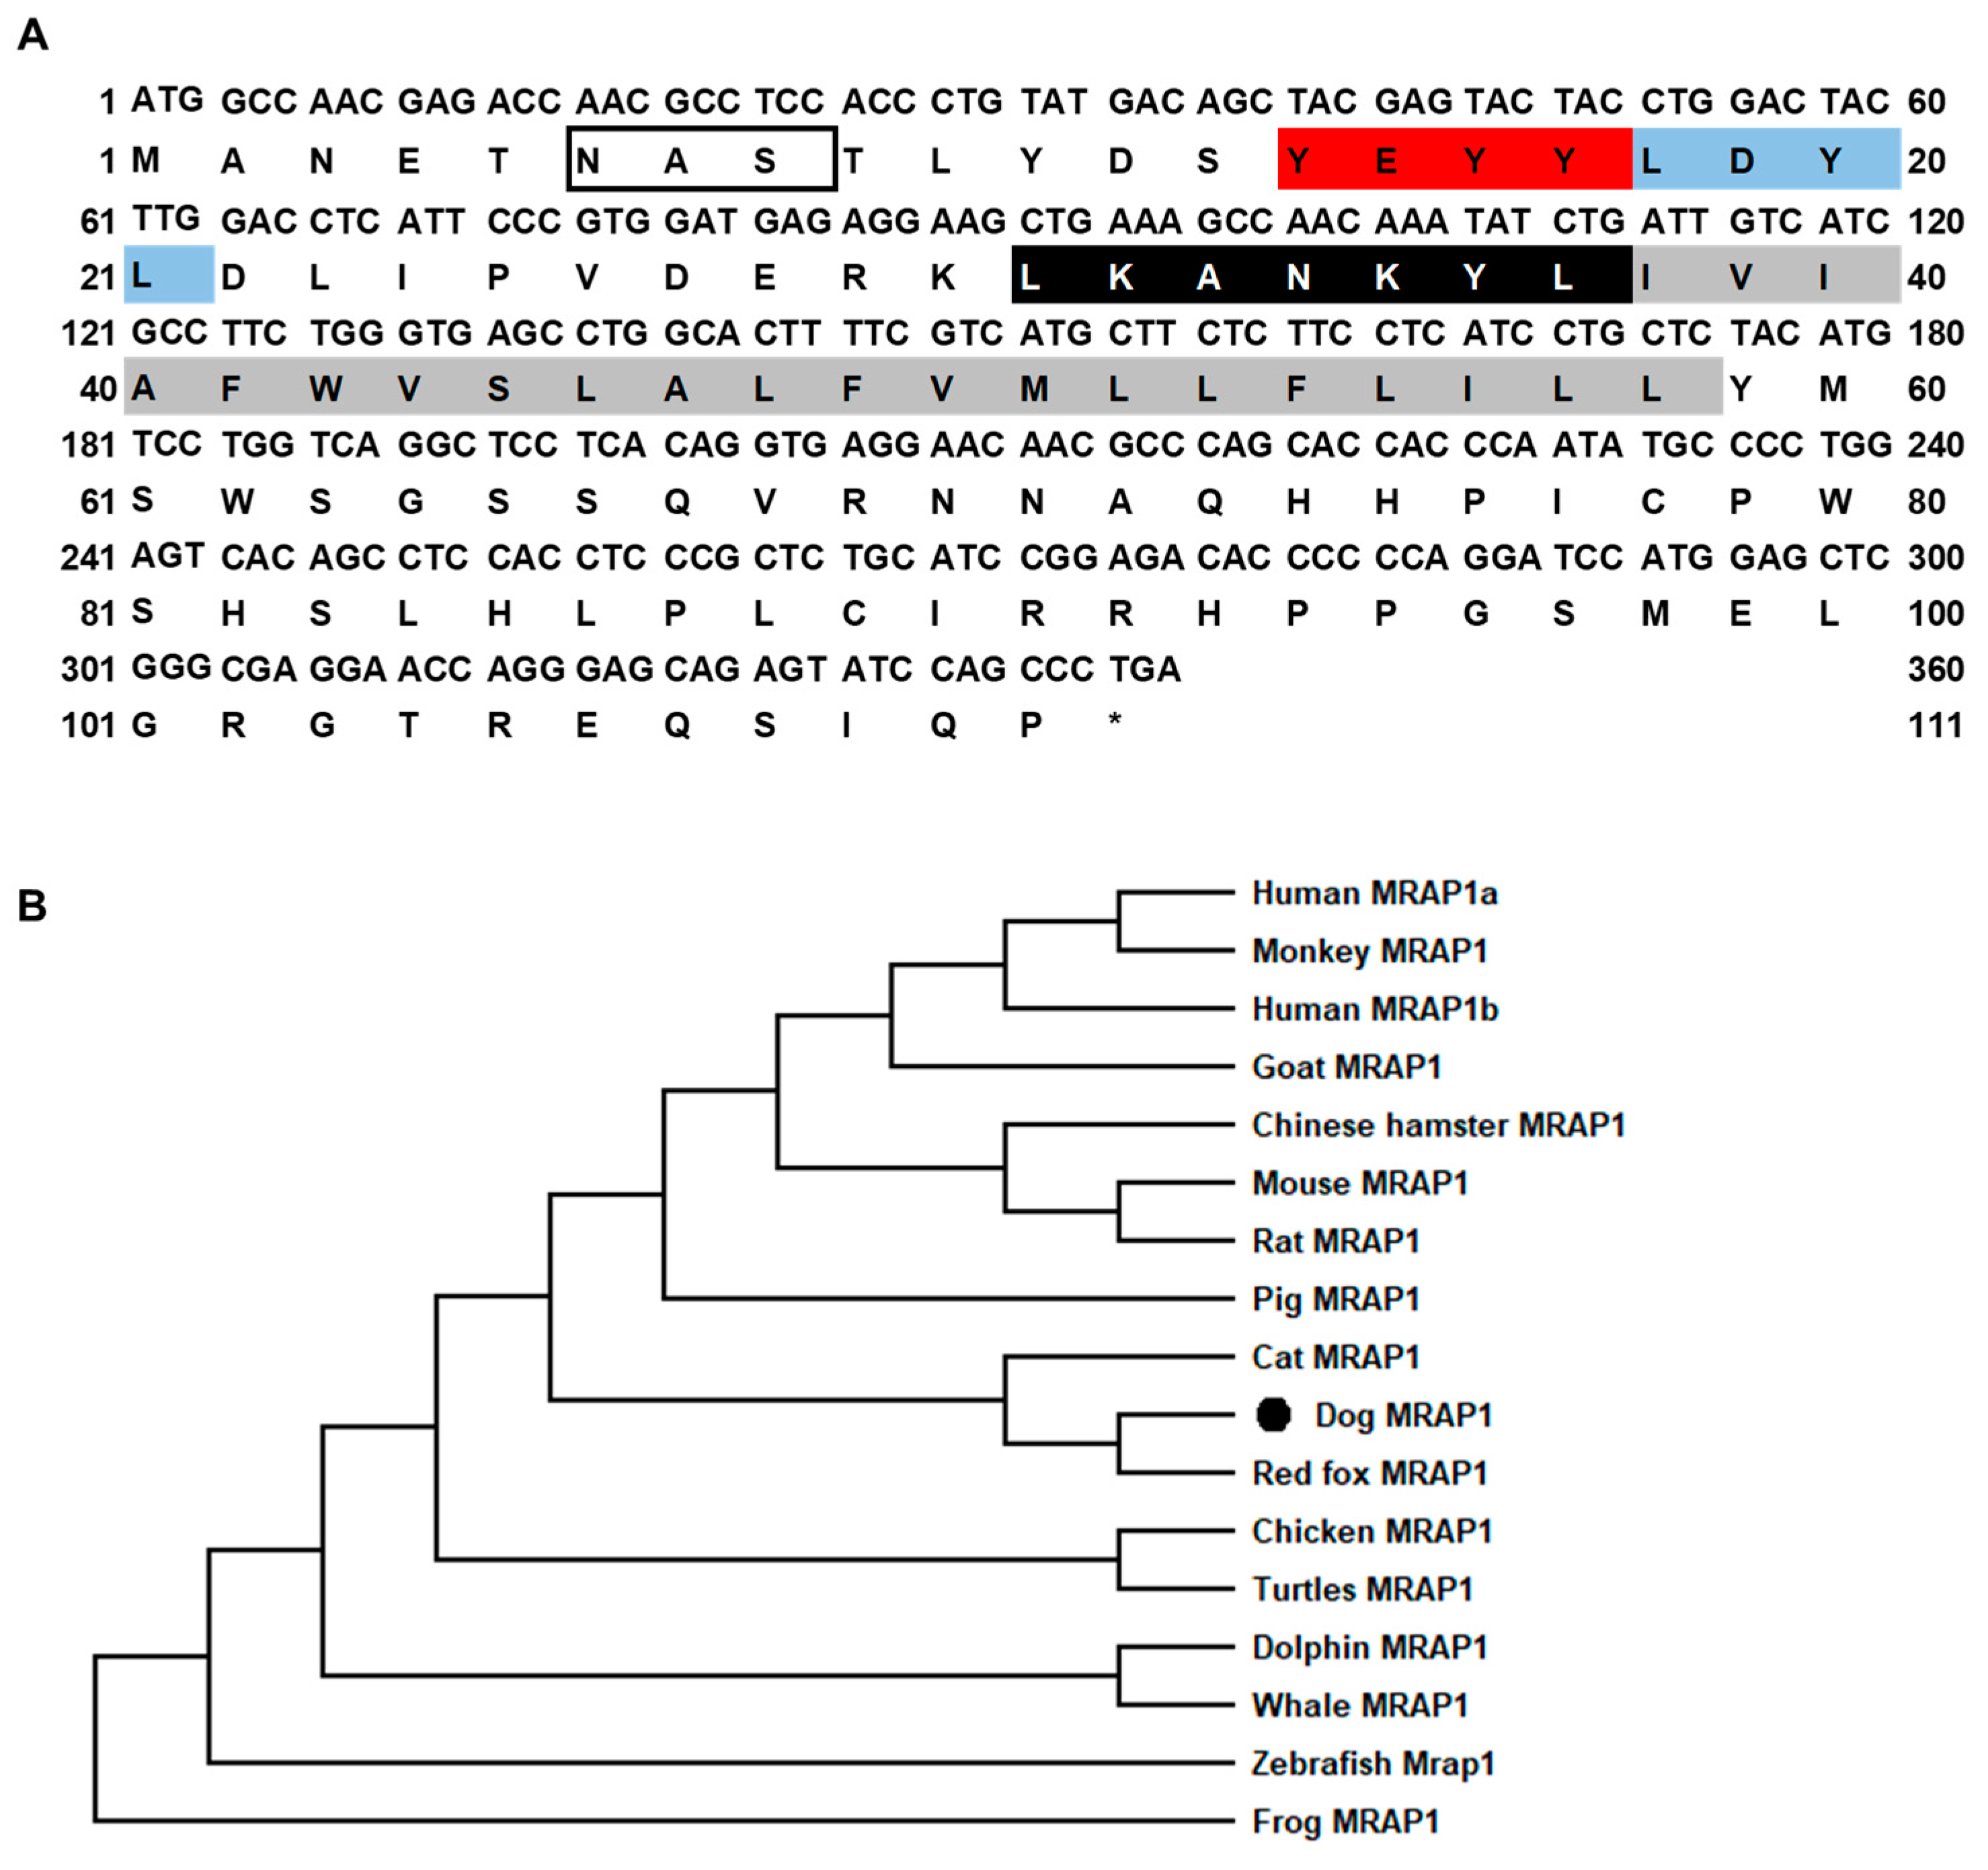
Figure 2.
Nucleotide and deduced amino acid sequences (A) and phylogenetic tree (B) of cMRAP1. Positions of nucleotide and amino acid sequences are indicated on both sides. N-linked glycosylation sites are present in open boxes. Red box denotes YEYY motif. Light blue box indicates LDYL motif. Black box is LKANKYL motif. Shaded box shows putative TMD. Asterisk (*) shows stop codon. The tree was constructed by the neighbor-joining (NJ) method. Numbers at nodes indicate the bootstrap value, as percentages, obtained for 1000 replicates. Black dot denotes canine MRAP1. MRAP1s: Canis lupus familiaris (dog, XP_005638887.1), Homo sapiens (human MRAP1a, AAH62721.1; human MRAP1b, NP_996781.1), Mus musculus (mouse, NP_084120.1); Macaca mulatta (monkey, XP_001096328.3), Gallus gallus (chicken, XR_001470382.2), Chrysemys picta bellii (turtle, XP_005283970.1), Xenopus tropicalis (frog, XP_002938489.2), Danio rerio (zebrafish, ENSDART00000148193.3), Sus scrofa (pig, XP_020926573.1), Cricetulus griseus (chinese hamster, XP_003495626.1), Rattus norvegicus (rat, NP_001129306.1), Lagenorhynchus obliquidens (dolphin, XP_026957114.1), Vulpes vulpes (red fox, XP_025840964.1), Delphinapterus leucas (whale, XP_022408665.2), and Capra hircus (goat, XP_005674803.2).
![Biomolecules 12 01608 g002]()
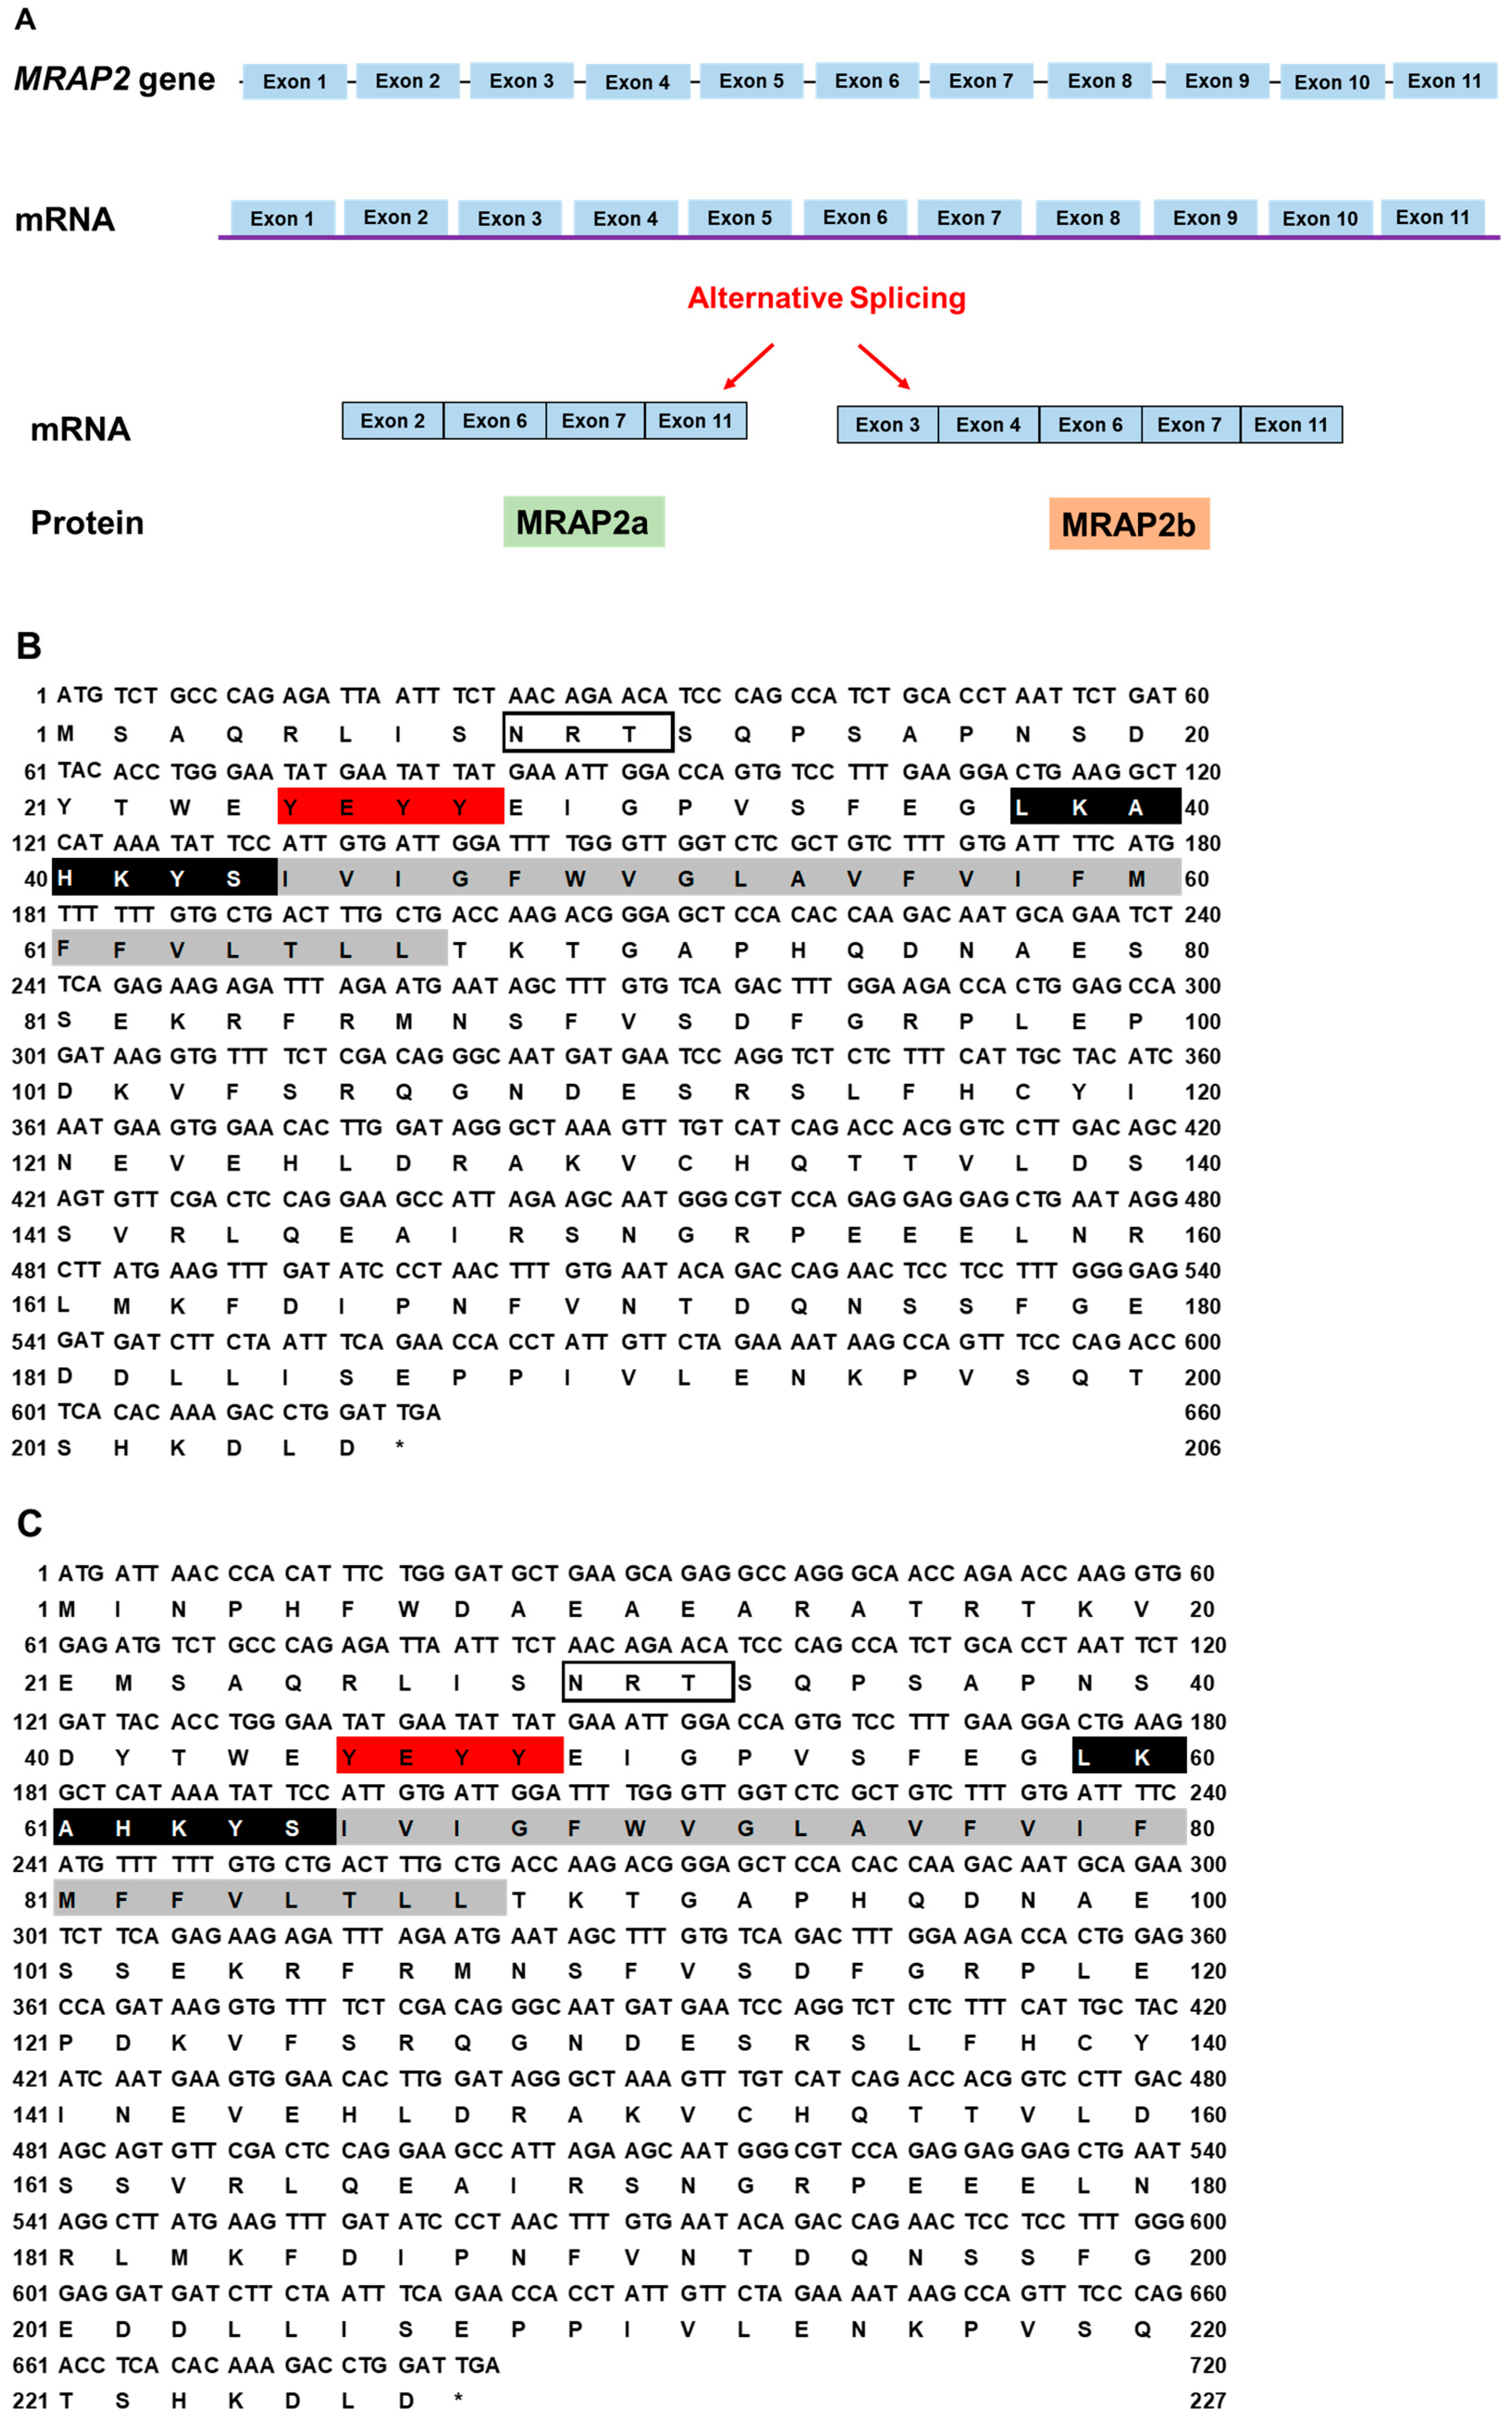
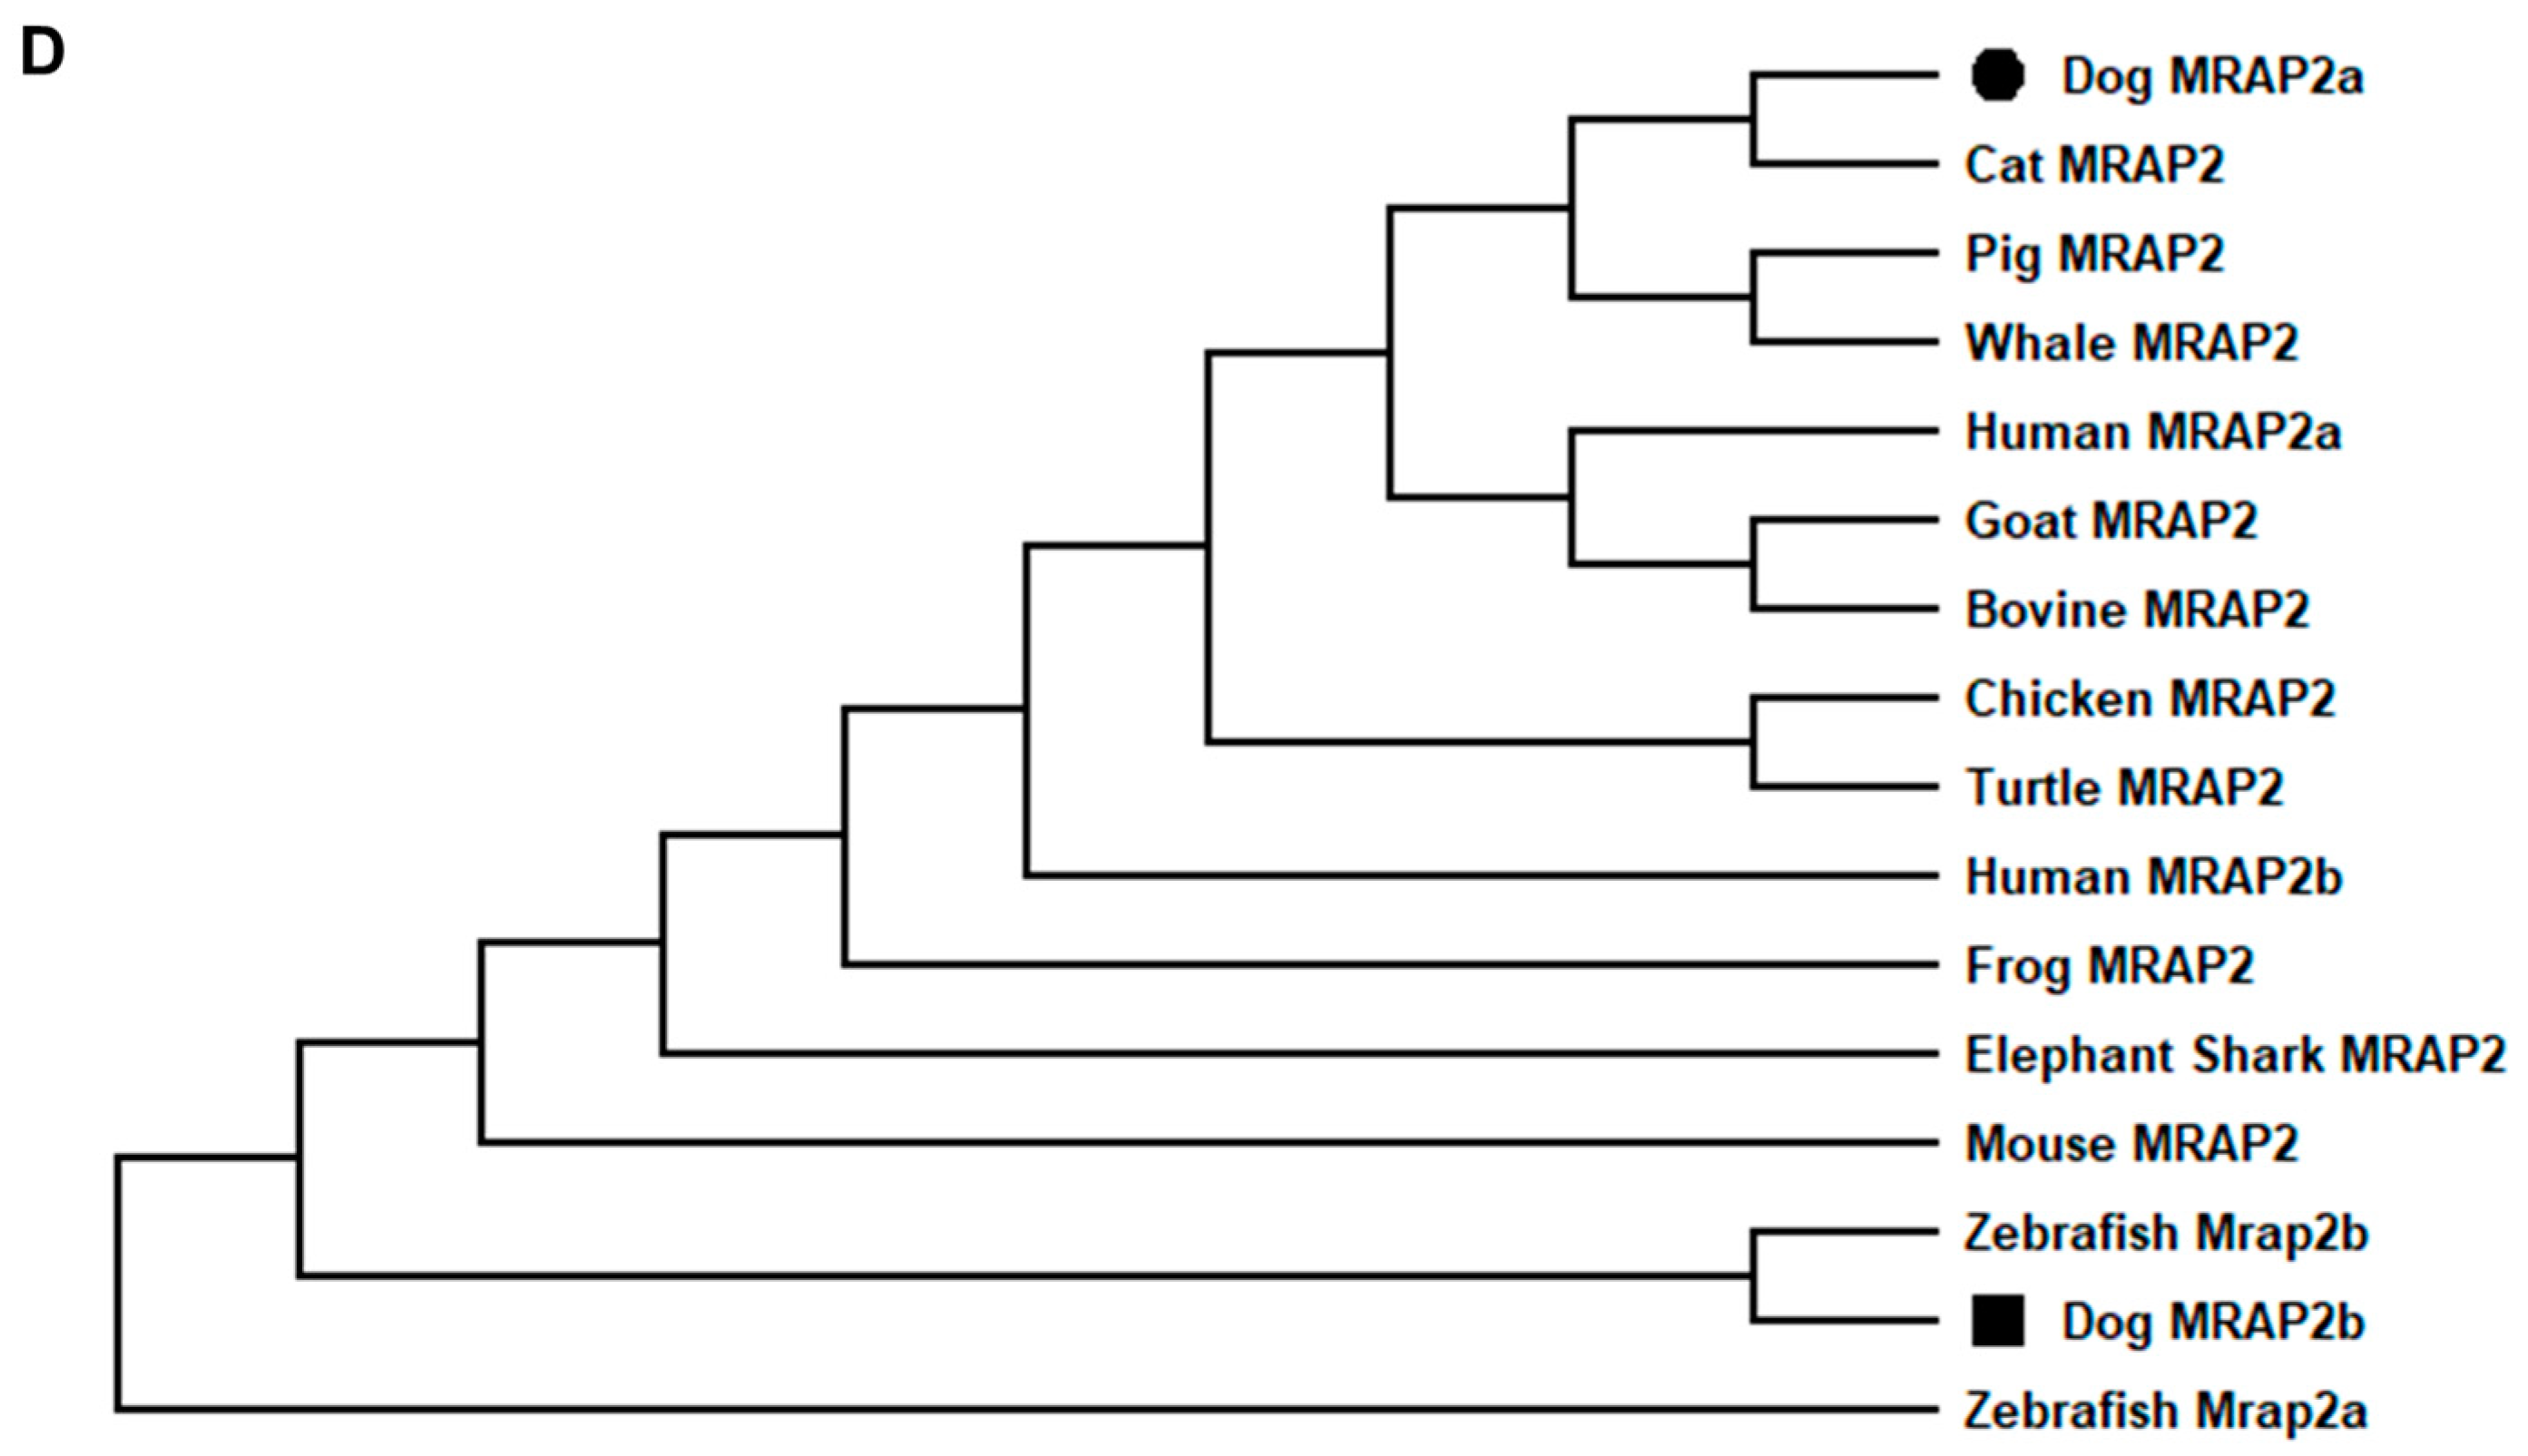
Figure 3.
Schematic diagram (A), nucleotide and deduced amino acid sequences (B, cMRAP2a, C, cMRAP2b) and phylogenetic tree (D) of MRAP2s. Positions of nucleotide and amino acid sequences are indicated on both sides. N-linked glycosylation sites are present in open boxes. Red box denotes YEYY motif. Light blue box indicates LDYL motif. Black box is LKANKYL motif. Shaded box shows putative TMD. Asterisk (*) shows stop codon. The tree was constructed by the neighbor-joining (NJ) method. Numbers at nodes indicate the bootstrap value, as percentages, obtained for 1000 replicates. Black dot denotes canine MRAP1. MRAP1s: MRAP2s: Canis lupus familiaris (dog MRAP2a, XM_038682814.1; MRAP2b, XM_038682813.1), Mus musculus (mouse NP_001171202.1), Sus scrofa (pig, XP_003353296.2), Capra hircus (goat, XP_017908670.1), Callorhinchus milii (elephant shark, XP_007906624.1), Balaenoptera musculus (whale, XP_036727732.1), Bos taurus (bovine, NP_001092863.1), Danio rerio (zebrafish, MRAP2a: F8W4H9.1, MRAP2b: F8W4H9.1), Gallus gallus (chicken, ALO81626.1), Mus caroli (Ryukyu mouse, XP_021029091.1), and Homo sapiens (human, AAH10003.2).
![Biomolecules 12 01608 g003a]()
![Biomolecules 12 01608 g003b]()
Figure 4.
Ligand binding properties of cMC3R. Different concentrations of unlabeled NDP-MSH (A), α-MSH (B), β-MSH (C), ACTH (1-24) (D), and D-Trp8-γ-MSH (E) were used to displace the binding of 125I-NDP-MSH. Results are expressed as % of hMC3R binding ± range from duplicate determinations within one experiment. All experiments were repeated at least three independent times.
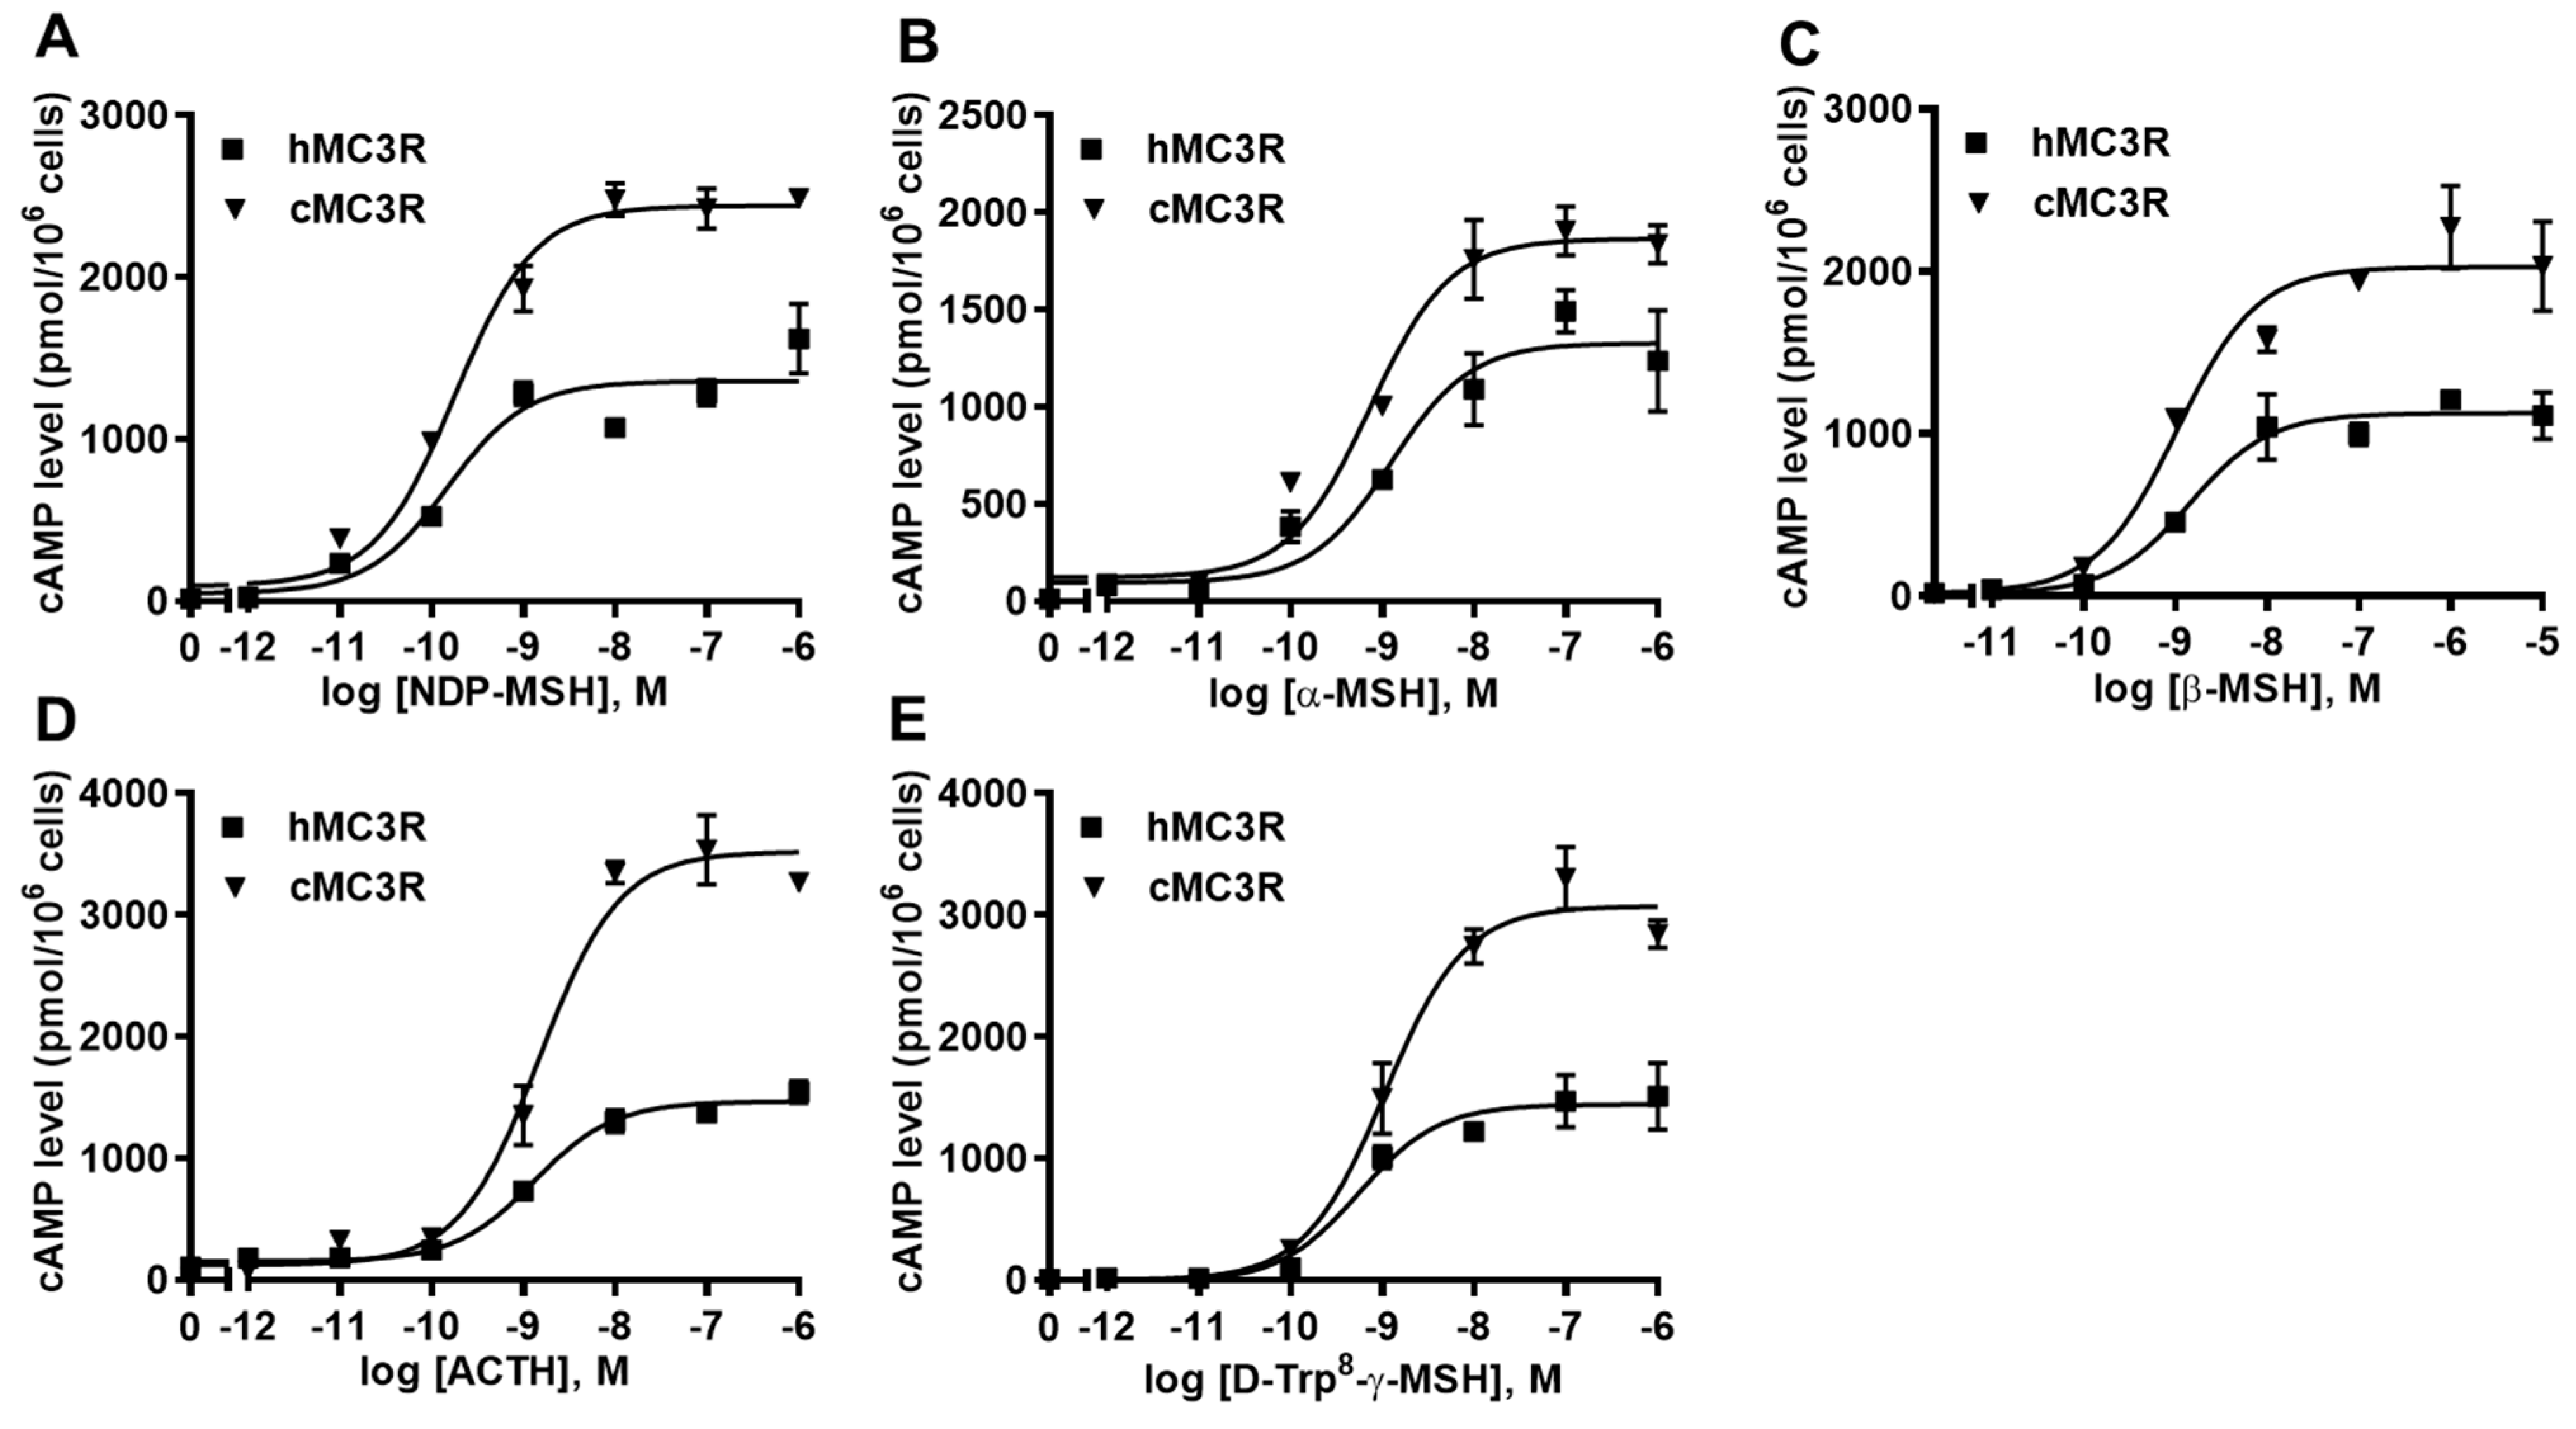
Figure 5.
Signaling properties of cMC3R. HEK293T cells were transiently transfected with MC3R plasmids. Different concentrations of NDP-MSH (A), α-MSH (B), β-MSH (C), ACTH (1-24) (D), and D-Trp8-γ-MSH (E) were used to stimulate the cells. Data are means ± SEM from triplicate measurements within one experiment. All experiments were performed at least three times independently.
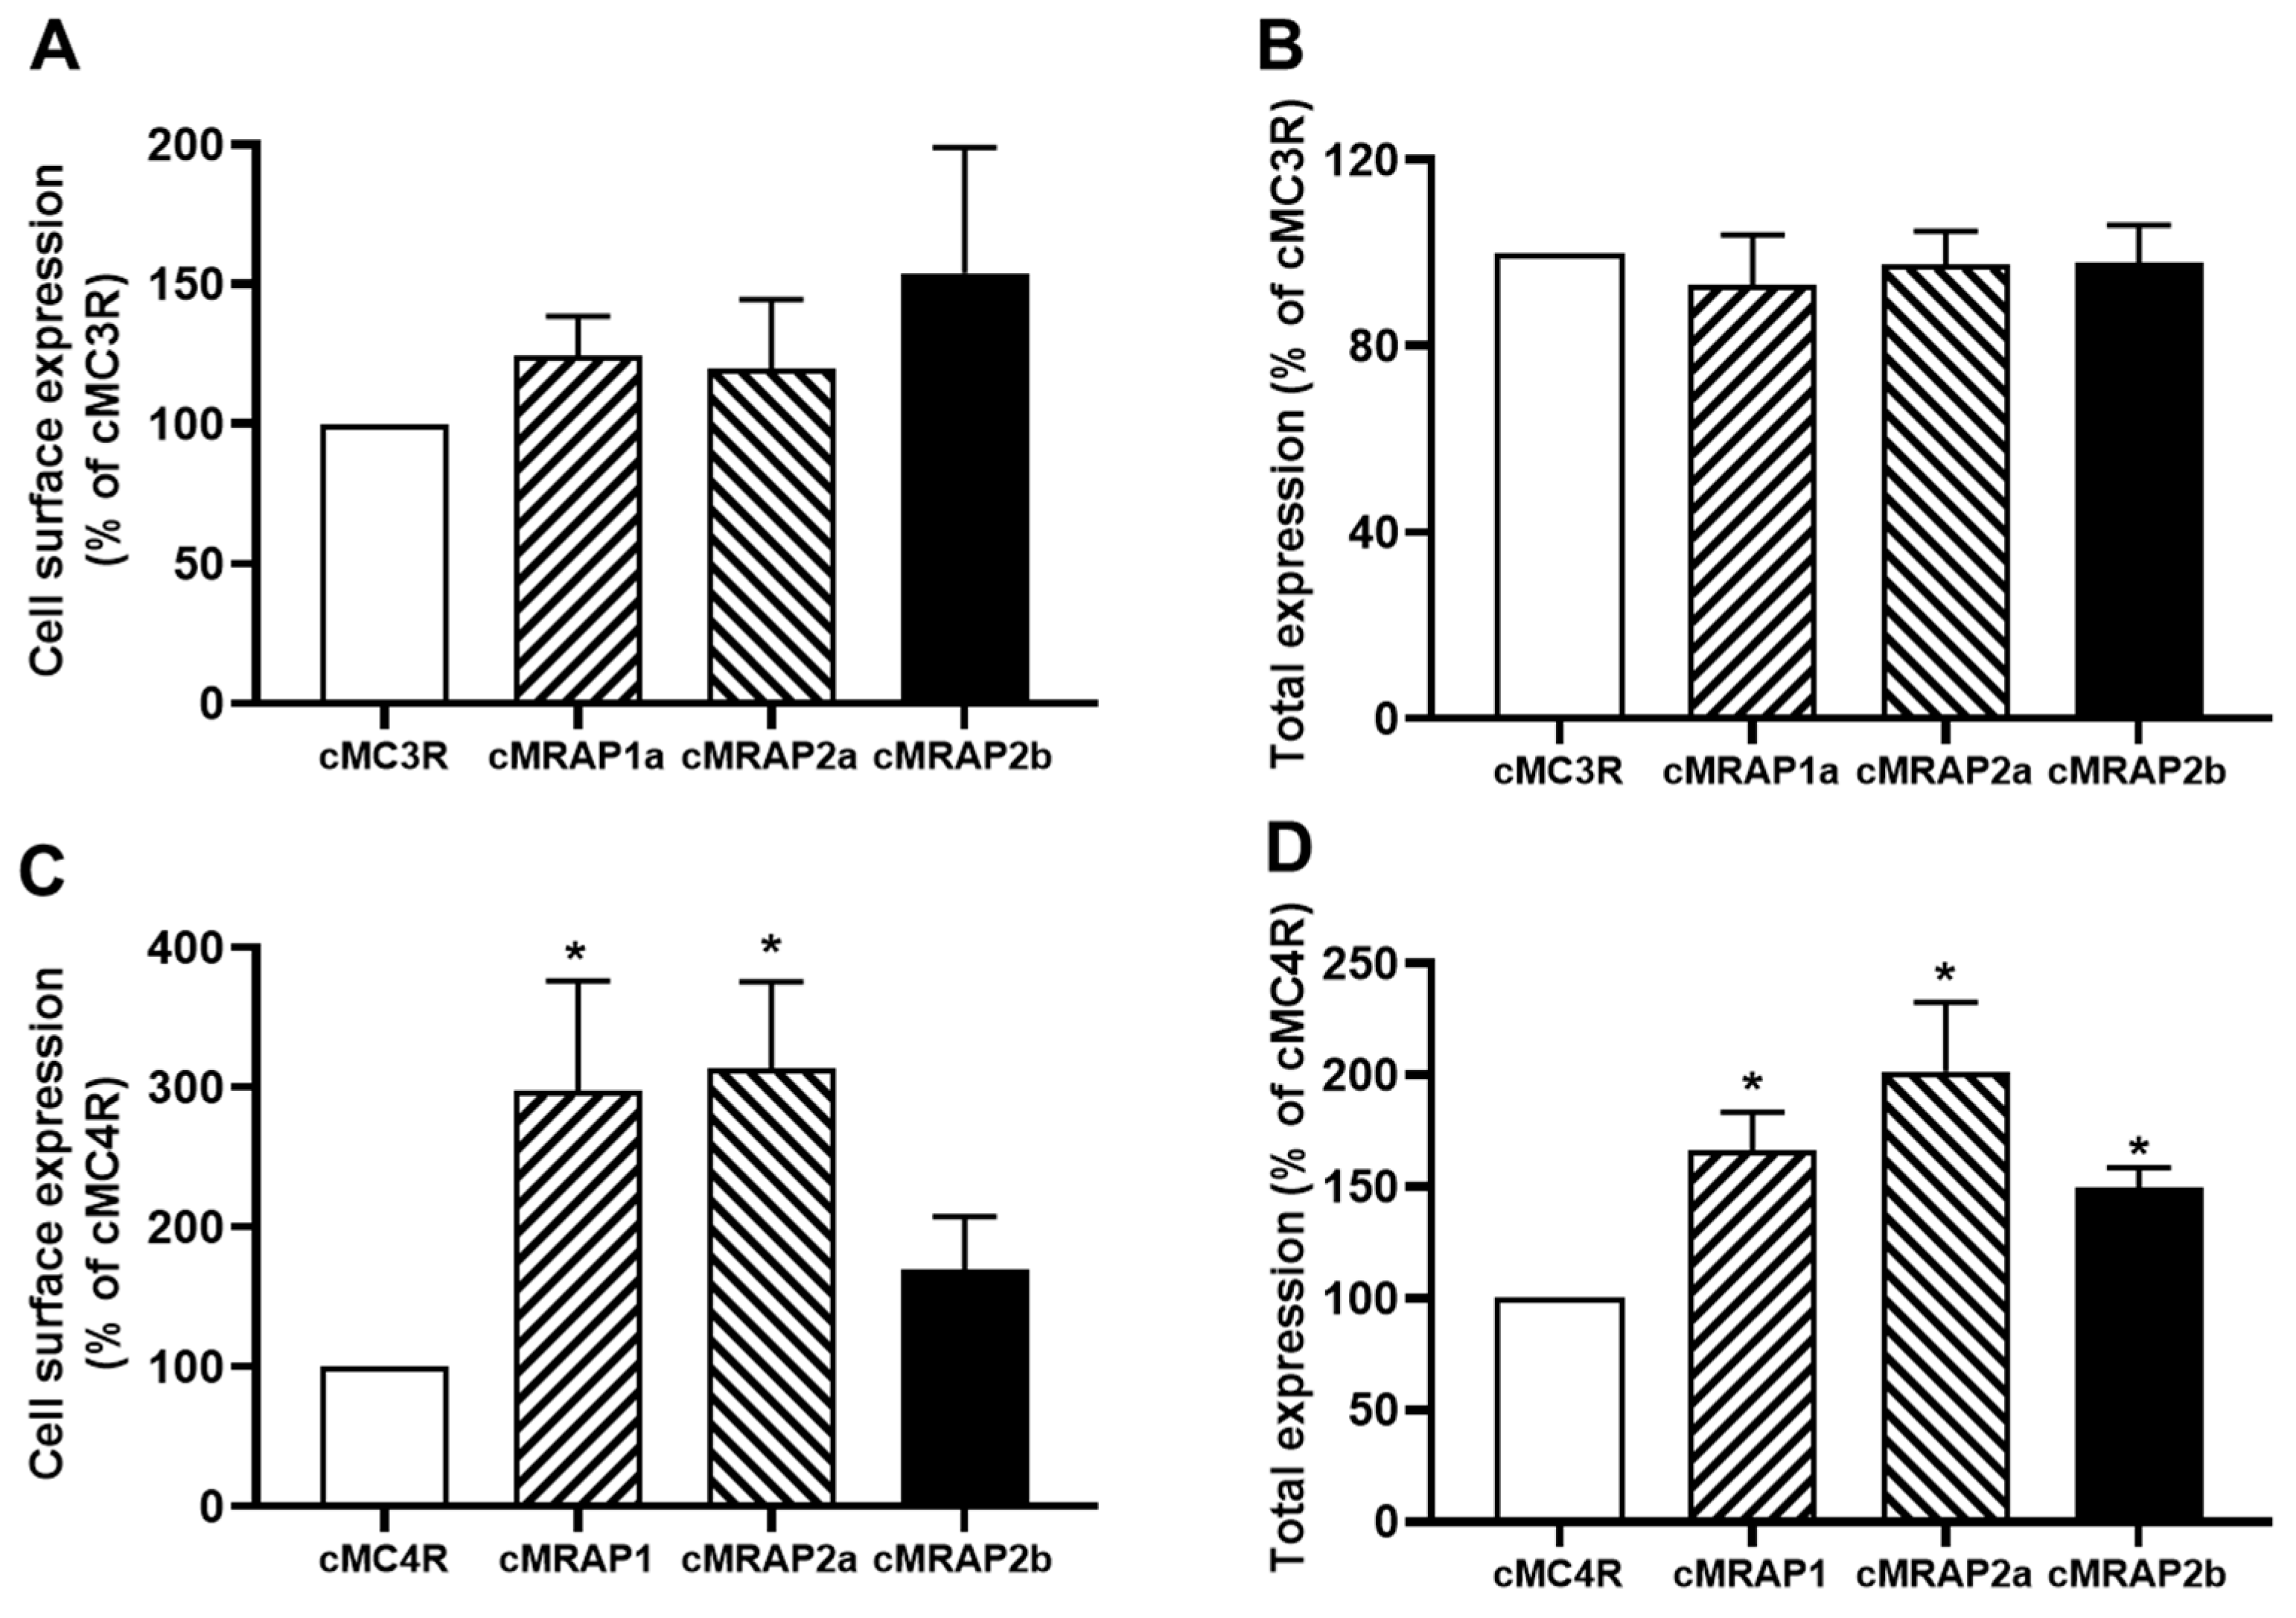
Figure 6.
Regulation of cMC3R (A,B) and cMC4R (C,D) expression by MRAPs. Cell surface and total expression of cMC3R and MC4R was measured by flow cytometry. HEK293T cells were co-transfected with cMC3R or cMC4R and cMRAPs (1:5). Fluorescence in cells transfected with empty vector pcDNA3.1 was used for background staining. The results were calculated as % of 1:0 group. Each data point represented the mean ± SEM (n = 3–4). * Indicates significantly different from 1:0 group (p < 0.05) (one-way ANOVA followed by Tukey test).
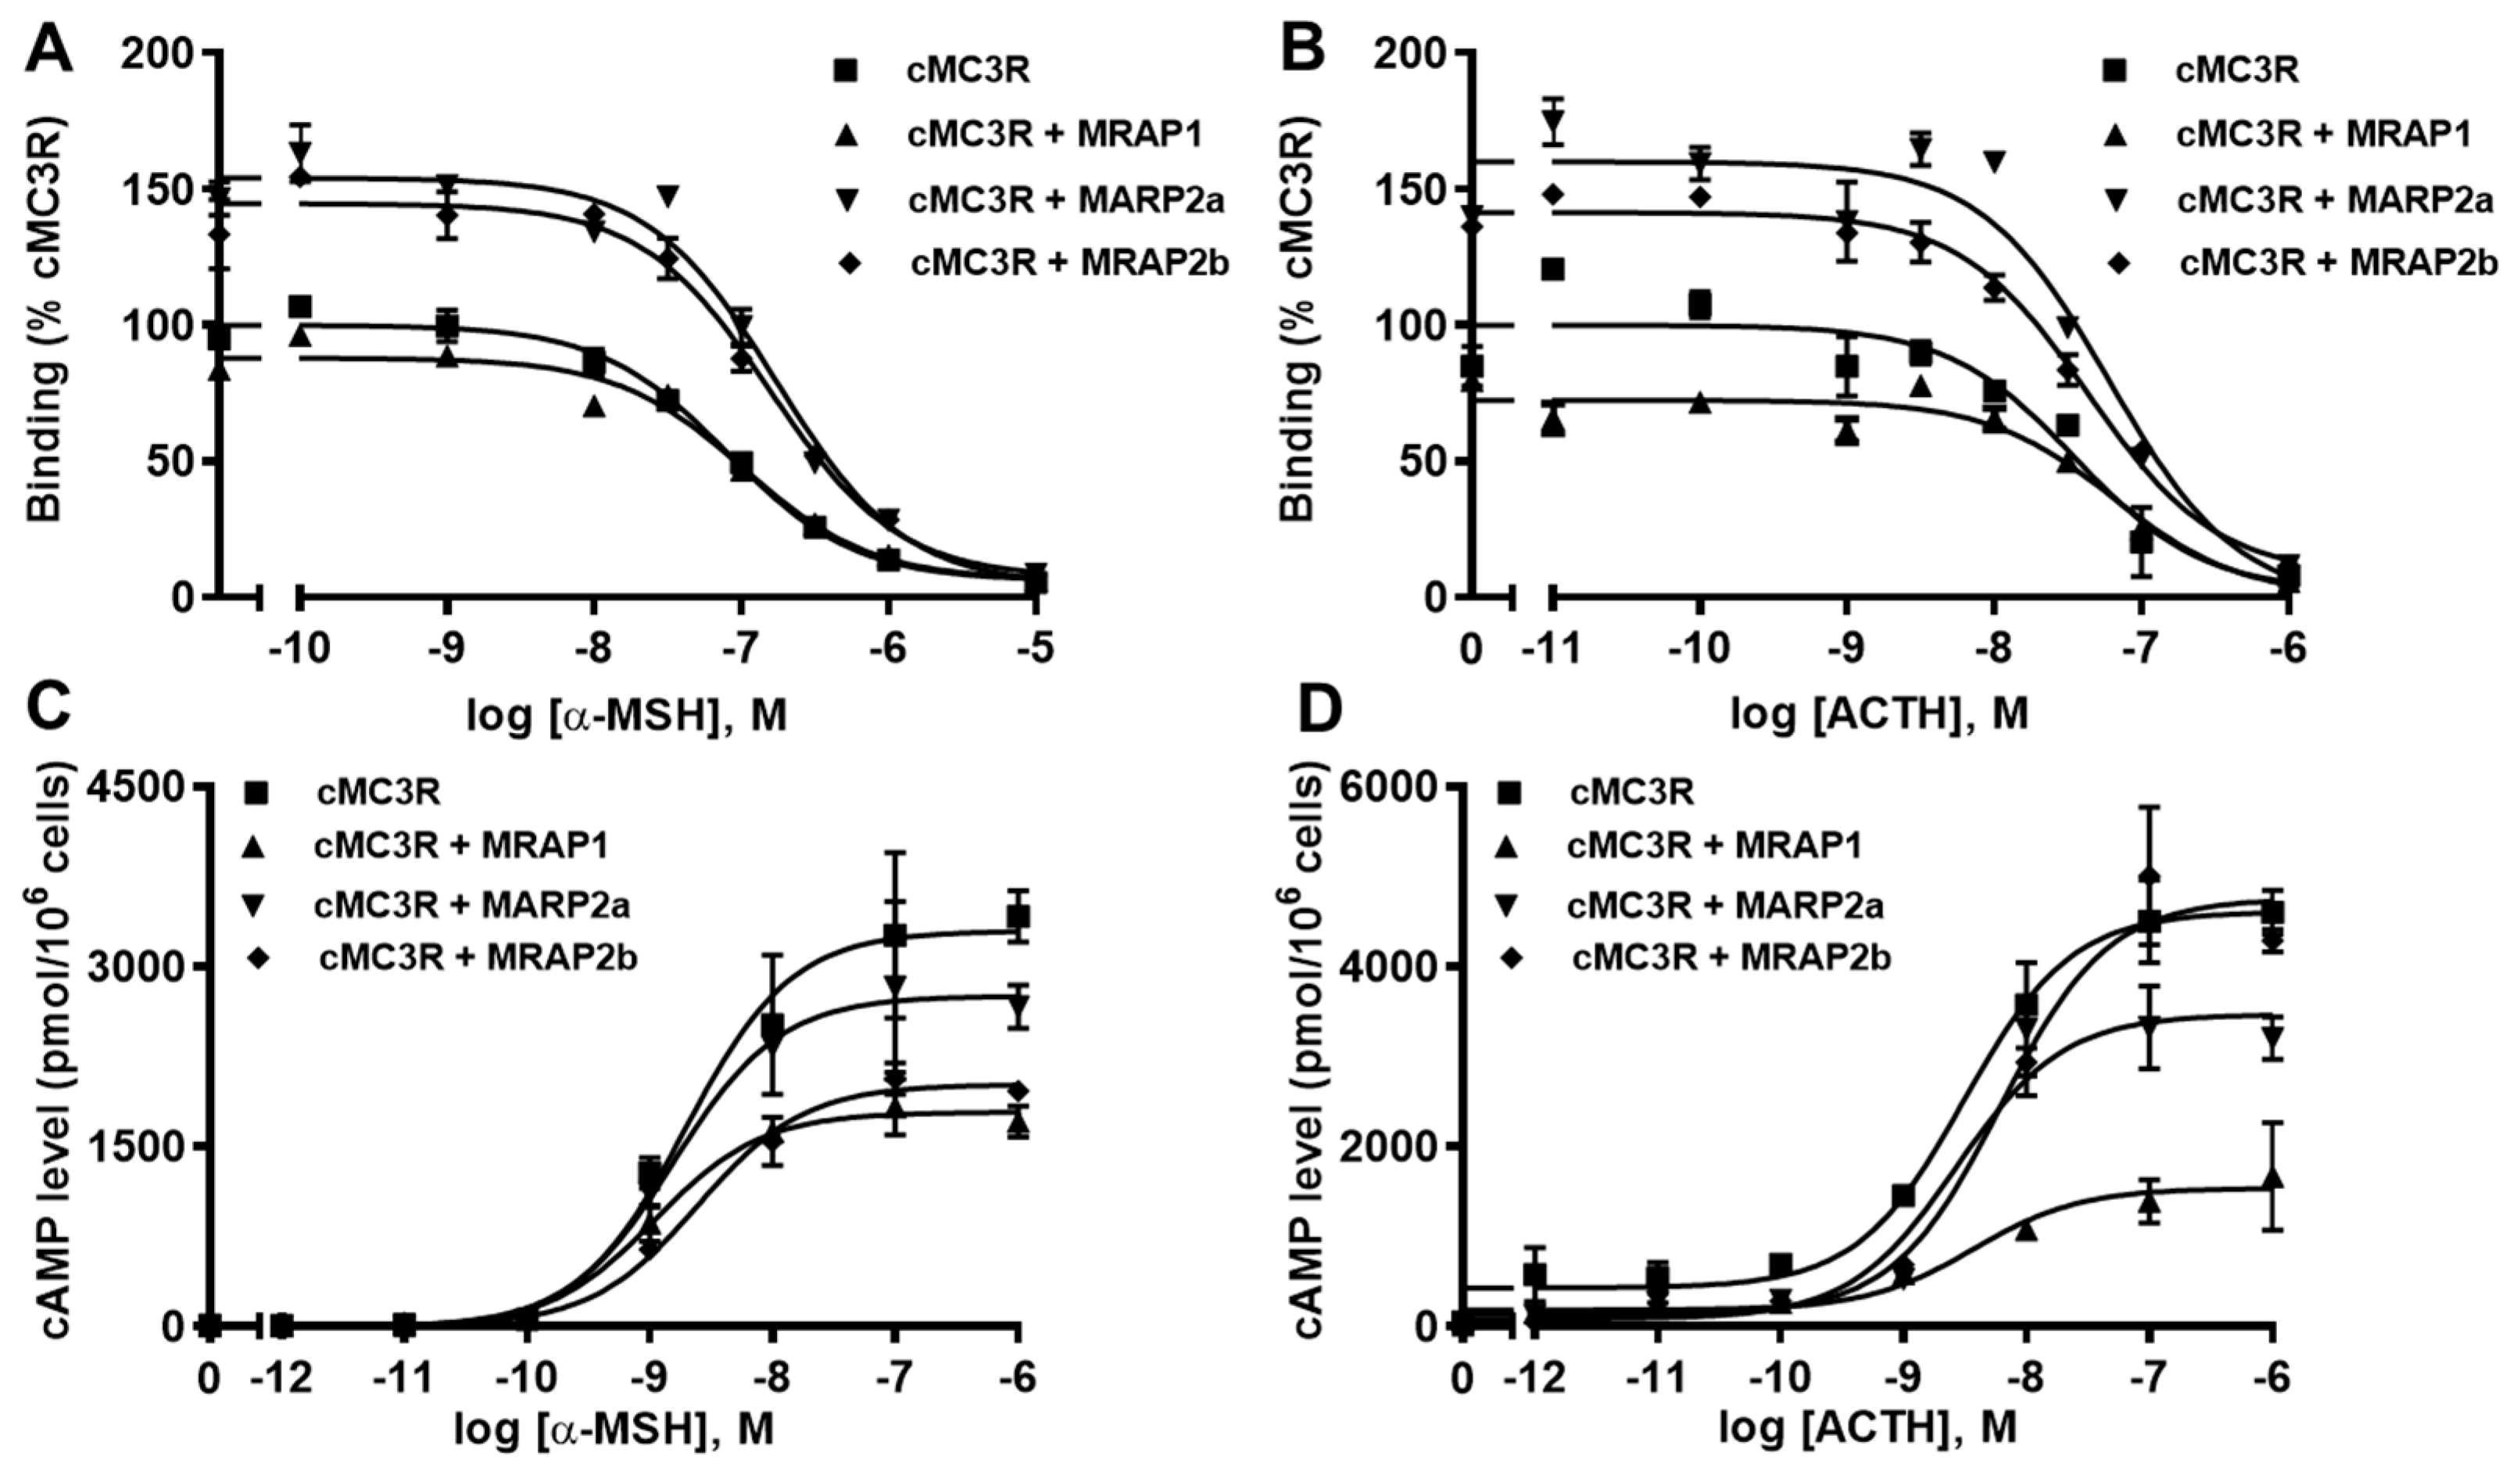
Figure 7.
Modulation of cMC3R pharmacology by MRAPs. Ligand binding (A,B) and signaling (C,D) properties of cMC4R to α-MSH or ACTH (1-24) upon co-expression of cMC4R with cMRAP1, cMRAP2a or cMRAP2b were measured. Results of binding properties were calculated as % of cMC4R without MRAPs, from duplicate determinations within one experiment. All experiments were performed at least three independent times.
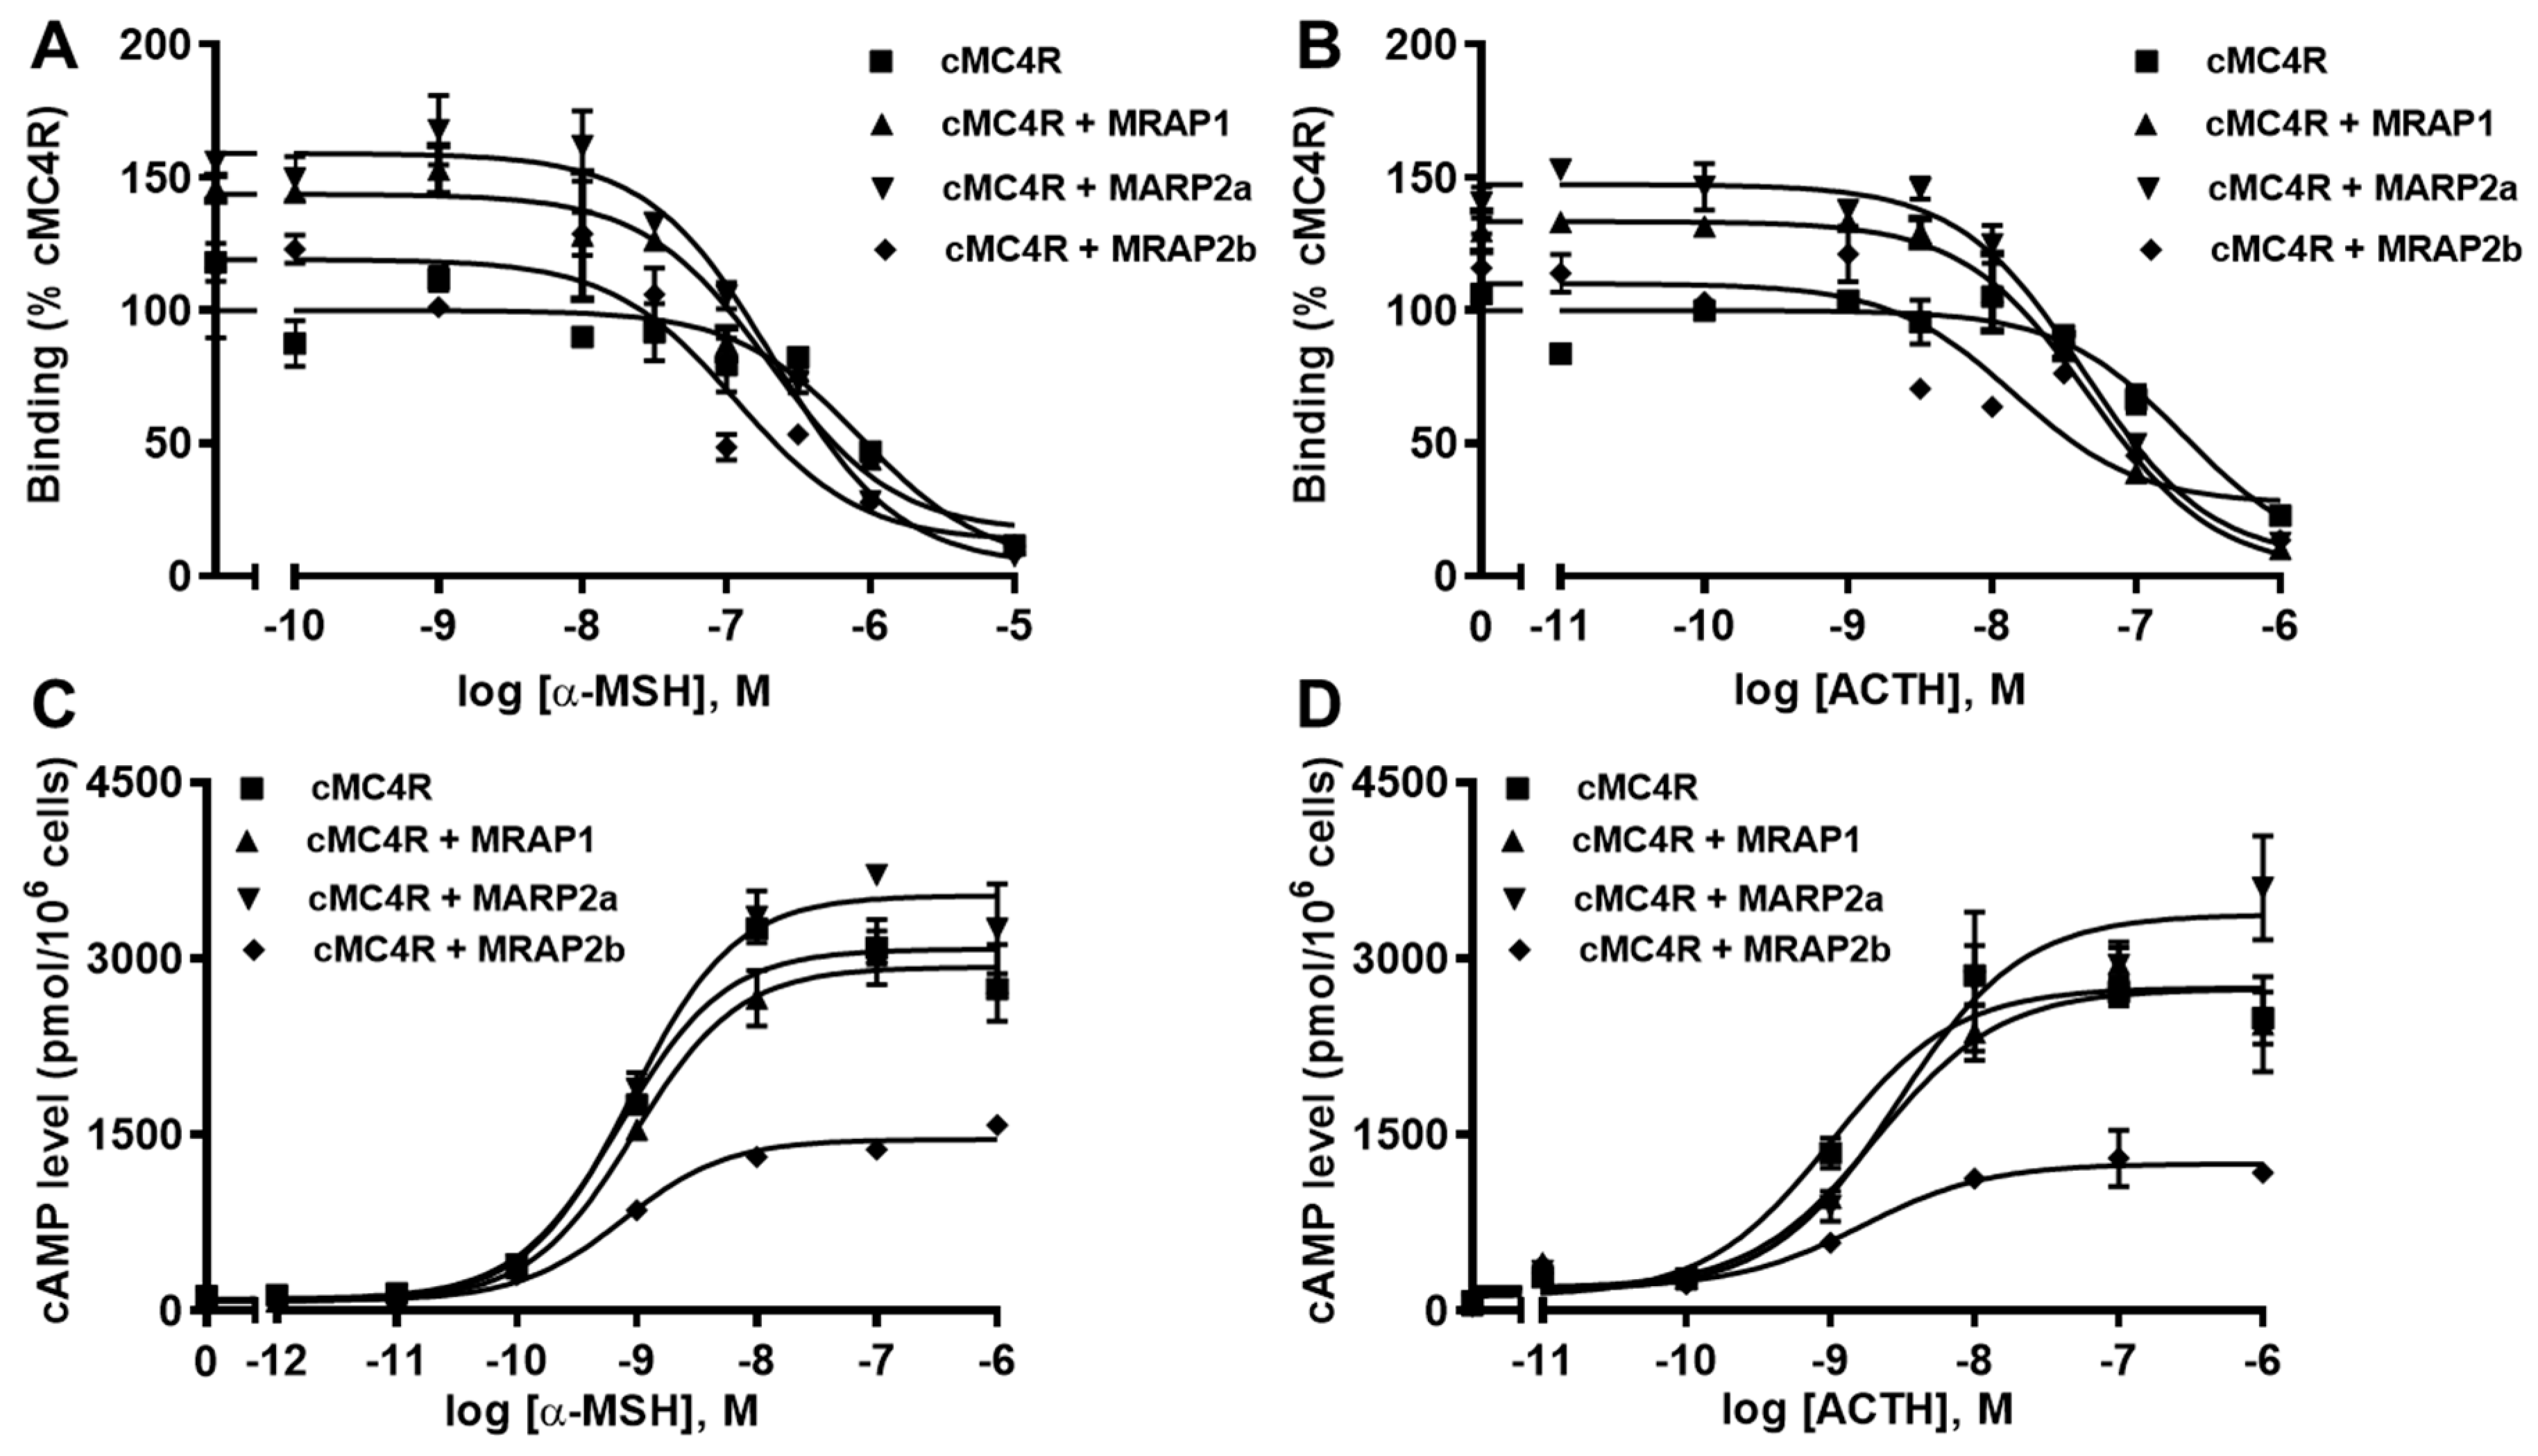
Figure 8.
Modulation of cMC4R pharmacology by MRAPs. Ligand binding (A,B) and signaling (C,D) properties of cMC4R to α-MSH or ACTH (1-24) upon co-expression of cMC4R with cMRAP1, cMRAP2a or cMRAP2b were measured. Results of binding properties were calculated as % of cMC4R without MRAPs, from duplicate determinations within one experiment. All experiments were performed at least three independent times.
Table 1.
The ligand binding properties of cMC3R.
Table 1.
The ligand binding properties of cMC3R.
| MC3R | IC50 (nM) | cMC3R | hMC3R |
|---|
| Bmax (%) | | 247.97 ± 13.44 b | 100 |
| NDP-MSH | IC50 (nM) | 4.37 ± 0.72 a | 1.98 ± 0.43 |
| α-MSH | IC50 (nM) | 240.42 ± 37.34 | 221.57 ± 30.23 |
| β-MSH | IC50 (nM) | 140.18 ± 31.37 | 161.56 ± 31.45 |
| ACTH | IC50 (nM) | 58.52 ± 8.67 | 45.71 ± 5.23 |
| D-Trp8-γ-MSH | IC50 (nM) | 39.30 ± 0.30 b | 24.62 ± 1.25 |
Table 2.
The signaling properties of cMC3R.
Table 2.
The signaling properties of cMC3R.
| MC3R | EC50/Rmax | cMC3R | hMC3R |
|---|
| Basal (%) | | 100.72 ± 7.69 | 100 |
| NDP-MSH | EC50 (nM) | 0.40 ± 0.16 | 0.24 ± 0.11 |
| Rmax (%) | 199.38 ± 28.06 a | 100 |
| α-MSH | EC50 (nM) | 0.97 ± 0.35 | 1.49 ± 0.22 |
| Rmax (%) | 145.69 ± 14.30 | 100 |
| β-MSH | EC50 (nM) | 1.04 ± 0.23 | 1.46 ± 0.55 |
| Rmax (%) | 229.77 ± 46.45 a | 100 |
| ACTH | EC50 (nM) | 1.46 ± 0.30 | 2.12 ± 0.69 |
| Rmax (%) | 182.83 ± 25.21 a | 100 |
| D-Trp8-γ-MSH | EC50 (nM) | 1.08 ± 0.15 | 0.71 ± 0.19 |
| Rmax (%) | 188.25 ± 19.56 a | 100 |
Table 3.
The effect of MRAPs on ligand binding properties of cMC3R.
Table 3.
The effect of MRAPs on ligand binding properties of cMC3R.
| cMC3R/cMRAPs | Bmax (%) | α-MSH | ACTH |
|---|
| IC50 (nM) | IC50 (nM) |
|---|
| cMC3R | 100 | 106.68 ± 13.80 | 55.56 ± 11.64 |
| cMC3R/cMRAP1 | 81.81 ± 5.01 a | 127.76 ± 30.47 | 68.59 ± 9.31 |
| cMC3R/cMRAP2a | 148.43 ± 14.94 a | 118.61 ± 22.25 | 57.58 ± 4.09 |
| cMC3R/cMRAP2b | 128.42 ± 9.06 a | 148.03 ± 30.16 | 49.59 ± 6.77 |
Table 4.
The effect of MRAPs on cAMP signaling of cMC3R.
Table 4.
The effect of MRAPs on cAMP signaling of cMC3R.
| cMC3R/cMRAPs | Basal (%) | α-MSH | ACTH |
|---|
| EC50 (nM) | Rmax (%) | EC50 (nM) | Rmax (%) |
|---|
| cMC3R | 100 | 3.08 ± 1.26 | 100 | 2.02 ± 0.39 | 100 |
| cMC3R/cMRAP1 | 100.91 ± 16.74 | 0.88 ± 0.18 | 46.67 ± 8.88 b | 2.11 ± 0.56 | 46.61 ± 12.37 a |
| cMC3R/cMRAP2a | 84.71 ± 19.03 | 1.37 ± 0.26 | 73.02 ± 5.81 a | 2.18 ± 0.39 | 73.79 ± 4.94 a |
| cMC3R/cMRAP2b | 68.88 ± 9.35 a | 3.64 ± 1.11 | 66.93 ± 9.64 a | 3.41 ± 0.99 | 85.02 ± 11.04 |
Table 5.
The effect of MRAPs on ligand binding properties of cMC4R.
Table 5.
The effect of MRAPs on ligand binding properties of cMC4R.
| cMC4R/cMRAPs | Bmax (%) | α-MSH | ACTH |
|---|
| IC50 (nM) | IC50 (nM) |
|---|
| cMC4R | 100 | 504.66 ± 124.33 | 348.29 ± 94.51 |
| cMC4R/cMRAP1 | 151.36 ± 10.67 a | 186.62 ± 13.60 a | 37.63 ± 6.84 b |
| cMC4R/cMRAP2a | 167.03 ± 11.83 c | 228.40 ± 40.74 a | 35.63 ± 8.10 b |
| cMC4R/cMRAP2b | 121.60 ± 10.06 | 120.19 ± 22.41 b | 16.93 ± 5.69 c |
Table 6.
The effect of MRAPs on signaling properties of cMC4R.
Table 6.
The effect of MRAPs on signaling properties of cMC4R.
| cMC4R/cMRAPs | Basal (%) | α-MSH | ACTH |
|---|
| EC50 (nM) | Rmax (%) | EC50 (nM) | Rmax (%) |
|---|
| cMC4R | 100 | 1.18 ± 0.21 | 100 | 0.92 ± 0.41 | 100 |
| cMC4R/cMRAP1 | 53.89 ± 4.06 b | 1.37 ± 0.24 | 99.80 ± 3.80 | 1.92 ± 0.40 | 76.21 ± 13.29 |
| cMC4R/cMRAP2a | 74.70 ± 4.28 b | 0.90 ± 0.10 | 87.00 ± 10.28 | 3.82 ± 1.25 | 144.41 ± 13.36 a |
| cMC4R/cMRAP2b | 55.82 ± 3.43 b | 0.63 ± 0.10 | 52.62 ± 7.93 b | 1.20 ± 0.44 | 55.87 ± 9.82 a |


