
Culture of Cancer Cells at Physiological Oxygen Levels Affects Gene Expression in a Cell-Type Specific Manner


Abstract
:1. Introduction
2. Materials and Methods
2.1. Cell Culture
2.2. RNA Isolation
2.3. Sequencing and Differential Gene Expression Analysis
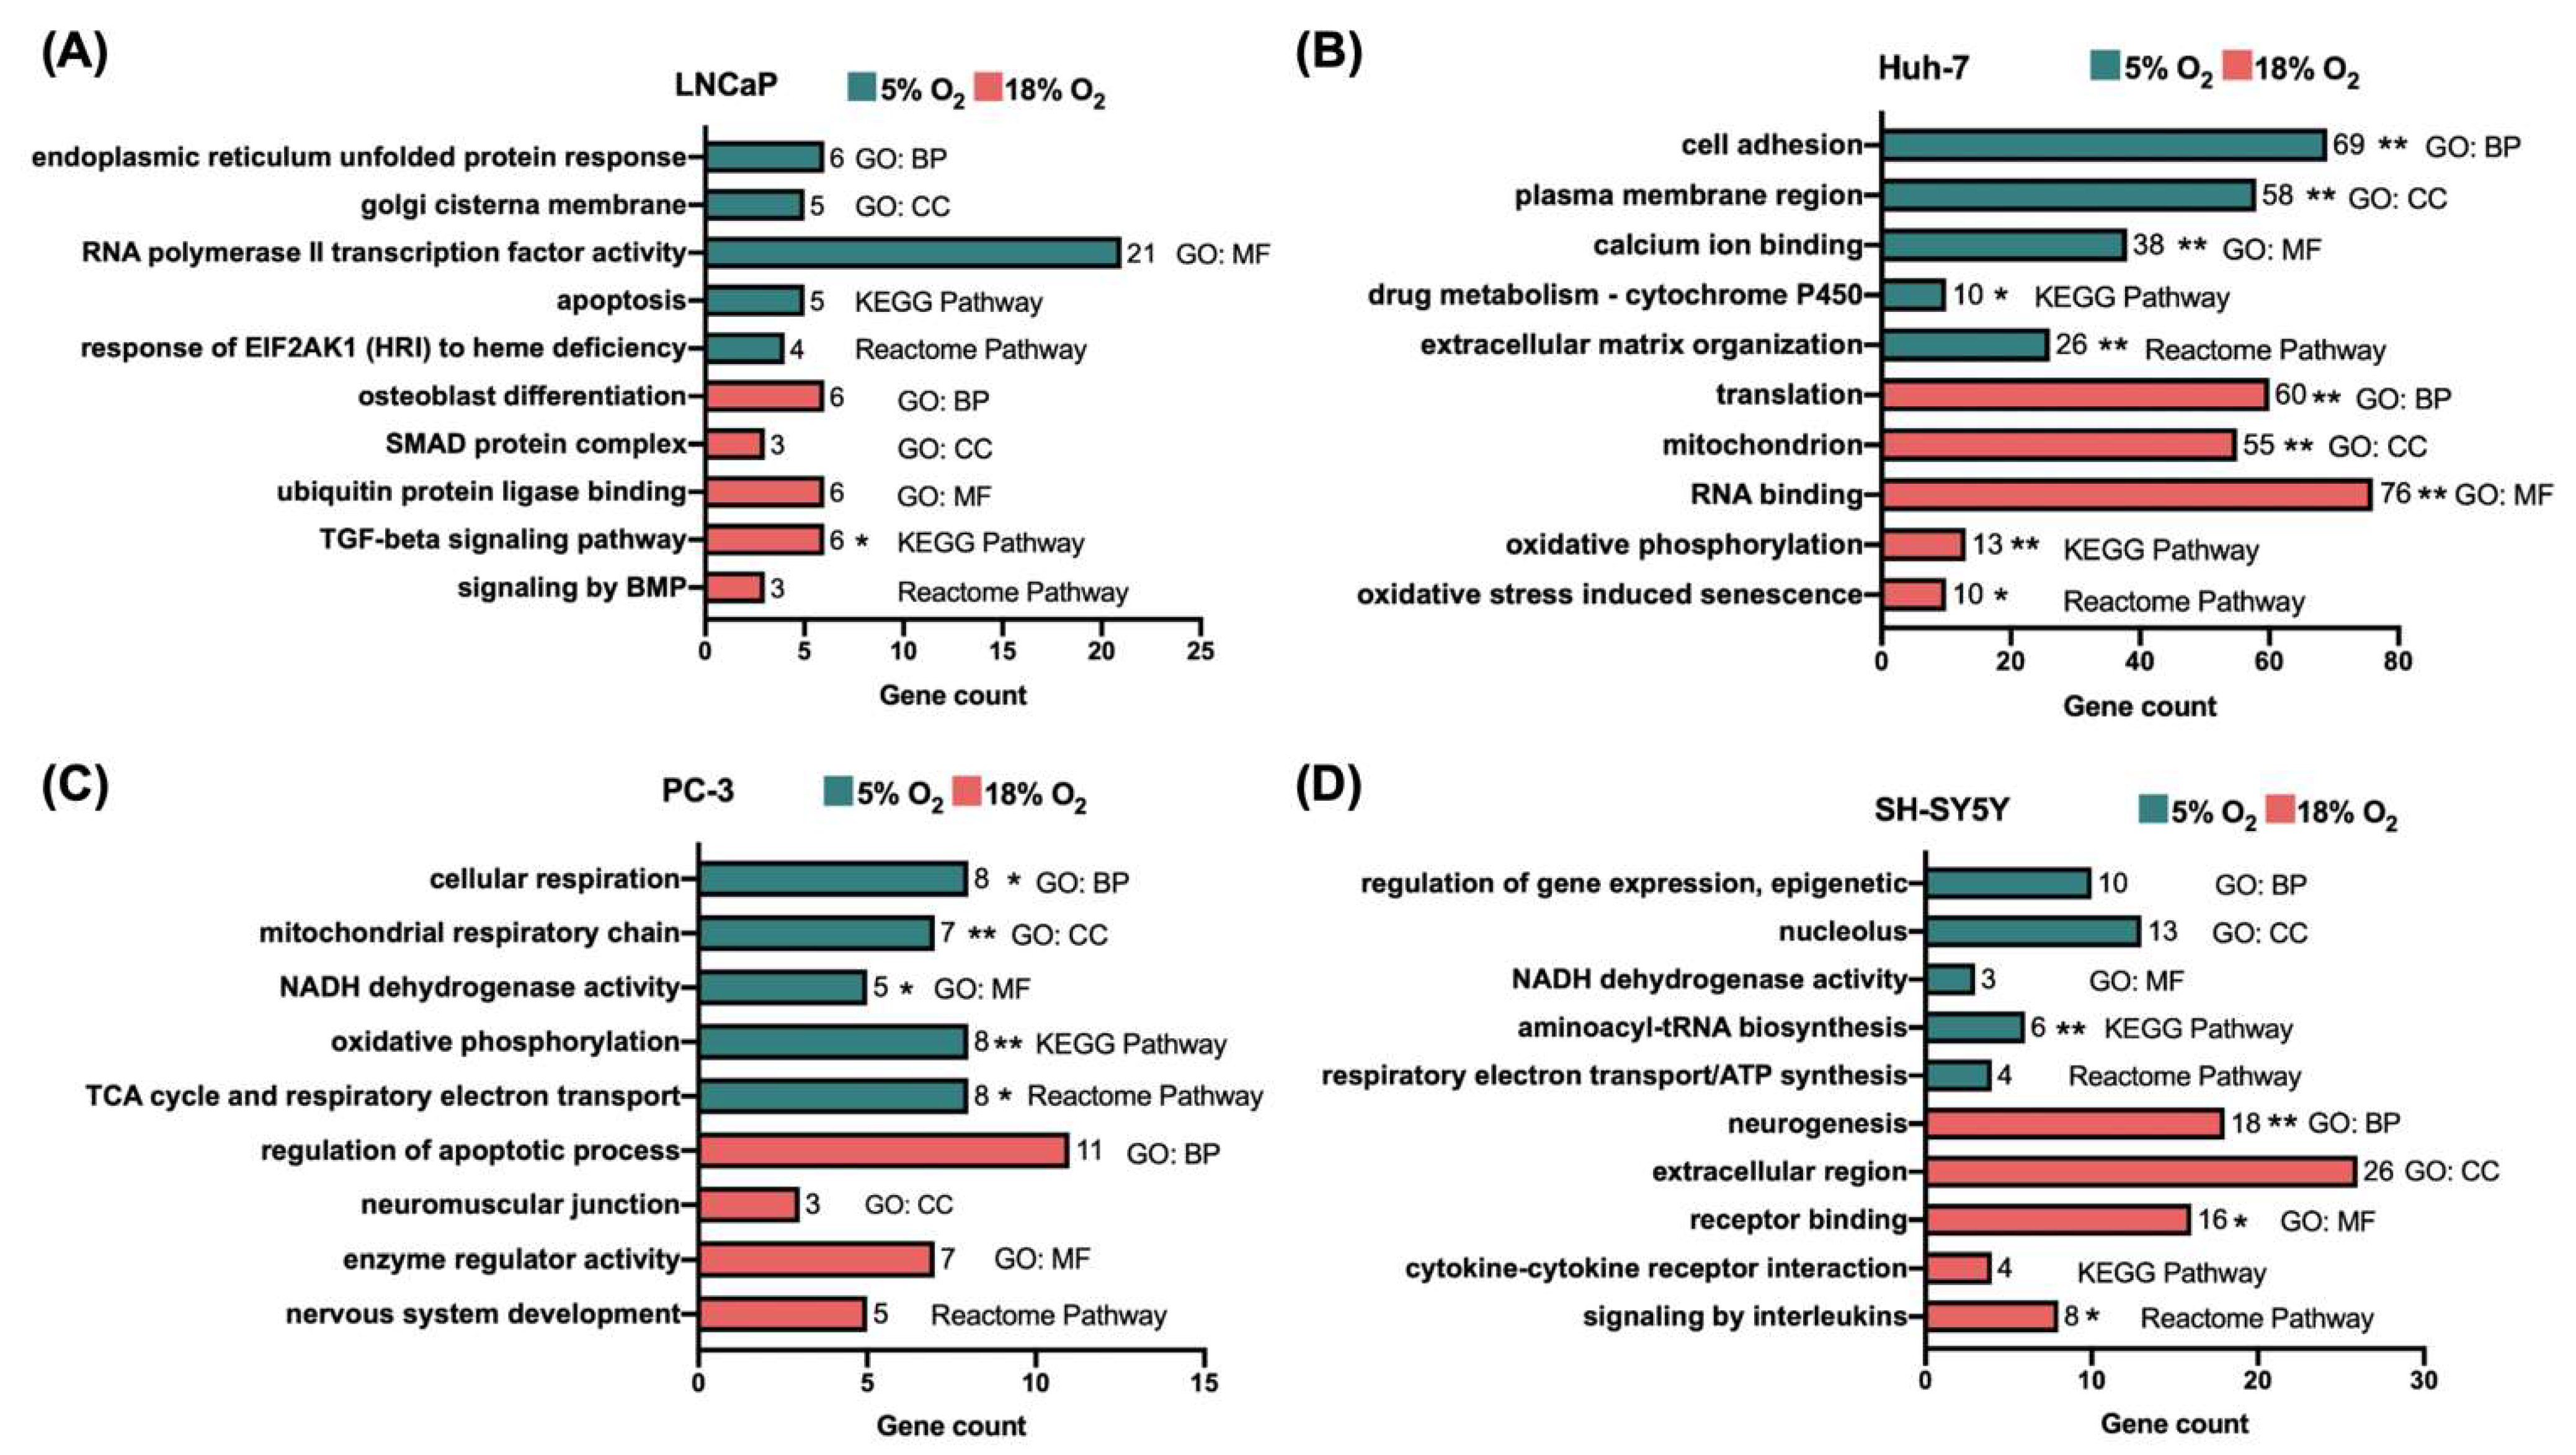
2.4. Functional Enrichment Analysis
2.5. Correlation Analysis of PC-3 and LNCaP Data with Gene Expression Data from the Prostate Cancer Transcriptome Atlas (PCTA)
3. Results
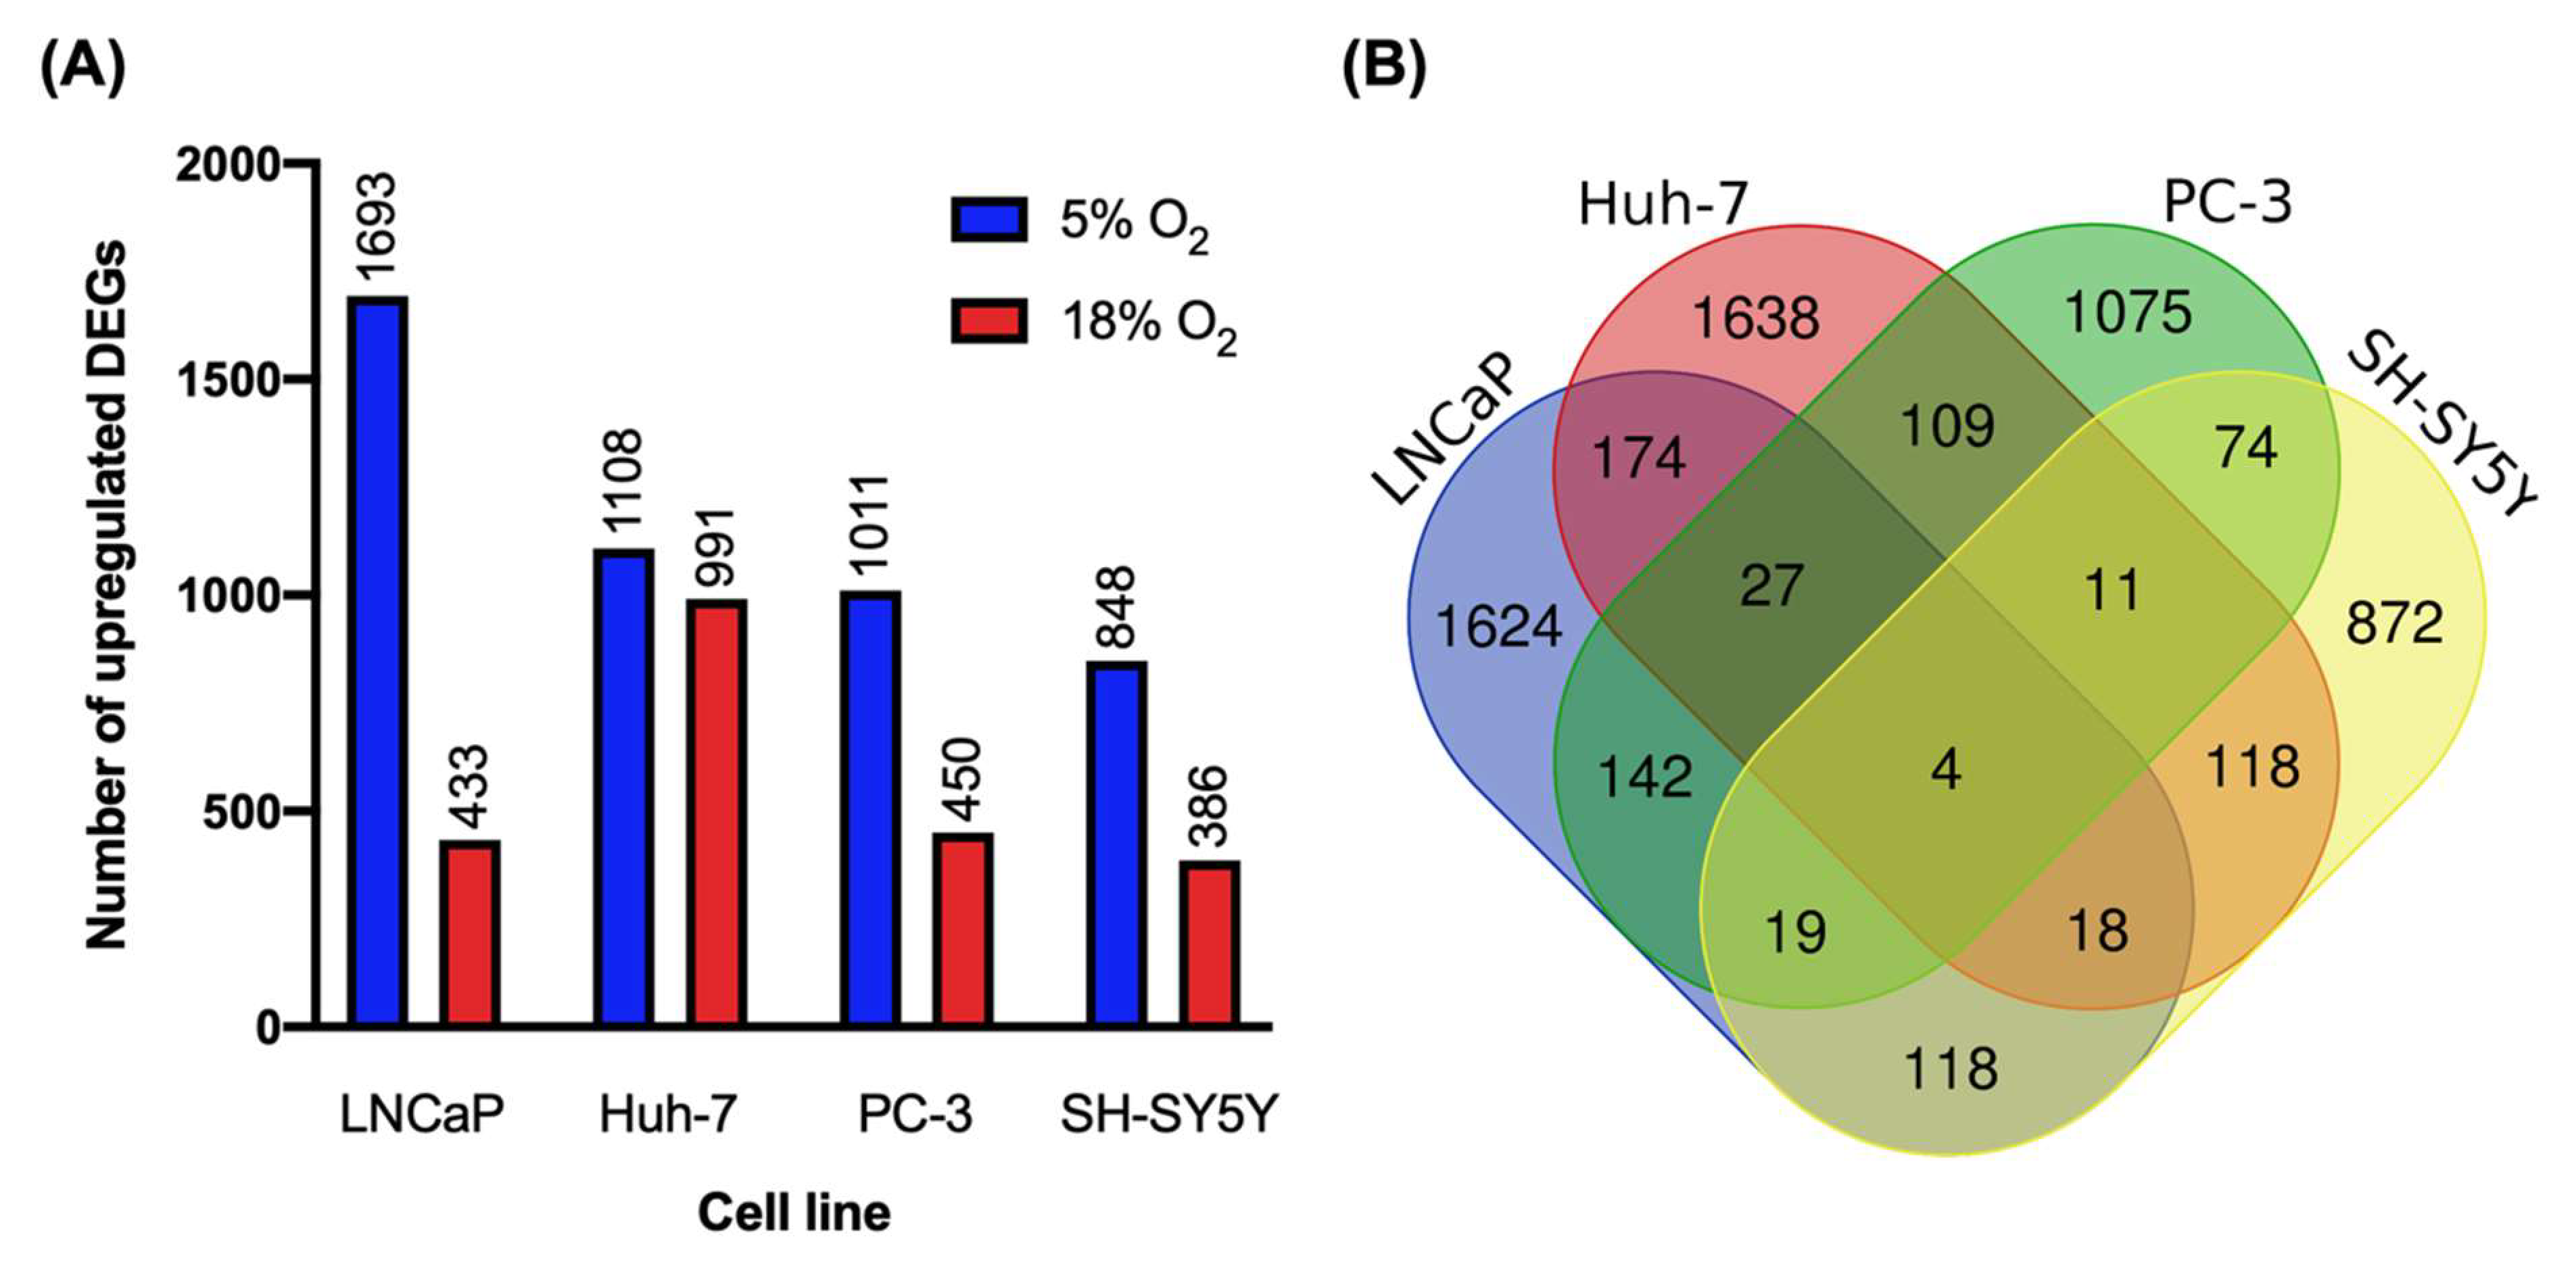
3.1. Oxygen Levels in Culture Strongly Modulated Transcript Abundance Cell-Line Specifically
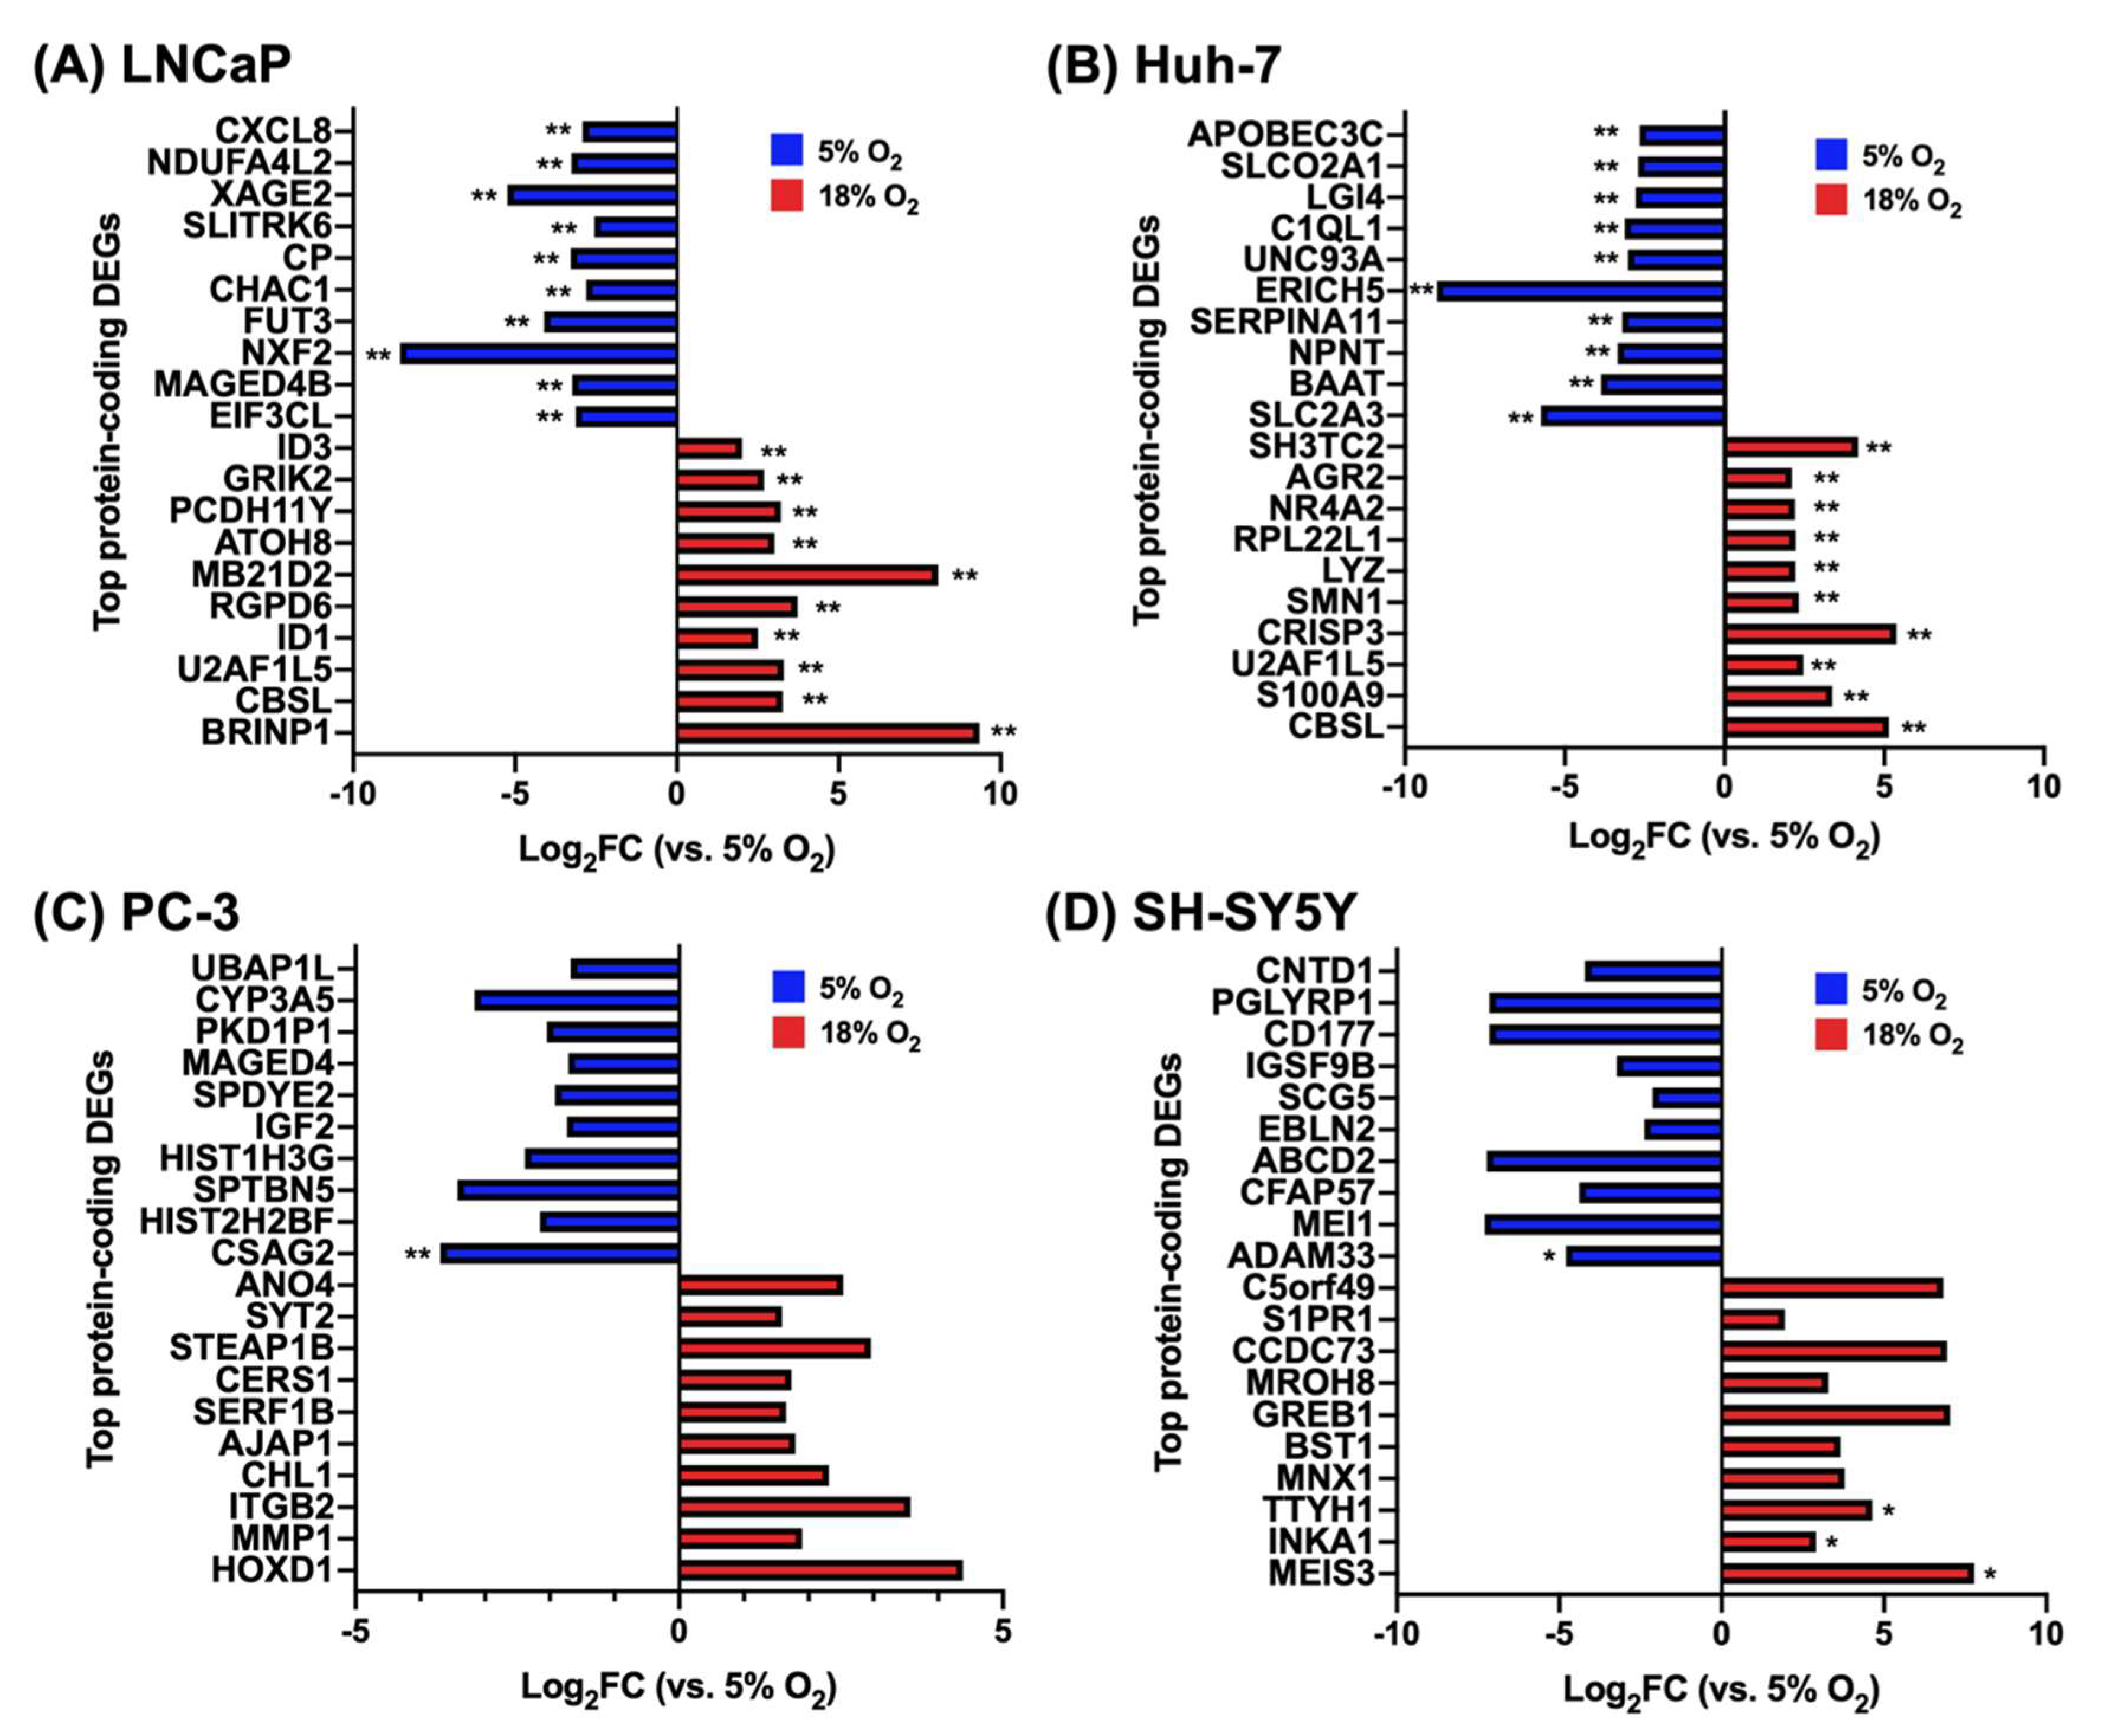
3.2. The Top Differentially Expressed Genes Have Key Roles in Cancer Cell Biology
3.3. Oxygen Levels Affected mtDNA-Encoded Transcript Abundances in Most Cell Lines
3.4. HIF Targets Were Upregulated at 5% O2 in All Cell Lines
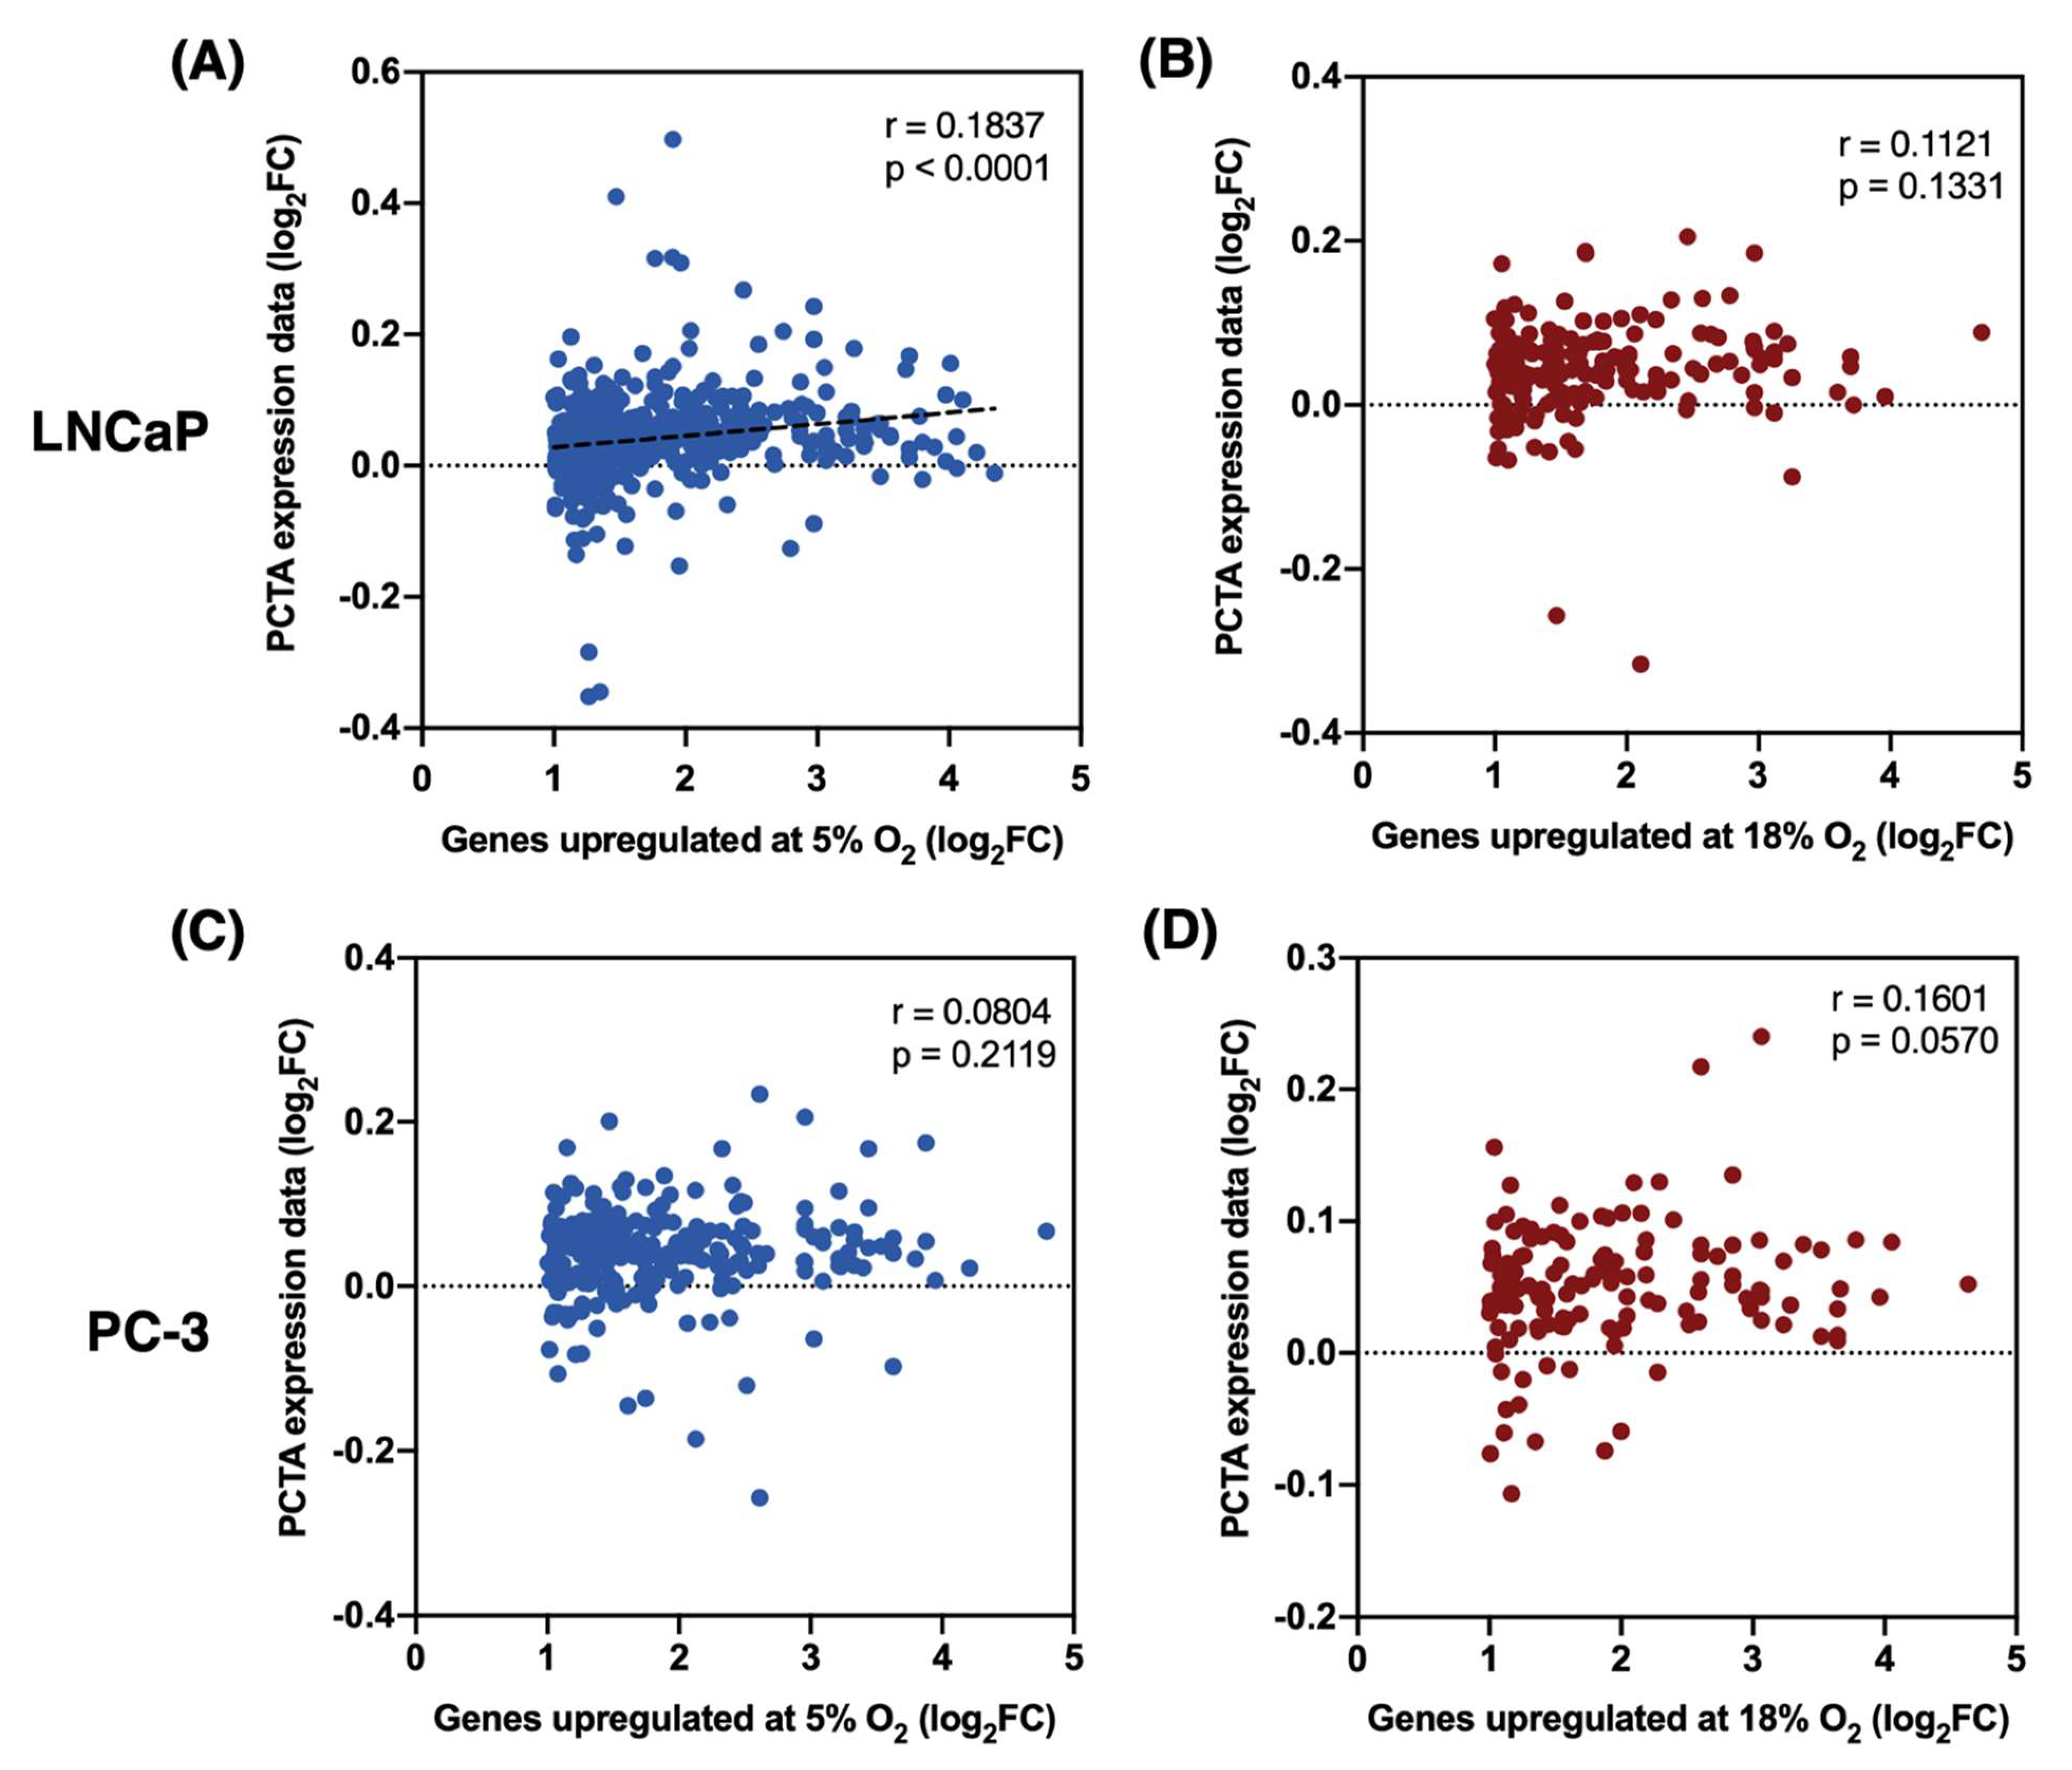
3.5. Expression Patterns of Genes Upregulated at 5% O2 in LNCaP Cells, but Not PC-3, Better Correlate with the In Vivo Prostate Cancer Transcriptome
4. Discussion
Supplementary Materials
Author Contributions
Funding
Institutional Review Board Statement
Informed Consent Statement
Data Availability Statement
Acknowledgments
Conflicts of Interest
References
- Keeley, T.P.; Mann, G.E. Defining Physiological Normoxia for Improved Translation of Cell Physiology to Animal Models and Humans. Physiol. Rev. 2019, 99, 161–234. [Google Scholar] [CrossRef] [PubMed] [Green Version]
- Maddalena, L.A.; Selim, S.M.; Fonseca, J.; Messner, H.; McGowan, S.; Stuart, J.A. Hydrogen Peroxide Production Is Affected by Oxygen Levels in Mammalian Cell Culture. Biochem. Biophys. Res. Commun. 2017, 493, 246–251. [Google Scholar] [CrossRef] [PubMed]
- Ferguson, D.C.J.; Smerdon, G.R.; Harries, L.W.; Dodd, N.J.F.; Murphy, M.P.; Curnow, A.; Winyard, P.G. Altered Cellular Redox Homeostasis and Redox Responses under Standard Oxygen Cell Culture Conditions versus Physioxia. Free Radic. Biol. Med. 2018, 126, 322–333. [Google Scholar] [CrossRef] [PubMed]
- Fehrer, C.; Brunauer, R.; Laschober, G.; Unterluggauer, H.; Reitinger, S.; Kloss, F.; Gülly, C.; Gaßner, R.; Lepperdinger, G. Reduced Oxygen Tension Attenuates Differentiation Capacity of Human Mesenchymal Stem Cells and Prolongs Their Lifespan. Aging Cell 2007, 6, 745–757. [Google Scholar] [CrossRef]
- Moradi, F.; Moffatt, C.; Stuart, J.A. The Effect of Oxygen and Micronutrient Composition of Cell Growth Media on Cancer Cell Bioenergetics and Mitochondrial Networks. Biomolecules 2021, 11, 1177. [Google Scholar] [CrossRef]
- Yan, H.M.; Ramachandran, A.; Bajt, M.L.; Lemasters, J.J.; Jaeschke, H. The Oxygen Tension Modulates Acetaminophen-Induced Mitochondrial Oxidant Stress and Cell Injury in Cultured Hepatocytes. Toxicol. Sci. 2010, 117, 515–523. [Google Scholar] [CrossRef] [Green Version]
- Moradi, F.; Fiocchetti, M.; Marino, M.; Moffatt, C.; Stuart, J.A. Media Composition and O2 Levels Determine Effects of 17b-Estradiol and Selective Estrogen Receptor Modulators on Mitochondrial Bioenergetics and Cellular Reactive Oxygen Species. Am. J. Physiol. Cell Physiol. 2021, 321, C72–C81. [Google Scholar] [CrossRef]
- Alva, R.; Gardner, G.L.; Liang, P.; Stuart, J.A. Supraphysiological Oxygen Levels in Mammalian Cell Culture: Current State and Future Perspectives. Cells 2022, 11, 3123. [Google Scholar] [CrossRef]
- Fonseca, J.; Moradi, F.; Valente, A.J.F.; Stuart, J.A. Oxygen and Glucose Levels in Cell Culture Media Determine Resveratrol’s Effects on Growth, Hydrogen Peroxide Production, and Mitochondrial Dynamics. Antioxidants 2018, 7, 157. [Google Scholar] [CrossRef] [Green Version]
- Gardner, G.L.; Moradi, F.; Moffatt, C.; Cliche, M.; Garlisi, B.; Gratton, J.; Mehmood, F.; Stuart, J.A. Rapid Nutrient Depletion to below the Physiological Range by Cancer Cells Cultured in Plasmax. Am. J. Physiol. Cell Physiol. 2022, 323, C823–C834. [Google Scholar] [CrossRef]
- Xicoy, H.; Wieringa, B.; Martens, G.J.M. The SH-SY5Y Cell Line in Parkinson’s Disease Research: A Systematic Review. Mol. Neurodegener. 2017, 12, 1–11. [Google Scholar] [CrossRef] [PubMed] [Green Version]
- Liu, Y.; Eaton, E.D.; Wills, T.E.; McCann, S.K.; Antonic, A.; Howells, D.W. Human Ischaemic Cascade Studies Using SH-SY5Y Cells: A Systematic Review and Meta-Analysis. Transl. Stroke Res. 2018, 9, 564–574. [Google Scholar] [CrossRef] [PubMed] [Green Version]
- Bulutoglu, B.; Rey-Bedón, C.; Mert, S.; Tian, L.; Jang, Y.Y.; Yarmush, M.L.; Berk Usta, O. A Comparison of Hepato-Cellular in Vitro Platforms to Study CYP3A4 Induction. PLoS ONE 2020, 15, e0229106. [Google Scholar] [CrossRef] [PubMed]
- Müller, F.A.; Sturla, S.J. Human in Vitro Models of Nonalcoholic Fatty Liver Disease. Curr. Opin. Toxicol. 2019, 16, 9–16. [Google Scholar] [CrossRef]
- vande Voorde, J.; Ackermann, T.; Pfetzer, N.; Sumpton, D.; Mackay, G.; Kalna, G.; Nixon, C.; Blyth, K.; Gottlieb, E.; Tardito, S. Improving the Metabolic Fidelity of Cancer Models with a Physiological Cell Culture Medium. Sci. Adv. 2019, 5, eaau7314. [Google Scholar] [CrossRef] [Green Version]
- Kim, D.; Paggi, J.M.; Park, C.; Bennett, C.; Salzberg, S.L. Graph-Based Genome Alignment and Genotyping with HISAT2 and HISAT-Genotype. Nat. Biotechnol. 2019, 37, 907–915. [Google Scholar] [CrossRef]
- Robinson, M.D.; McCarthy, D.J.; Smyth, G.K. EdgeR: A Bioconductor Package for Differential Expression Analysis of Digital Gene Expression Data. Bioinformatics 2009, 26, 139–140. [Google Scholar] [CrossRef] [Green Version]
- Huang, D.W.; Sherman, B.T.; Lempicki, R.A. Systematic and Integrative Analysis of Large Gene Lists Using DAVID Bioinformatics Resources. Nat. Protoc. 2009, 4, 44–57. [Google Scholar] [CrossRef]
- Prostate Cancer Transcriptome Atlas. Available online: http://www.thepcta.org (accessed on 24 October 2022).
- Talib, E.A.; Outten, C.E. Iron-Sulfur Cluster Biogenesis, Trafficking, and Signaling: Roles for CGFS Glutaredoxins and BolA Proteins. Biochim. Biophys. Acta Mol. Cell Res. 2021, 1868. [Google Scholar] [CrossRef]
- Asirvatham, A.J.; Carey, J.P.W.; Chaudhary, J. Id1-, Id2-, and Id3-Regulated Gene Expression in E2A Positive or Negative Prostate Cancer Cells. Prostate 2007, 67, 1411–1420. [Google Scholar] [CrossRef]
- He, S.; Zhang, M.; Ye, Y.; Zhuang, J.; Ma, X.; Song, Y.; Xia, W. ChaC Glutathione Specific Γ-glutamylcyclotransferase 1 Inhibits Cell Viability and Increases the Sensitivity of Prostate Cancer Cells to Docetaxel by Inducing Endoplasmic Reticulum Stress and Ferroptosis. Exp. Ther. Med. 2021, 22, 997. [Google Scholar] [CrossRef] [PubMed]
- Wu, R.; Duan, L.; Cui, F.; Cao, J.; Xiang, Y.; Tang, Y.; Zhou, L. S100A9 Promotes Human Hepatocellular Carcinoma Cell Growth and Invasion through RAGE-Mediated ERK1/2 and P38 MAPK Pathways. Exp. Cell Res. 2015, 334, 228–238. [Google Scholar] [CrossRef] [PubMed]
- Gao, H.; Hao, Y.; Zhou, X.; Li, H.; Liu, F.; Zhu, H.; Song, X.; Niu, Z.; Ni, Q.; Chen, M.S.; et al. Prognostic Value of Glucose Transporter 3 Expression in Hepatocellular Carcinoma. Oncol. Lett. 2020, 19, 691–699. [Google Scholar] [CrossRef] [PubMed] [Green Version]
- Rae, J.M.; Johnson, M.D.; Cordero, K.E.; Scheys, J.O.; Larios, J.M.; Gottardis, M.M.; Pienta, K.J.; Lippman, M.E. GREB1 Is a Novel Androgen-Regulated Gene Required for Prostate Cancer Growth. Prostate 2006, 66, 886–894. [Google Scholar] [CrossRef] [PubMed] [Green Version]
- Yang, P.J.; Hou, M.F.; Tsai, E.M.; Liang, S.S.; Chiu, C.C.; Ou-Yang, F.; Kan, J.Y.; Peng, C.Y.; Wang, T. nai Breast Cancer Is Associated with Methylation and Expression of the a Disintegrin and Metalloproteinase Domain 33 (ADAM33) Gene Affected by Endocrine-Disrupting Chemicals. Oncol. Rep. 2018, 40, 2766–2777. [Google Scholar] [CrossRef] [PubMed]
- Gobin, E.; Bagwell, K.; Wagner, J.; Mysona, D.; Sandirasegarane, S.; Smith, N.; Bai, S.; Sharma, A.; Schleifer, R.; She, J.X. A Pan-Cancer Perspective of Matrix Metalloproteases (MMP) Gene Expression Profile and Their Diagnostic/Prognostic Potential. BMC Cancer 2019, 19, 581. [Google Scholar] [CrossRef] [PubMed] [Green Version]
- Duan, Z.; Feller, A.J.; Toh, H.C.; Makastorsis, T.; Seiden, M. v TRAG-3, a Novel Gene, Isolated from a Taxol-Resistant Ovarian Carcinoma Cell Line k. Gene 1999, 229, 75–81. [Google Scholar] [CrossRef]
- Bracken, C.P.; Fedele, A.O.; Linke, S.; Balrak, W.; Lisy, K.; Whitelaw, M.L.; Peet, D.J. Cell-Specific Regulation of Hypoxia-Inducible Factor (HIF)-1α and HIF-2α Stabilization and Transactivation in a Graded Oxygen Environment. J. Biol. Chem. 2006, 281, 22575–22585. [Google Scholar] [CrossRef] [Green Version]
- Osrodek, M.; Hartman, M.L.; Czyz, M. Physiologically Relevant Oxygen Concentration (6% O2) as an Important Component of the Microenvironment Impacting Melanoma Phenotype and Melanoma Response to Targeted Therapeutics in Vitro. Int. J. Mol. Sci. 2019, 20, 4203. [Google Scholar] [CrossRef] [Green Version]
- Jubb, A.M.; Pham, T.Q.; Hanby, A.M.; Frantz, G.D.; Peale, F.; Wu, T.D.; Koeppen, H.W.; Hillan, K.J. Expression of Vascular Endothelial Growth Factor, Hypoxia Inducible Factor 1α, and Carbonic Anhydrase IX in Human Tumours. J. Clin. Pathol. 2004, 57, 504–512. [Google Scholar] [CrossRef]
- Garayoa, M.; Martínez, A.; Lee, S.; Pío, R.N.; An, W.G.; Neckers, L.; Trepel, J.; Montuenga, L.M.; Ryan, H.; Johnson, R.; et al. Hypoxia-Inducible Factor-1 (HIF-1) Up-Regulates Adrenomedullin Expression in Human Tumor Cell Lines during Oxygen Deprivation: A Possible Promotion Mechanism of Carcinogenesis. Mol. Endocrinol. 2000, 14, 848–862. [Google Scholar] [CrossRef] [PubMed]
- Nikitenko, L.L.; Smith, D.M.; Bicknell, R.; Rees, M.C.P. Transcriptional Regulation of the CRLR Gene in Human Microvascular Endothelial Cells by Hypoxia. FASEB J. Off. Publ. Fed. Am. Soc. Exp. Biol. 2003, 17, 1499–1501. [Google Scholar] [CrossRef] [PubMed] [Green Version]
- Ahmad, A.; Ahmad, S.; Glover, L.; Miller, S.M.; Shannon, J.M.; Guo, X.; Franklin, W.A.; Bridges, J.P.; Schaack, J.B.; Colgan, S.P.; et al. Adenosine A 2A Receptor Is a Unique Angiogenic Target of HIF-2 in Pulmonary Endothelial Cells. Proc. Natl. Acad. Sci. USA 2009, 106, 10684–10689. [Google Scholar] [CrossRef] [PubMed] [Green Version]
- Tello, D.; Balsa, E.; Acosta-Iborra, B.; Fuertes-Yebra, E.; Elorza, A.; Ordóñez, Á.; Corral-Escariz, M.; Soro, I.; López-Bernardo, E.; Perales-Clemente, E.; et al. Induction of the Mitochondrial NDUFA4L2 Protein by HIF-1α Decreases Oxygen Consumption by Inhibiting Complex i Activity. Cell Metab. 2011, 14, 768–779. [Google Scholar] [CrossRef] [PubMed] [Green Version]
- Gilkes, D.M.; Bajpai, S.; Chaturvedi, P.; Wirtz, D.; Semenza, G.L. Hypoxia-Inducible F0actor 1 (HIF-1) Promotes Extracellular Matrix Remodeling under Hypoxic Conditions by Inducing P4HA1, P4HA2, and PLOD2 Expression in Fibroblasts. J. Biol. Chem. 2013, 288, 10819–10829. [Google Scholar] [CrossRef] [Green Version]
- Schietke, R.; Warnecke, C.; Wacker, I.; Schödel, J.; Mole, D.R.; Campean, V.; Amann, K.; Goppelt-Struebe, M.; Behrens, J.; Eckardt, K.U.; et al. The Lysyl Oxidases LOX and LOXL2 Are Necessary and Sufficient to Repress E-Cadherin in Hypoxia: Insights into Cellular Transformation Processes Mediated by HIF-1. J. Biol. Chem. 2010, 285, 6658–6669. [Google Scholar] [CrossRef] [Green Version]
- Mukhopadhyay, C.K.; Mazumder, B.; Fox, P.L. Role of Hypoxia-Inducible Factor-1 in Transcriptional Activation of Ceruloplasmin by Iron Deficiency. J. Biol. Chem. 2000, 275, 21048–21054. [Google Scholar] [CrossRef] [Green Version]
- Rolfs, A.; Kvietikova, I.; Gassmann, M.; Wenger, R.H. Oxygen-Regulated Transferrin Expression Is Mediated by Hypoxia-Inducible Factor-1. J. Biol. Chem. 1997, 272, 20055–20062. [Google Scholar] [CrossRef] [Green Version]
- Kim, J.Y.; Ahn, H.J.; Ryu, J.H.; Suk, K.; Park, J.H. BH3-Only Protein Noxa Is a Mediator of Hypoxic Cell Death Induced by Hypoxia-Inducible Factor 1α. J. Exp. Med. 2004, 199, 113–123. [Google Scholar] [CrossRef]
- Sánchez-Elsner, T.; Botella, L.M.; Velasco, B.; Langa, C.; Bernabéu, C. Endoglin Expression Is Regulated by Transcriptional Cooperation between the Hypoxia and Transforming Growth Factor-β Pathways. J. Biol. Chem. 2002, 277, 43799–43808. [Google Scholar] [CrossRef]
- Law, A.Y.S.; Wong, C.K.C. Stanniocalcin-2 Is a HIF-1 Target Gene That Promotes Cell Proliferation in Hypoxia. Exp. Cell Res. 2010, 316, 466–476. [Google Scholar] [CrossRef] [PubMed]
- Bosello-Travain, V.; Forman, H.J.; Roveri, A.; Toppo, S.; Ursini, F.; Venerando, R.; Warnecke, C.; Zaccarin, M.; Maiorino, M. Glutathione Peroxidase 8 Is Transcriptionally Regulated by HIFα and Modulates Growth Factor Signaling in HeLa Cells. Free Radic. Biol. Med. 2015, 81, 58–68. [Google Scholar] [CrossRef] [PubMed]
- Hitchon, C.; Wong, K.; Ma, G.; Reed, J.; Lyttle, D.; El-Gabalawy, H. Hypoxia-Induced Production of Stromal Cell-Derived Factor 1 (CXCL12) and Vascular Endothelial Growth Factor by Synovial Fibroblasts. Arthritis Rheum. 2002, 46, 2587–2597. [Google Scholar] [CrossRef] [PubMed]
- O’Rourke, J.F.; Pugh, C.W.; Bartlett, S.M.; Ratcliffe, P.J. Identification of Hypoxically Inducible MRNAs in HeLa Cells Using Differential-Display PCR Role of Hypoxia-Inducible Factor-1. Eur. J. Biochem. 1996, 241, 403–410. [Google Scholar] [CrossRef]
- Valli, A.; Morotti, M.; Zois, C.E.; Albers, P.K.; Soga, T.; Feldinger, K.; Fischer, R.; Frejno, M.; McIntyre, A.; Bridges, E.; et al. Adaptation to HIF1a Deletion in Hypoxic Cancer Cells by Upregulation of GLUT14 and Creatine Metabolism. Mol. Cancer Res. 2019, 17, 1531–1544. [Google Scholar] [CrossRef] [Green Version]
- Askoxylakis, V.; Millonig, G.; Wirkner, U.; Schwager, C.; Rana, S.; Altmann, A.; Haberkorn, U.; Debus, J.; Mueller, S.; Huber, P.E. Investigation of Tumor Hypoxia Using a Two-Enzyme System for in Vitro Generation of Oxygen Deficiency. Radiat. Oncol. 2011, 6, 35. [Google Scholar] [CrossRef] [Green Version]
- Owczarek, A.; Gieczewska, K.; Jarzyna, R.; Jagielski, A.K.; Kiersztan, A.; Gruza, A.; Winiarska, K. Hypoxia Increases the Rate of Renal Gluconeogenesis via Hypoxia-Inducible Factor-1-Dependent Activation of Phosphoenolpyruvate Carboxykinase Expression. Biochimie 2020, 171–172, 31–37. [Google Scholar] [CrossRef]
- Leiherer, A.; Geiger, K.; Muendlein, A.; Drexel, H. Hypoxia Induces a HIF-1α Dependent Signaling Cascade to Make a Complex Metabolic Switch in SGBS-Adipocytes. Mol. Cell Endocrinol. 2014, 383, 21–31. [Google Scholar] [CrossRef] [PubMed]
- Fukuda, R.; Zhang, H.; Kim, J.; Shimoda, L.; Dang, C.V.; Semenza, G.L.L. HIF-1 Regulates Cytochrome Oxidase Subunits to Optimize Efficiency of Respiration in Hypoxic Cells. Cell 2007, 129, 111–122. [Google Scholar] [CrossRef] [Green Version]
- Wong, C.C.L.; Gilkes, D.M.; Zhang, H.; Chen, J.; Wei, H.; Chaturvedi, P.; Fraley, S.I.; Wong, C.M.; Khoo, U.S.; Ng, I.O.L.; et al. Hypoxia-Inducible Factor 1 Is a Master Regulator of Breast Cancer Metastatic Niche Formation. Proc. Natl. Acad. Sci. USA 2011, 108, 16369–16374. [Google Scholar] [CrossRef]
- Weidemann, A.; Klanke, B.; Wagner, M.; Volk, T.; Willam, C.; Wiesener, M.S.; Eckardt, K.U.; Warnecke, C. Hypoxia, via Stabilization of the Hypoxia-Inducible Factor HIF-1α, Is a Direct and Sufficient Stimulus for Brain-Type Natriuretic Peptide Induction. Biochem. J. 2008, 409, 233–242. [Google Scholar] [CrossRef] [PubMed] [Green Version]
- Grimm, C.; Wenzel, A.; Groszer, M.; Mayser, H.; Seeliger, M.; Samardzija, M.; Bauer, C.; Gassmann, M.; Remé, C.E. HIF-1-Induced Erythropoietin in the Hypoxic Retina Protects against Light-Induced Retinal Degradation. Nat. Med. 2002, 8, 718–724. [Google Scholar] [CrossRef] [PubMed]
- Schito, L.; Rey, S.; Tafani, M.; Zhang, H.; Wong, C.C.L.; Russo, A.; Russo, M.A.; Semenza, G.L. Hypoxia-Inducible Factor 1-Dependent Expression of Platelet-Derived Growth Factor B Promotes Lymphatic Metastasis of Hypoxic Breast Cancer Cells. Proc. Natl. Acad. Sci. USA 2012, 109. [Google Scholar] [CrossRef] [PubMed] [Green Version]
- Tian, H.; Huang, P.; Zhao, Z.; Tang, W.; Xia, J. HIF-1α Plays a Role in the Chemotactic Migration of Hepatocarcinoma Cells through the Modulation of CXCL6 Expression. Cell. Physiol. Biochem. 2014, 34, 1536–1546. [Google Scholar] [CrossRef] [PubMed]
- Tazuke, S.I.; Mazure, N.M.; Sugawara, J.; Carland, G.; Faessen, G.H.; Suen, L.-F.; Irwin, J.C.; Powell, D.R.; Giaccia, A.J.; Giudice, L.C. Hypoxia Stimulates Insulin-like Growth Factor Binding Protein 1 (IGFBP-1) Gene Expression in HepG2 Cells: A Possible Model for IGFBP-1 Expression in Fetal Hypoxia. Proc. Natl. Acad. Sci. USA 1998, 95, 10188–10193. [Google Scholar] [CrossRef] [Green Version]
- Baker, A.F.; Koh, M.Y.; Williams, R.R.; James, B.; Huamin, W.; Tate, W.; Gallegos, A.; von Hoff, D.D.; Han, H.; Powis, G. Identification of Thioredoxin-Interacting Protein 1 as a Hypoxia-Inducible Factor 1alpha-Induced Gene in Pancreatic Cancer. Pancreas 2008, 36, 178–186. [Google Scholar] [CrossRef]
- Guo, D.D.; Xie, K.F.; Luo, X.J. Hypoxia-Induced Elevated NDRG1 Mediates Apoptosis through Reprograming Mitochondrial Fission in HCC. Gene 2020, 741. [Google Scholar] [CrossRef]
- Andrysik, Z.; Bender, H.; Galbraith, M.D.; Espinosa, J.M. Multi-Omics Analysis Reveals Contextual Tumor Suppressive and Oncogenic Gene Modules within the Acute Hypoxic Response. Nat. Commun. 2021, 12, 1375. [Google Scholar] [CrossRef]
- Martorell, L.; Gentile, M.; Rius, J.; Rodríguez, C.; Crespo, J.; Badimon, L.; Martínez-González, J. The Hypoxia-Inducible Factor 1/NOR-1 Axis Regulates the Survival Response of Endothelial Cells to Hypoxia. Mol. Cell Biol. 2009, 29, 5828–5842. [Google Scholar] [CrossRef] [Green Version]
- Pescador, N.; Cuevas, Y.; Naranjo, S.; Alcaide, M.; Villar, D.; Landázuri, M.O.; del Peso, L. Identification of a Functional Hypoxia-Responsive Element That Regulates the Expression of the Egl Nine Homologue 3 (Egln3/Phd3) Gene. Biochem. J. 2005, 390, 189–197. [Google Scholar] [CrossRef]
- Hernández, C.; Santamatilde, E.; McCreath, K.J.; Cervera, A.M.; Díez, I.; Ortiz-Masiá, D.; Martínez, N.; Calatayud, S.; Esplugues, J.; Barrachina, M.D. Induction of Trefoil Factor (TFF)1, TFF2 and TFF3 by Hypoxia Is Mediated by Hypoxia Inducible Factor-1: Implications for Gastric Mucosal Healing. Br. J. Pharmacol. 2009, 156, 262–272. [Google Scholar] [CrossRef] [PubMed] [Green Version]
- Kung-Chun Chiu, D.; Pui-Wah Tse, A.; Law, C.T.; Ming-Jing Xu, I.; Lee, D.; Chen, M.; Kit-Ho Lai, R.; Wai-Hin Yuen, V.; Wing-Sum Cheu, J.; Wai-Hung Ho, D.; et al. Hypoxia Regulates the Mitochondrial Activity of Hepatocellular Carcinoma Cells through HIF/HEY1/PINK1 Pathway. Cell Death Dis. 2019, 10, 934. [Google Scholar] [CrossRef] [PubMed] [Green Version]
- Richardson, S.M.; Knowles, R.; Tyler, J.; Mobasheri, A.; Hoyland, J.A. Expression of Glucose Transporters GLUT-1, GLUT-3, GLUT-9 and HIF-1α in Normal and Degenerate Human Intervertebral Disc. Histochem. Cell Biol. 2008, 129, 503–511. [Google Scholar] [CrossRef] [PubMed]
- Kim, J.W.; Tchernyshyov, I.; Semenza, G.L.; Dang, C.V. HIF-1-Mediated Expression of Pyruvate Dehydrogenase Kinase: A Metabolic Switch Required for Cellular Adaptation to Hypoxia. Cell Metab. 2006, 3, 177–185. [Google Scholar] [CrossRef] [Green Version]
- Wykoff, C.C.; Beasley, N.J.P.; Watson, P.H.; Turner, K.J.; Pastorek, J.; Sibtain, A.; Wilson, G.D.; Turley, H.; Talks, K.L.; Maxwell, P.H.; et al. Hypoxia-Inducible Expression of Tumor-Associated Carbonic Anhydrases 1. Cancer Res. 2000, 60, 7075–7083. [Google Scholar]
- Nishi, H.; Nakada, T.; Kyo, S.; Inoue, M.; Shay, J.W.; Isaka, K. Hypoxia-Inducible Factor 1 Mediates Upregulation of Telomerase (HTERT). Mol. Cell Biol. 2004, 24, 6076–6083. [Google Scholar] [CrossRef] [Green Version]
- Millhorn, D.E.; Raymond, R.; Conforti, L.; Zhu, W.; Beitner-Johnson, D.; Filisko, T.; Genter, M.B.; Kobayashi, S.; Peng, M. Regulation of Gene Expression for Tyrosine Hydroxylase in Oxygen Sensitive Cells by Hypoxia Regulation of Gene Expression for Tyrosine Hydroxylase in Oxygen. Kidney Int. 1997, 51, 527–535. [Google Scholar] [CrossRef] [Green Version]
- Guo, K.; Searfoss, G.; Krolikowski, D.; Pagnoni, M.; Franks, C.; Clark, K.; Yu, K.T.; Jaye, M.; Ivashchenko, Y. Hypoxia Induces the Expression of the Pro-Apoptotic Gene BNIP3. Cell Death Differ. 2001, 8, 367–376. [Google Scholar] [CrossRef] [Green Version]
- Sun, M.; He, C.; Wu, W.; Zhou, G.; Liu, F.; Cong, Y.; Liu, Z. Hypoxia Inducible Factor-1α-Induced Interleukin-33 Expression in Intestinal Epithelia Contributes to Mucosal Homeostasis in Inflammatory Bowel Disease. Clin. Exp. Immunol. 2017, 187, 428–440. [Google Scholar] [CrossRef] [Green Version]
- Shen, G.M.; Zhang, F.L.; Liu, X.L.; Zhang, J.W. Hypoxia-Inducible Factor 1-Mediated Regulation of PPP1R3C Promotes Glycogen Accumulation in Human MCF-7 Cells under Hypoxia. FEBS Lett. 2010, 584, 4366–4372. [Google Scholar] [CrossRef] [Green Version]
- Feldser, D.; Agani, F.; Iyer, N.; Pak, B.; Ferreira, G.; Semenza, G.L. Reciprocal Positive Regulation of Hypoxia-Inducible Factor 1α and Insulin-like Growth Factor 2. Cancer Res. 1999, 59, 3915–3918. [Google Scholar]
- Sheffer, M.; Simon, A.J.; Jacob-Hirsch, J.; Rechavi, G.; Domany, E.; Givol, D.; D’orazi, G. Genome-Wide Analysis Discloses Reversal of the Hypoxia-Induced Changes of Gene Expression in Colon Cancer Cells by Zinc Supplementation. Oncotarget 2011, 2, 1191–1202. [Google Scholar] [CrossRef] [PubMed]
- Dükel, M.; Streitfeld, W.S.; Tang, T.C.C.; Backman, L.R.F.; Ai, L.; May, W.S.; Brown, K.D. The Breast Cancer Tumor Suppressor TRIM29 Is Expressed via ATM-Dependent Signaling in Response to Hypoxia. J. Biol. Chem. 2016, 291, 21541–21552. [Google Scholar] [CrossRef] [PubMed] [Green Version]
- Downes, N.L.; Laham-Karam, N.; Kaikkonen, M.U.; Ylä-Herttuala, S. Differential but Complementary HIF1α and HIF2α Transcriptional Regulation. Mol. Ther. 2018, 26, 1735–1745. [Google Scholar] [CrossRef] [Green Version]
- Duś-Szachniewicz, K.; Gdesz-Birula, K.; Zduniak, K.; Wiśniewski, J.R. Proteomic-Based Analysis of Hypoxia-and Physioxia-Responsive Proteins and Pathways in Diffuse Large B-Cell Lymphoma. Cells 2021, 10, 2025. [Google Scholar] [CrossRef] [PubMed]
- Alva, R.; Mirza, M.; Baiton, A.; Lazuran, L.; Samokysh, L.; Bobinski, A.; Cowan, C.; Jaimon, A.; Obioru, D.; al Makhoul, T.; et al. Oxygen Toxicity: Cellular Mechanisms in Normobaric Hyperoxia. Cell Biol. Toxicol. 2022, 1–33. [Google Scholar] [CrossRef]
- Logothetis, C.J.; Lin, S.H. Osteoblasts in Prostate Cancer Metastasis to Bone. Nat. Rev. Cancer 2005, 5, 21–28. [Google Scholar] [CrossRef] [PubMed]
- DiProspero, T.J.; Dalrymple, E.; Lockett, M.R. Physiologically Relevant Oxygen Tensions Differentially Regulate Hepatotoxic Responses in HepG2 Cells. Toxicol. Vitr. 2021, 74. [Google Scholar] [CrossRef] [PubMed]
- Spyrou, J.; Gardner, D.K.; Harvey, A.J. Metabolomic and Transcriptional Analyses Reveal Atmospheric Oxygen During Human Induced Pluripotent Stem Cell Generation Impairs Metabolic Reprogramming. Stem Cells 2019, 37, 1042–1056. [Google Scholar] [CrossRef] [PubMed]
- Holmquist-Mengelbier, L.; Fredlund, E.; Löfstedt, T.; Noguera, R.; Navarro, S.; Nilsson, H.; Pietras, A.; Vallon-Christersson, J.; Borg, Å.; Gradin, K.; et al. Recruitment of HIF-1α and HIF-2α to Common Target Genes Is Differentially Regulated in Neuroblastoma: HIF-2α Promotes an Aggressive Phenotype. Cancer Cell 2006, 10, 413–423. [Google Scholar] [CrossRef] [Green Version]
- Koh, M.Y.; Powis, G. Passing the Baton: The HIF Switch. Trends Biochem. Sci. 2012, 37, 364–372. [Google Scholar] [CrossRef] [PubMed] [Green Version]
- Zhang, H.; Gao, P.; Fukuda, R.; Kumar, G.; Krishnamachary, B.; Zeller, K.I.; Dang, C.V.; Semenza, G.L. HIF-1 Inhibits Mitochondrial Biogenesis and Cellular Respiration in VHL-Deficient Renal Cell Carcinoma by Repression of C-MYC Activity. Cancer Cell 2007, 11, 407–420. [Google Scholar] [CrossRef] [PubMed]
- Kuo, C.W.; Tsai, M.H.; Lin, T.K.; Tiao, M.M.; Wang, P.W.; Chuang, J.H.; Chen, S.; Liou, C.W. MtDNA as a Mediator for Expression of Hypoxia-Inducible Factor 1α and ROS in Hypoxic Neuroblastoma Cells. Int. J. Mol. Sci. 2017, 18, 1220. [Google Scholar] [CrossRef] [PubMed] [Green Version]
- Tiede, L.M.; Cook, E.A.; Morsey, B.; Fox, H.S. Oxygen Matters: Tissue Culture Oxygen Levels Affect Mitochondrial Function and Structure as Well as Responses to HIV Viroproteins. Cell Death Dis. 2011, 2, e246. [Google Scholar] [CrossRef] [Green Version]
- Keith, B.; Simon, M.C. Hypoxia-Inducible Factors, Stem Cells, and Cancer. Cell 2007, 129, 465–472. [Google Scholar] [CrossRef] [PubMed] [Green Version]
- Liu, A.; Yu, X.; Liu, S. Pluripotency Transcription Factors and Cancer Stem Cells: Small Genes Make a Big Difference. Chin. J. Cancer 2013, 32, 483–487. [Google Scholar] [CrossRef]
- Li, Z.; Bao, S.; Wu, Q.; Wang, H.; Eyler, C.; Sathornsumetee, S.; Shi, Q.; Cao, Y.; Lathia, J.; McLendon, R.E.; et al. Hypoxia-Inducible Factors Regulate Tumorigenic Capacity of Glioma Stem Cells. Cancer Cell 2009, 15, 501–513. [Google Scholar] [CrossRef] [Green Version]
- Sharov, A.A.; Masui, S.; Sharova, L.; Piao, Y.; Aiba, K.; Matoba, R.; Xin, L.; Niwa, H.; Ko, M.S.H. Identification of Pou5f1, Sox2, and Nanog Downstream Target Genes with Statistical Confidence by Applying a Novel Algorithm to Time Course Microarray and Genome-Wide Chromatin Immunoprecipitation Data. BMC Genom. 2008, 9, 269. [Google Scholar] [CrossRef] [Green Version]
- Westfall, S.D.; Sachdev, S.; Das, P.; Hearne, L.B.; Hannink, M.; Roberts, R.M.; Ezashi, T. Identification of Oxygen-Sensitive Transcriptional Programs in Human Embryonic Stem Cells. Stem Cells Dev. 2008, 17, 869–881. [Google Scholar] [CrossRef] [Green Version]
- You, S.; Knudsen, B.S.; Erho, N.; Alshalalfa, M.; Takhar, M.; Ashab, H.A.D.; Davicioni, E.; Karnes, R.J.; Klein, E.A.; Den, R.B.; et al. Integrated Classification of Prostate Cancer Reveals a Novel Luminal Subtype with Poor Outcome. Cancer Res. 2016, 76, 4948–4958. [Google Scholar] [CrossRef] [Green Version]
- Vogel, C.; Marcotte, E.M. Insights into the Regulation of Protein Abundance from Proteomic and Transcriptomic Analyses. Nat. Rev. Genet. 2012, 13, 227–232. [Google Scholar] [CrossRef] [PubMed] [Green Version]
- Maier, T.; Güell, M.; Serrano, L. Correlation of MRNA and Protein in Complex Biological Samples. FEBS Lett. 2009, 583, 3966–3973. [Google Scholar] [CrossRef] [PubMed]


| Gene Symbol | Gene Name | Role in Cancer Biology | Log2FC † | Refs. |
|---|---|---|---|---|
| LNCaP | ||||
| ID1, ID3 ** | Inhibitor of DNA binding 1 and Inhibitor of DNA binding 3 | Transcription factor repressors; mediate metastasis, androgen resistance, and chemoresistance. | +2.50, +2.02 | [21] |
| CHAC1 ** | ChaC glutathione specific gamma-glutamylcyclotransferase 1 | Degrades glutathione. Involved in ferroptosis; associated with increased chemosensitivity. | −2.81 | [22] |
| Huh-7 | ||||
| S100A9 ** | S100 calcium binding protein A9 | TLR4 and RAGE ligand, promotes HCC progression through MAPK and NF-κB pathways. | +3.37 | [23] |
| SLC3A2 ** (GLUT3) | Solute carrier family 2 member 3 | Selective glucose uniporter. Expression is correlated with HCC growth/invasion. | −5.74 | [24] |
| PC-3 | ||||
| GREB1 | Growth regulating estrogen receptor binding 1 | Regulated by androgens, contributes to prostate cancer growth and antiandrogen resistance. | +7.03 | [25] |
| ADAM33 * | ADAM metallopeptidase domain 33 | Methylation and upregulation observed in breast cancer. | −4.79 | [26] |
| SH-SY5Y | ||||
| MMP1 | Matrix metallopeptidase 1 | Upregulated in a wide variety of cancer types. | +1.90 | [27] |
| CSAG2 ** (TRAG-3) | CSAG family member 2 | First isolated from taxol-resistant ovarian cancer cell line. Overexpressed in many cancer types, correlated with tumor progression. | −3.69 | [28] |
| Gene Symbol | Gene Name | Description/Role | Log2FC † |
|---|---|---|---|
| LNCaP | |||
| MT-TL2 | Mitochondrially encoded tRNA leucine 2 (CUN) | Transfer RNA for leucine | −1.21 |
| MT-TW | Mitochondrially encoded tRNA tryptophan | Transfer RNA for tryptophan | +1.82 |
| Huh-7 | |||
| MT-ND1 | Mitochondrially encoded NADH:ubiquinone oxidoreductase core subunit 1 | Complex I subunit | +1.36 |
| MT-CO1 | Mitochondrially encoded cytochrome c oxidase I | Complex IV subunit | +1.07 |
| MT-CO2 | Mitochondrially encoded cytochrome c oxidase II | Complex IV subunit | +1.19 |
| MT-CO3 | Mitochondrially encoded cytochrome c oxidase III | Complex IV subunit | +1.13 |
| MT-ATP6 | Mitochondrially encoded ATP synthase membrane subunit 6 | ATP synthase subunit | +1.07 |
| MT-ATP8 | Mitochondrially encoded ATP synthase membrane subunit 8 | ATP synthase subunit | +1.03 |
| MT-TY * | Mitochondrially encoded tRNA tyrosine | Transfer RNA for tyrosine | +1.94 |
| MT-TL1 | Mitochondrially encoded tRNA leucine 1 (UUA/G) | Transfer RNA for leucine | +1.44 |
| MT-TV | Mitochondrially encoded tRNA valine | Transfer RNA for valine | +2.07 |
| MT-TW | Mitochondrially encoded tRNA tryptophan | Transfer RNA for tryptophan | +3.14 |
| MT-TT | Mitochondrially encoded tRNA threonine | Transfer RNA for threonine | +1.00 |
| PC-3 | |||
| MT-ND2 | Mitochondrially encoded NADH:ubiquinone oxidoreductase core subunit 2 | Complex I subunit | −1.08 |
| MT-ND4 | Mitochondrially encoded NADH:ubiquinone oxidoreductase core subunit 4 | Complex I subunit | −1.04 |
| MT-ND4L | Mitochondrially encoded NADH:ubiquinone oxidoreductase core subunit 4L | Complex I subunit | −1.14 |
| MT-ND5 | Mitochondrially encoded NADH:ubiquinone oxidoreductase core subunit 5 | Complex I subunit | −1.01 |
| MT-ND6 | Mitochondrially encoded NADH:ubiquinone oxidoreductase core subunit 6 | Complex I subunit | −1.04 |
| MT-CYB | Mitochondrially encoded cytochrome b | Complex III subunit | −1.07 |
| MT-CO2 | Mitochondrially encoded cytochrome c oxidase II | Complex IV subunit | −1.01 |
| MT-ATP8 | Mitochondrially encoded ATP synthase membrane subunit 8 | ATP synthase subunit | −1.18 |
| MT-TA | Mitochondrially encoded tRNA alanine | Transfer RNA for alanine | −3.33 |
| MT-TL1 | Mitochondrially encoded tRNA leucine 1 (UUA/G) | Transfer RNA for leucine | −1.07 |
| MT-TM | Mitochondrially encoded tRNA methionine | Transfer RNA for methionine | −2.29 |
| SH-SY5Y | |||
| MT-ND3 | Mitochondrially encoded NADH:ubiquinone oxidoreductase core subunit 3 | Complex I subunit | −1.13 |
| MT-ND5 | Mitochondrially encoded NADH:ubiquinone oxidoreductase core subunit 5 | Complex I subunit | −1.02 |
| MT-ND6 | Mitochondrially encoded NADH:ubiquinone oxidoreductase core subunit 6 | Complex I subunit | −1.01 |
| MT-ATP8 | Mitochondrially encoded ATP synthase membrane subunit 8 | ATP synthase subunit | −1.07 |
| MT-TH | Mitochondrially encoded tRNA histidine | Transfer RNA for histidine | −2.01 |
| MT-TE | Mitochondrially encoded tRNA glutamic acid | Transfer RNA for glutamate | −1.99 |
| MT-TG | Mitochondrially encoded tRNA glycine | Transfer RNA for glycine | −1.31 |
| MT-TQ | Mitochondrially encoded tRNA glutamine | Transfer RNA for glutamine | −6.27 |
| MT-TT | Mitochondrially encoded tRNA threonine | Transfer RNA for threonine | −1.38 |
| MT-TS2 | Mitochondrially encoded tRNA serine 2 (AGU/C) | Transfer RNA for serine | −1.27 |
| Gene Symbol | Gene Name | Role | Log2FC | Refs. † |
|---|---|---|---|---|
| LNCaP | ||||
| VEGFA * | Vascular endothelial growth factor A | Promotes angiogenesis | 1.68 | [31] |
| ADM | Adrenomedullin | Vasodilator peptide | 1.62 | [32] |
| CALCRL | Calcitonin receptor like receptor | G protein-coupled receptor related to the calcitonin receptor; enables adrenomedullin binding activity | 1.63 | [33] |
| ADORA2A * | Adenosine A2a receptor | Activates adenylyl cyclase, inducing cAMP signaling | 2.19 | [34] |
| NDUFA4L2 ** | NDUFA4, mitochondrial complex associated like 2 | Complex I subunit; shown to decrease O2 consumption | 3.26 | [35] |
| PLOD2 ** | Procollagen-lysine,2-oxoglutarate 5-dioxygenase 2 | Catalyzes the hydroxylation of lysyl residues in collagen-like peptides | 7.79 | [36] |
| LOX | Lysyl oxidase | Facilitates the crosslinking of collagens and elastin | 1.60 | [37] |
| CP ** | Ceruloplasmin | Involved in Cu transport | 3.28 | [38] |
| TF | Transferrin | Involved in Fe transport | 6.37 | [39] |
| PMAIP1 | Phorbol-12-myristate-13-acetate-induced protein 1 | Pro-apoptotic protein | 1.18 | [40] |
| ENG | Endoglin | Auxiliary receptor for the TGF-β receptor complex | 1.43 | [41] |
| STC2 | Stanniocalcin 2 | May have autocrine and paracrine functions; may be involved in Ca2+ and phosphate transport and metabolism | 1.19 | [42] |
| GPX8 | Glutathione peroxidase 8 | Catalyzes reduction of hydrogen and alkyl peroxides | 1.19 | [43] |
| CXCL12 | C-X-C motif chemokine ligand 12 | Chemoattractant cytokine | 1.67 | [44] |
| Huh-7 | ||||
| SLC2A3 ** | Solute carrier family 2 member 3 (GLUT3) | Selectively transports glucose into the cytosol | 5.74 | [45] |
| SLC2A14 ** | Solute carrier family 2 member 14 (GLUT14) | Transports glucose into the cytosol | 2.64 | [46] |
| HKDC1 | Hexokinase domain containing 1 | Novel member of the hexokinase family, involved in glucose metabolism | 1.51 | [47] |
| PCK1 | Phosphoenolpyruvate carboxykinase 1 | Catalyzes conversion of PEP to oxaloacetate during gluconeogenesis | 1.49 | [48] |
| ENO2 | Enolase 2 | Catalyzes conversion of 2-phosphoglycerate to PEP during glycolysis | 1.38 | [49] |
| COX4I2 | Cytochrome c oxidase subunit 4I2 | Complex IV subunit; regulates efficiency of electron transport and O2 consumption | 6.04 | [50] |
| CP ** | Ceruloplasmin | Involved in Cu transport | 1.84 | [38] |
| LOXL2 * | Lysyl oxidase like 2 | Facilitates the crosslinking of collagens and elastin | 1.66 | [37] |
| LOXL4 ** | Lysyl oxidase like 4 | Facilitates the crosslinking of collagens and elastin | 1.93 | [51] |
| P4HA2 | Prolyl 4-hydroxylase subunit alpha 2 | Catalyzes the formation of 4-hydroxyproline during collagen synthesis | 1.14 | [36] |
| PLOD2 | Procollagen-lysine,2-oxoglutarate 5-dioxygenase 2 | Catalyzes the hydroxylation of lysyl residues in collagen-like peptides | 1.08 | [36] |
| NPPB ** | Natriuretic peptide B | Hormone that mediates natriuresis, diuresis, and vasodilation | 2.05 | [52] |
| EPO * | Erythropoietin | Promotes erythropoiesis | 1.45 | [53] |
| PDGFB ** | Platelet derived growth factor subunit B | Potent mitogen and chemoattractant, promotes angiogenesis | 2.06 | [54] |
| CXCL6 | C-X-C motif chemokine ligand 6 | Chemoattractant cytokine | 1.21 | [55] |
| IGFBP1 ** | Insulin like growth factor binding protein 1 | Binds insulin-like growth factors, promotes migration and metabolism | 2.66 | [56] |
| TXNIP ** | Thioredoxin interacting protein | Binds to and inhibits thioredoxin | 2.73 | [57] |
| NDRG1 * | N-myc downstream regulated 1 | Involved in p53-mediated caspase activation and apoptosis | 1.53 | [58] |
| PTPRR * | Protein tyrosine phosphatase receptor type R | Membrane receptor, regulates cell cycle, differentiation and oncogenesis | 1.94 | [59] |
| NR4A3 * | Nuclear receptor subfamily 4 group A member 3 | Nuclear receptor and transcriptional activator | 6.86 | [60] |
| EGLN3 | egl-9 family hypoxia inducible factor 3 (PHD-3) | Catalyzes hydroxylation of HIFs for subsequent degradation | 2.27 | [61] |
| TFF2 | Trefoil factor 2 | May stabilize the mucus layer and affect healing of the epithelium | 1.19 | [62] |
| HEY1 | Hes related family bHLH transcription factor with YRPW motif 1 | Transcriptional repressor; inhibits mitochondrial biogenesis in HCC | 1.06 | [63] |
| PC-3 | ||||
| SLC2A9 | Solute carrier family 2 member 9 (GLUT9) | Transports glucose into the cytosol | 5.73 | [64] |
| PDK1 | Pyruvate dehydrogenase kinase 1 | Phosphorylates and inhibits the pyruvate dehydrogenase complex | 1.03 | [65] |
| CA9 | Carbonic anhydrase 9 | Catalyzes interconversion between CO2 and H2O into carbonic acid | 1.98 | [66] |
| TERT | Telomerase reverse transcriptase | Mediates extension and replenishment of telomeres | 1.98 | [67] |
| TH | Tyrosine hydroxylase | Catalyzes the conversion of tyrosine to dopamine | 1.09 | [68] |
| BNIP3 | BCL2 interacting protein 3 | Pro-apoptotic factor | 1.02 | [69] |
| IL33 | Interleukin 33 | Proinflammatory cytokine | 1.38 | [70] |
| PPP1R3C | Protein phosphatase 1 regulatory subunit 3C | Subunit of the protein phosphatase 1 complex; modulates glycogen metabolism | 6.37 | [71] |
| SH-SY5Y | ||||
| IGF2 | Insulin like growth factor 2 | Promotes growth and proliferation | 1.74 | [72] |
| PPP1R3C | Protein phosphatase 1 regulatory subunit 3C | Subunit of the protein phosphatase 1 complex; modulates glycogen metabolism | 1.01 | [71] |
| ABCB6 | ATP binding cassette subfamily B member 6 | ABC transporter; plays a role in porphyrin transport | 1.25 | [73] |
| TRIM29 | Tripartite motif containing 29 | Transcriptional regulatory factor involved in carcinogenesis and/or differentiation | 2.78 | [74] |
Publisher’s Note: MDPI stays neutral with regard to jurisdictional claims in published maps and institutional affiliations. |
© 2022 by the authors. Licensee MDPI, Basel, Switzerland. This article is an open access article distributed under the terms and conditions of the Creative Commons Attribution (CC BY) license (https://creativecommons.org/licenses/by/4.0/).
Share and Cite
Alva, R.; Moradi, F.; Liang, P.; Stuart, J.A. Culture of Cancer Cells at Physiological Oxygen Levels Affects Gene Expression in a Cell-Type Specific Manner. Biomolecules 2022, 12, 1684. https://doi.org/10.3390/biom12111684
Alva R, Moradi F, Liang P, Stuart JA. Culture of Cancer Cells at Physiological Oxygen Levels Affects Gene Expression in a Cell-Type Specific Manner. Biomolecules. 2022; 12(11):1684. https://doi.org/10.3390/biom12111684
Chicago/Turabian StyleAlva, Ricardo, Fereshteh Moradi, Ping Liang, and Jeffrey A. Stuart. 2022. "Culture of Cancer Cells at Physiological Oxygen Levels Affects Gene Expression in a Cell-Type Specific Manner" Biomolecules 12, no. 11: 1684. https://doi.org/10.3390/biom12111684