Article

Endemic Radiation of African Moonfish, Selene dorsalis (Gill 1863), in the Eastern Atlantic: Mitogenomic Characterization and Phylogenetic Implications of Carangids (Teleostei: Carangiformes)

1
Department of Marine Biology, Pukyong National University, Busan 48513, Republic of Korea
2
Fisheries Commission, Ministry of Fisheries and Aquaculture Development, Fisheries Scientific Survey Division, Tema P.O. Box BT 62, Ghana
3
Research Center for Marine Integrated Bionics Technology, Pukyong National University, Busan 48513, Republic of Korea
4
Marine Integrated Biomedical Technology Center, National Key Research Institutes in Universities, Pukyong National University, Busan 48513, Republic of Korea
5
Industry 4.0 Convergence Bionics Engineering, Pukyong National University, Busan 48513, Republic of Korea
6
Distant Water Fisheries Resources Research Division, National Institute of Fisheries Science, Busan 46083, Republic of Korea
7
Advanced Tropical Biodiversity, Genomics, and Conservation Research Group, Department of Biology, Faculty of Science and Technology, Airlangga University, Surabaya 60115, Indonesia
8
Department of Marine, Faculty of Fisheries and Marine, Airlangga University, Surabaya 60115, Indonesia
9
Ocean and Fisheries Development International Cooperation Institute, College of Fisheries Science, Pukyong National University, Busan 48513, Republic of Korea
10
International Graduate Program of Fisheries Science, Pukyong National University, Busan 48513, Republic of Korea
*
Authors to whom correspondence should be addressed.
Biomolecules 2024, 14(10), 1208; https://doi.org/10.3390/biom14101208
Submission received: 22 August 2024 / Revised: 19 September 2024 / Accepted: 24 September 2024 / Published: 25 September 2024

Abstract

:
This study offers an in-depth analysis of the mitochondrial genome of Selene dorsalis (Gill 1863), a species native to the Eastern Atlantic Ocean. The circular mitochondrial DNA molecule measures 16,541 base pairs and comprises 13 protein-coding genes (PCGs), 22 transfer RNA (tRNA) genes, two ribosomal RNA genes, and a control region (CR). The nucleotide composition exhibits a notable adenine-thymine (AT) bias, accounting for 53.13%, which aligns with other species in the Carangidae family. Most PCGs initiate with the ATG codon, with the exception of Cytochrome C oxidase subunit I, which starts with GTG. Analysis of relative synonymous codon usage reveals that leucine and serine are the most prevalent amino acids in the mitochondrial genome of S. dorsalis and its congeners (S. vomer and S. setapinnis). All tRNAs display the typical cloverleaf structure, though tRNA Serine (S1) lacks a dihydrouracil arm. Pairwise comparisons of synonymous and nonsynonymous substitutions for all PCGs yielded values below ‘1’, indicating strong purifying selection. The CR spans 847 bp, representing 5.12% of the mitochondrial genome, and is characterized by high AT content (62.81%). It is situated between tRNA-Pro (TGG) and tRNA-Phe (GAA). The CR contains conserved sequence blocks, with CSB-1 being the longest at 22 bp and CSB-D the shortest at 18 bp. Phylogenetic analysis, using Bayesian and Maximum-likelihood trees constructed from concatenated PCGs across 72 species, successfully differentiates S. dorsalis from other carangids. This study also explores how ocean currents and gyres might influence lineage diversification and parapatric speciation of Selene species between the Atlantic and Pacific Oceans. These results highlight the importance of the mitochondrial genome in elucidating the structural organization and evolutionary dynamics of S. dorsalis and its relatives within marine ecosystems.

1. Introduction

The mitochondrial genome plays a vital role in all eukaryotic organisms, providing insights into ancient and matrilineal evolutionary relationships [1]. In vertebrates, the mitochondrial genome is highly compact, typically spanning 16 to 17 kilobase pairs, and exhibits remarkable conservation in the array of genes it harbors [2]. The mitogenome predominantly encodes 13 protein-coding genes (PCGs), two ribosomal RNAs (rRNAs), and 22 transfer RNAs (tRNAs), along with one noncoding region known as the control region (CR). Additionally, mitochondrial genes exhibit highly conserved genetic traits across different taxa, particularly among bilaterian metazoans, showing unique similarities in both size and base composition [3]. These genes are crucial components of the eukaryotic cell’s genetic arsenal, making them invaluable for studying maternal lineages and evolutionary patterns [4]. Therefore, it is essential to elucidate the configuration and variability of the mitogenome in each organism to understand its functionalities and potential mutations on the L-strand or H-strand, which are most likely to arise from base substitutions [5]. Moreover, beyond mitochondrial and nuclear partial genes, complete mitochondrial genomes have proven successful in various aspects of biodiversity research including ichthyology [6,7,8].
Carangid fishes (Carangiformes: Carangidae), commonly referred to as jacks, trevallies, scads, amberjacks, queen fishes, runners, pilot fish, and pompano, are widely distributed across tropical and subtropical marine ecosystems [9]. These coastal pelagic fishes hold significant economic importance on a global scale [10]. This taxonomic order includes a total of 1103 valid species under 198 genera worldwide, with the most species-rich families being Bothidae (169 species), Carangidae (153 species), Cynoglossidae (168 species), and Soleidae (179 species). The family Carangidae is represented by 39 genera within four subfamilies: Caranginae, Naucratinae, Scomberoidinae, and Trachinotinae [11]. Among these, the subfamily Caranginae comprises 104 valid species across 29 genera, including the distinctive moonfish genus Selene, which contains six valid species distributed globally. Of these, five species (Selene brevoortii, Selene brownii, Selene peruviana, Selene setapinnis, and Selene vomer) are found in the Eastern Pacific and Western Atlantic oceans. However, a single species, the African moonfish (Selene dorsalis), is distributed from the Eastern Atlantic to the Southwestern Mediterranean Sea [12].
The African moonfish (S. dorsalis) is an economically significant species native to the Atlantic Ocean, ranging from southern Portugal to South Africa, including Madeira, the Cape Verde Islands, and São Tomé and Principe [13]. Commonly referred to as lookdowns or moonfish, these fish are characterized by their distinctive head profile, eye placement, horizontally compressed deep bodies, and circular profiles [12]. This unique morphology is shared among other Selene species within Carangidae [14]. Beyond its native range, S. dorsalis has also been reported in the Central Mediterranean Sea near Munxar Reef, located in the shallow waters off the southeastern coastline of the island of Malta, and in the Canary Islands [12,15,16,17,18]. This unusual distribution may result from the species’ introduction or migration into colder regions, potentially driven by rising ocean temperatures in the Gulf of Guinea [19]. According to the United Nations Food and Agriculture Organization (FAO), the African moonfish is a common component of the ichthyofauna in the Gulf of Guinea and is highly sought after in Ghana, where it contributes to an annual per capita fish consumption of 25 kg [9]. Additionally, recent studies estimate that Selene dorsalis is heavily harvested within tropical fishing zones [9]. Despite significant anthropogenic pressures, the International Union for Conservation of Nature (IUCN) Red List categorizes all Selene species as being of ‘Least Concern’ [20].
Remarkably, most studies on the African moonfish primarily focused on its biology, ecology, and taxonomy [9,12,21]. Given that genetic and physiological changes in fish are closely tied to their ecological significance, obtaining genetic information from both native and extended ranges of any fish species is essential [22,23]. In this context, it is crucial to acquire and thoroughly analyze genetic data, such as the mitochondrial genome of species endemic to specific geographical locations, to provide insights into taxonomic classification, evolutionary history, and genetic traits. Such information is vital for understanding population structure and establishing effective management policies [6,24]. Within Carangidae, molecular studies have been particularly important due to unstable morphological characteristics and frequent taxonomic revisions [25].
The initiative to generate molecular data for Selene species began long ago for various scientific purposes. The mitochondrial CYTB gene of Selene dorsalis was sequenced to aid in the systematic classification of Selene species through cladistic analyses [14]. Additionally, a new nuclear marker (RNF213) and multi-gene-based investigations were initiated to elucidate the phylogeny of acanthomorphs and the taxonomic placement of carangids, including S. dorsalis [26,27]. To enhance the comprehensive application of the regulatory Fish Encyclopedia, identify early life stages for fisheries management, and track ornamental fishes, the mitochondrial DNA barcoding region of Selene species was also sequenced [28,29,30]. Furthermore, partial mitochondrial genes were sequenced for Selene species to assess genetic diversity across diverse marine ecosystems, such as São Paulo State in Brazil, Caribbean reefs, and the North Atlantic Ocean [31,32,33]. Moreover, to elucidate multi-locus phylogeny and build the tree of life for confirming the new classification of bony fishes, Selene species’ gene sequences were incorporated into previous research to clarify evolutionary relationships and diversification [34,35,36]. Beyond systematics and evolutionary research, DNA sequences of Selene species were also generated to build a reference standard sequence library for DNA-based commercial fish and seafood identification, prey–predator relationship studies, and metabarcoding-based environmental DNA research [37,38,39,40,41,42,43].
In recent years, the complete mitochondrial genomes of two Selene species (S. setapinnis and S. vomer) have been sequenced [44,45]. However, previous studies have not provided a detailed analysis of the structure and variations within these Selene mitogenomes, which is essential for understanding gene features, structural variability, and conducting in-depth maternal phylogenetic analyses [46,47,48]. Additionally, both species whose mitochondrial genomes were sequenced are distributed in the Western Atlantic, including the Gulf of Mexico and the Caribbean Sea. This leaves a significant research gap in understanding the evolutionary relationships and diversification patterns of their Eastern Atlantic congener, S. dorsalis. Therefore, the aim of this study was to generate a novel mitochondrial genome for S. dorsalis and to characterize its structure and variability as well as cladistic analyses. This will enhance our understanding of its unique genetic traits, biogeographic evolution, maternal lineage diversification, and subsequent adaptation in the Eastern Atlantic Ocean. This study will reveal the mitogenomic signature of the species in the Eastern Atlantic and facilitate the use of multiple mitochondrial markers for species identification and population structure analysis, crucial for conserving ecologically and economically important regional species.

2. Materials and Methods

2.1. Sample Collection, Identification, and Preservation

Among multiple catches, a single specimen of moonfish was collected from the Atlantic Ocean at coordinates 5.611389 N, 0.044444 W on 22 February 2024 (Figure 1). The specimen was identified as S. dorsalis using taxonomic keys described in previous studies and was preserved with the novel voucher number ‘GH1’ at the Fisheries Scientific Survey Division of Ghana [25,49]. Under aseptic conditions, approximately 20 g of tissue were extracted from the apexial muscle, preserved in 95% molecular-grade ethanol in a 2 mL centrifuge tube, and stored in a −20 °C freezer. To minimize DNA degradation and prevent microbial contamination, the tissue sample in the centrifuge tube was tightly sealed with Parafilm and transported in an icebox to maintain optimal temperature conditions. It was then sent to the Molecular Physiology Laboratory at Pukyong National University, Republic of Korea, for further molecular experiments. Distribution data for S. dorsalis and other Selene species were obtained from the IUCN (https://www.iucnredlist.org/ accessed on 15 August 2024) and mapped to understand their unique biogeographic distribution in both the Eastern and Western Atlantic and Pacific Oceans (Figure 1). The fish specimen was caught by the local fishing community, and the deceased individual was collected by the researcher; therefore, no animal ethics approval was required for the biological sample collection. Furthermore, the molecular data generation and analyses were approved by Pukyong National University (PKNUIACUC-2022-72), ensuring that the use of biological material in the experiments adhered to ethical standards.

2.2. Genomic DNA Extraction and Partial Gene Sequencing

The AccuPrep® Genomic DNA Extraction Kit (Bioneer, Daejeon, Republic of Korea) was used to extract genomic DNA according to the manufacturer’s standard protocols. The quality of the extracted DNA was assessed using a NanoDrop spectrophotometer (Thermo Fisher Scientific, D1000, Waltham, MA, USA). Specifically, 30 mg of tissue from the target specimen was homogenized in 600 μL of 1× lysis buffer using a Tissue Lyser II (Qiagen, Hilden, Germany) for 60 s. Sodium dodecyl sulfate (SDS) (100 μL) and the proteolytic enzyme proteinase K (20 μL) were then added to disrupt cell membranes and degrade proteins. The mixture was incubated at 60 °C for 12 h. Following this, 500 μL of GC buffer and 300 μL of isopropanol were added to facilitate DNA precipitation. The resulting solution was transferred to a column tube and centrifuged at 8000 rpm for one minute. Washing buffers 1 and 2 were used to remove any residual biomolecular substances, and finally, 50 μL of TE buffer was used to elute the target DNA.
Following DNA extraction, polymerase chain reaction (PCR) was performed using the universal primers Fish-BCH (5′-TCAACYAATCAYAAAGATATYGGCAC-3′) and Fish-BCL (5′-ACTTCYGGGTGRCCRAARAATCA-3′) to amplify a partial sequence of the mitochondrial COI gene for preliminary DNA sequence-based species identification [50]. PCR was carried out using a Takara thermal cycler with a 30 µL reaction mixture consisting of 1 μL each of forward and reverse primers, 0.9 μL of 3% dimethyl sulfoxide (DMSO), 19.9 μL of sterilized deionized water, 3 μL of 10× ExTaq Buffer, 0.2 μL of Ex Taq HS enzyme, 3 μL of dNTPs, and 1 μL of 1/10 diluted target DNA template. The thermal cycling conditions included an initial denaturation at 94 °C for 3 min, followed by 40 cycles of denaturation at 94 °C for 30 s, annealing at 50 °C for 30 s, extension at 72 °C for 1 min, and a final extension at 72 °C for 5 min. The PCR product was purified using the AccuPrep® PCR/Gel Purification Kit (Bioneer, Republic of Korea) and sequenced bidirectionally with a 96-capillary automated ABI PRISM 3730XL Analyzer at Macrogen (https://dna.macrogen.com/, Daejeon, Republic of Korea). Noisy regions in the bidirectional chromatogram results were removed using SeqScanner version 1.0 (Applied Biosystems Inc., Foster City, CA, USA). The resulting COI sequences were analyzed and confirmed through a nucleotide BLAST search (https://blast.ncbi.nlm.nih.gov accessed on 15 August 2024) against the global GenBank database.

2.3. Mitogenome Sequencing and Assembly

To obtain the complete mitogenome of S. dorsalis, paired-end (2 × 150 bp) next-generation sequencing (NGS) was performed on the NovaSeq platform at Macrogen (Illumina, Inc., San Diego, CA, USA). Sequencing libraries were prepared according to the manufacturer’s specifications for the TruSeq Nano DNA High-Throughput Library Prep Kit (Illumina, Inc., San Diego, CA, USA). A total of 100 ng of genomic DNA was fragmented using adaptive focused acoustic technology (Covaris, Woburn, MA, USA), resulting in double-stranded DNA molecules with blunt ends and 5′-phosphorylation. After end-repair, DNA fragments were size-selected using a bead-based method, modified with the addition of a single ‘A’ base, and ligated with TruSeq DNA UD Indexing adapters. The library was then purified and enriched through PCR to produce the final DNA library. Library quantification was performed using qPCR following the qPCR Quantification Protocol Guide (KAPA Library Quantification Kits for Illumina Sequencing Platforms), and quality assessment was conducted using an Agilent Technologies 4200 TapeStation D1000 screentape (Agilent Technologies, Santa Clara, CA, USA).
High-quality NGS sequences were assembled using Geneious Prime v2023.0.1 and mapped against the reference mitogenome (S. vomer Accession No. PP033011) [51]. To verify PCGs, overlapping regions were aligned using MEGA X software. The boundaries and directions of other genes were confirmed using the MITOS Galaxy web server (http://mitos.bioinf.uni-leipzig.de accessed on 15 August 2024) and MitoAnnotator (http://mitofish.aori.u-tokyo.ac.jp/annotation/input/ accessed on 15 August 2024) [52,53,54]. Additionally, the boundaries of each PCG were further validated through Open Reading Frame Finder (https://www.ncbi.nlm.nih.gov/orffinder/ accessed on 15 August 2024) after translation into the respective amino acids. The final mitogenome of S. dorsalis was submitted to the GenBank database.

2.4. Characterization and Comparative Analyses

To generate a three-dimensional representation of the mitogenome, MitoAnnotator was employed. The primary objective of the analysis was to fully characterize the mitogenome and to identify significant variations compared to the existing mitogenomes of two other Selene species (S. vomer: PP033011 and S. setapinnis: OR575618). Intergenic spacers between contiguous genes and overlapping regions were manually calculated. The nucleotide compositions of 13 PCGs, two rRNAs, 22 tRNAs, and the CR were determined using MEGA X.
Nucleotide diversity (π) was assessed using a sliding window approach with a window size of 200 bp and a step size of 25 bp, performed in DnaSP6.0 [55]. Base composition skews were calculated using the formulas AT-skew = [A − T]/[A + T] and GC-skew = [G − C]/[G + C] [56]. Additionally, the AT and GC skews, as well as codon saturation of the PCGs based on transitions (s) and transversions (v), were illustrated using DAMBE6 [57]. The initiation and termination codons for each PCG were determined according to the vertebrate mitochondrial genetic code using MEGA X in conjunction with MITOS. Further analyses included calculating the relative frequency of amino acids, relative synonymous codon usage (RSCU), and pairwise comparisons for synonymous (Ks) and nonsynonymous (Ka) substitutions between S. dorsalis and the two other Selene species using DnaSP6.0. The boundaries of rRNA and tRNA genes were validated using tRNAscan-SE Search Server 2.0 in combination with ARWEN 1.2 [58,59]. Structural domains in the control region were identified through CLUSTAL X alignments, as referenced in previous studies [46,60,61].

2.5. Dataset Preparation and Phylogenetic Analyses

To elucidate the matrilineal phylogenetic relationships within the Carangidae family, a dataset comprising 72 species mitogenomes (1 newly generated and 71 obtained from GenBank) representing four subfamilies was compiled (Table S1). The mitogenomes of two species from the family Coryphaenidae (Coryphaena equiselis, PP032965 and Coryphaena hippurus, OR582674); Rachycentron canadum (FJ154956) from the family Rachycentridae; Nematistius pectoralis (ON838225) from the family Nematistiidae; and four species from the family Echeneidae (Remora albescens, OP057074; Remora brachyptera, OR546234; Remora osteochir, OR575559; and Echeneis naucrates, AB355905) were designated as outgroups based on previous studies [62,63]. The iTaxoTools 0.1 was used to construct concatenated datasets of 13 PCGs to investigate the evolutionary relationships among Carangidae, with a particular focus on Selene species within the subfamily Caranginae [64]. Each PCG was analyzed separately to determine the optimal substitution model, which was found to be ‘GTR + G + I’ with the lowest Bayesian Information Criterion (BIC) scores, using PartitionFinder 2 and JModelTest v2 [65,66]. A Bayesian tree was constructed using MrBayes 3.1.2, which employs a Metropolis-coupled Markov chain Monte Carlo (MCMC) algorithm with nst = 6. The analysis was run for 10,000,000 generations, with samples collected every 100 generations, and 25% of the samples were discarded as burn-in [67]. The Maximum-Likelihood (ML) tree was further constructed with the ‘GTR + G + I’ model and default settings in PhyML 3.0 [68]. The resulting tree was visualized using the iTOL v4 web server for enhanced clarity [69].

3. Results and Discussion

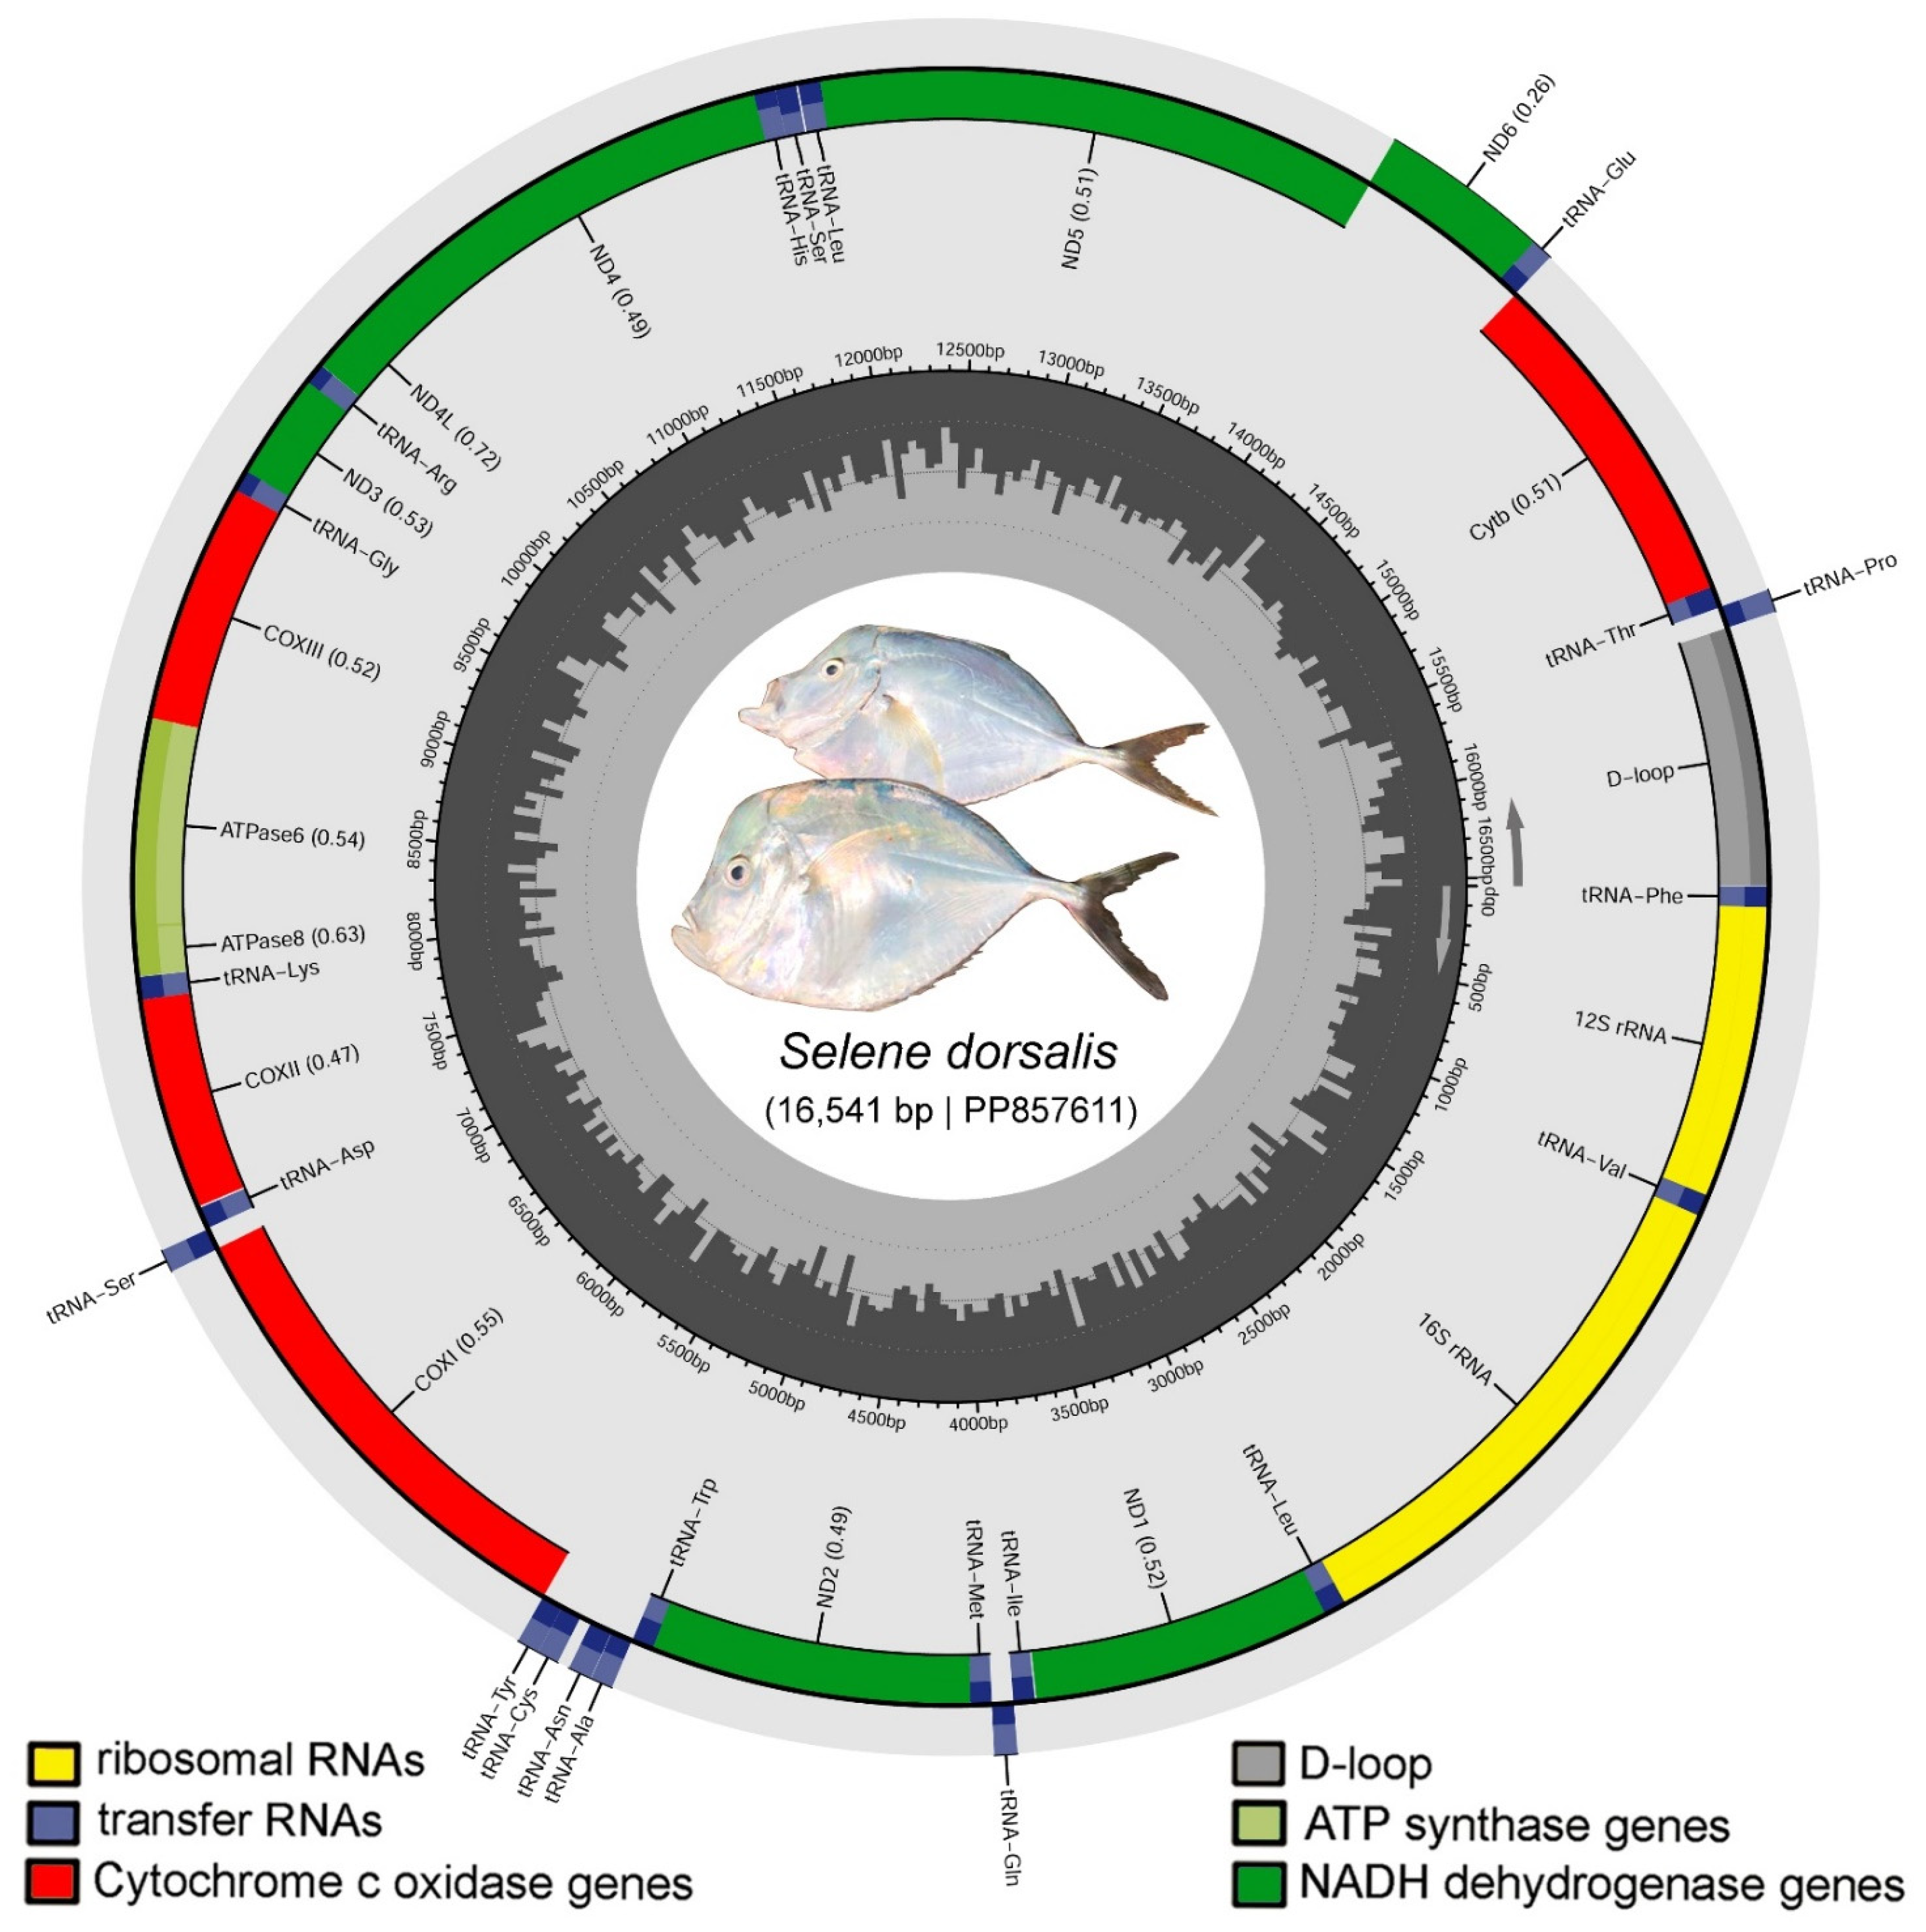
3.1. Mitogenome Structure and Organization

In the present study, the mitogenome of S. dorsalis was characterized as being 16,541 bp long, with the GenBank accession number PP857611. This mitogenome includes 13 PCGs, 22 tRNAs, two rRNAs, and an AT-rich CR (Figure 2, Table 1). Notably, the S. dorsalis mitogenome is shorter than those of the other two Selene species (S. vomer: PP033011 and S. setapinnis: OR575618). The mitogenome of S. dorsalis exhibits a distinct gene arrangement, with 27 genes (12 PCGs, 2 rRNAs, and 14 tRNAs) located on the heavy strand, and a single PCG (ND6) and eight tRNAs (glutamine, proline, alanine, asparagine, cysteine, tyrosine, serine, and glutamic acid) on the light strand (Table 1). The mitogenome displays a notable AT-bias of 53.13%, with 27.48% adenine (A), 25.66% thymine (T), 30.18% cytosine (C), and 16.69% guanine (G). This AT-bias is also observed in the mitogenomes of S. vomer and S. setapinnis. The AT-skew and GC-skew for S. dorsalis were calculated as 0.034 and −0.288, respectively, while for S. vomer, they were 0.042 and −0.305 (Table 2). The mitogenome of S. dorsalis contains 19 overlapping regions totaling 40 bp in length, with the longest overlap (10 bp) occurring between ATP6 and ATP8. Three overlapping PCG regions common to all examined Selene species were identified: 7 bp (ND4L), 4 bp (ND5), and 10 bp (ATP8). Additionally, the tRNA-Asn (N) gene has the longest intergenic spacer of 37 bp (Table S2). The variations observed in the mitogenomes of Selene species provide valuable insights into their evolutionary mechanisms, functional differences, and energy utilization, consistent with similar findings in other fish species [70]. This study enhances our understanding of the structural features of Selene mitogenomes and their associated genes.

3.2. Protein-Coding Genes

The mitogenome of S. dorsalis contains 13 PCGs with a combined length of 11,427 bp, which accounts for 69.10% of the total mitogenome. The shortest PCG is ATP8 at 168 bp, while the longest is ND5 at 1839 bp. Both S. dorsalis and S. setapinnis have PCG lengths of 11,427 bp, whereas S. vomer has slightly longer PCGs at 11,428 bp. Of the 13 PCGs, 12 in S. dorsalis use ATG (Methionine) as the initiation codon, while COI uses GTG. The typical termination codon TAA is observed in ND1, ND4L, ND5, COI, and ATP8. However, ND2, ND3, ND4, COII, COIII, ATP6, and CYTB have incomplete termination codons, which may be completed to TAA through polyadenylation during RNA maturation (Table S3) [71]. Comparative analysis of the PCGs across Selene species shows AT-skews ranging from −0.015 in S. dorsalis, −0.001 in S. vomer, to −0.037 in S. setapinnis. The GC-skew values range from −0.357 in S. dorsalis, −0.377 in S. vomer, to −0.326 in S. setapinnis (Table 2). Sliding window analysis of nucleotide diversity on concatenated PCGs yielded a nucleotide diversity value (Pi) of 0.07357 (Figure 3A). These genetic variations could contribute to independent selection pressures, positive selection, and evolutionary changes in the amino acids of PCGs [72,73,74]. These PCGs are crucial for encoding proteins involved in the electron transport chain, essential for oxidative phosphorylation and adenosine triphosphate (ATP) synthesis. Further studies on mitogenomes from additional Selene species could provide insights into variations in energy metabolism and protein expression profiles.

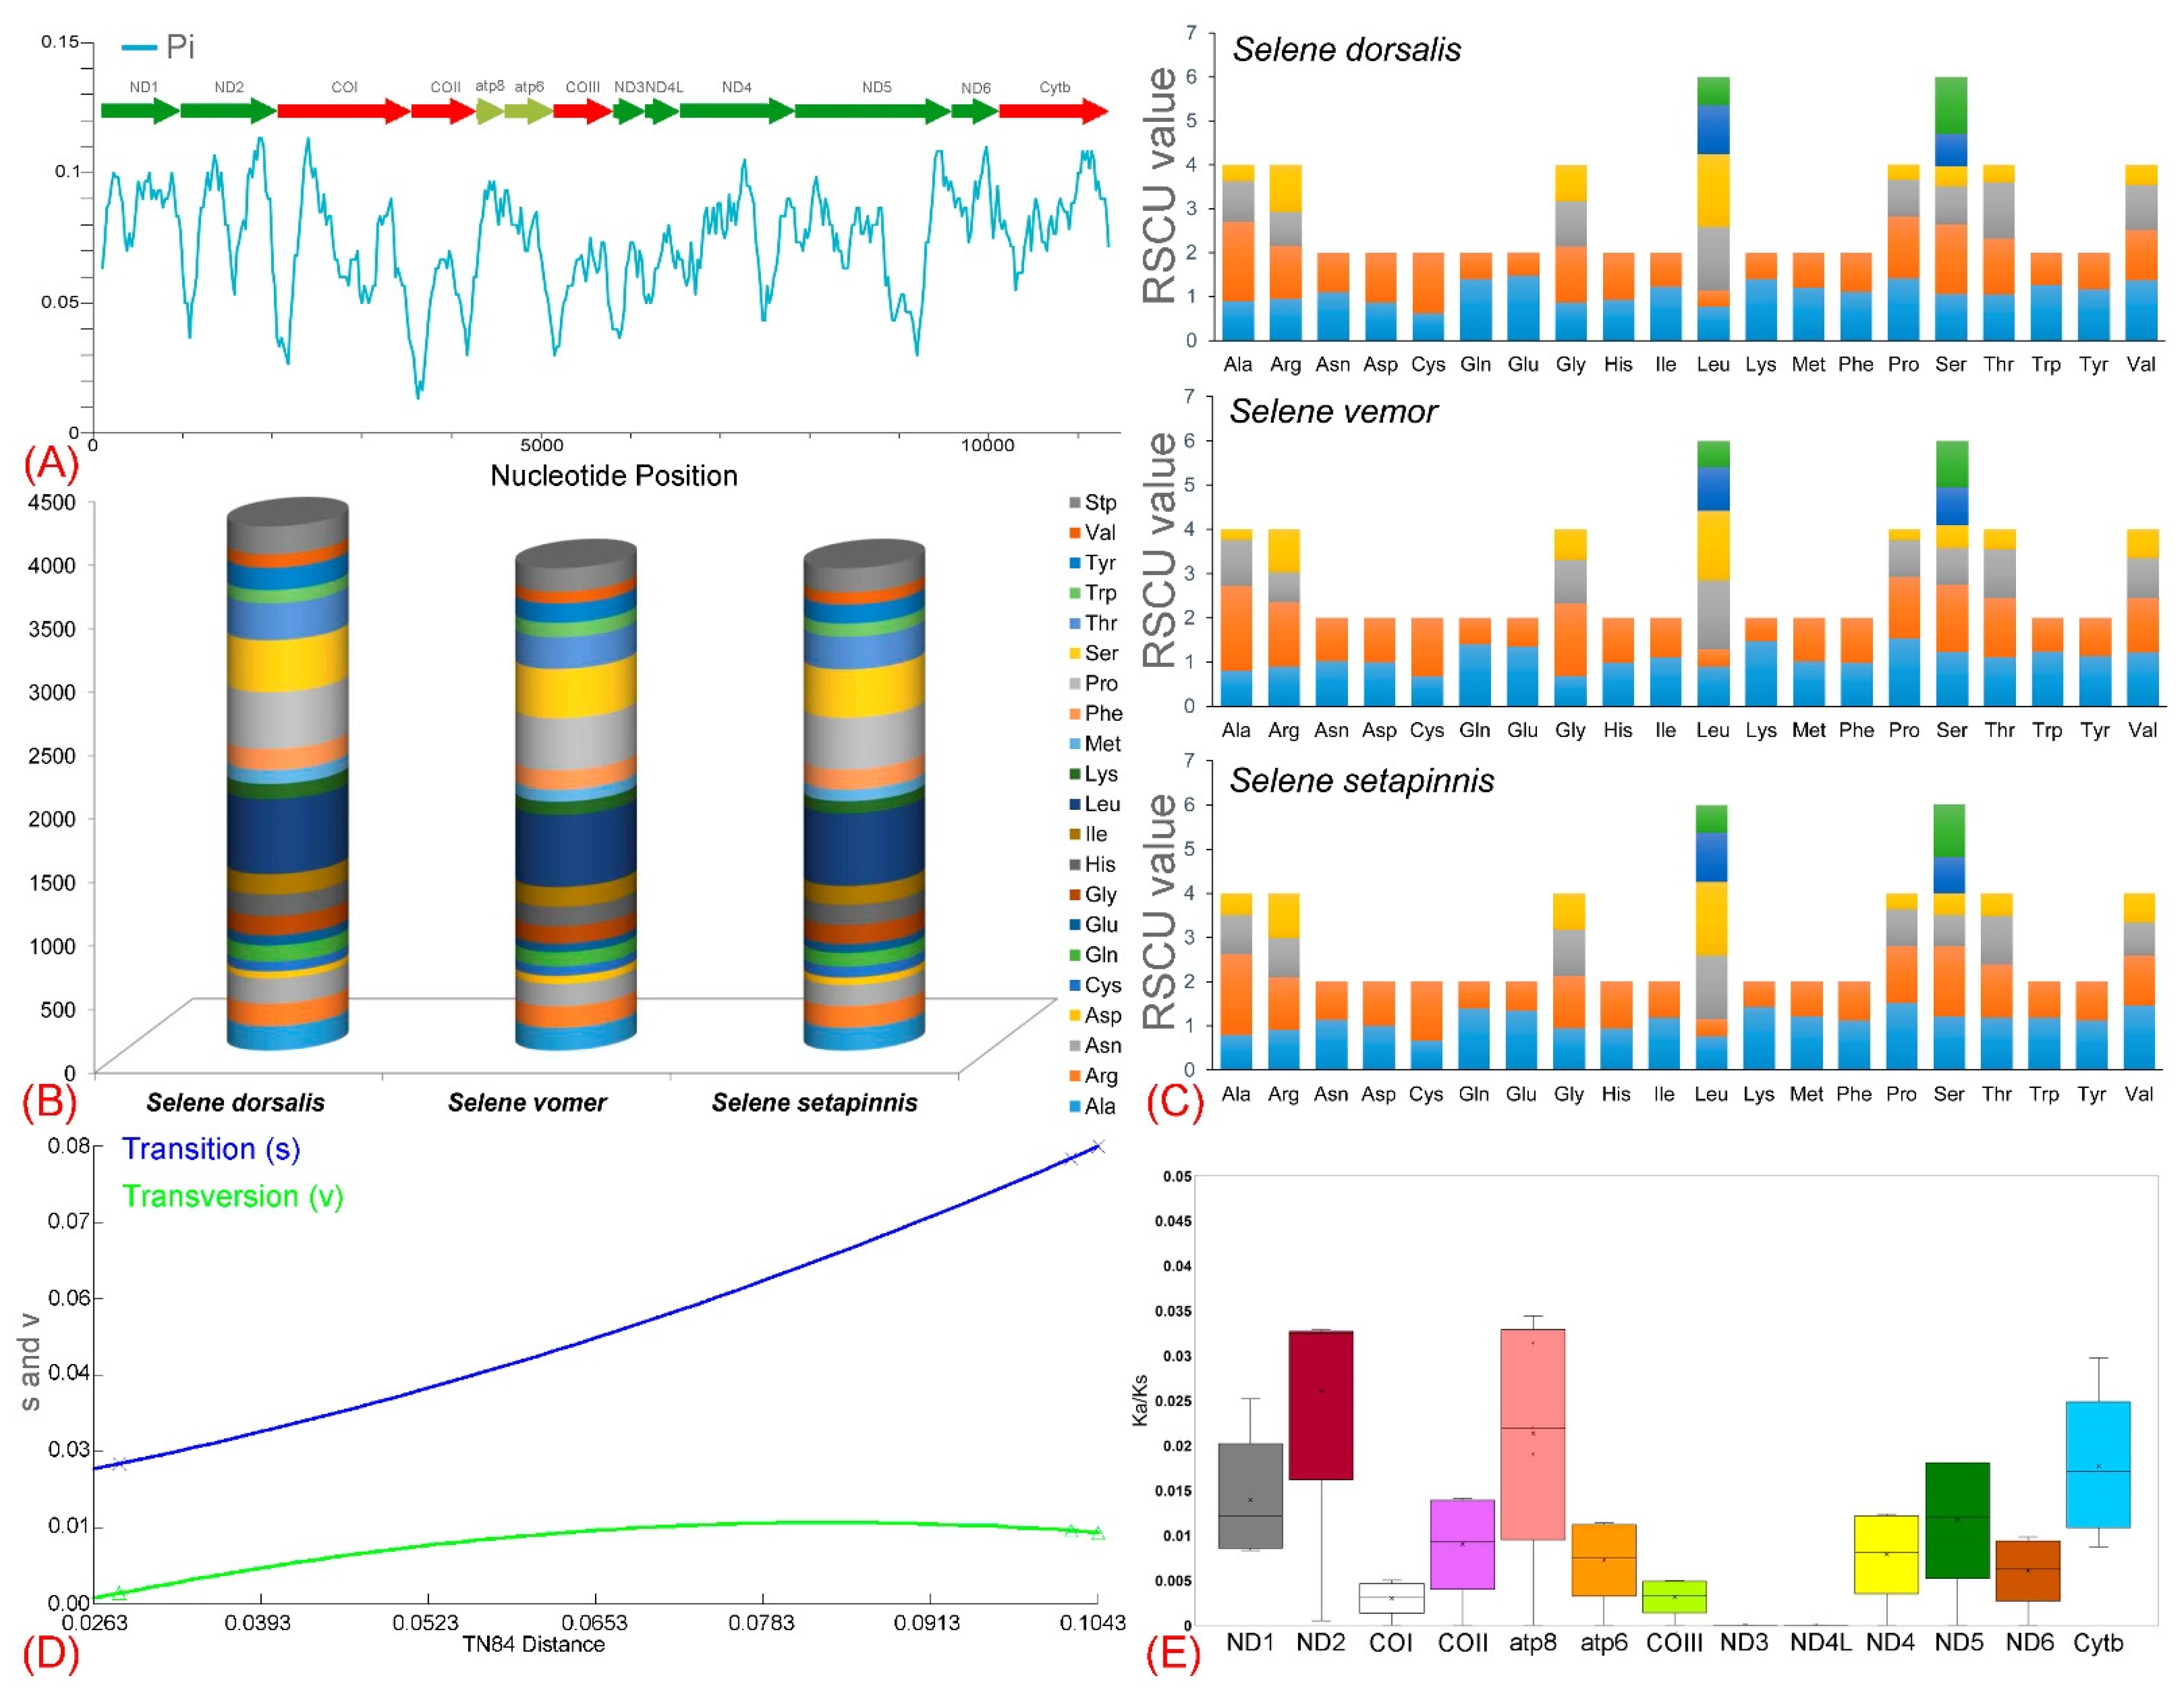
3.3. Codon Usage and Substitution Pattern

The amino acid utilization frequencies among the target species S. dorsalis and its congeners S. vomer and S. setapinnis were similar, with leucine, serine, and proline being the most abundant amino acids across all species. Conversely, aspartic acid, cysteine, and glutamic acid were the least abundant (Figure 3B). Analysis of the RSCU showed a total of 3912 codon transcriptions for S. dorsalis, 3616 for S. vomer, and 3611 for S. setapinnis (Table S4). For all three species, RSCU values were highest for leucine and serine compared to other amino acids, due to the involvement of six different coding nucleotides (Figure 3C). A saturation analysis indicated the non-saturated trends in the variance of transitions and transversions with an increasing Kimura 2-parameter genetic distance (Figure 3D). The calculation of the nonsynonymous (Ka) to synonymous (Ks) substitution ratio indicated that each PCG in the mitogenome of S. dorsalis and its related species within the Carangidae family is subject to similar selective pressures. Average pairwise Ka/Ks values ranged from a minimum of ‘0’ (ND3 and ND4L) to a maximum of 0.0324 ± 0.00049 (ND2), following the order ND3 < ND4L < COI < COIII < ND6 < ATP6 < ND4 < COII < ND5 < ND1 < CYTB < ATP8 < ND2 (Figure 3E). The Ka/Ks ratio is widely used as an indicator of selective pressure under Darwinian evolution, and it is essential to simulate evolutionary influences on a molecular scale across both homogeneous and heterogeneous species [75]. A Ka/Ks ratio greater than ‘1’ indicates positive selection, a ratio of ‘1’ suggests neutral selection, and a ratio less than ‘1’ implies negative selection [76]. The results of this study revealed that all Ka/Ks values were below 1, indicating strong negative selection among the three Selene species (S. dorsalis, S. vomer, and S. setapinnis) (Table S5). This suggests that natural selection acts to minimize harmful mutations, consistent with trends observed in various vertebrate species, including teleosts [48]. Furthermore, examining Ka/Ks ratios in the mitogenomes of Selene species provides valuable insights into natural selection, the evolutionary trajectory, and the dispersion of these species, helping to clarify the interplay between mutations and selective pressures and their combined effect on protein evolution.

3.4. Ribosomal RNA and Transfer RNA

The mitogenome of S. dorsalis includes two rRNA subunits: 12S rRNA (955 bp) and 16S rRNA (1715 bp), totaling 2670 bp, which constitutes 16.14% of the entire mitogenome. Detailed analysis revealed that the length of rRNAs varies slightly among species, ranging from 2670 bp in S. dorsalis to 2669 bp in S. vomer. Unfortunately, data for S. setapinnis were not available in GenBank, preventing a comparative analysis for this species. The rRNA genes exhibited an AT-bias, with values ranging from 52.28% in S. dorsalis to 52.34% in S. vomer. Additionally, AT-skew values ranged from 0.192% in S. dorsalis to 0.195% in S. vomer, while GC-skew values ranged from −0.107 in S. dorsalis to −0.116 in S. vomer (Table 2). Ribosomes are crucial for establishing the proteome of eukaryotic organisms, with ribosomal proteins assembling with rRNA during transcription. The conserved loops of rRNA and circular RNAs are vital for catalytic mechanisms involved in protein synthesis, fish immunity, and growth regulation [77]. Thus, nucleotide variations within rRNA genes of different mitogenomes could serve as genetic markers for population genetics studies [78]. The tRNAs in S. dorsalis total 1576 bp, representing 9.5% of the mitogenome. Comparative analysis with other Selene species shows varying tRNA lengths, from 1556 bp in S. vomer to 1415 bp in S. setapinnis. The AT-bias in tRNAs ranges from 55.01% in S. dorsalis to 55.19% in S. setapinnis, with AT-skew values ranging from 0.114 in S. dorsalis to 0.001 in S. setapinnis (Table 2). Most tRNAs exhibit the classical cloverleaf secondary structure, except for tRNA Serine (S1), which lacks the DHU-arm as reported in other studies (Figure S1) [46]. Transfer RNAs are essential for protein biosynthesis and post-transcriptional regulation in all living organisms [79]. Most anticodons for the 22 tRNAs are similar among the Selene species, except for the tRNA-Ile (I) in S. vomer, which has an anticodon of TAA instead of GAT. Similarly, S. setapinnis displays an anticodon of GTA, contrasting with the TGA found in S. dorsalis and S. vomer (Table S6). tRNA genes act as crucial adapters in translating DNA sequences into proteins. Additionally, variations in tRNA gene positioning and significant length heteroplasmy within the WANCY region are common in mitogenomes and provide insights into the evolutionary patterns of mitochondrial genes [80].

3.5. Control Regions

The CR of S. dorsalis is 847 bp in length, accounting for 5.12% of the total mitogenome, and exhibits an AT richness of 62.81%. The CR is located between the tRNA-Pro (TGG) and tRNA-Phe (GAA) genes (Table 1). Comparative analysis of the CRs in different Selene species revealed variations in length, ranging from 862 bp in S. vomer to 718 bp in S. setapinnis. The AT-skew values ranged from 0.038 in S. dorsalis, 0.064 in S. setapinnis, to 0.009 in S. vomer. GC-skew values varied from −0.213 in S. dorsalis, −0.176 in S. setapinnis, to −0.266 in S. vomer (Table 2). The CR of Selene species includes four conserved domains: CSB-D, CSB-1, CSB-2, and CSB-3. This configuration is also found in the mitogenomes of other teleost species [81]. Within S. dorsalis, the conserved domains are as follows: CSB-1 has the longest base pair length (22 bp), followed by CSB-3 (19 bp), CSB-D (18 bp), and CSB-2, which has the shortest length (17 bp) (Figure 4). The AT-rich CR region has potential for assessing the population structure of the Selene species. The variability in nucleotide composition in this region allows for distinguishing between different populations and individuals. Additionally, the CR is crucial for regulating transcription and replication processes within the mitochondrial genome [82].

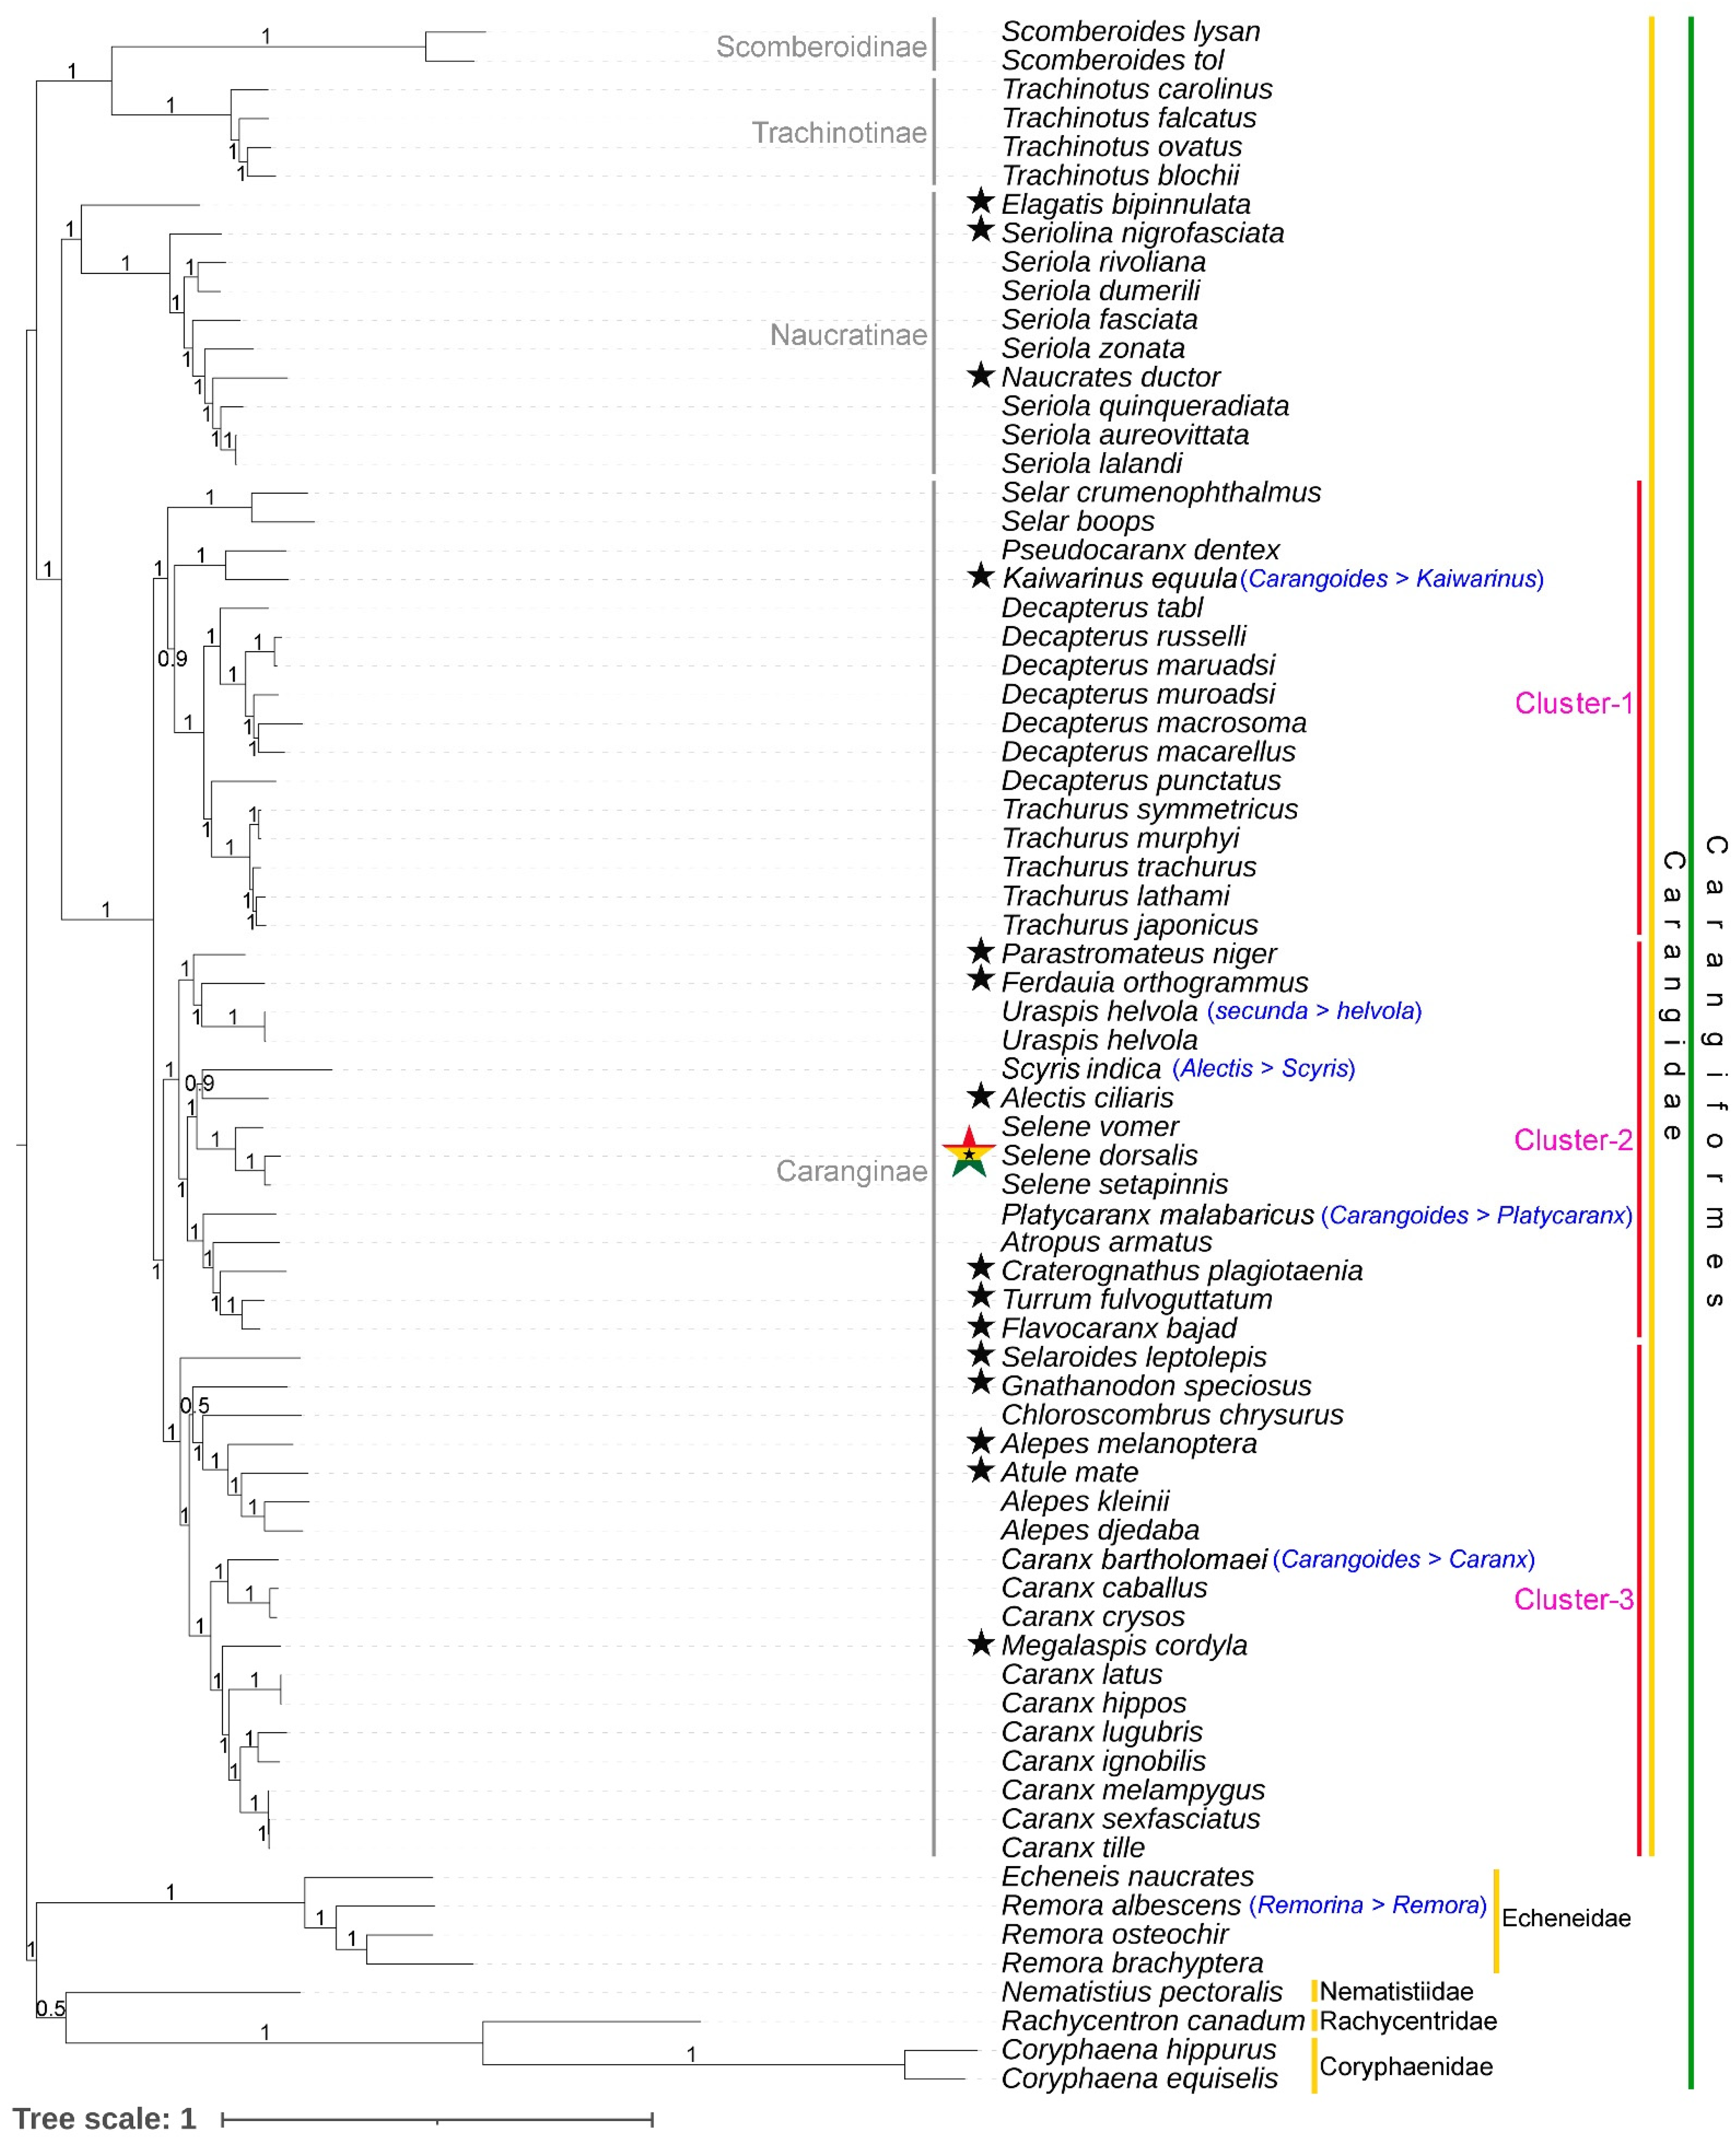
3.6. Phylogenetic Relationship of Carangidae

The cladistic analysis of concatenated 13 PCGs effectively delineated the Carangidae family into monophyletic clusters in both BA and ML phylogenies with high posterior probability and bootstrap support (Figure 5 and Figure S2). Members of other families, including Echeneidae, Nematistiidae, Rachycentridae, and Coryphaenidae, also formed distinct clusters within the Carangiformes phylogeny. Within Carangidae, species from the subfamilies Scomberoidinae, Trachinotinae, Naucratinae, and Caranginae displayed clear monophyletic groupings in the Bayesian and ML analysis of the mitogenome. Notably, Scomberoidinae and Trachinotinae were resolved as sister groups, while Naucratinae and Caranginae also exhibited close evolutionary relationships. Interestingly, within Caranginae, three distinct clusters were identified. In BA phylogeny, the cluster-1 includes species from the genera Selar, Decapterus, Trachurus, and the monotypic genus Kaiwarinus. The cluster-2 encompasses species from the genera Uraspis, Scyris, Selene, Platycaranx, and Atropus, as well as six monotypic genera (Parastromateus, Ferdauia, Alectis, Craterognathus, Turrum, and Flavocaranx). The cluster-3 includes species from the genera Chloroscombrus, Alepes, and Caranx, and five monotypic genera (Selaroides, Gnathanodon, Alepes, Atule, and Megalaspis) (Figure 5). The phylogenetic relationships observed in this study align with recent findings on the evolutionary relationships of this diverse clade of marine fishes (Carangoidei), as assessed through the capture of 1314 ultraconserved elements (UCEs) and mitogenomes [63,83,84]. The present topology also supports the revised classification at both the genus and species levels within Carangidae. However, the close association of the monotypic Naucrates ductor within the Seriola clade (subfamily Naucratinae) and the placement of the monotypic Megalaspis cordyla within the Caranx clade (subfamily Caranginae) suggest that the systematics of these species may need to be revisited. These species have broad distributions in tropical and warm-temperate seas, as well as in the Red Sea and Indo-West Pacific, respectively.

3.7. Lineage Diversification of Selene Species

The suborder Carangoidei, within the order Carangiformes, encompasses a diverse range of species, including Selene species, which inhabit various marine environments from coral reefs to open pelagic zones [63]. Investigating the diversification and biogeographical distribution of Carangoidei provides valuable insights into marine speciation mechanisms, evolutionary history, and ecological changes [85]. The diversification of Carangoidei highlights the complex interactions between historical, ecological, and biogeographical factors that contribute to marine speciation. The Eocene epoch, marked by significant climate shifts, plate tectonic movements, and oceanographic changes, is identified as a pivotal period for the early diversification of this lineage [86,87]. The observed sympatry in Carangoidei contrasts with traditional allopatric speciation models, suggesting that ecological variation in coral reefs and habitat fragmentation play crucial roles in driving speciation within marine ecosystems [63]. Marine organisms do not distribute randomly; instead, their spatial distribution is influenced by profound biotic factors such as recruitment, competition, and predation, as well as abiotic factors like water quality and salinity, and historical factors including hurricanes and tsunamis [88,89]. Species exhibit varied responses to environmental changes, which can lead to allopatric or sympatric speciation. This mechanism is crucial for understanding the evolutionary diversity of species, particularly in marine environments [63]. Biogeographic data on Selene species and their cladistic patterns suggest that S. vomer and S. setapinnis share similar geographical distributions in the Western Atlantic Ocean, potentially undergoing sympatric speciation with S. brownii. However, due to the absence of mitogenome sequences for S. peruviana and S. brevoortii, the study could not fully explore their biogeographic patterns. These species might be separated by the Isthmus of Panama, which could contribute to allopatric speciation. Notably, the mitogenomic phylogeny reveals a close relationship between the Eastern Atlantic S. dorsalis and the Western Atlantic S. setapinnis, compared to other Western Atlantic species like S. vomer, consistent with recent studies [63]. The presence of an open ocean between the Eastern and Western Atlantic Oceans acts as a vicariant barrier, contributing to isolation by distance and limiting the distribution ranges of these species. Further research with detailed molecular data on additional extant species is needed to clarify their lineage diversification. Moreover, within the broader carangid phylogeny, the Selene lineage is closely related to the widely distributed Alectis ciliaris and Scyris indica, which are found circumglobally in tropical, subtropical, and temperate seas, as well as in the Red Sea and Indo-West Pacific, respectively (Figure 6). The cold-water barrier formed by the Benguela and Agulhas currents off the southern coast of South Africa likely separates the Atlantic populations of these carangids, promoting speciation through endemic radiation. Additionally, the unique oceanic currents in the North and South Atlantic and Pacific gyres may act as significant barriers to the diversification and adaptation of Selene species in these oceans (Figure 6).

3.8. Conservation Implication of Selene Species in the Eastern Atlantic Ocean

Global climate change is significantly affecting the ecology and geographical distribution of marine fish populations, particularly reef-associated species [90]. These changes are expected to impact marine ecosystems profoundly, leading to alterations in ocean acidity, temperature shifts, changes in food webs, shifting species distributions, rising sea levels, and reduced ocean productivity [91,92]. For carangids, such changes may lead to habitat destruction and degradation, especially in coastal, estuarine, and coral reef environments where these species are commonly found, particularly in Western Africa [93]. Ocean warming has already influenced the distribution of several carangid species, including Seriola fasciata, S. dorsalis, and Caranx crysos, causing them to migrate northward in search of more suitable thermal environments [12,15,16,17,18,94,95]. This migration can reduce local productivity and disrupt ecosystems and fishing communities that rely on carangids and other reef-associated fishes for economic activities, especially in West African countries [96,97]. Therefore, implementing effective fisheries management policies is crucial to ensure sustainable harvesting practices and mitigate the risk of overexploitation, which can lead to declining Catch Per Unit Effort (CPUE), particularly in Ghana where this study was conducted [98]. Additionally, employing adaptive management strategies is essential, including the use of molecular methods to accurately identify species and assess their genetic diversity. This approach will help address the impacts of climate change and ensure the long-term sustainability of carangid fisheries [99]. While this study provides insights into the S. dorsalis mitogenome sequence from Ghana, generating molecular data from other West African countries would offer a broader perspective on the genetic variability, population structure, and gene flow of this Atlantic moonfish. Such data are vital for the sustainable conservation of this endemic carangid species in the Eastern Atlantic.

4. Conclusions

The escalating impacts of global warming and extreme temperature events are threatening marine biodiversity, leading to significant declines in fisheries worldwide. Carangids, which are economically and recreationally valuable reef-associated fish, are particularly affected. Despite the importance of these species, our understanding of their evolutionary patterns, particularly through mitogenomic analysis, remains limited on a global scale. This research provides an extensive examination of the structure and variations within Selene mitogenomes, with a focus on the complete mitogenome of S. dorsalis, which is endemic to the Eastern Atlantic Ocean. The study uncovers substantial structural variations among S. dorsalis and its allopatric congeners, S. setapinnis and S. vomer, offering critical insights into their evolutionary dynamics. In-depth analysis of mitogenome sequences facilitates comprehensive phylogenetic investigations, elucidating the evolutionary relationships among Selene species and other carangid taxa. This research also enhances our understanding of how historical events and environmental factors have influenced the restricted parapatric speciation of Selene species in the Eastern and Western Atlantic Oceans, as well as the Eastern Pacific Ocean. These findings provide valuable resources for further studies on carangid identification, conservation genetics, speciation, and other aspects of evolutionary biology. The genetic insights gained are crucial for developing effective conservation strategies for Selene species, protecting species diversity, and ensuring the sustainability of marine ecosystems, particularly within the Carangidae family.

Supplementary Materials

The following supporting information can be downloaded at https://www.mdpi.com/article/10.3390/biom14101208/s1, Figure S1. Secondary structures of 22 transfer RNAs (tRNAs) of Selene dorsalis display the structural variation. The tRNAs are denoted by full names and IUPAC-IUB single-letter amino acid codes. The first structure shows the nucleotide positions and details of the stem–loop of tRNAs. Watson–Crick and wobble base pairing are marked by black and red color bars, respectively; Figure S2. Maximum-likelihood (ML) phylogeny based on 13 concatenated PCGs, showing the cladistic relationship of Carangiformes including Selene congeners; Table S1. Details of the mitogenomes of Carangiformes (family Carangidae, Echeneidae Coryphaenidae Rachycentridae, and Nematistiidae) species acquired from the GenBank phylogenetic analyses; Table S2. Comparison of intergenic nucleotides of three different Selene species mitogenomes; Table S3. Comprehensive comparison of the start and stop codons of the PCGs across three Selene mitogenomes; Table S4. The abundance of amino acids and RSCU value of the complete PCGs of three Selene species; Table S5. Comparative pairwise Ka/Ks values of each PCG for three Selene species; Table S6. Detailed comparison of anticodons found in the transfer RNA genes within three Selene mitogenomes.

Author Contributions

Conceptualization: H.-W.K. and S.K.; methodology: E.O.M.E., A.R.K., Y.G. and H.H.; software: A.R.K., S.R.L. and M.H.F.A.; validation: S.C., H.-W.K. and S.K.; formal analysis: E.O.M.E., A.R.K. and M.H.F.A.; investigation: Y.G., H.H. and S.R.L.; resources: S.C. and H.-W.K.; data curation: E.O.M.E., Y.G., S.R.L. and S.A.; writing—original draft: E.O.M.E. and S.K.; writing—review and editing: H.-W.K. and S.K.; visualization: A.R.K., S.R.L. and S.A.; supervision: H.-W.K. and S.K.; project administration: H.-W.K. and S.K.; funding acquisition: S.C., H.-W.K. and S.K. All authors have read and agreed to the published version of the manuscript.

Funding

This research was supported by the distant-water fisheries resources assessment and management of National Institute of Fisheries Science, Republic of Korea (R2024003).

Institutional Review Board Statement

Not applicable.

Informed Consent Statement

Not applicable.

Data Availability Statement

The genome sequence data that support the findings of this study are openly available in GenBank of NCBI at https://www.ncbi.nlm.nih.gov, under the accession no. PP857611.

Acknowledgments

The first author (E.O.M.E.), would like to thank the Korea International Cooperation Agency (KOICA) for the PKNU scholarship, which supported his International Graduate Program of Fisheries Science at the Graduate School of Global Fisheries, Pukyong National University, Busan, Republic of Korea. The authors wish to express their profound gratitude to Emmanuel Dovlo and Eunice Nuerkie Ofoli-Anum for their invaluable assistance in securing the necessary documentation for the shipment of samples to Republic of Korea. We extend our sincere appreciation to the staff of the Fisheries Scientific Survey Division of the Fisheries Commission Ghana, particularly Audrey Lamptey, Salman Sheini, Peter Baah Essel, Kelvin Kafui Fiadoyor, Linda Yeboah, Efua Ansah Mensah, Ama Nyarkoa Sarpong, and Agness Mensima Arthur, for their crucial help with sampling. We also thank Imon Abedin for his assistance in creating the distribution map of the studied species. S.K. acknowledges the financial support provided by the Pukyong National University 2023 Research Grant (202315370001).

Conflicts of Interest

The authors declare no conflicts of interest.

References

  1. Boore, J.L. Animal mitochondrial genomes. Nucleic Acids Res. 1999, 27, 767–1780. [Google Scholar] [CrossRef] [PubMed]
  2. Anderson, S.; Bankier, A.T.; Barrell, B.G.; de Bruijn, M.H.; Coulson, A.R.; Drouin, J.; Eperon, I.C.; Nierlich, D.P.; Roe, B.A.; Sanger, F.; et al. Sequence and organization of the human mitochondrial genome. Nature 1981, 290, 457–465. [Google Scholar] [CrossRef] [PubMed]
  3. Gissi, C.; Iannelli, F.; Pesole, G. Evolution of the mitochondrial genome of Metazoa as exemplified by comparison of congeneric species. Heredity 2008, 101, 301–320. [Google Scholar] [CrossRef] [PubMed]
  4. Dowling, D.K.; Wolff, J.N. Evolutionary genetics of the mitochondrial genome: Insights from Drosophila. Genetics 2023, 224, iyad036. [Google Scholar] [CrossRef]
  5. Bielawski, J.P.; Gold, J.R. Mutation Patterns of Mitochondrial H- and L-Strand DNA in Closely Related Cyprinid Fishes. Genetics 2002, 161, 1589–1597. [Google Scholar] [CrossRef]
  6. Rubinoff, D. Utility of mitochondrial DNA barcodes in species conservation. Conserv. Biol. 2006, 20, 1026–1033. [Google Scholar] [CrossRef]
  7. Tang, M.; Tan, M.; Meng, G.; Yang, S.; Su, X.; Liu, S.; Song, W.; Li, Y.; Wu, Q.; Zhang, A.; et al. Multiplex sequencing of pooled mitochondrial genomes—A crucial step toward biodiversity analysis using mito-metagenomics. Nucleic Acids Res. 2014, 42, e166. [Google Scholar] [CrossRef]
  8. Miya, M.; Takeshima, H.; Endo, H.; Ishiguro, N.B.; Inoue, J.G.; Mukai, T.; Satoh, T.P.; Yamaguchi, M.; Kawaguchi, A.; Mabuchi, K.; et al. Major patterns of higher teleostean phylogenies: A new perspective based on 100 complete mitochondrial DNA sequences. Mol. Phylogenet. Evol. 2003, 26, 121–138. [Google Scholar] [CrossRef]
  9. Amponsah, S.K.K.; Avornyo, S.Y.; Ofori-Danson, P.; Afranewaa, N.A.B. Assessing the population characteristics of Carangids in the coast of Ghana, West Africa. Res. Mar. Sci. 2021, 6, 965–976. [Google Scholar]
  10. Reuben, S.; Kasim, H.; Sivakami, S.; Radhakrishnan, P.N.; Kurup, K.N.; Sivadas, M.; Noble, A.; Nair, K.V.S.; Raje, S.G. Fishery, biology and stock assessment of carangid resources from the Indian seas. Indian J. Fish. 1992, 39, 195–234. [Google Scholar]
  11. Fricke, R.; Eschmeyer, W.N.; Van der Laan, R. (Eds.) Eschmeyer’s Catalog of Fishes: Genera, Species. Available online: http://researcharchive.calacademy.org/research/ichthyology/catalog/fishcatmain.asp (accessed on 11 July 2024).
  12. Vella, P.; Deidun, A. First record of Selene dorsalis (Osteichthyes: Carangidae) in the Mediterranean Sea, from coastal waters off the Maltese Islands. Mar. Biodivers. Rec. 2009, 2, e125. [Google Scholar] [CrossRef]
  13. Efe, O.; John, A.; Omoariagbon, B. Some aspects of biology of Selene dorsalis from Forcados River estuary. Res. Mar. Sci. 2019, 4, 15–16. [Google Scholar]
  14. Reed, D.L.; deGravelle, M.J.; Carpenter, K.E. Molecular systematics of Selene (Perciformes: Carangidae) based on cytochrome B sequences. Mol. Phylogenet. Evol. 2001, 21, 468–475. [Google Scholar] [CrossRef] [PubMed]
  15. Castro-Hernández, J.J. Primera cita de Selene dorsalis (Gill; 1862) (Osteichthyes: Carangidae) en las islas Canarias (Atlántico centro-oriental). Bol. Inst. Esp. Oceanogr 2001, 17, 333–335. [Google Scholar]
  16. Juárez, A.; Silva, L.; Gill, J. First Record of Selene dorsalis (Osteichthyes: Carangidae) in the Spanish Waters of the Gulf of Cádiz (ICES Division IXa South). Mar. Biodivers. Rec. 2008, 1, e28. [Google Scholar] [CrossRef]
  17. Kovačić, M.; Lipej, L.; Dulčić, J.; Iglesias, S.P.; Goren, M. Evidence-based checklist of the Mediterranean Sea fishes. Zootaxa 2021, 4998, 1–115. [Google Scholar] [CrossRef]
  18. Tsagarakis, K.; Agius Darmanin, S.; Al Mabruk, S.A.; Auriemma, R.; Azzurro, E.; Badouvas, N.; Bakiu, R.; Bariche, M.; Battaglia, P.; Betti, F.; et al. New records of rare species in the Mediterranean Sea (October 2021). Mediterr. Mar. Sci. 2021, 22, 627–652. [Google Scholar] [CrossRef]
  19. Odekunle, T.O.; Eludoyin, A.O. Sea surface temperature patterns in the Gulf of Guinea: Their implications for the spatio-temporal variability of precipitation in West Africa. Int. J. Climatol. 2008, 28, 1507–1517. [Google Scholar] [CrossRef]
  20. IUCN. The IUCN Red List of Threatened Species. Version 2024-1. Available online: https://www.iucnredlist.org (accessed on 11 July 2024).
  21. Arra, S.; Sylla, S.; Kouame, A.C.; Zan-BI, T.T.; Ouattara, M. Reproductive biology of the African moonfish, Selene dorsalis (Gill, 1862) (Carangidae) in continental shelf of Côte d’Ivoire fishery (West Africa). Int. J. Fish. Aquat. Stud. 2018, 6, 358–363. [Google Scholar]
  22. Biro, P.A.; Post, J.R.; Booth, D.J. Mechanisms for climate-induced mortality of fish populations in whole-lake experiments. Proc. Natl. Acad. Sci. USA 2007, 104, 9715–9719. [Google Scholar] [CrossRef]
  23. Watanabe, Y.Y.; Goldman, K.J.; Caselle, J.E.; Chapman, D.D.; Papastamatiou, Y.P. Comparative analyses of animal-tracking data reveal ecological significance of endothermy in fishes. Proc. Natl. Acad. Sci. USA 2015, 112, 6104–6109. [Google Scholar] [CrossRef] [PubMed]
  24. Moritz, C. Applications of mitochondrial DNA analysis in conservation: A critical review. Mol. Ecol. 1994, 3, 401–411. [Google Scholar] [CrossRef]
  25. Kimura, S.; Takeuchi, S.; Yadome, T. Generic revision of the species formerly belonging to the genus Carangoides and its related genera (Carangiformes: Carangidae). Ichthyol. Res. 2022, 69, 433–487. [Google Scholar] [CrossRef]
  26. Li, B.; Dettaï, A.; Cruaud, C.; Couloux, A.; Desoutter-Meniger, M.; Lecointre, G. RNF213, a new nuclear marker for acanthomorph phylogeny. Mol. Phylogenet. Evol. 2009, 50, 345–363. [Google Scholar] [CrossRef] [PubMed]
  27. Damerau, M.; Freese, M.; Hanel, R. Multi-gene phylogeny of jacks and pompanos (Carangidae), including placement of monotypic vadigo Campogramma glaycos. J. Fish Biol. 2018, 92, 190–202. [Google Scholar] [CrossRef]
  28. Yancy, H.F.; Zemlak, T.S.; Mason, J.A.; Washington, J.D.; Tenge, B.J.; Nguyen, N.L.; Barnett, J.D.; Savary, W.E.; Hill, W.E.; Moore, M.M.; et al. Potential use of DNA barcodes in regulatory science: Applications of the Regulatory Fish Encyclopedia. J. Food Prot. 2008, 71, 210–217. [Google Scholar] [CrossRef]
  29. Steinke, D.; Zemlak, T.S.; Hebert, P.D.N. Barcoding nemo: DNA-based identifications for the ornamental fish trade. PLoS ONE 2009, 4, e6300. [Google Scholar] [CrossRef]
  30. Valdez-Moreno, M.; Vásquez-Yeomans, L.; Elías-Gutiérrez, M.; Ivanova, N.V.; Hebert, P.D.N. Using DNA barcodes to connect adults and early life stages of marine fishes from the Yucatan Peninsula, Mexico: Potential in fisheries management. Mar. Freshw. Res. 2010, 61, 665–671. [Google Scholar] [CrossRef]
  31. Ribeiro, A.O.; Caires, R.A.; Mariguela, T.C.; Pereira, L.H.; Hanner, R.; Oliveira, C. DNA barcodes identify marine fishes of São Paulo State, Brazil. Mol. Ecol. Resour. 2012, 12, 1012–1020. [Google Scholar] [CrossRef]
  32. Weigt, L.A.; Baldwin, C.C.; Driskell, A.; Smith, D.G.; Ormos, A.; Reyier, E.A. Using DNA barcoding to assess Caribbean reef fish biodiversity: Expanding taxonomic and geographic coverage. PLoS ONE 2012, 7, e41059. [Google Scholar] [CrossRef]
  33. McCusker, M.R.; Denti, D.; Van Guelpen, L.; Kenchington, E.; Bentzen, P. Barcoding Atlantic Canada’s commonly encountered marine fishes. Mol. Ecol. Resour. 2013, 13, 177–188. [Google Scholar] [CrossRef] [PubMed]
  34. Betancur-R, R.; Broughton, R.E.; Wiley, E.O.; Carpenter, K.; López, J.A.; Li, C.; Holcroft, N.I.; Arcila, D.; Sanciangco, M.; Cureton, J.C., II; et al. The tree of life and a new classification of bony fishes. PLoS Curr. 2013, 5, ecurrents.tol.53ba26640df0ccaee75bb165c8c26288. [Google Scholar] [CrossRef] [PubMed]
  35. Near, T.J.; Dornburg, A.; Eytan, R.I.; Keck, B.P.; Smith, W.L.; Kuhn, K.L.; Moore, J.A.; Price, S.A.; Burbrink, F.T.; Friedman, M.; et al. Phylogeny and tempo of diversification in the superradiation of spiny-rayed fishes. Proc. Natl. Acad. Sci. USA 2013, 110, 12738–12743. [Google Scholar] [CrossRef] [PubMed]
  36. Sanciangco, M.D.; Carpenter, K.E.; Betancur-R, R. Phylogenetic placement of enigmatic percomorph families (Teleostei: Percomorphaceae). Mol. Phylogenet. Evol. 2016, 94, 565–576. [Google Scholar] [CrossRef]
  37. Deeds, J.R.; Handy, S.M.; Fry, F., Jr.; Granade, H.; Williams, J.T.; Powers, M.; Shipp, R.; Weigt, L.A. Protocol for building a reference standard sequence library for DNA-based seafood identification. J. AOAC Int. 2014, 97, 1626–1633. [Google Scholar] [CrossRef]
  38. Miya, M.; Sato, Y.; Fukunaga, T.; Sado, T.; Poulsen, J.Y.; Sato, K.; Minamoto, T.; Yamamoto, S.; Yamanaka, H.; Araki, H.; et al. MiFish, a set of universal PCR primers for metabarcoding environmental DNA from fishes: Detection of more than 230 subtropical marine species. R. Soc. Open Sci. 2015, 2, 150088. [Google Scholar] [CrossRef]
  39. Aguilar, R.; Ogburn, M.B.; Driskell, A.C.; Weigt, L.A.; Groves, M.C.; Hines, A.H. Gutsy genetics: Identification of digested piscine prey items in the stomach contents of sympatric native and introduced warm water catfishes via DNA barcoding. Environ. Biol. Fishes 2017, 100, 325–336. [Google Scholar] [CrossRef]
  40. Stoeckle, M.Y.; Das Mishu, M.; Charlop-Powers, Z. GoFish: A versatile nested PCR strategy for environmental DNA assays for marine vertebrates. PLoS ONE 2018, 13, e0198717. [Google Scholar] [CrossRef]
  41. Sarmiento-Camacho, S.; Valdez-Moreno, M. DNA barcode identification of commercial fish sold in Mexican markets. Genome 2018, 61, 457–466. [Google Scholar] [CrossRef]
  42. Gold, Z.; Curd, E.E.; Goodwin, K.D.; Choi, E.S.; Frable, B.W.; Thompson, A.R.; Walker, H.J., Jr.; Burton, R.S.; Kacev, D.; Martz, L.D.; et al. Improving metabarcoding taxonomic assignment: A case study of fishes in a large marine ecosystem. Mol. Ecol. Resour. 2021, 21, 2546–2564. [Google Scholar] [CrossRef]
  43. Díaz-Ferguson, E.; Chial, M.; Gonzalez, M.; Muñoz, E.; Chen, O.; Durán, O.; Vega, A.J.; Delgado, C.R. Building a teleost fish traceability program based on genetic data from Pacific Panama fish markets. Animals 2023, 13, 2272. [Google Scholar] [CrossRef] [PubMed]
  44. Hoban, M.L.; Whitney, J.; Collins, A.G.; Meyer, C.; Murphy, K.R.; Reft, A.J.; Bemis, K.E. Skimming for barcodes: Rapid production of mitochondrial genome and nuclear ribosomal repeat reference markers through shallow shotgun sequencing. PeerJ 2022, 10, e13790. [Google Scholar] [CrossRef] [PubMed]
  45. Alvarenga, M.; D’Elia, A.K.P.; Rocha, G.; Arantes, C.A.; Henning, F.; de Vasconcelos, A.T.R.; Solé-Cava, A.M. Mitochondrial genome structure and composition in 70 fishes: A key resource for fisheries management in the South Atlantic. BMC Genom. 2024, 25, 215. [Google Scholar] [CrossRef] [PubMed]
  46. Satoh, T.P.; Miya, M.; Mabuchi, K.; Nishida, M. Structure and variation of the mitochondrial genome of fishes. BMC Genom. 2016, 17, 719. [Google Scholar] [CrossRef] [PubMed]
  47. Molina-Quirós, J.L.; Hernández-Muñoz, S.; Baeza, J.A. The complete mitochondrial genome of the roosterfish Nematistius pectoralis Gill 1862: Purifying selection in protein-coding genes, organization of the control region, and insights into family-level phylogenomic relationships in the recently erected order Carangiformes. Gene 2022, 845, 146847. [Google Scholar] [PubMed]
  48. Kundu, S.; Kang, H.-E.; Kim, A.R.; Lee, S.R.; Kim, E.-B.; Amin, M.H.F.; Andriyono, S.; Kim, H.-W.; Kang, K. Mitogenomic characterization and phylogenetic placement of African Hind, Cephalopholis taeniops: Shedding light on the evolution of groupers (Serranidae: Epinephelinae). Int. J. Mol. Sci. 2024, 25, 1822. [Google Scholar] [CrossRef]
  49. Wirtz, P.; Brito, A.; Falcón, J.M.; Freitas, R.; Fricke, R.; Monteiro, V.; Reiner, F.; Tariche, O. The coastal fishes of the Cape Verde Islands–new records and an annotated checklist. Spixiana 2013, 36, 113–142. [Google Scholar]
  50. Folmer, O.; Black, M.; Hoeh, W.; Lutz, R.; Vrijenhoek, R. DNA primers for amplification of mitochondrial cytochrome c oxidase subunit I from diverse metazoan invertebrates. Mol. Mar. Biol. Biotechnol. 1994, 3, 294–299. [Google Scholar]
  51. Kearse, M.; Moir, R.; Wilson, A.; Stones-Havas, S.; Cheung, M.; Sturrock, S.; Buxton, S.; Cooper, A.; Markowitz, S.; Duran, C.; et al. Geneious Basic: An integrated and extendable desktop software platform for the organization and analysis of sequence data. Bioinformatics 2012, 28, 1647–1649. [Google Scholar] [CrossRef]
  52. Bernt, M.; Donath, A.; Jühling, F.; Externbrink, F.; Florentz, C.; Fritzsch, G.; Pütz, J.; Middendorf, M.; Stadler, P.F. MITOS: Improved de novo metazoan mitochondrial genome annotation. Mol. Phylogenet. Evol. 2013, 69, 313–319. [Google Scholar] [CrossRef]
  53. Iwasaki, W.; Fukunaga, T.; Isagozawa, R.; Yamada, K.; Maeda, Y.; Satoh, T.P.; Sado, T.; Mabuchi, K.; Takeshima, H.; Miya, M.; et al. MitoFish and MitoAnnotator: A mitochondrial genome database of fish with an accurate and automatic annotation pipeline. Mol. Biol. Evol. 2013, 30, 2531–2540. [Google Scholar] [CrossRef] [PubMed]
  54. Kumar, S.; Stecher, G.; Li, M.; Knyaz, C.; Tamura, K. MEGA X: Molecular evolutionary genetics analysis across computing platforms. Mol. Biol. Evol. 2018, 35, 1547–1549. [Google Scholar] [CrossRef] [PubMed]
  55. Rozas, J.; Ferrer-Mata, A.; Sánchez-DelBarrio, J.C.; Guirao-Rico, S.; Librado, P.; Ramos-Onsins, S.E.; Sánchez-Gracia, A. DnaSP 6: DNA sequence polymorphism analysis of large data sets. Mol. Biol. Evol. 2017, 34, 3299–3302. [Google Scholar] [CrossRef] [PubMed]
  56. Perna, N.T.; Kocher, T.D. Patterns of nucleotide composition at fourfold degenerate sites of animal mitochondrial genomes. J. Mol. Evol. 1995, 41, 353–358. [Google Scholar] [CrossRef] [PubMed]
  57. Xia, X. DAMBE6: New tools for microbial genomics, phylogenetics, and molecular evolution. J. Hered. 2017, 108, 431–437. [Google Scholar] [CrossRef]
  58. Laslett, D.; Canbäck, B. ARWEN: A program to detect tRNA genes in metazoan mitochondrial nucleotide sequences. Bioinformatics 2008, 24, 172–175. [Google Scholar] [CrossRef]
  59. Chan, P.P.; Lowe, T.M. GtRNAdb 2.0: An expanded database of transfer RNA genes identified in complete and draft genomes. Nucleic Acids Res. 2016, 44, D184–D189. [Google Scholar] [CrossRef]
  60. Thompson, J.D.; Gibson, T.J.; Plewniak, F.; Jeanmougin, F.; Higgins, D.G. The CLUSTAL_X windows interface: Flexible strategies for multiple sequence alignment aided by quality analysis tools. Nucleic Acids Res. 1997, 25, 4876–4882. [Google Scholar] [CrossRef]
  61. Kundu, S.; Kim, H.W.; Lee, J.; Chung, S.; Lee, S.R.; Gietbong, F.Z.; Kang, K. Mitogenomic architecture and phylogenetic relationship of European barracuda, Sphyraena sphyraena (Teleostei: Sphyraenidae) from the Atlantic Ocean. Fishes 2023, 8, 573. [Google Scholar] [CrossRef]
  62. Santini, F.; Carnevale, G. First multilocus and densely sampled timetree of trevallies, pompanos and allies (Carangoidei, Percomorpha) suggests a Cretaceous origin and Eocene radiation of a major clade of piscivores. Mol. Phylogenet. Evol. 2015, 83, 33–39. [Google Scholar] [CrossRef]
  63. Glass, J.R.; Harrington, R.C.; Cowman, P.F.; Faircloth, B.C.; Near, T.J. Widespread sympatry in a species-rich clade of marine fishes (Carangoidei). Proc. Biol. Sci. 2023, 290, 20230657. [Google Scholar] [CrossRef] [PubMed]
  64. Vences, M.; Miralles, A.; Brouillet, S.; Ducasse, J.; Fedosov, A.; Kharchev, V.; Renner, S.S. iTaxoTools 0.1: Kickstarting a specimen-based software toolkit for taxonomists. Megataxa 2021, 6, 77–92. [Google Scholar] [CrossRef]
  65. Miller, M.A.; Schwartz, T.; Pickett, B.E.; He, S.; Klem, E.B.; Scheuermann, R.H.; Passarotti, M.; Kaufman, S.; O’Leary, M.A. A RESTful API for access to phylogenetic tools via the CIPRES Science Gateway. Evol. Bioinform. 2015, 11, 43–48. [Google Scholar] [CrossRef] [PubMed]
  66. Lanfear, R.; Frandsen, P.B.; Wright, A.M.; Senfeld, T.; Calcott, B. PartitionFinder 2: New methods for selecting partitioned models of evolution for molecular and morphological phylogenetic analyses. Mol. Biol. Evol. 2017, 34, 772–773. [Google Scholar] [CrossRef]
  67. Ronquist, F.; Huelsenbeck, J.P. MrBayes 3: Bayesian phylogenetic inference under mixed models. Bioinformatics 2003, 19, 1572–1574. [Google Scholar] [CrossRef] [PubMed]
  68. Guindon, S.; Dufayard, J.F.; Lefort, V.; Anisimova, M.; Hordijk, W.; Gascuel, O. New algorithms and methods to estimate maximum-likelihood phylogenies: Assessing the performance of PhyML 3.0. Syst. Biol. 2010, 59, 307–321. [Google Scholar] [CrossRef]
  69. Letunic, I.; Bork, P. Interactive Tree Of Life (iTOL): An online tool for phylogenetic tree display and annotation. Bioinformatics 2007, 23, 127–128. [Google Scholar] [CrossRef]
  70. Brown, K.H. Fish mitochondrial genomics: Sequence, inheritance and functional variation. J. Fish Biol. 2008, 72, 355–374. [Google Scholar] [CrossRef]
  71. Ojala, D.; Montoya, J.; Attardi, G. tRNA punctuation model of RNA processing in human mitochondria. Nature 1981, 290, 470–474. [Google Scholar] [CrossRef]
  72. Consuegra, S.; John, E.; Verspoor, E.; de Leaniz, C.G. Patterns of natural selection acting on the mitochondrial genome of a locally adapted fish species. Genet. Sel. Evol. 2015, 47, 58. [Google Scholar] [CrossRef]
  73. Hill, J.; Enbody, E.D.; Pettersson, M.E.; Sprehn, C.G.; Bekkevold, D.; Folkvord, A.; Andersson, L. Recurrent convergent evolution at amino acid residue 261 in fish rhodopsin. Proc. Natl. Acad. Sci. USA 2019, 116, 18473–18478. [Google Scholar] [CrossRef] [PubMed]
  74. Li, Z.; Li, M.; Xu, S.; Liu, L.; Chen, Z.; Zou, K. Complete mitogenomes of three Carangidae (Perciformes) fishes: Genome description and phylogenetic considerations. Int. J. Mol. Sci. 2020, 21, 4685. [Google Scholar] [CrossRef] [PubMed]
  75. Yang, Z.; Nielsen, R.; Goldman, N.; Pedersen, A.M.K. Codon-substitution models for heterogeneous selection pressure at amino acid sites. Genetics 2000, 155, 431–449. [Google Scholar] [CrossRef]
  76. Elmer, K.R.; Fan, S.; Gunter, H.M.; Jones, J.C.; Boekhoff, S.; Kuraku, S.; Meyer, A. Rapid evolution and selection inferred from the transcriptomes of sympatric crater lake cichlid fishes. Mol. Ecol. 2010, 19, 197–211. [Google Scholar] [CrossRef] [PubMed]
  77. Rbbani, G.; Nedoluzhko, A.; Galindo-Villegas, J.; Fernandes, J.M. Function of circular RNAs in fish and their potential application as biomarkers. Int. J. Mol. Sci. 2021, 22, 7119. [Google Scholar] [CrossRef] [PubMed]
  78. Quraishia, S.F.; Panneerchelvam, S.; Zainuddin, Z.; Abd Rashid, N.H. Molecular characterization of Malaysian marine fish species using partial sequence of mitochondrial DNA 12S and 16S rRNA markers. Sains Malays. 2015, 44, 1119–1123. [Google Scholar] [CrossRef]
  79. Thornlow, B.P.; Hough, J.; Roger, J.M.; Gong, H.; Lowe, T.M.; Corbett-Detig, R.B. Transfer RNA genes experience exceptionally elevated mutation rates. Proc. Natl. Acad. Sci. USA 2018, 115, 8996–9001. [Google Scholar] [CrossRef]
  80. Cantatore, P.; Gadaleta, M.N.; Roberti, M.; Saccone, C.; Wilson, A.C. Duplication and remoulding of tRNA genes during the evolutionary rearrangement of mitochondrial genomes. Nature 1987, 329, 853–855. [Google Scholar] [CrossRef]
  81. Kundu, S.; Binarao, J.D.; De Alwis, P.S.; Kim, A.R.; Lee, S.R.; Andriyono, S.; Kim, H.W. First mitogenome of endangered Enteromius thysi (Actinopterygii: Cypriniformes: Cyprinidae) from Africa: Characterization and phylogeny. Fishes 2022, 8, 25. [Google Scholar] [CrossRef]
  82. Taanman, J.W. The mitochondrial genome: Structure, transcription, translation and replication. Biochim. Biophys. Acta 1999, 1410, 103–123. [Google Scholar] [CrossRef]
  83. Jose, A.; Sukumaran, S.; Mukundan, L.P.; Raj, N.; Mary, S.; Nisha, K.; Gopalakrishnan, A. Comparative mitogenomics and phylogenetics of the family Carangidae with special emphasis on the mitogenome of the Indian Scad Decapterus russelli. Sci. Rep. 2022, 12, 5642. [Google Scholar] [CrossRef] [PubMed]
  84. Li, B.; Wang, H.; Yang, L.; Liu, S.; Zhuang, Z. Complete mitochondrial genome of Pseudocaranx dentex (Carangidae, Perciformes) provides insight into phylogenetic and evolutionary relationship among Carangidae family. Genes 2021, 12, 1234. [Google Scholar] [CrossRef] [PubMed]
  85. Swart, B.L.; von der Heyden, S.; Bester-van der Merwe, A.; Roodt-Wilding, R. Molecular systematics and biogeography of the circumglobally distributed genus Seriola (Pisces: Carangidae). Mol. Phylogenet. Evol. 2015, 93, 274–280. [Google Scholar] [CrossRef] [PubMed]
  86. Leprieur, F.; Descombes, P.; Gaboriau, T.; Cowman, P.F.; Parravicini, V.; Kulbicki, M.; Melián, C.J.; de Santana, C.N.; Heine, C.; Mouillot, D.; et al. Plate tectonics drive tropical reef biodiversity dynamics. Nat. Commun. 2016, 7, 11461. [Google Scholar] [CrossRef]
  87. Lepprieur, F.; Pellissier, L.; Mouillot, D.; Gaboriau, T. Influence of historical changes in tropical reef habitat on the diversification of coral reef fishes. Sci. Rep. 2021, 11, 20731. [Google Scholar] [CrossRef] [PubMed]
  88. Caley, M.J.; Carr, M.H.; Hixon, M.A.; Hughes, T.P.; Jones, G.P.; Menge, B.A. Recruitment and the local dynamics of open marine populations. Annu. Rev. Ecol. Syst. 1996, 27, 477–500. [Google Scholar] [CrossRef]
  89. Harrison, T.D.; Whitfield, A.K. Temperature and salinity as primary determinants influencing the biogeography of fishes in South African estuaries. Estuar. Coast. Shelf Sci. 2006, 66, 335–345. [Google Scholar] [CrossRef]
  90. Dahms, C.; Killen, S. Temperature change effects on marine fish range shifts: A meta-analysis of ecological and methodological predictors. Glob. Chang. Biol. 2023, 29, 4459–4479. [Google Scholar] [CrossRef]
  91. Brierley, A.S.; Kingsford, M.J. Impacts of climate change on marine organisms and ecosystems. Curr. Biol. 2009, 19, R602–R614. [Google Scholar] [CrossRef]
  92. Hoegh-Guldberg, O.; Bruno, J.F. The impact of climate change on the world’s marine ecosystems. Science 2010, 328, 1523–1528. [Google Scholar] [CrossRef]
  93. Mat Jaafar, T.N.; Taylor, M.I.; Mohd Nor, S.A.; Bruyn, M.D.; Carvalho, G.R. Comparative genetic stock structure in three species of commercially exploited Indo-Malay Carangidae (Teleosteii, Perciformes). J. Fish Biol. 2020, 96, 337–349. [Google Scholar] [CrossRef] [PubMed]
  94. Andaloro, F.; Falautano, M.; Sinopoli, M.; Passarelli, F.M.; Pipitone, C.; Addis, P.; Castriota, L. The Lesser Amberjack Seriola fasciata (Perciformes: Carangidae) in the Mediterranean: A recent colonist. Cybium 2005, 29, 141–145. [Google Scholar]
  95. Di Blasi, D.; Bava, S.; Desiderà, E.; Merotto, L.; Poli, F.; Guidetti, P. The northernmost records of Caranx crysos (Osteichthyes: Carangidae) in the NW Mediterranean Sea. Thalassas 2024, 40, 7–11. [Google Scholar] [CrossRef]
  96. Polidoro, B.A.; Ralph, G.M.; Strongin, K.; Harvey, M.; Carpenter, K.E.; Arnold, R.; Williams, A. The status of marine biodiversity in the Eastern Central Atlantic (West and Central Africa). Aquat. Conserv. 2017, 27, 1021–1034. [Google Scholar] [CrossRef]
  97. Takyi, R.; Addo, C.; El Mahrad, B.; Adade, R.; ElHadary, M.; Nunoo, F.K.E.; Essandoh, J.; Chuku, E.O.; Iriarte-Ahon, F. Marine fisheries management in the Eastern Central Atlantic Ocean. Ocean Coast. Manag. 2023, 244, 106784. [Google Scholar] [CrossRef]
  98. Nunoo, F.K.; Asiedu, B. An investigation of fish catch data and its implications for management of small-scale fisheries of Ghana. Int. J. Fish. Aquat. Sci. 2013, 2, 46–57. [Google Scholar]
  99. Teletchea, F. Molecular identification methods of fish species: Reassessment and possible applications. Rev. Fish Biol. Fish. 2009, 19, 265–293. [Google Scholar] [CrossRef]
Figure 1. Global distribution pattern of Selene species. The collection locality for S. dorsalis is indicated by the round-shaped country map of Ghana. The map was generated using ArcGIS version 10.6 and manually edited in Adobe Photoshop CS 8.0.
Biomolecules 14 01208 g001
Figure 2. Circular mitochondrial genome of S. dorsalis, annotated using the MitoAnnotator online server. Different colored arcs represent the presence of PCGs, rRNAs, tRNAs, and CR. The species photograph was taken by the first author (E.O.M.E.).
Biomolecules 14 01208 g002
Figure 3. (A) Genetic diversity (Pi) of mitochondrial PCGs showing genetic variations among S. dorsalis and its congeners. (B) Codon usage abundance across the mitogenomes of three Selene species. (C) Comparative relative synonymous codon usage (RSCU) in Selene species, including S. dorsalis. (D) Substitution patterns in PCG matrices. The graph illustrates non-saturated trends in the variance of transitions and transversions as Kimura 2-parameter genetic distance increases. (E) Box plot depicting the pairwise divergence of Ka/Ks ratios for each mitochondrial PCG across all carangid fishes, including Selene species.
Biomolecules 14 01208 g003
Figure 4. Schematic diagram comparing the length and nucleotide composition of different conserved domains in control regions of S. dorsalis and other Selene congeners. Conserved nucleotides are marked by stars.
Biomolecules 14 01208 g004
Figure 5. Bayesian (BA) phylogeny based on 13 concatenated PCGs, showing the differentiation of S. dorsalis (marked by the star-shaped map of Ghana) from other Selene congeners. The cladistic pattern provides insights into the evolutionary relationships at various taxonomic levels (subfamily and family) within Carangiformes. Posterior probability values at each node reflect statistical support for each branching point. Black stars indicate monotypic species within the family Carangidae. Erroneously named taxa in GenBank are indicated with blue text.
Biomolecules 14 01208 g005
Figure 6. Composite figure of the pruned Bayesian tree and global range distribution illustrating the potential impact of major ocean currents on the diversification of Selene species in both the Eastern and Western Atlantic Oceans. Ocean currents are displayed on a global scale, compiled from the NOAA National Weather Service and the US Army (https://data.amerigeoss.org/dataset/major-ocean-currents-arrowpolys-100m-76 accessed on 15 August 2024). Illustrations of Selene and other carangids were sourced from Wikimedia Commons. The map was generated using ArcGIS version 10.6 and manually edited in Adobe Photoshop CS 8.0.
Biomolecules 14 01208 g006
Table 1. List of annotated mitochondrial genes, including their boundaries, sizes, and intergenic nucleotides (IN) for S. dorsalis.
GenesStartStopSize (bp)StrandINStart CodonStop CodonAnticodon
tRNA-Phe (F)16868+−1..GAA
12S rRNA681022955+−1...
tRNA-Val (V)1022109473+0..TAC
16S rRNA109528091715+−1...
tRNA-Leu (L2)2809288375+0..TAA
ND128843858975+4ATGTAA.
tRNA-Ile (I)3863393371+−2..GAT
tRNA-Gln (Q)3932400372−2..TTG
tRNA-Met (M)4002407271+0..CAT
ND2407351171045+−1ATGT--.
tRNA-Trp (W)5117518872+0..TCA
tRNA-Ala (A)51895258700..TGC
tRNA-Asn (N)525953327437..GTT
tRNA-Cys (C)5370543768−1..GCA
tRNA-Tyr (Y)54375507711..GTA
COI550970591551+−1GTGTAA.
tRNA-Ser (S2)70597130722..TGA
tRNA-Asp (D)7133720371+7..GTC
COII72117901691+−1ATGT--.
tRNA-Lys (K)7901797676+1..TTT
ATP879788145168+−10ATGTAA.
ATP681368818683+0ATGTA-.
COIII88199603785+−1ATGTAA.
tRNA-Gly (G)9603967371+0..TCC
ND3967410,022349+−1ATGT--.
tRNA-Arg (R)10,02210,09170+1..TCG
ND4L10,09310,389297+−7ATGTAA.
ND410,38311,7631381+−1ATGT--.
tRNA-His (H)11,76311,83573+−1..GTG
tRNA-Ser (S1)11,83511,90369+5..GCT
tRNA-Leu (L1)11,90911,98274+0..TAG
ND511,98313,8211839+−4ATGTAA.
ND613,81814,339522−1...
tRNA-Glu (E)14,33914,408703..TTC
CYTB14,41215,5521141+−1ATGTAA.
tRNA-Thr (T)15,55215,62473+−2..TGT
tRNA-Pro (P)15,62315,694720..TGG
Control region15,69516,541847+....
Table 2. Nucleotide composition of mitochondrial genomes across different Selene species.
Species NameSize (bp)A%T%G%C%A + T%AT-SkewGC-Skew
Complete mitogenome
S. dorsalis16,54127.4825.6616.6930.1853.130.034−0.288
S. vomer16,55827.7925.5616.2030.4453.350.042−0.305
PCGs
S. dorsalis11,42725.8326.6315.2932.2552.46−0.015−0.357
S. vomer11,42826.2926.3314.7732.6152.62−0.001−0.377
S. setapinnis11,42725.1127.0416.1231.7352.15−0.037−0.326
tRNAs
S. dorsalis157630.6524.3719.9225.0655.010.114−0.114
S. vomer155630.5924.2320.1825.0054.820.116−0.107
S. setapinnis141527.6327.5623.8920.9255.190.0010.066
rRNAs
S. dorsalis267031.16121.1221.3126.4052.280.192−0.107
S. vomer266931.28521.0621.0626.6052.340.195−0.116
CRs
S. dorsalis84732.5930.2214.6422.5562.810.038−0.213
S. vomer86232.6032.0212.9922.3964.620.009−0.266
S. setapinnis71834.6830.5014.3520.4765.180.064−0.176
Disclaimer/Publisher’s Note: The statements, opinions and data contained in all publications are solely those of the individual author(s) and contributor(s) and not of MDPI and/or the editor(s). MDPI and/or the editor(s) disclaim responsibility for any injury to people or property resulting from any ideas, methods, instructions or products referred to in the content.

