Article

Interaction Between Nitric Oxide and Silicon on Leghaemoglobin and S-Nitrosothiol Levels in Soybean Nodules

by
Da-Sol Lee
,
Ashim Kumar Das
,
Nusrat Jahan Methela
and
Byung-Wook Yun
*
Department of Applied Biosciences, College of Agriculture and Life Sciences, Kyungpook National University, Daegu 41566, Republic of Korea
*
Author to whom correspondence should be addressed.
These authors contributed equally to this work.
Biomolecules 2024, 14(11), 1417; https://doi.org/10.3390/biom14111417
Submission received: 3 September 2024 / Revised: 6 November 2024 / Accepted: 6 November 2024 / Published: 7 November 2024
(This article belongs to the Special Issue Nitrogen Signaling, Transport, and Function in Plants)

Abstract

:
Nitrogen fixation in legume nodules is crucial for plant growth and development. Therefore, this study aims to investigate the effects of nitric oxide [S-nitrosoglutathione (GSNO)] and silicon [sodium metasilicate (Si)], both individually and in combination, on soybean growth, nodule formation, leghaemoglobin (Lb) synthesis, and potential post-translational modifications. At the V1 stage, soybean plants were treated for 2 weeks with 150 µM GSNO, and Si at concentrations of 1 mM, 2 mM, and 4 mM. The results showed that NO and Si enhance the nodulation process by increasing phenylalanine ammonia-lyase activity and Nod factors (NIP2-1), attracting rhizobia and accelerating nodule formation. This leads to a greater number and larger diameter of nodules. Individually, NO and Si support the synthesis of Lb and leghaemoglobin protein (Lba) expression, ferric leghaemoglobin reductases (FLbRs), and S-nitrosoglutathione reductase (GSNOR). However, when used in combination, NO and Si inhibit these processes, leading to elevated levels of S-nitrosothiols in the roots and nodules. This combined inhibition may potentially induce post-translational modifications in FLbRs, pivotal for the reduction of Lb3+ to Lb2+. These findings underscore the critical role of NO and Si in the nodulation process and provide insight into their combined effects on this essential plant function.

1. Introduction

Sustainable agricultural practices prioritise maintaining soil health, encompassing its physical, chemical, and biological properties to enhance nutrient uptake from roots to shoots [1,2,3]. However, despite the abundance of nutrients in the soil, many remain inaccessible to plants. For example, atmospheric dinitrogen (N2), which constitutes 78% (vol/vol) of the air in aerobic soil, is not readily available to plants [4]. The entire developmental process of plants, including protein biosynthesis, nucleic acids, chlorophyll, and certain vitamins [5], depends on nitrogen (N). Since soil often contains insufficient levels of N, plants have developed a complex mutualistic relationship with soil microbes [3,4,6]. Legumes, in particular, are renowned for their symbiotic relationship with microbes that form nodules, a process originally termed biological nitrogen fixation or symbiotic nitrogen fixation (BNF/SNF) [7,8].
Leguminous plants are classified into two main nodule types: indeterminate (elongated and found in species such as Pisum sativum, Medicago sativa, Trifolium repens, and Vicia faba) and determinate (spherical and occur in Glycine max, Phaseolus vulgaris, and Vigna radiata) [9,10]. The nodule is the site where nitrogenase catalyses the conversion of dinitrogen (N2) into two molecules of ammonia (NH3), which plants can absorb. However, nitrogenase is highly sensitive to oxygen (O2), which can irreversibly damage and inhibit its activity [7,11]. To regulate O2 levels, nodules contain ~40% leghaemoglobins (Lbs), which are proteins with a heme group capable of rapidly binding O2 and releasing it slowly. This mechanism helps to maintain free O2 concentrations of approximately 10 nM within the nodules, essential for bacterial survival, and supports efficient N fixation [11]. Fuchsman and Appleby [12] identified four primary types of Lbs in soybean nodules: Lba, Lbc1, Lbc2, and Lbc3, along with four minor variants—Lbb, Lbd1, Lbd2, and Lbd3—that are produced through N-terminal acetylation. As nodules mature, the ratio of Lba to Lbc3 increases significantly. This shift suggests that Lba plays a crucial role in regulating O2 levels during the later stages of nodule development.
In contrast, understanding the complex interaction between Lbs and nitric oxide (NO), a small free radical molecule that regulates numerous plant cellular processes [13], is crucial within the nodule owing to their multifaceted roles. NO reacts rapidly with ferrous leghaemoglobin (Lb2+) to form nitrosyl-leghaemoglobin (Lb2+NO) [14]. This reaction typically occurs with the reduced form of ferric leghaemoglobin (Lb3+), facilitated by ferric leghaemoglobin reductase (FLbR) [15,16]. Moreover, the mechanism by which Lb2+ binds to O2 to regulate bacterial respiration is well-documented [17]. However, the inactivity of Lb2+NO in binding O2 remains unclear [10]. NO is known to inhibit nitrogenase activity [18,19,20], but its low levels can help balance nodule functions [21,22]. Additionally, NO is modulated through S-nitrosylation, a redox-based post-translational modification involving the addition of a NO moiety to a reactive cysteine thiol [23]. Maiti, et al. [24] confirmed S-nitrosylation in Arachis hypogaea nodule extracts, while approximately 80 S-nitrosylated proteins were identified in Medicago truncatulaSinorhizobium meliloti mature nodules [25], although their functions have seldom been explored. Additionally, NO plays a role in various stages of the legume-rhizobia communication, including recognition, infection, nodule development, and nodule senescence [7,26,27,28].
Similarly, silicon (Si) is recognised as a conducive element for plant growth and development when supplied in the form of monosilicic acid [Si(OH)4] [29,30]. While some studies have demonstrated the effects of Si application on root nodulation [31,32,33,34], determining the optimal Si concentration for nodule formation and function remains challenging. However, transcriptomic analysis revealed that Si is involved in isoflavonoid synthesis, which promotes increased nodule formation [35]. Moreover, a recent preprint by Coquerel, et al. [36] demonstrates that Si application results in the accumulation of 989 and 212 differentially expressed proteins in the nodules of Trifolium incarnatum and its symbiotic bacteria (Rhizobium leguminosarum bv trifolii), respectively. These proteins are primarily involved in the synthesis of organic nitrogen compounds, amides, and peptides, which may explain the significant increase in N content in the nodules owing to Si application. Si influences Lb production in two pigeonpea cultivars [37]. However, the mechanism by which Si affects Lb synthesis remains unexplored.
These highlight the significant effect of NO and Si on the root nodulation process, though several questions remain unanswered. Therefore, this study aims to investigate the complex mechanisms of Lb synthesis and assess the effects of S-nitrosothiols (SNO) through the application of GSNO and Si in soybean plants. Additionally, the effects of GSNO and Si on soybean growth, chlorophyll content, phenylalanine ammonia-lyase (PAL) activity, and gene expression were investigated to explore the potential interactions between these molecules during the soybean root nodulation process. This study is the first to thoroughly demonstrate the role of NO and Si donors in the interaction between Lb production and SNO in soybean nodules.

2. Materials and Methods

2.1. Plant Materials, Growth Conditions, and Experimental Design

Pungsannamul, an elite soybean cultivar yielding 3–4 ton ha−1, was used in this study. The seeds, obtained from the Soybean Genetic Resource Center, Kyungpook National University, Daegu, Republic of Korea, were first surface-sterilised with 70% ethanol and washed five times with autoclaved distilled water (dH2O). Subsequently, the seeds (one seed/pipe) were sown in PVC pipes (diameter 7.5 cm × height 40 cm). The pipes were filled with 1.8 kg of sandy soil, and no additional fertiliser was applied. The study was conducted in the greenhouse at Kyungpook National University, where a 16-h light and 8-h dark photoperiod cycle was maintained while the temperature was kept at 28 ± 2 °C. The experimental design followed a complete randomised design conducted in triplicates.
At the V1 stage, soybean seedlings were divided into eight clusters: (i) control (water only), (ii) 150 µM GSNO [GSNO], (iii) 1 mM silicon [1Si], (iv) 2 mM silicon [2Si], (v) 4 mM silicon [4Si], (vi) 150 µM GSNO + 1 mM silicon [GSNO + 1Si], (vii) 150 µM GSNO + 2 mM silicon [GSNO + 2Si], and (viii) 150 µM GSNO + 4 mM silicon [GSNO + 4Si]. GSNO, a nitric oxide donor, was prepared by dissolving sodium nitrite (NaNO2; Sigma-Aldrich (St. Louis, MO, USA), CAS Number:7632-00-0) in dH2O to an equimolar concentration with reduced glutathione (GSH; Wako Special Grade, CAS Number: 70-18-8), which was dissolved in 1N hydrochloric acid (HCl). Additionally, sodium metasilicate (Na2SiO3; Sigma-Aldrich, CAS Number: 6834-92-0) was used as a silicon donor. The concentrations for both GSNO and Si were selected based on previous reports that demonstrated their optimal effects on plants [38,39,40,41]. Treatments were administered by applying 200 mL of dH2O, GSNO, Si, or their combinations through irrigation for 14 days (once daily) to the clusters mentioned above. On the day following the treatment period, shoots and roots were separated by cluster to assess seedling growth and nodule-related attributes. Furthermore, shoots, roots, and nodules were wrapped in aluminium foil, individually placed into liquid nitrogen, and stored in a −80 °C freezer for further analysis.

2.2. Chlorophyll Content Measurement

The methodology described by Hiscox and Israelstam [42] was used to determine the total chlorophyll content. For chlorophyll extraction, 100 mg of fresh soybean leaves were submerged in 20 mL of dimethyl sulphoxide (DMSO) and incubated at 60 °C for 4 h. After incubation, the samples were cooled to a temperature of 25 °C and transferred to a 96-well plate for absorbance measurement at 663 and 645 nm using a UV spectrophotometer (Thermo Scientific™ Multiskan™ GO Microplate Spectrophotometer, Ratastie, Finland). The total chlorophyll content was calculated in mg per gram of fresh weight using the following formula:
Total Chlorophyll = [(20.2 × Absorbance at 645) + (8.02 × Absorbance at 663)] × extract volume/weight in grams × 1000.

2.3. Estimation of Phenylalanine Ammonia-Lyase Activity

Phenylalanine ammonia-lyase (PAL) activity was assessed following the method described by Fan, et al. [43]. Briefly, 1 g of fresh soybean leaves was homogenised in an extraction buffer comprising 6.5 mL of Tris-HCl buffer (50 mM, pH 8.8) and 15 mM β-mercaptoethanol. Subsequently, the homogenate was centrifuged at 4000 rpm for 1 h, and the resulting supernatant was collected for the enzymatic assay. For the assay, a mixture containing 1 mL of the extraction buffer, 0.4 mL of dH2O, 0.5 mL of 10 mM L-phenylalanine, and 0.1 mL of the supernatant from each treatment was incubated at 37 °C for 1 h. The reaction was terminated by adding 0.5 mL of ethyl acetate, followed by centrifugation. The resulting precipitate was dissolved in 3 mL of 0.05 M NaOH, and the absorbance was measured at 290 nm using cinnamic acid standards. PAL activity was expressed as units per gram of protein.

2.4. Determination of Leghaemoglobin Content

Lb content was measured using the cyanmethemoglobin method described by Wilson and Reisenauer [44]. Briefly, roots and nodules were ground in liquid N. Subsequently, 100 mg of the pulverised material was homogenised in 0.6 mL of Drabkin’s solution (prepared by dissolving 52 mg KCN, 198 mg K4Fe(CN)6, and 1 g NaHCO3 in 1 L of dH2O). The homogenate was centrifuged at 10,000 rpm for 15 min at 4 °C. The supernatant was collected in a 2 mL e-tube, while the solid residue was re-homogenised with Drabkin’s solution and subjected to a second centrifugation. The supernatants from both centrifugations were combined, adjusted to a total volume of 2 mL with Drabkin’s solution, and centrifuged for an additional 30 min at 14,000 rpm at 4 °C. Subsequently, the clarified supernatant was used to measure absorbance at 540 nm against Drabkin’s solution in a 96-well plate using a UV spectrophotometer (Thermo Scientific™ Multiskan™ GO Microplate Spectrophotometer, Ratastie, Finland). A reference curve was generated using haemoglobin and five dilutions of bovine haemoglobin in the absence of sample extract. Results were expressed as milligrams of Lb per gram of fresh roots and nodules.

2.5. Measurement of S-Nitrosothiol

SNO concentrations were measured using a Sievers NOA-280i Nitric Oxide Analyser (Estero, FL, USA), following the method described by Yun, et al. [45]. First, 200 mg of fresh soybean shoots, roots and nodules were separately ground in liquid N and homogenised with 1X PBS buffer (pH~7.4). Subsequently, the samples were centrifuged at 14,000 rpm for 10 min at 4 °C, and the resulting supernatant was transferred to a new e-tube. The protein concentration of each sample was determined using the Bradford assay with a Coomassie (Bradford) protein assay kit (Thermo Fisher Scientific, Waltham, MA, USA), following the instructions of the manufacturer. Briefly, 1.5 mL of Coomassie dye reagent was added to 30 μL of the extracted protein in a 96-well plate and mixed thoroughly by pipetting. The absorbance of the samples was measured at 595 nm using a UV spectrophotometer (Thermo Scientific™ Multiskan™ GO Microplate Spectrophotometer, Ratastie, Finland). Subsequently, 100 μL of the extracted proteins were injected into the reaction vessel of the Nitric Oxide Analyser, which contained a CuCl/cysteine reducing agent, and the peak values were recorded. A CysNO-mediated standard curve was used to determine the SNO content. Finally, the SNO level was estimated as nM μg−1 of protein. Additionally, we employed GPS-SNO 1.0 software to predict and identify cysteine residues that may undergo NO-based modification through S-nitrosylation [46].

2.6. Relative Gene Expression Analysis

Quantitative real-time PCR (qRT-PCR) was conducted to examine the gene expression of S-nitrosoglutathione reductase 1 (GSNOR1), putative Si transporter (NIP2-1), also known as NOD26-like intrinsic protein 4-1, leghaemoglobin protein (Lba), and leghaemoglobin reductase genes (FLbR-1 and FLbR-2). Samples were ground in liquid N, and RNA was extracted using the Biofact™ Total RNA Prep Kit. cDNA synthesis was performed using the Solg™ RT-kit according to the instructions of the manufacturer. Subsequently, the synthesised cDNA was used as a template to evaluate relative gene expression using the Real-Time PCR system (CFX Duet, Bio-RAD, Hercules, CA, USA) with the Solg™ 2× Multiplex Real-Time PCR Smart mix, which includes SYBR Green. Gene expression assays were conducted in triplicate. Table S1 shows the primer sequences.

2.7. Statistical Analysis

Data were collected and analysed by calculating the means and standard deviations using a one-way analysis of variance (ANOVA) with a 5% significance level. Means indicating significant differences were separated using the Tukey’s HSD test with Statistix 10 (https://www.statistix.com/, accessed on 6 November 2024). Boxplots and bar graphs were generated with the ‘ggplot2’, ‘tidyverse’, ‘hrbrthemes’, and ‘viridis’ packages in RStudio [47,48]. Significant differences between means were indicated with letters. All experiments were conducted in triplicate.

3. Results

3.1. Effects of S-Nitrosoglutathione and Silicon Supplementation on Chlorophyll Content and Phenylalanine Ammonia-Lyase Activity

The application of GSNO and Si, individually or in combination, did not significantly alter the chlorophyll content in soybean plants. However, the chlorophyll content was consistently higher when GSNO and Si were applied separately (Figure 1A). Furthermore, the activity of the enzyme PAL, crucial for flavonoid synthesis, was evaluated in response to GSNO and Si supplementation. The results showed that GSNO and Si, whether applied individually or in combination, generally increased PAL activity in the roots, (except in the 2Si treatment) (Figure 1C). In the shoot, PAL activity only increased with GSNO application, while Si application decreased it compared to that of the Control (Figure 1B). Nevertheless, the concurrent application of GSNO and Si enhanced PAL activity in the shoot (by 40.97%, 29.13%, and 18.42%) and root (by 6.87%, 25.40%, and 17.33%) compared to treatments with 1Si, 2Si, and 4Si, respectively (Figure 1B,C).

3.2. Application of S-Nitrosoglutathione and Silicon Regulates Soybean Nodulation

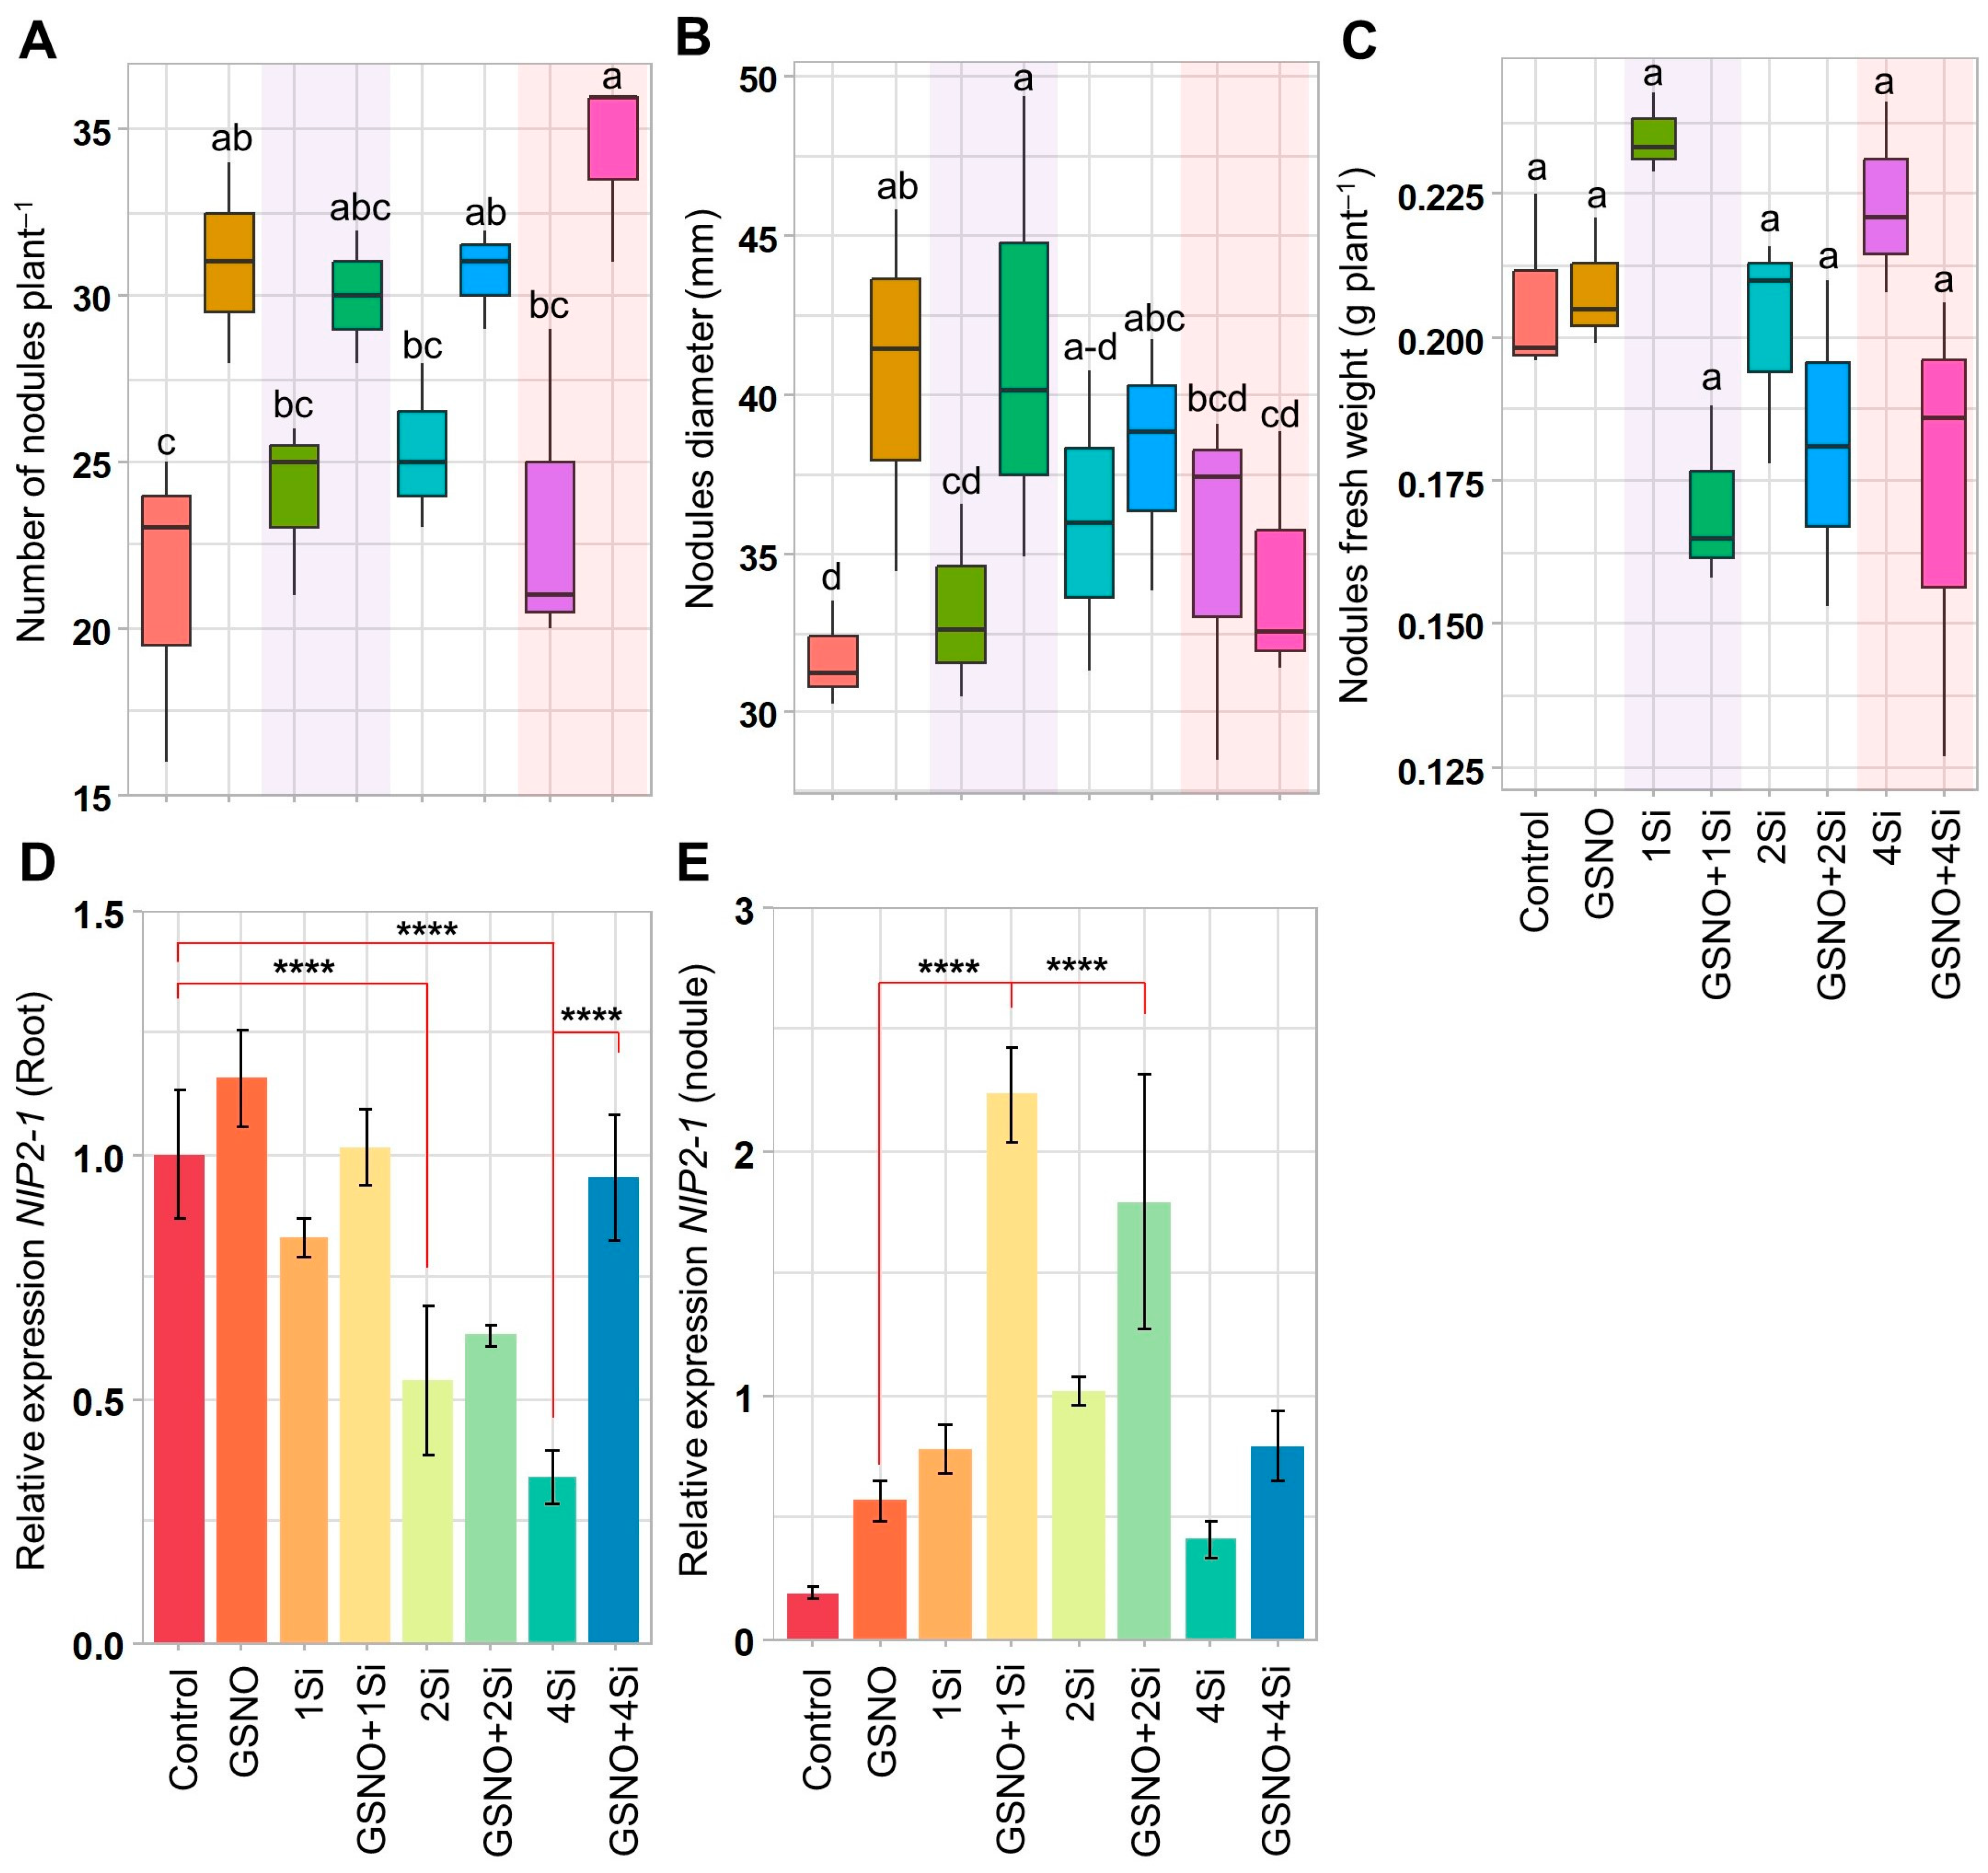
Soybean plants treated with GSNO and Si, individually or in combination, for 2 weeks exhibited the following increases in the number and diameter of nodules compared to that of the Control: GSNO (45.31% and 28.00%), 1Si (12.50% and 4.81%), 2Si (18.75% and 13.59%), 4Si (9.38% and 10.44%), GSNO+1Si (40.63% and 30.86%), GSNO+2Si (43.75% and 20.24%), and GSNO+4Si (60.94% and 8.10%, respectively) (Figure 2A,B). Conversely, the total nodule fresh weight was reduced in soybean plants treated with the combined application of GSNO and Si compared to that of the Control plants; however, results remained comparable all the treatments (Figure 2C).
To assess the effect of GSNO and Si on the Nod factor, which specifically regulates root nodulation, the relative expression of the NOD26-like intrinsic protein 2-1/silicon transporter gene (NIP2-1) was measured in the roots and nodules. In the roots, Si treatment resulted in a significant reduction in NIP2-1 expression, with decreases of 16.98%, 46.13%, and 65.88% observed at increasing Si levels (1Si, 2Si, and 4Si, respectively) compared to that of the Control plants (Figure 2D). While GSNO alone increased NIP2-1 expression in roots compared to the Control, the combination of GSNO with Si resulted in reduced expression levels by 12.31%, 45.44%, and 17.68% in the GSNO+1Si, GSNO+2Si, and GSNO+4Si treatments, respectively, compared to that of GSNO alone. However, GSNO and Si, whether applied individually or in combination, significantly upregulated NIP2-1 expression in the nodules (Figure 2E). The treatments GSNO+1Si, GSNO+2Si, and GSNO+4Si exhibited 1086.00%, 852.60%, and 321.28% higher NIP2-1 expression in the nodules compared to that of the Control, while a decreasing trend was observed, as NIP2-1 expression in GSNO+2Si and GSNO+4Si was 19.68% and 64.48% lower, respectively, than in GSNO+1Si (Figure 2E). These findings indicate that NIP2-1 expression modulation is influenced by GSNO and Si levels and is tissue-specific.

3.3. Response of S-Nitrosoglutathione and Silicon to Leghaemoglobin Levels in Soybean Roots and Nodules

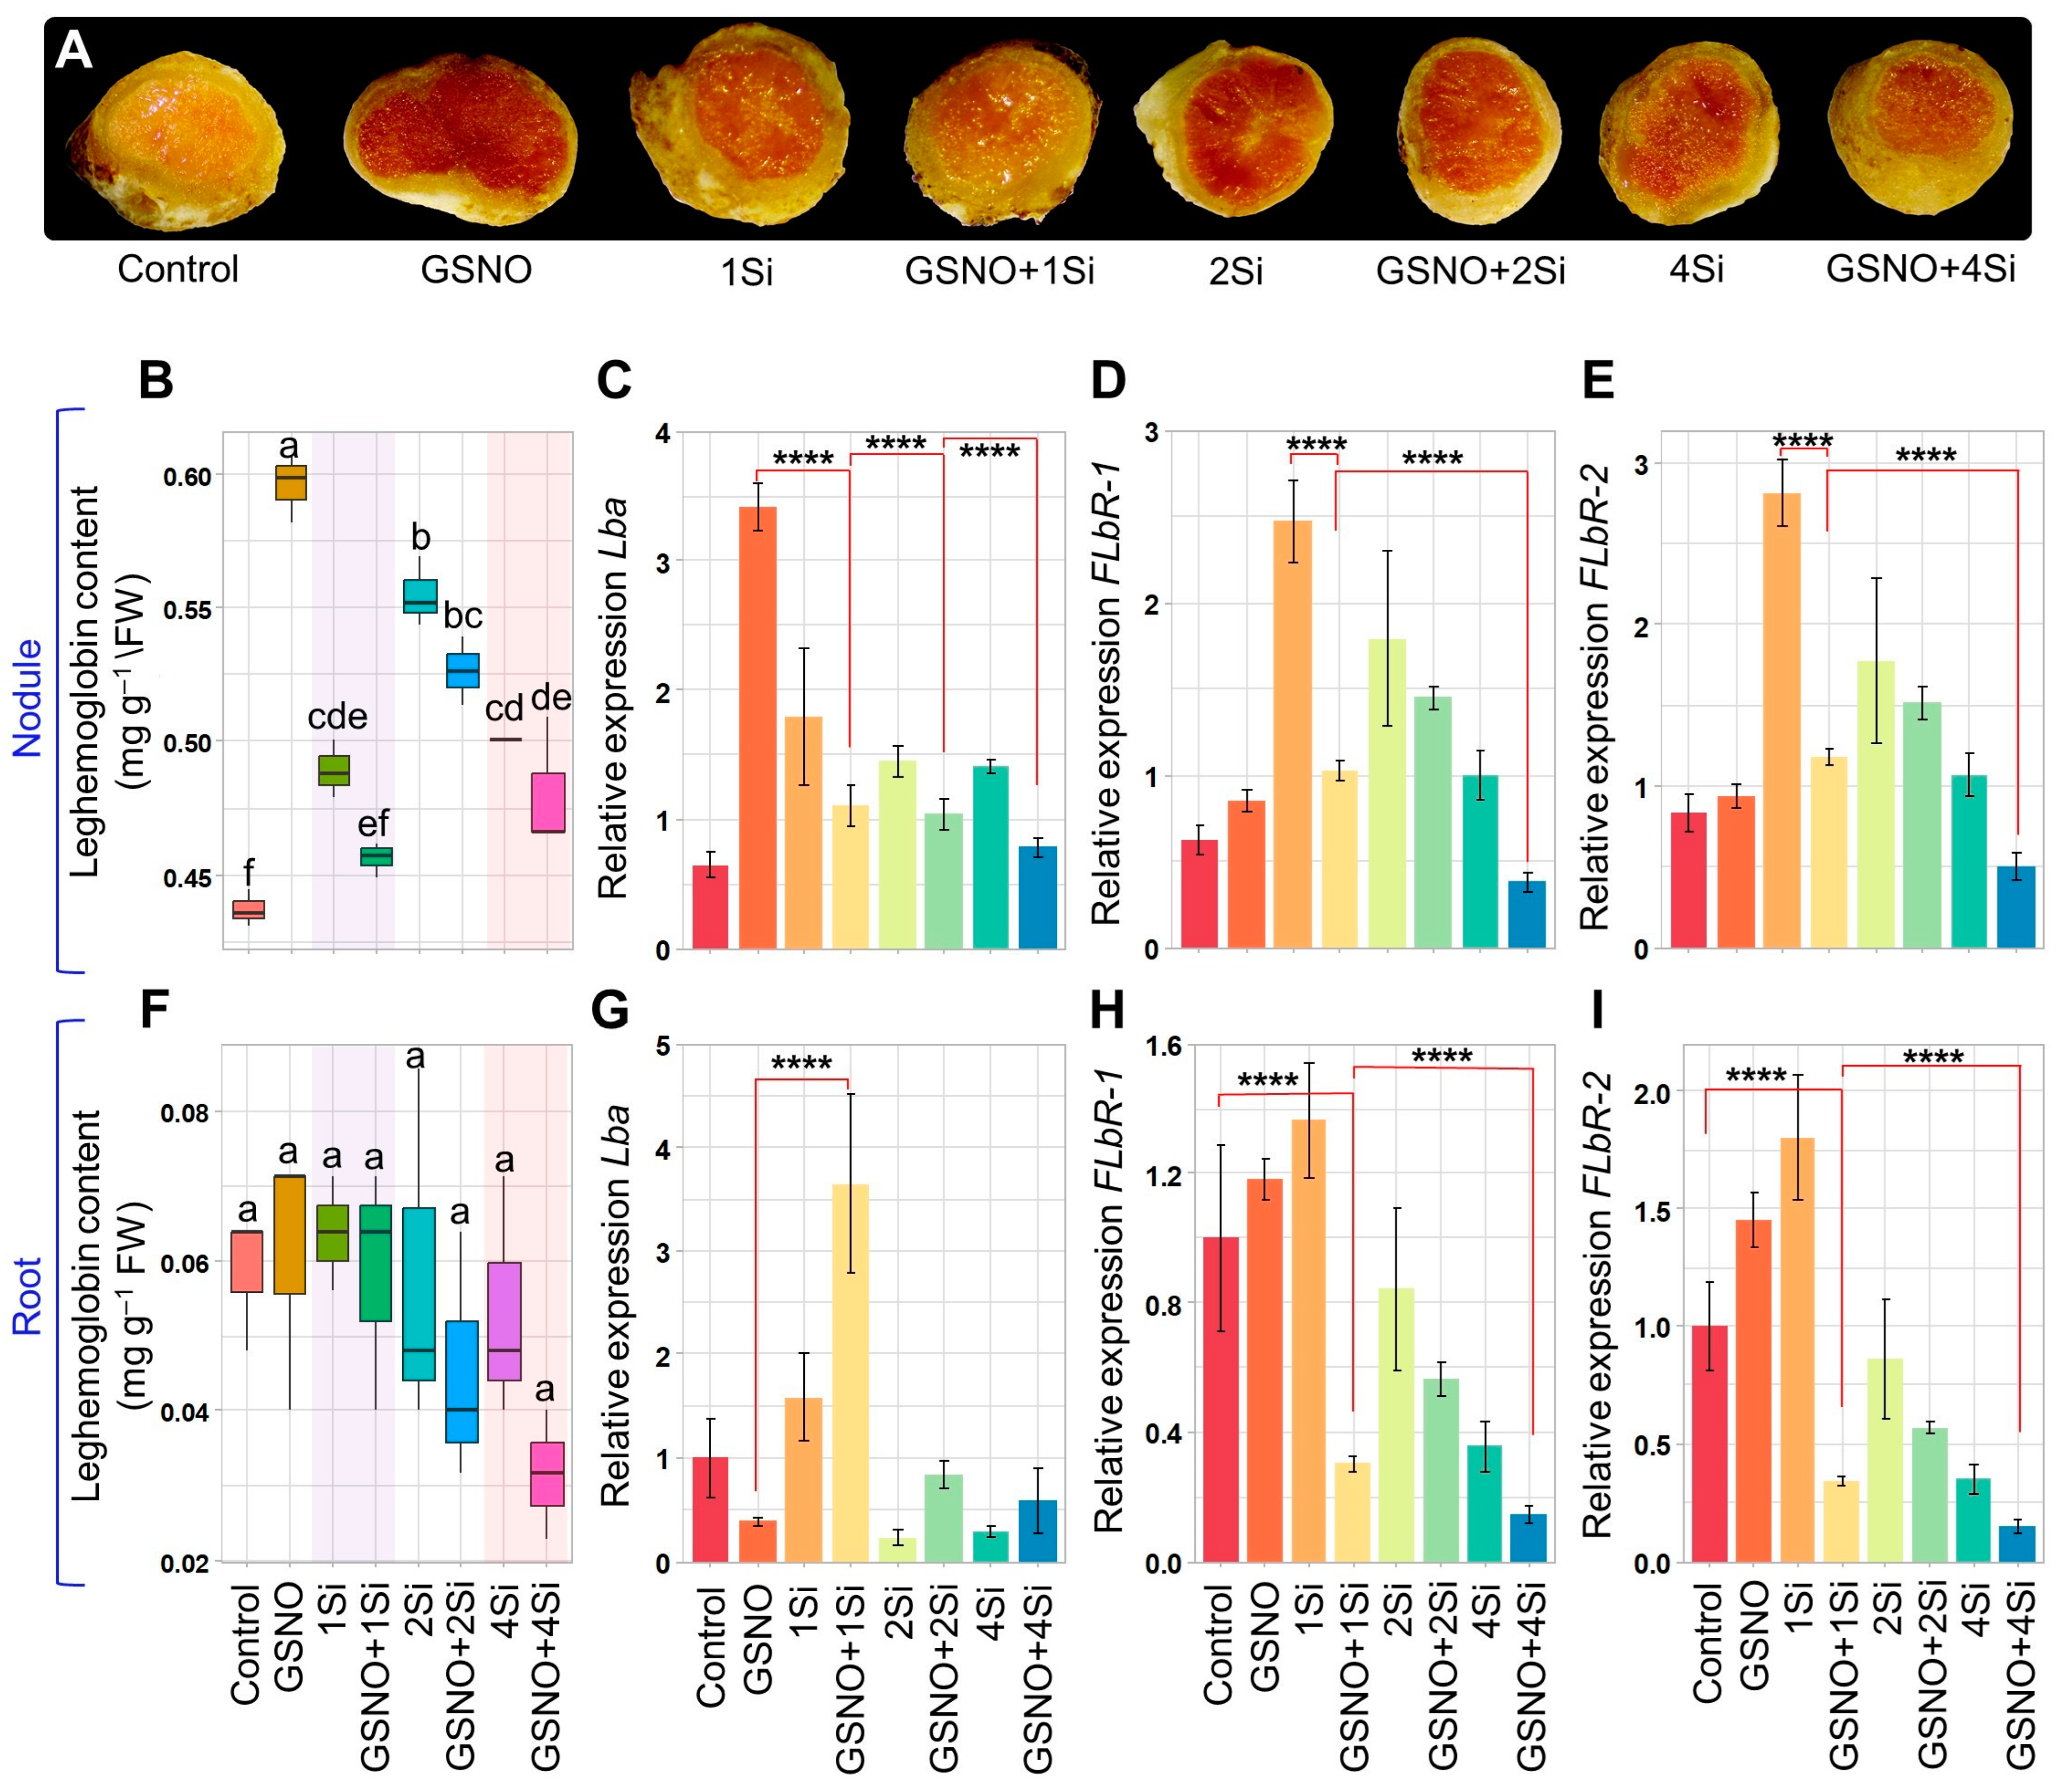
In soybean nodules, treatment with GSNO and Si, individually or in combination, significantly increased Lb levels compared to that of the Control (Figure 3A,B). However, when compared to GSNO alone, the combinations of GSNO and Si reduced Lb content by 23.41%, 11.62%, and 19.30% in the GSNO+1Si, GSNO+2Si, and GSNO+4Si treatments, respectively (Figure 3B). Similar reductions in Lb content were observed when compared to treatments with single Si alone. In roots, GSNO and Si had a minimal effect on Lb content when applied individually, despite higher levels when compared to that of the Control (Figure 3F). Furthermore, the pattern of Lb content reduction in roots with combined GSNO and Si closely mirrored that observed in nodules, compared to treatments with GNSO or Si alone (Figure 3F).
Lba expression in soybean nodules increased significantly with GSNO and Si treatments compared to that of the Control. However, in the GSNO+1Si, GSNO+2Si, and GSNO+4Si treatments, Lba expression decreased by 67.55%, 69.57%, and 77.03%, respectively, compared to that of GSNO alone (Figure 3C). Similar reductions in Lba expression were observed in nodules with single Si treatments and GSNO combinations. In roots, GSNO exhibited a negative regulatory effect on Lba expression, similar to the effects of 2Si and 4Si treatments, while 1Si and GSNO+1Si significantly increased Lba expression by 58.21% and 264.86%, respectively, compared to that of control roots (Figure 3G). Additionally, the combination of GSNO and Si resulted in an increase in Lba expression compared to that of single treatments, contrasting with the nodular Lba expression patterns.
Compared to the Control, the expression of two Lb3+ genes (FLbR-1 and FLbR-2) significantly increased in soybean nodules when treated individually with GSNO or Si or in combination, except for the GSNO+4Si treatment (Figure 3D,E). However, reductions of 58.62%, 19.23%, and 62.07% in FLbR-1 expression and 58.03%, 14.72%, and 52.89% in FLbR-2 expression were observed in the combined treatments of GSNO+1Si, GSNO+2Si, and GSNO+4Si, respectively, compared to the treatments with 1Si, 2Si, and 4Si (Figure 3D,E). Moreover, the expression of FLbR-1 and FLbR-2 in the roots exhibited a similar reduction pattern compared to the roots treated with 1Si, 2Si, and 4Si (Figure 3H,I). However, the application of GSNO and 1Si resulted in increased FLbR-1 expression by 18.09% and 45.03%, respectively, and in FLbR-2 expression by 36.62% and 80.25%, respectively, compared to the roots of the Control plants (Figure 3H,I). Increased Si levels alone led to a significant reduction in the expression of FLbR-1 and FLbR-2 in the roots and nodules.

3.4. Effect of S-Nitrosoglutathione and Silicon on S-Nitrosothiol Levels

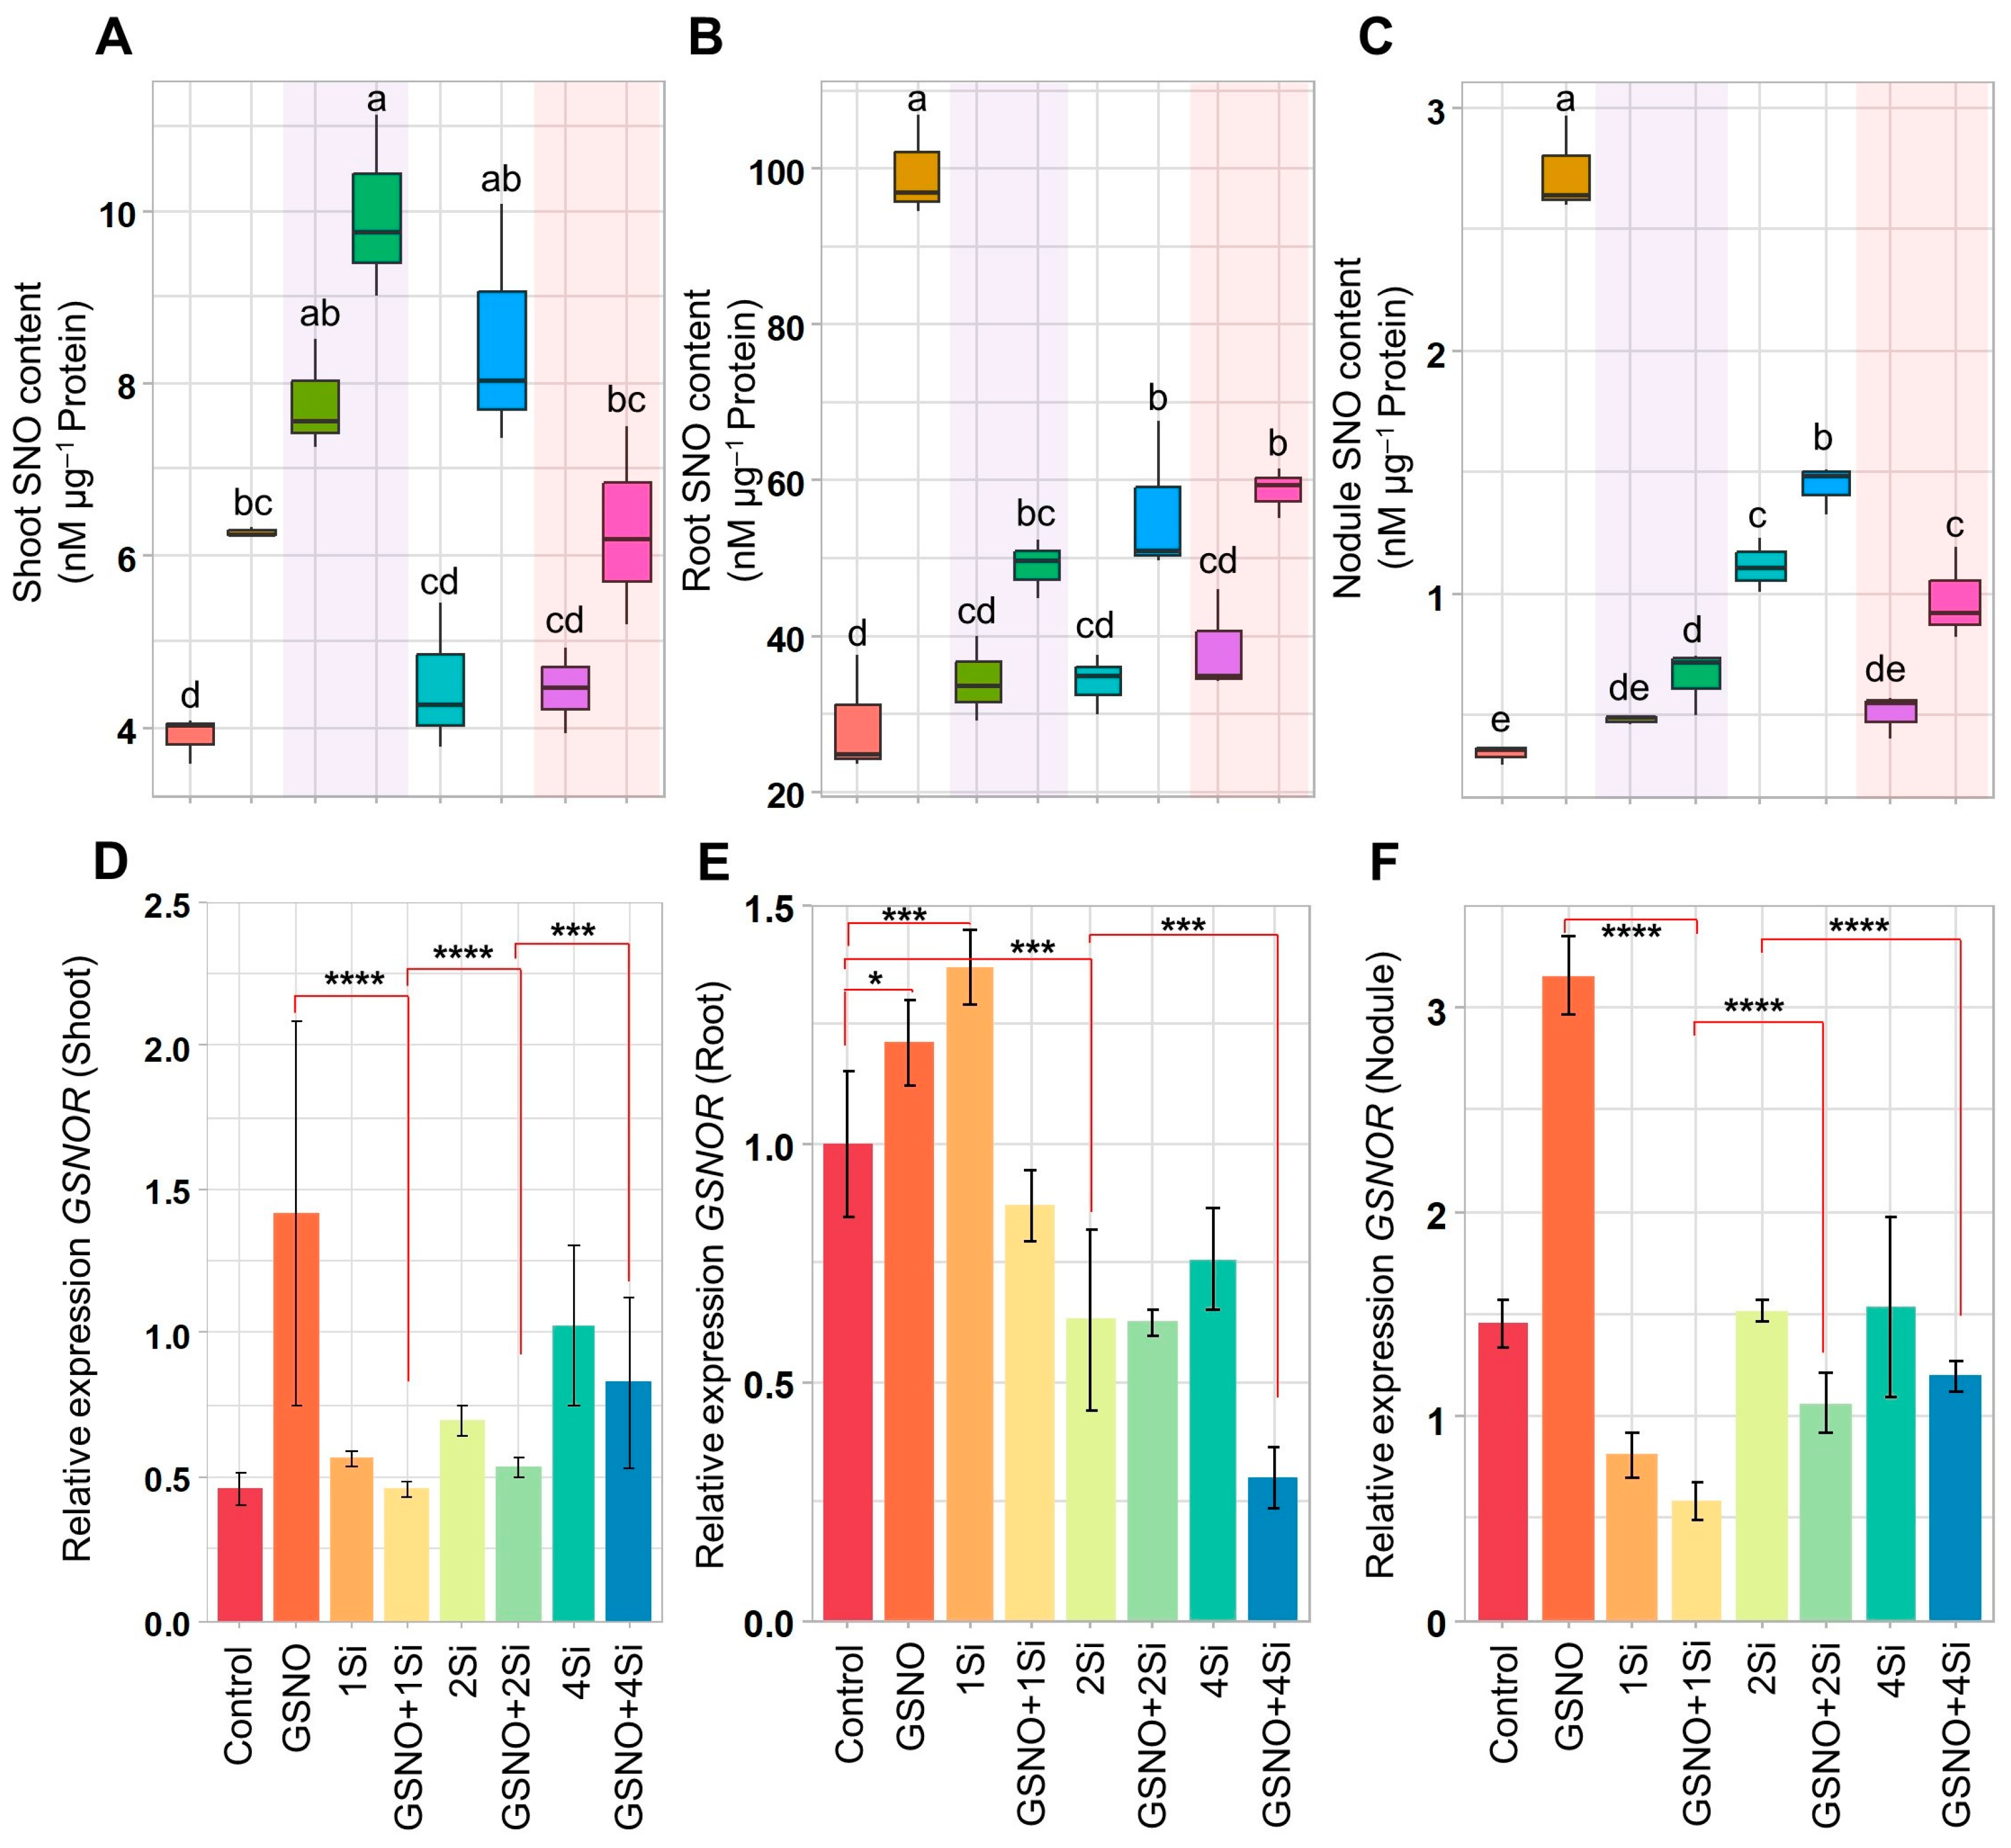
Compared to the Control plants, GSNO significantly increased SNO levels by 246.52% in the root, 711.71% in the nodule, and 61.32% in the shoot (Figure 4A–C). Additionally, while Si treatments (1Si, 1Si, and 4Si) increased SNO levels in the shoot, root, and nodule, these increases were significantly lower than those induced by GSNO alone. Exceptions included the shoot treated with 1Si (exhibiting a 100.00% increase) and the nodule treated with 2Si (exhibiting a 229.50% increase), compared to that of the Control (Figure 4A–C). When the GSNO and Si were combined, a significant increase in SNO levels was observed in the shoot, root, and nodule. Specifically, SNO levels increased in the shoot (by 28.21%, 89.30%, and 41.83%), root (by 42.97%, 64.11%, and 52.75%), and nodule (by 36.27%, 29.64%, and 93.90%), compared to treatments with 1Si, 2Si, and 4Si, respectively (Figure 4C).
In contrast, combining GSNO with Si treatments (GSNO+1Si, GSNO+2Si, and GSNO+4Si) resulted in reductions in the relative expression of GSNOR compared to treatments with 1Si, 2Si, and 4Si. GSNOR expression specifically decreased by 18.81%, 23.14%, and 19.01% in the shoot; by 36.55%, 0.82%, and 60.14% in the root; and by 28.09%, 29.72%, and 22.26% in the nodule, respectively (Figure 4D–F). Compared to the GSNO treatment alone, these reductions were more pronounced, with decreases of 67.58%, 62.28%, and 41.40% in the shoot; 28.18%, 48.35%, and 75.07% in the root; and 81.47%, 66.25%, and 62.18% in the nodule for GSNO+1Si, GSNO+2Si, and GSNO+4Si, respectively (Figure 4D–F).

3.5. Effect of S-Nitrosoglutathione and Silicon on Soybean Shoot and Root Growth

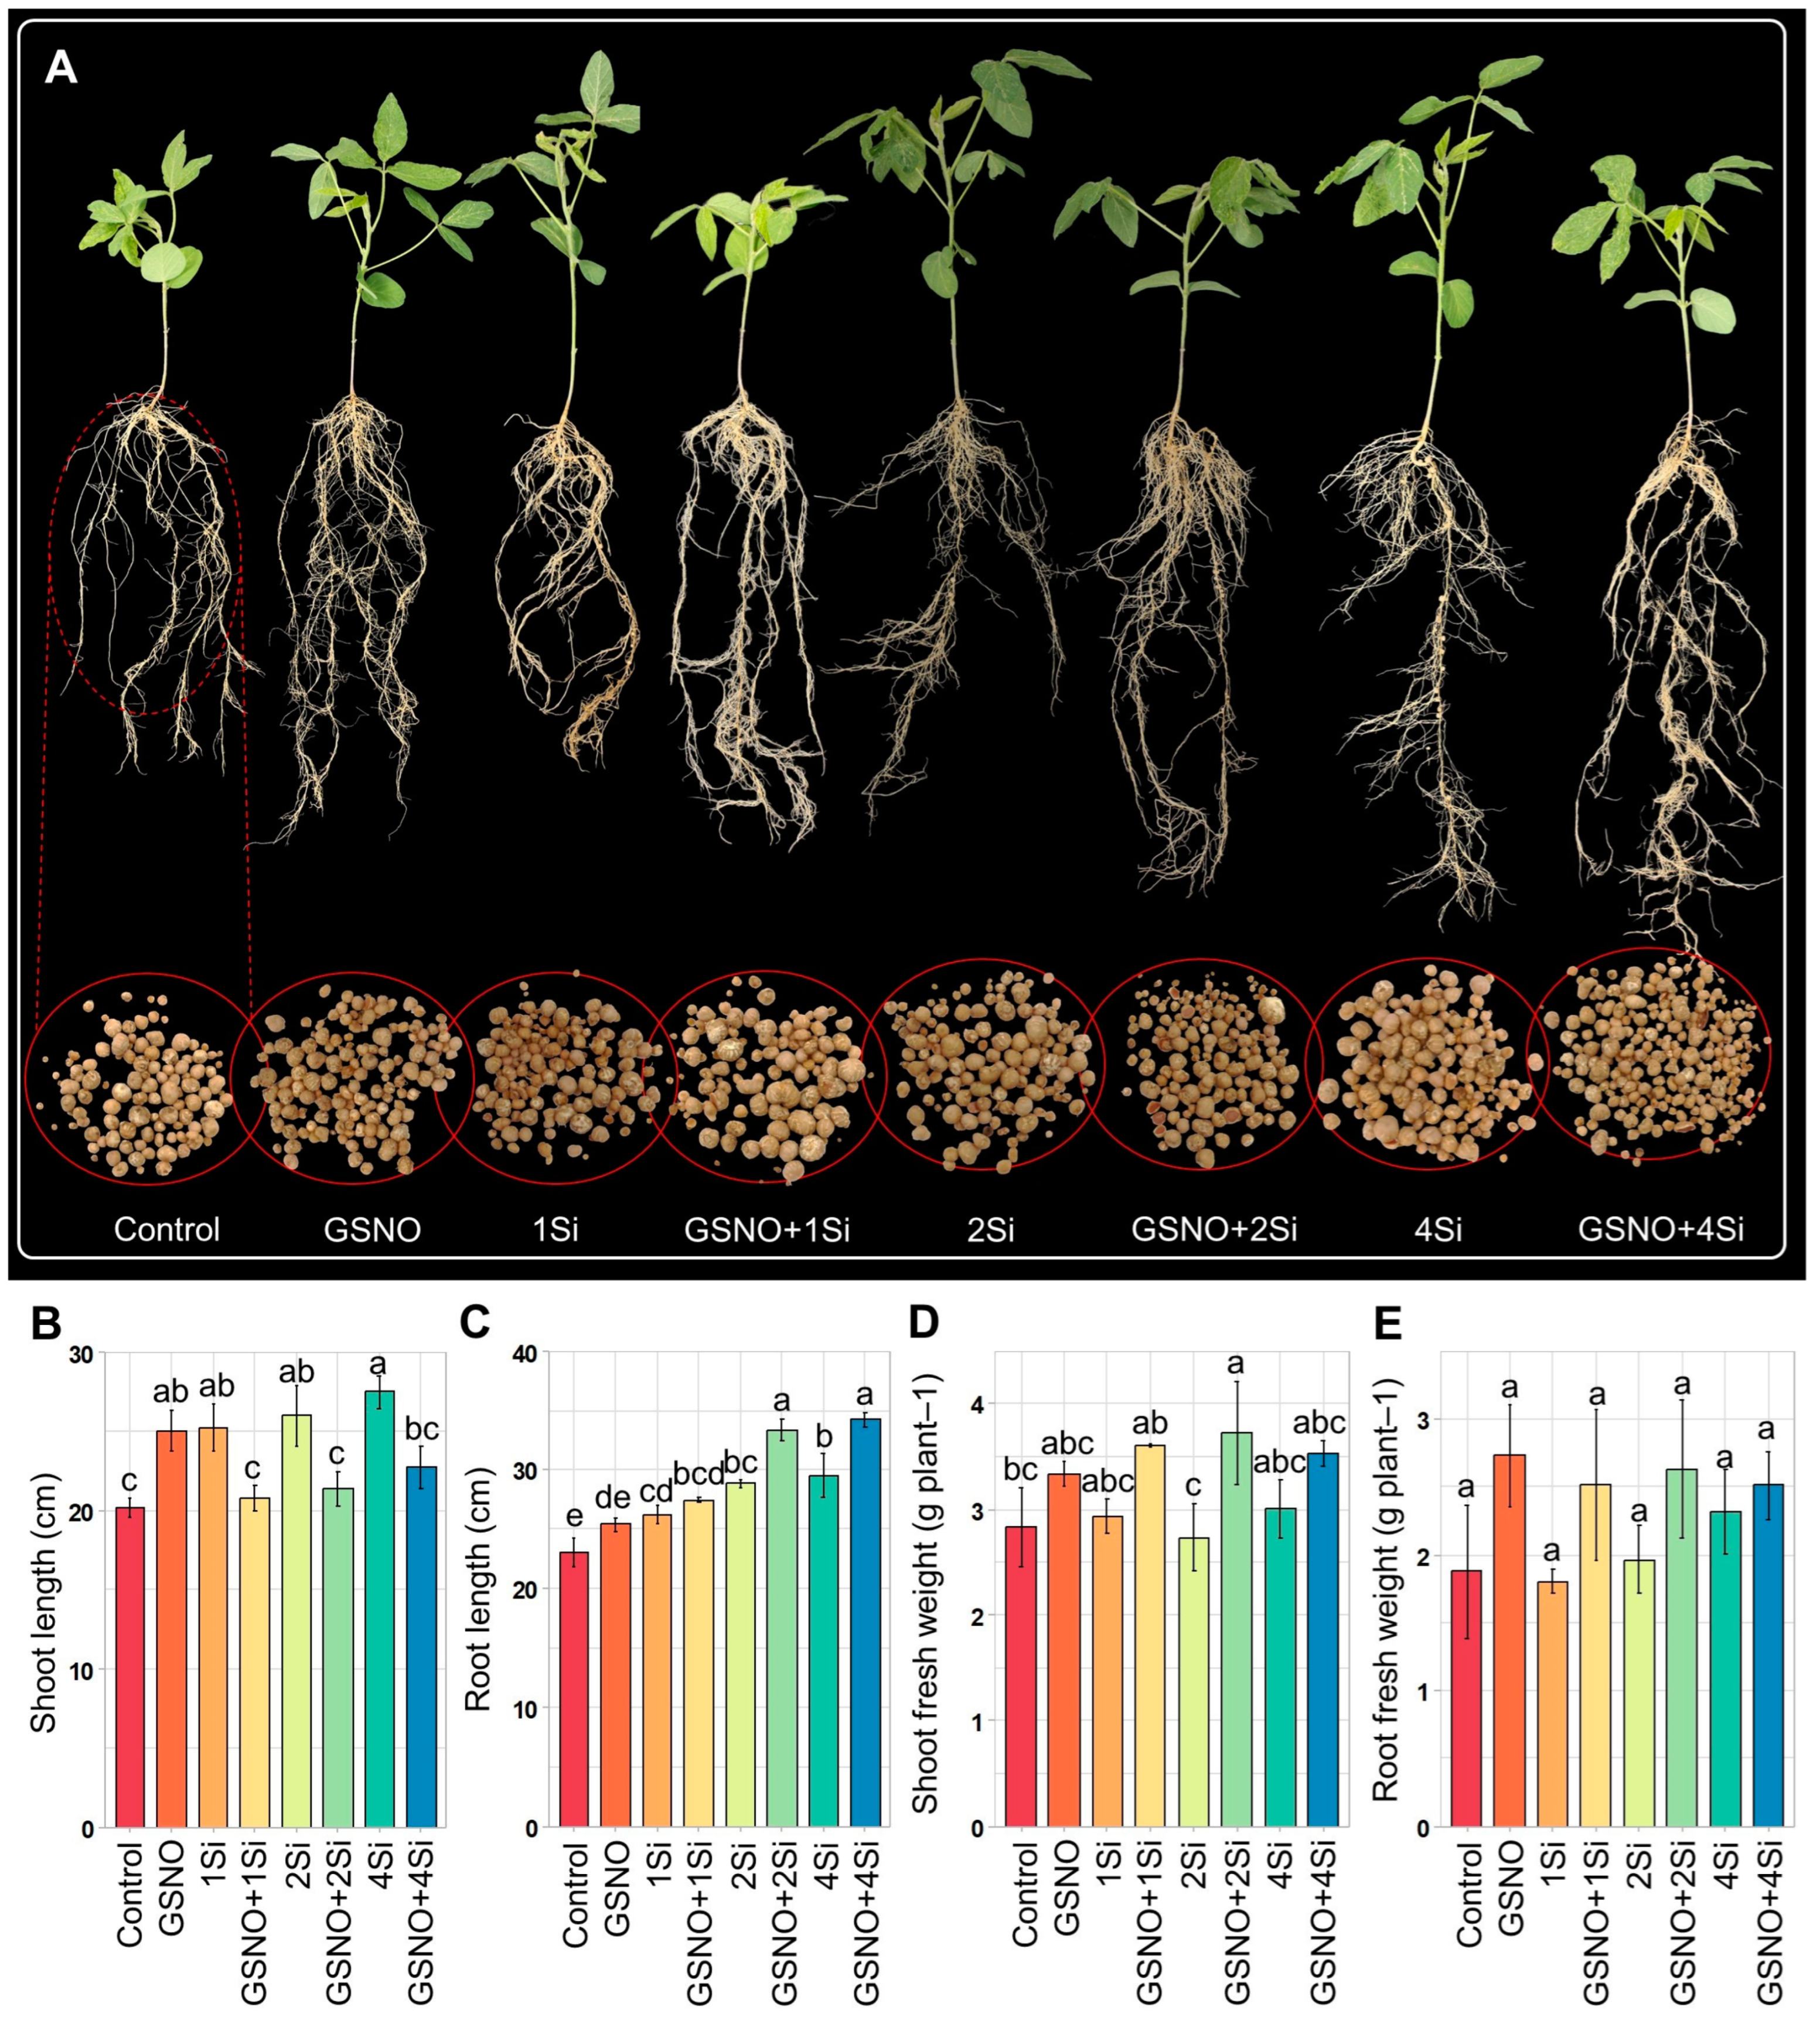
Following a 14-day application of GSNO and Si, shoot length improved when these treatments were applied individually. However, their combined application resulted in the arrest of shoot length (Figure 5A,B). The combined treatments of GSNO+1Si, GSNO+2Si, and GSNO+4Si led to significant improvements in shoot fresh weight, with increases of 27.25%, 31.55%, and 24.71%, respectively, compared to that of GSNO alone. These treatments enhanced shoot fresh weight by 22.58%, 36.12%, and 17.41% compared to 1Si, 2Si, and 4Si, respectively (Figure 5D). A consistent trend was observed in root fresh weight with the application of GSNO and Si (Figure 5E), although they did not respond significantly. In contrast, GSNO and Si, either separately or combined, enhanced root length (Figure 5C).

4. Discussion

Global soybean production exceeded 395.91 million metric tonnes in the 2023/2024 period [49]. Soybean plants demonstrate their capacity to fix N in the soil through nodules, contributing an estimated 70% of the total 35.5 teragrams (Tg) of N fixed globally in 2018 [50]. Nodules, formed through the legume–rhizobia association, are a major source of N production in soybean plants and may be influenced by various external factors. Excessive N application promotes nodule senescence, thereby inhibiting BNF/SNF by decreasing Lb concentration and nitrogenase activity [51]. Additionally, studies show that NO inhibits nitrogenase activity and reacts with Lb3+ to form Lb2+NO, thought inactive in binding O2, thereby disrupting the fixation process. Moreover, Si is recognised for its role in modulating nodule formation. However, many of their (NO and Si) functions remain largely unexplored, limiting our understanding of the mechanisms controlling an effective nodulation system. Due to these reasons, this study focused on the impact of NO and Si on the rhizobia–legume symbiosis and Lb synthesis, which had previously been overlooked.
During the nodulation process, legume roots secrete flavonoid compounds recognised by rhizobia [52]. This recognition stimulates the rhizobia to release lipochitooligosaccharides, known as Nod factors [53], thereby initiating the legume–rhizobium association. Additionally, Nod factors are detected by LysM-type NF receptors (NFRs) in legumes, initiating rhizobial infection and nodule formation [54,55,56]. In this study, PAL activity, known for catalysing the conversion of phenylalanine in flavonoid biosynthesis [57,58], was assessed following a 14-day treatment with GSNO and Si, both individually and in combination. The results indicate that treatment with both elements increased PAL activity in the roots (Figure 1B,C), suggesting that soybean roots secrete more flavonoid compounds to attract rhizobia. Furthermore, the up-regulation of the Nod factor gene NIP2-1 in the roots and nodules, along with the highest total number of nodules and largest nodule diameters, were observed with the addition of GSNO and Si (Figure 2A,B,D,E and Figure 6). Studies show that Si enhances total flavonoid levels in M. truncatula, nodule formation, and root length in legumes [31,34]. In contrast, the application of cPTIO, a NO inhibitor, reduces nodule formation and inhibits lateral root development [59]. Therefore, NO and Si are confirmed to play specific roles in enhancing the nodulation process. However, nodule fresh weight was inhibited when GSNO and Si were applied in combination, whereas individual applications did not produce this effect (Figure 2C). The reduction of nodule fresh weight suggests a different role of NO in BNF/SNF that was also reported previously [60].
The Lb within the nodule underscores its essential role in O2 binding, maintaining the survivability of bacterial symbionts necessary for effective N fixation in legumes. The red pigment found in soybean nodules was first reported by Kubo [61] and had not been previously detected in the roots, stems, or leaves [62]. However, recent studies have identified the presence of VfLb29 in roots and leaves [63], and GmLb5 in flowers [51]. While the individual application of GSNO and Si increased Lb content and Lba gene expression in nodules in this study, their combined application unexpectedly inhibited both (Figure 3A–C). The combination of 150 µM GSNO and 4 mM Si was particularly detrimental to Lb synthesis. This study reports, for the first time, on the detrimental effect of a NO donor when combined with Si. Additionally, previous studies demonstrate that nitrate supply alters the abundance of LbI and LbII [64]. Nitrite application forms LbNO, which is more challenging to dissociate into LbO2, the only form capable of supplying O2 to the symbionts [65]. However, while Lb content in soybean roots remained negligible, similar detrimental effects were observed in the nodules (Figure 3F). The combination of GSNO and Si led to increased Lba expression in the roots. However, despite this increased Lba gene expression, Lb content was reduced, which may be attributed to transcription factors such as GmNAC039 and GmNAC018 inducing early nodule senescence [66]. The overexpression of these factors decreases Lb levels and nitrogenase activity despite increased Lba expression.
The enzymatic reduction of Lb3+ to Lb2+ in legume nodules [67] is mediated by a protein known as FLbR, purified from soybean root nodules [68,69]. This 110 kDa homodimer, containing flavin adenine dinucleotide and utilising NAD(P)H as an electron donor, requires micromolar levels of O2 for the reduction process. The enzyme exhibits Km values of 7 mM for NADH and 9.5 mM for Lb3+, with a Vmax of 499 nmol Lb2+O2 formed per min per mg [69]. Given the critical role of this protein in N fixation, the current findings revealed a novel aspect: while GSNO and Si individually enhanced the expression of FLbR-1 and FLbR-2 genes in soybean roots and nodules, their combined application reduced the expression of the genes (Figure 3D,E,H,I and Figure 6). The ability of Lb to switch between the ferrous and ferric states allows dynamic regulation of O2 levels in the root nodules. This regulation is crucial for protecting the nitrogenase enzyme from O2-induced inactivation while ensuring adequate O2 availability for cellular respiration. However, while a concentration of 150 µM GSNO and 1 mM Si individually enhances the expression of these genes, higher levels of Si proved to be detrimental. Therefore, the complex interaction between NO and Si underscores the intricate mechanisms involved in Lb synthesis and its effect on the overall N fixation process in leguminous plants.
These findings reveal a connection between SNO levels and Lb synthesis. While the combined application of GSNO and Si led to reduced Lb content, Lba expression, and FLbRs gene expression (except for Lba in the roots) (Figure 3A–I), SNO levels exhibited an opposing trend (Figure 4A–C). Increased SNO levels enhance S-nitrosylation, a post-translational modification where NO attaches to cysteine residues in proteins [23,70]. This modification influences protein function, interactions, and stability, and is vital for signal transduction, enzyme regulation, and oxidative stress responses. Three potential S-nitrosylation sites were identified using GPS-SNO 1.0, indicating possible sites of S-nitrosylation (Figures S1–S3). Furthermore, the addition of NO into the antioxidant tripeptide glutathione results in the formation of GSNO, being used as a mobile reservoir of NO activity. An enzyme known as GSNO reductase (GSNOR) specifically targets GSNO and is responsible for its metabolism, thereby regulating cellular levels of SNO [71]. Our findings suggest that the combined application of GSNO and Si reduced GSNOR expression in shoots, roots, and nodules more than the individual application of GSNO or Si (Figure 4D–F). Consequently, the findings suggest that the combination of GSNO and Si may regulate post-translational modifications through S-nitrosylation, leading to the inhibition of Lb synthesis. However, this hypothesis requires further investigation. Supplementation with GSNO and Si enhanced shoot and root fresh weight while reducing shoot length when combined (Figure 5A–E). Despite the shorter shoot length, their fresh weight increased significantly (Figure 5A,B,D), potentially owing to increased stem thickness.

5. Conclusions

In a nutshell, the aforementioned findings suggest that nodule formation was augmented by increasing the PAL activity and expression of Nod factors which is fine-tuned by NO and Si. Both NO and Si individually supported Lb synthesis and related proteins, crucial for nitrogen fixation; however, in combination they inhibited these processes, possibly triggering post-translational modifications in FLbRs suggesting complex interplays between NO and SI. Future research should focus on identifying the specific S-Nitrosylation sites as a post-translational modification. This will provide a deeper understanding of the roles of NO and Si in regulating nodule formation and function. Such studies could reveal the precise molecular interactions and pathways affected by NO and Si, offering insights into the mechanism underlying the contribution of these elements to soybean growth and development through their effect on the nodulation process.

Supplementary Materials

The following supporting information can be downloaded at: https://www.mdpi.com/article/10.3390/biom14111417/s1, Table S1: Primer lists used in the study; Figure S1: Predicted S-Nitrosylation sites in the protein sequence of FLbR-1; Figure S2: Predicted S-Nitrosylation sites in the protein sequence of FLbR-2; Figure S3: Peptide sequence alignment of two FLbR genes.

Author Contributions

D.-S.L.: conceptualization, performing all the experiments, data analysis; A.K.D.: visualization, writing-original draft, writing-review & editing; N.J.M.: data analysis; B.-W.Y.: supervision, writing review & editing, funding acquisition. All authors have read and agreed to the published version of the manuscript.

Funding

This research was supported by the Korea Basic Science Institute (National Research Facilities and Equipment Center) grant funded by the Ministry of Education (2021R1A6C101A416). This research was also supported by Basic Science Research Program through the National Research Foundation of Korea (NRF) funded by the Ministry of Education (RS-2023-00245922).

Institutional Review Board Statement

Not applicable.

Informed Consent Statement

Not applicable.

Data Availability Statement

The data presented in this study are available on request from the corresponding author. The data are not publicly available due to privacy.

Acknowledgments

Quantitative PCR was proceeded at KNU NGS Core Facility (Daegu, Republic of Korea).

Conflicts of Interest

The authors declare no conflicts of interest.

References

  1. Das, A.K.; Rahman, M.A.; Mitra, P.; Sukhwani, V.; Shaw, R.; Mitra, B.K.; Sharma, D.; Deshkar, S.; Morey, B. Up-scaling organic agriculture to enhance food and water security in South Asia. Org. Agric. 2022, 12, 475–494. [Google Scholar] [CrossRef]
  2. Brichi, L.; Fernandes, J.V.; Silva, B.M.; Vizú, J.d.F.; Junior, J.N.; Cherubin, M.R. Organic residues and their impact on soil health, crop production and sustainable agriculture: A review including bibliographic analysis. Soil Use Manag. 2023, 39, 686–706. [Google Scholar] [CrossRef]
  3. Maitra, S.; Praharaj, S.; Brestic, M.; Sahoo, R.K.; Sagar, L.; Shankar, T.; Palai, J.B.; Sahoo, U.; Sairam, M.; Pramanick, B. Rhizobium as biotechnological tools for green solutions: An environment-friendly approach for sustainable crop production in the modern era of climate change. Curr. Microbiol. 2023, 80, 219. [Google Scholar] [CrossRef] [PubMed]
  4. Zgadzaj, R.; Garrido-Oter, R.; Jensen, D.B.; Koprivova, A.; Schulze-Lefert, P.; Radutoiu, S. Root nodule symbiosis in Lotus japonicus drives the establishment of distinctive rhizosphere, root, and nodule bacterial communities. Proc. Natl. Acad. Sci. USA 2016, 113, E7996–E8005. [Google Scholar] [CrossRef] [PubMed]
  5. Su, C.; Wang, L.; Kong, F. miR172: A messenger between nodulation and flowering. Trends Plant Sci. 2023, 28, 623–625. [Google Scholar] [CrossRef]
  6. Herridge, D.F.; Peoples, M.B.; Boddey, R.M. Global inputs of biological nitrogen fixation in agricultural systems. Plant Soil 2008, 311, 1–18. [Google Scholar] [CrossRef]
  7. Signorelli, S.; Sainz, M.; Tabares-da Rosa, S.; Monza, J. The role of nitric oxide in nitrogen fixation by legumes. Front. Plant Sci. 2020, 11, 521. [Google Scholar] [CrossRef]
  8. Yun, J.; Wang, C.; Zhang, F.; Chen, L.; Sun, Z.; Cai, Y.; Luo, Y.; Liao, J.; Wang, Y.; Cha, Y. A nitrogen fixing symbiosis-specific pathway required for legume flowering. Sci. Adv. 2023, 9, eade1150. [Google Scholar] [CrossRef]
  9. Hirsch, A.M. Developmental biology of legume nodulation. New Phytol. 1992, 122, 211–237. [Google Scholar] [CrossRef]
  10. Larrainzar, E.; Villar, I.; Rubio, M.C.; Pérez-Rontomé, C.; Huertas, R.; Sato, S.; Mun, J.H.; Becana, M. Hemoglobins in the legume–Rhizobium symbiosis. New Phytol. 2020, 228, 472–484. [Google Scholar] [CrossRef]
  11. Jiang, S.; Jardinaud, M.-F.; Gao, J.; Pecrix, Y.; Wen, J.; Mysore, K.; Xu, P.; Sanchez-Canizares, C.; Ruan, Y.; Li, Q. NIN-like protein transcription factors regulate leghemoglobin genes in legume nodules. Science 2021, 374, 625–628. [Google Scholar] [CrossRef] [PubMed]
  12. Fuchsman, W.H.; Appleby, C.A. Separation and determination of the relative concentrations of the homogeneous components of soybean leghemoglobin by isoelectric focusing. Biochim. Biophys. Acta (BBA)-Protein Struct. 1979, 579, 314–324. [Google Scholar] [CrossRef]
  13. Yun, B.W.; Skelly, M.J.; Yin, M.; Yu, M.; Mun, B.G.; Lee, S.U.; Hussain, A.; Spoel, S.H.; Loake, G.J. Nitric oxide and S-nitrosoglutathione function additively during plant immunity. New Phytol. 2016, 211, 516–526. [Google Scholar] [CrossRef] [PubMed]
  14. Lee, K.-K.; Klucas, R.V. Reduction of ferric leghemoglobin in soybean root nodules. Plant Physiol. 1984, 74, 984–988. [Google Scholar] [CrossRef]
  15. Ji, L.; Becana, M.; Sarath, G.; Shearman, L.; Klucas, R.V. Overproduction in Escherichia coli and characterization of a soybean ferric leghemoglobin reductase. Plant Physiol. 1994, 106, 203–209. [Google Scholar] [CrossRef] [PubMed]
  16. Luan, P.; Aréchaga-Ocampo, E.; Sarath, G.; Arredondo-Peter, R.; Klucas, R.V. Analysis of a ferric leghemoglobin reductase from cowpea (Vigna unguiculata) root nodules. Plant Sci. 2000, 154, 161–170. [Google Scholar] [CrossRef]
  17. Becana, M.; Dalton, D.A.; Moran, J.F.; Iturbe-Ormaetxe, I.; Matamoros, M.A.; Rubio, M.C. Reactive oxygen species and antioxidants in legume nodules. Physiol. Plant. 2000, 109, 372–381. [Google Scholar] [CrossRef]
  18. Trinchant, J.-C.; Rigaud, J. Nitrite and nitric oxide as inhibitors of nitrogenase from soybean bacteroids. Appl. Environ. Microbiol. 1982, 44, 1385–1388. [Google Scholar] [CrossRef]
  19. Sasakura, F.; Uchiumi, T.; Shimoda, Y.; Suzuki, A.; Takenouchi, K.; Higashi, S.; Abe, M. A class 1 hemoglobin gene from Alnus firma functions in symbiotic and nonsymbiotic tissues to detoxify nitric oxide. Mol. Plant-Microbe Interact. 2006, 19, 441–450. [Google Scholar] [CrossRef]
  20. Kato, K.; Kanahama, K.; Kanayama, Y. Involvement of nitric oxide in the inhibition of nitrogenase activity by nitrate in Lotus root nodules. J. Plant Physiol. 2010, 167, 238–241. [Google Scholar] [CrossRef]
  21. Shimoda, Y.; Nagata, M.; Suzuki, A.; Abe, M.; Sato, S.; Kato, T.; Tabata, S.; Higashi, S.; Uchiumi, T. Symbiotic rhizobium and nitric oxide induce gene expression of non-symbiotic hemoglobin in Lotus japonicus. Plant Cell Physiol. 2005, 46, 99–107. [Google Scholar] [CrossRef] [PubMed]
  22. Cam, Y.; Pierre, O.; Boncompagni, E.; Hérouart, D.; Meilhoc, E.; Bruand, C. Nitric oxide (NO): A key player in the senescence of Medicago truncatula root nodules. New Phytol. 2012, 196, 548–560. [Google Scholar] [CrossRef] [PubMed]
  23. Feechan, A.; Kwon, E.; Yun, B.-W.; Wang, Y.; Pallas, J.A.; Loake, G.J. A central role for S-nitrosothiols in plant disease resistance. Proc. Natl. Acad. Sci. 2005, 102, 8054–8059. [Google Scholar] [CrossRef] [PubMed]
  24. Maiti, D.; Sarkar, T.S.; Ghosh, S. Detection of S-nitrosothiol and nitrosylated proteins in Arachis hypogaea functional nodule: Response of the nitrogen fixing symbiont. PLoS ONE 2012, 7, e45526. [Google Scholar] [CrossRef] [PubMed]
  25. Puppo, A.; Pauly, N.; Boscari, A.; Mandon, K.; Brouquisse, R. Hydrogen peroxide and nitric oxide: Key regulators of the legume—Rhizobium and mycorrhizal symbioses. Antioxid. Redox Signal. 2013, 18, 2202–2219. [Google Scholar] [CrossRef]
  26. Baudouin, E.; Pieuchot, L.; Engler, G.; Pauly, N.; Puppo, A. Nitric oxide is formed in Medicago truncatula-Sinorhizobium meliloti functional nodules. Mol. Plant-Microbe Interact. 2006, 19, 970–975. [Google Scholar] [CrossRef]
  27. Calvo-Begueria, L.; Rubio, M.C.; Martínez, J.I.; Pérez-Rontomé, C.; Delgado, M.J.; Bedmar, E.J.; Becana, M. Redefining nitric oxide production in legume nodules through complementary insights from electron paramagnetic resonance spectroscopy and specific fluorescent probes. J. Exp. Bot. 2018, 69, 3703–3714. [Google Scholar] [CrossRef]
  28. Fukudome, M.; Watanabe, E.; Osuki, K.-I.; Imaizumi, R.; Aoki, T.; Becana, M.; Uchiumi, T. Stably transformed Lotus japonicus plants overexpressing phytoglobin LjGlb1-1 show decreased nitric oxide levels in roots and nodules as well as delayed nodule senescence. Plant Cell Physiol. 2019, 60, 816–825. [Google Scholar] [CrossRef]
  29. Epstein, E. Silicon. Annu. Rev. Plant Biol. 1999, 50, 641–664. [Google Scholar] [CrossRef]
  30. Tubana, B.S.; Babu, T.; Datnoff, L.E. A review of silicon in soils and plants and its role in US agriculture: History and future perspectives. Soil Sci. 2016, 181, 393–411. [Google Scholar] [CrossRef]
  31. Nelwamondo, A.; Dakora, F. Silicon promotes nodule formation and nodule function in symbiotic cowpea (Vigna unguiculata). New Phytol. 1999, 142, 463–467. [Google Scholar] [CrossRef]
  32. Mali, M.; Aery, A.N.C. Silicon effects on nodule growth, dry-matter production, and mineral nutrition of cowpea (Vigna unguiculata). J. Plant Nutr. Soil Sci. 2008, 171, 835–840. [Google Scholar] [CrossRef]
  33. Steiner, F.; Zuffo, A.M.; Bush, A.; Santos, D.M.d.S. Silicate fertilization potentiates the nodule formation and symbiotic nitrogen fixation in soybean1. Pesqui. Agropecu. Trop. 2018, 48, 212–221. [Google Scholar] [CrossRef]
  34. Putra, R.; Waterman, J.M.; Mathesius, U.; Wojtalewicz, D.; Powell, J.R.; Hartley, S.E.; Johnson, S.N. Benefits of silicon-enhanced root nodulation in a model legume are contingent upon rhizobial efficacy. Plant Soil 2022, 477, 201–217. [Google Scholar] [CrossRef]
  35. Mansoor, S.; Tripathi, P.; Ghimire, A.; Hamid, S.; Abd El-moniem, D.; Chung, Y.S.; Kim, Y. Comparative transcriptomic analysis of the nodulation-competent zone and inference of transcription regulatory network in silicon applied Glycine max [L.]-Merr. Roots. Plant Cell Rep. 2024, 43, 169. [Google Scholar] [CrossRef] [PubMed]
  36. Coquerel, R.; Arkoun, M.; Trouverie, J.; Bernay, B.; Laîné, P.; Etienne, P. Ionomic and proteomic changes highlight the effect of silicon supply on the functioning of Trifolium incarnatum L. nodules subjected to nitrogen starvation. Res. Sq. 2024. [Google Scholar] [CrossRef]
  37. Garg, N.; Singh, S. Arbuscular mycorrhiza Rhizophagus irregularis and silicon modulate growth, proline biosynthesis and yield in Cajanus cajan L. Millsp.(pigeonpea) genotypes under cadmium and zinc stress. J. Plant Growth Regul. 2018, 37, 46–63. [Google Scholar] [CrossRef]
  38. Ahmad, P.; Alyemeni, M.N.; Wijaya, L.; Ahanger, M.A.; Ashraf, M.; Alam, P.; Paray, B.A.; Rinklebe, J. Nitric oxide donor, sodium nitroprusside, mitigates mercury toxicity in different cultivars of soybean. J. Hazard. Mater. 2021, 408, 124852. [Google Scholar] [CrossRef]
  39. Methela, N.J.; Islam, M.S.; Lee, D.-S.; Yun, B.-W.; Mun, B.-G. S-nitrosoglutathione (GSNO)-mediated lead detoxification in soybean through the regulation of ROS and metal-related transcripts. Int. J. Mol. Sci. 2023, 24, 9901. [Google Scholar] [CrossRef]
  40. Methela, N.J.; Pande, A.; Islam, M.S.; Rahim, W.; Hussain, A.; Lee, D.-S.; Mun, B.-G.; Maria Joseph Raj, N.P.; Kim, S.-J.; Kim, Y. Chitosan-GSNO nanoparticles: A positive modulator of drought stress tolerance in soybean. BMC Plant Biol. 2023, 23, 639. [Google Scholar] [CrossRef]
  41. Mostofa, M.G.; Rahman, M.M.; Ansary, M.M.U.; Keya, S.S.; Abdelrahman, M.; Miah, M.G.; Phan Tran, L.-S. Silicon in mitigation of abiotic stress-induced oxidative damage in plants. Crit. Rev. Biotechnol. 2021, 41, 918–934. [Google Scholar] [CrossRef] [PubMed]
  42. Hiscox, J.; Israelstam, G. A method for the extraction of chlorophyll from leaf tissue without maceration. Can. J. Bot. 1979, 57, 1332–1334. [Google Scholar] [CrossRef]
  43. Fan, C.; Hu, H.; Wang, L.; Zhou, Q.; Huang, X. Enzymological mechanism for the regulation of lanthanum chloride on flavonoid synthesis of soybean seedlings under enhanced ultraviolet-B radiation. Environ. Sci. Pollut. Res. 2014, 21, 8792–8800. [Google Scholar] [CrossRef] [PubMed]
  44. Wilson, D.; Reisenauer, H. Determination of leghemoglobin in legume nodules. Anal. Biochem. 1963, 6, 27–30. [Google Scholar] [CrossRef]
  45. Yun, B.-W.; Feechan, A.; Yin, M.; Saidi, N.B.; Le Bihan, T.; Yu, M.; Moore, J.W.; Kang, J.-G.; Kwon, E.; Spoel, S.H. S-nitrosylation of NADPH oxidase regulates cell death in plant immunity. Nature 2011, 478, 264–268. [Google Scholar] [CrossRef]
  46. Xue, Y.; Liu, Z.; Gao, X.; Jin, C.; Wen, L.; Yao, X.; Ren, J. GPS-SNO: Computational prediction of protein S-nitrosylation sites with a modified GPS algorithm. PLoS ONE 2010, 5, e11290. [Google Scholar] [CrossRef]
  47. Wickham, H. Data Analysis. In ggplot2: Elegant Graphics for Data Analysis; Springer: Cham, Switzerland, 2016. [Google Scholar]
  48. Wickham, H.; Averick, M.; Bryan, J.; Chang, W.; McGowan, L.D.A.; François, R.; Grolemund, G.; Hayes, A.; Henry, L.; Hester, J. Welcome to the Tidyverse. J. Open Source Softw. 2019, 4, 1686. [Google Scholar] [CrossRef]
  49. USDA. Department of Agriculture Foreign Agricultural Services. 2024. Available online: https://fas.usda.gov/data/production/commodity/2222000 (accessed on 1 September 2024).
  50. Herridge, D.F.; Giller, K.E.; Jensen, E.S.; Peoples, M.B. Quantifying country-to-global scale nitrogen fixation for grain legumes II. Coefficients, templates and estimates for soybean, groundnut and pulses. Plant Soil 2022, 474, 1–15. [Google Scholar] [CrossRef]
  51. Du, M.; Gao, Z.; Li, X.; Liao, H. Excess nitrate induces nodule greening and reduces transcript and protein expression levels of soybean leghaemoglobins. Ann. Bot. 2020, 126, 61–72. [Google Scholar] [CrossRef]
  52. Pueppke, S.G.; Bolanos-Vásquez, M.C.; Werner, D.; Bec-Ferté, M.-P.; Promé, J.-C.; Krishnan, H.B. Release of flavonoids by the soybean cultivars McCall and Peking and their perception as signals by the nitrogen-fixing symbiont Sinorhizobium fredii. Plant Physiol. 1998, 117, 599–606. [Google Scholar] [CrossRef]
  53. Cullimore, J.V.; Ranjeva, R.; Bono, J.-J. Perception of lipo-chitooligosaccharidic Nod factors in legumes. Trends Plant Sci. 2001, 6, 24–30. [Google Scholar] [CrossRef] [PubMed]
  54. Radutoiu, S.; Madsen, L.H.; Madsen, E.B.; Felle, H.H.; Umehara, Y.; Grønlund, M.; Sato, S.; Nakamura, Y.; Tabata, S.; Sandal, N. Plant recognition of symbiotic bacteria requires two LysM receptor-like kinases. Nature 2003, 425, 585–592. [Google Scholar] [CrossRef] [PubMed]
  55. Broghammer, A.; Krusell, L.; Blaise, M.; Sauer, J.; Sullivan, J.T.; Maolanon, N.; Vinther, M.; Lorentzen, A.; Madsen, E.B.; Jensen, K.J. Legume receptors perceive the rhizobial lipochitin oligosaccharide signal molecules by direct binding. Proc. Natl. Acad. Sci. USA 2012, 109, 13859–13864. [Google Scholar] [CrossRef] [PubMed]
  56. Madsen, E.B.; Madsen, L.H.; Radutoiu, S.; Olbryt, M.; Rakwalska, M.; Szczyglowski, K.; Sato, S.; Kaneko, T.; Tabata, S.; Sandal, N. A receptor kinase gene of the LysM type is involved in legumeperception of rhizobial signals. Nature 2003, 425, 637–640. [Google Scholar] [CrossRef] [PubMed]
  57. Williams, J.S.; Thomas, M.; Clarke, D.J. The gene stlA encodes a phenylalanine ammonia-lyase that is involved in the production of a stilbene antibiotic in Photorhabdus luminescens TT01. Microbiology 2005, 151, 2543–2550. [Google Scholar] [CrossRef]
  58. Liu, C.-W.; Murray, J.D. The role of flavonoids in nodulation host-range specificity: An update. Plants 2016, 5, 33. [Google Scholar] [CrossRef]
  59. Pii, Y.; Crimi, M.; Cremonese, G.; Spena, A.; Pandolfini, T. Auxin and nitric oxide control indeterminate nodule formation. BMC Plant Biol. 2007, 7, 1–11. [Google Scholar] [CrossRef]
  60. Hichri, I.; Boscari, A.; Castella, C.; Rovere, M.; Puppo, A.; Brouquisse, R. Nitric oxide: A multifaceted regulator of the nitrogen-fixing symbiosis. J. Exp. Bot. 2015, 66, 2877–2887. [Google Scholar] [CrossRef]
  61. Kubo, H. Uber hamoprotein aus den wurzelknollchen von leguminosen. Acta Phytochim. 1939, 11, 195–200. [Google Scholar]
  62. Cutting, J.; Schulman, H. Leghemoglobin-concerning the sites of biosynthesis of its components. Fed. Proc. 1968, 27, 768. [Google Scholar]
  63. Vieweg, M.F.; Frühling, M.; Quandt, H.-J.; Heim, U.; Bäumlein, H.; Pühler, A.; Küster, H.; Perlick, A.M. The promoter of the Vicia faba L. leghemoglobin gene VfLb29 is specifically activated in the infected cells of root nodules and in the arbuscule-containing cells of mycorrhizal roots from different legume and nonlegume plants. Mol. Plant-Microbe Interact. 2004, 17, 62–69. [Google Scholar] [CrossRef] [PubMed]
  64. Becana, M.; Sprent, J.I. Effect of nitrate on components of nodule leghaemoglobins. J. Exp. Bot. 1989, 40, 725–731. [Google Scholar] [CrossRef]
  65. Kanayama, Y.; Yamamoto, Y. Inhibition of nitrogen fixation in soybean plants supplied with nitrate III. Kinetics of the formation of nitrosylleghemoglobin and of the inhibition of formation of oxyleghemoglobin. Plant Cell Physiol. 1990, 31, 603–608. [Google Scholar] [CrossRef]
  66. Yu, H.; Xiao, A.; Wu, J.; Li, H.; Duan, Y.; Chen, Q.; Zhu, H.; Cao, Y. GmNAC039 and GmNAC018 activate the expression of cysteine protease genes to promote soybean nodule senescence. Plant Cell 2023, 35, 2929–2951. [Google Scholar] [CrossRef] [PubMed]
  67. Appleby, C. Properties of leghaemoglobin in vivo, and its isolation as ferrous oxyleghaemoglobin. Biochim. Biophys. Acta (BBA)-Protein Struct. 1969, 188, 222–229. [Google Scholar] [CrossRef]
  68. Saari, L.L.; Klucas, R.V. Ferric leghemoglobin reductase from soybean root nodules. Arch. Biochem. Biophys. 1984, 231, 102–113. [Google Scholar] [CrossRef]
  69. Ji, L.; Wood, S.; Becana, M.; Klucas, R.V. Purification and characterization of soybean root nodule ferric leghemoglobin reductase. Plant Physiol. 1991, 96, 32–37. [Google Scholar] [CrossRef]
  70. Wang, Y.-Q.; Feechan, A.; Yun, B.-W.; Shafiei, R.; Hofmann, A.; Taylor, P.; Xue, P.; Yang, F.-Q.; Xie, Z.-S.; Pallas, J.A. S-nitrosylation of AtSABP3 antagonizes the expression of plant immunity. J. Biol. Chem. 2009, 284, 2131–2137. [Google Scholar] [CrossRef]
  71. Liu, L.; Hausladen, A.; Zeng, M.; Que, L.; Heitman, J.; Stamler, J.S. A metabolic enzyme for S-nitrosothiol conserved from bacteria to humans. Nature 2001, 410, 490–494. [Google Scholar] [CrossRef]
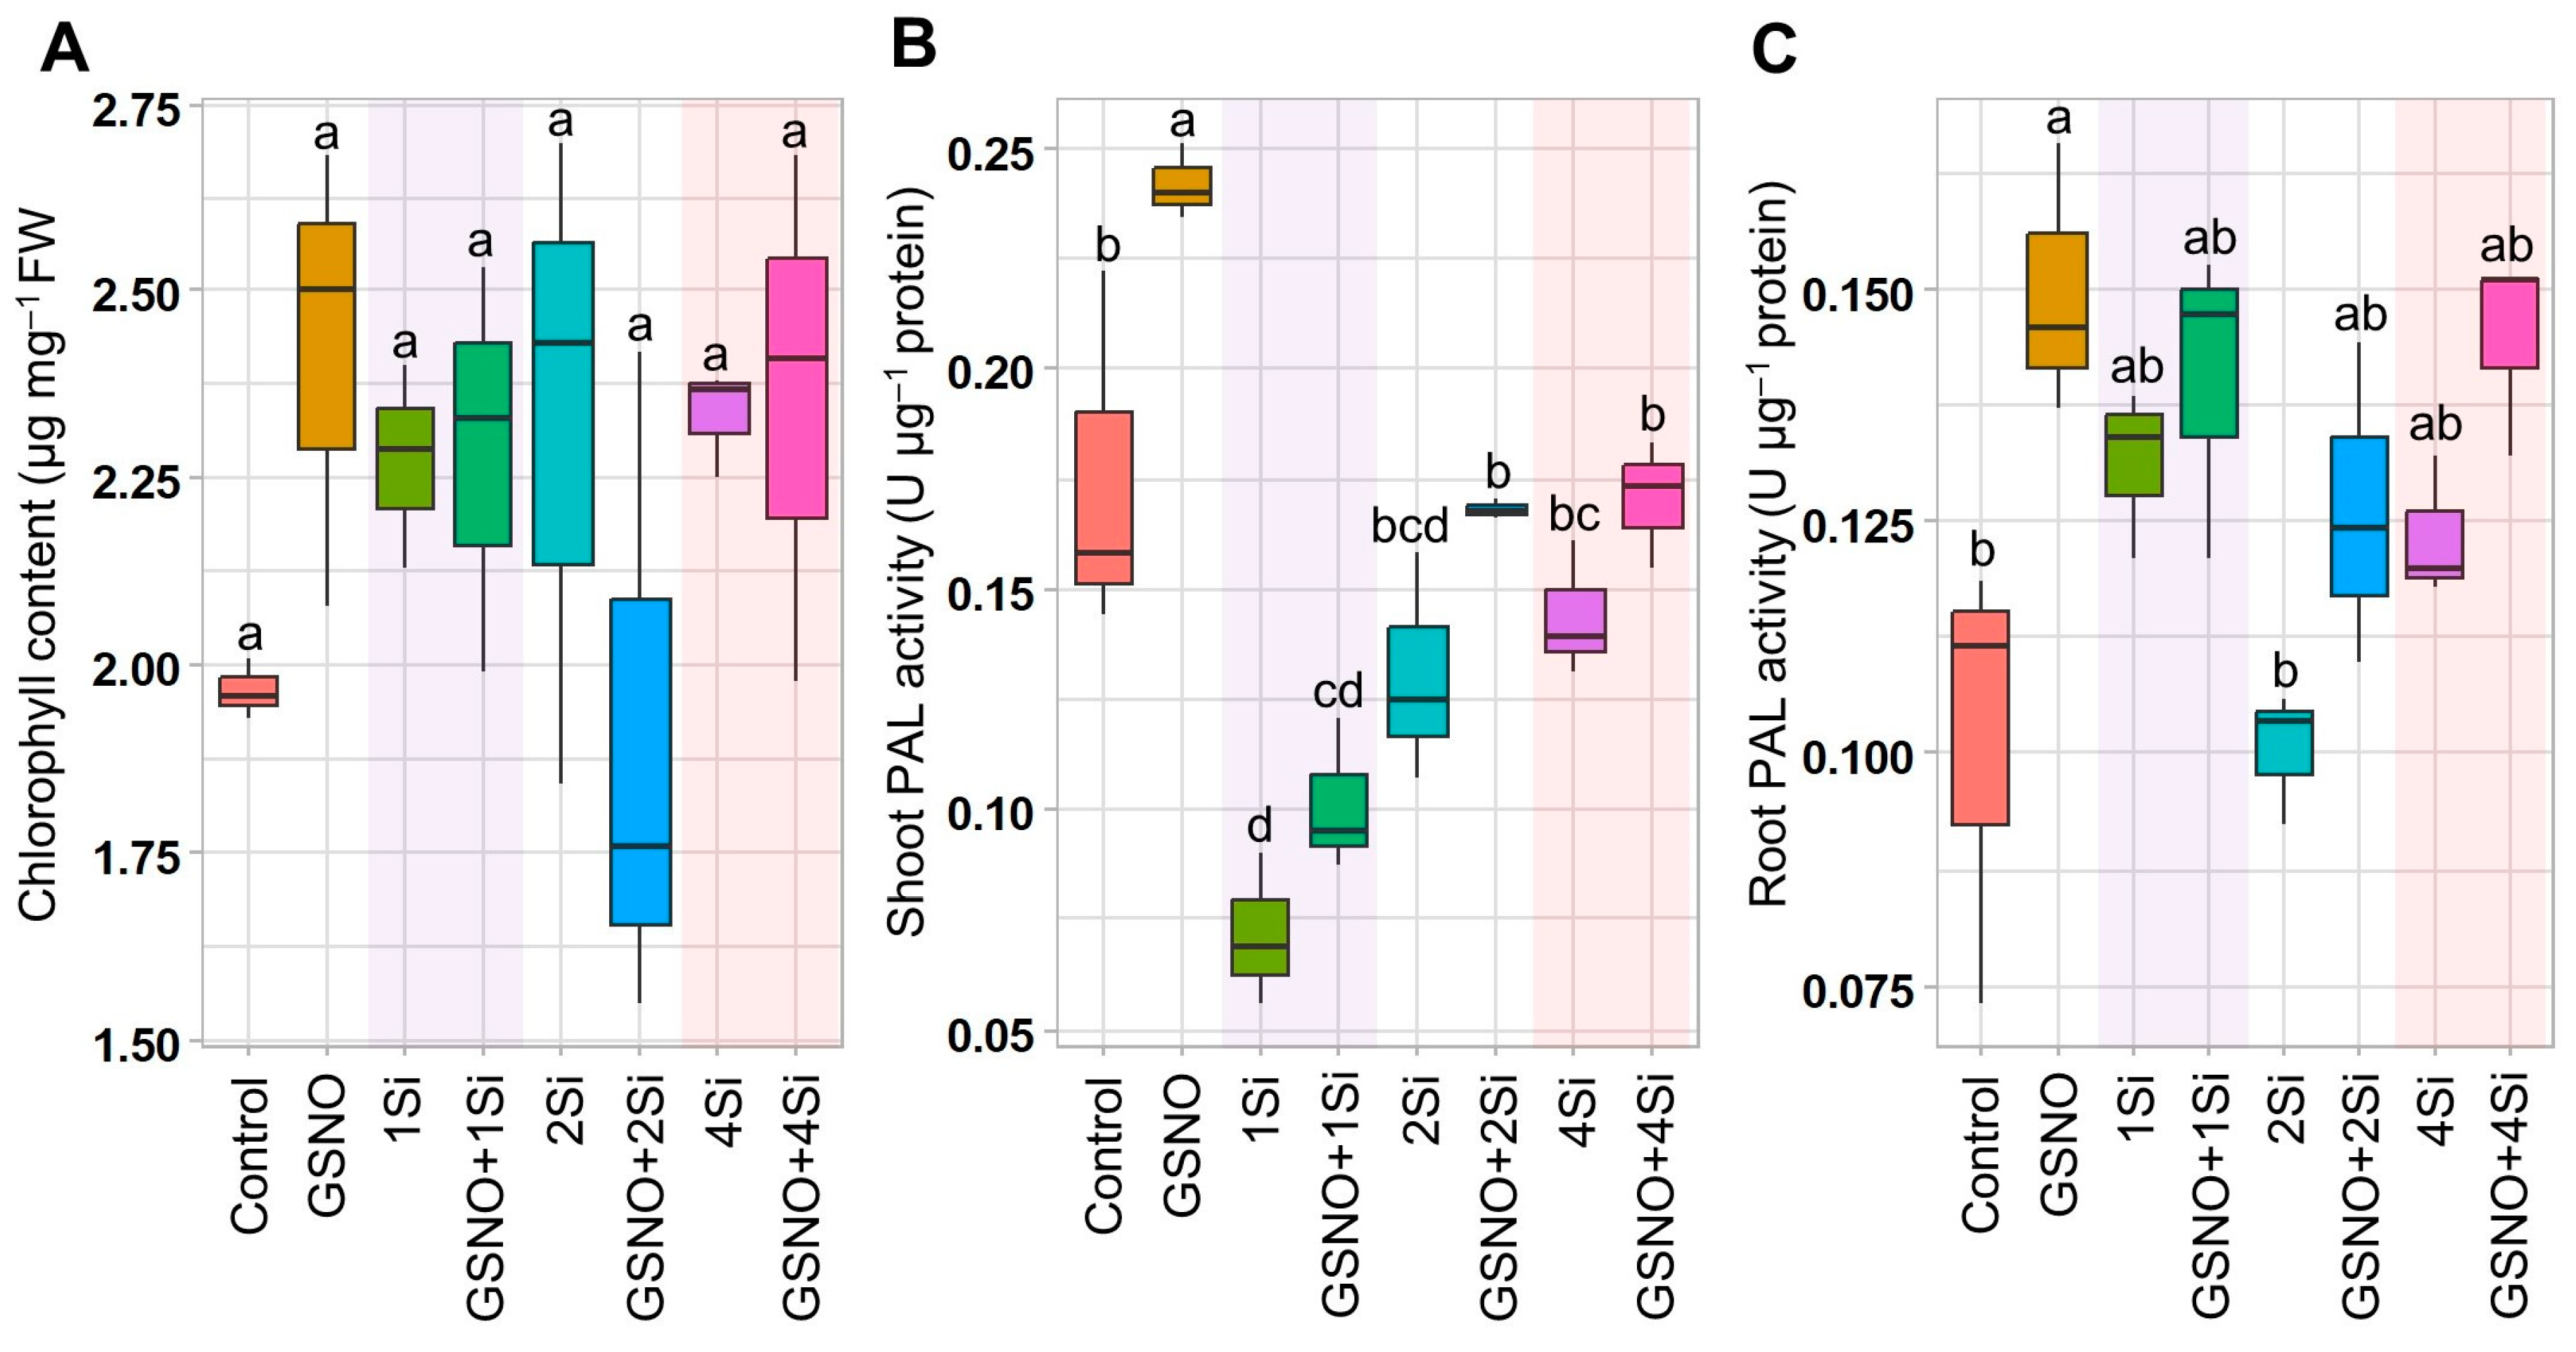
Figure 1. Analysis of chlorophyll content and PAL activity in soybean plants treated with GSNO (150 µM) and Si (1, 2, and 4 mM), both individually and in combination, for 2 weeks. The figure displays (A) chlorophyll content, (B) PAL activity in shoots, and (C) PAL activity in roots. Data are presented as means with standard errors (n = 3). Statistically significant differences between treatments, determined using the Tukey’s HSD test (p < 0.05), are indicated with different letters above the boxplots. Treatments include: dH2O-treated plants (Control), 150 µM GSNO-treated plants (GSNO), 1 mM Si-treated plants (1Si), 150 µM GSNO + 1 mM Si-treated plants (GSNO+1Si), 2 mM Si-treated plants (2Si), 150 µM GSNO + 2 mM Si-treated plants (GSNO+2Si), 4 mM Si-treated plants (4Si), and 150 µM GSNO + 4 mM Si-treated plants (GSNO+4Si).
Biomolecules 14 01417 g001
Figure 2. Effects of GSNO (150 µM) and Si (1, 2, and 4 mM), both individually and in combination, on nodule attributes in soybean plants after 2 weeks of treatment. The figure displays (A) the number of nodules per plant, (B) nodule diameter, (C) nodule fresh weight per plant, and (D) the relative gene expression of NIP2-1 in roots and (E) nodules. Data are presented as means with standard errors (n = 3), except for nodule diameter (n = 10). For panels (AC), statistical significance between treatments was assessed using the Tukey’s HSD test (p < 0.05), with different letters above the boxplots indicating significant differences. For panels (D,E), significant differences were determined using the Student’s t-test (**** p ≤ 0.0001). Treatments include: dH2O-treated plants (Control), 150 µM GSNO-treated plants (GSNO), 1 mM Si-treated plants (1Si), 150 µM GSNO + 1 mM Si-treated plants (GSNO+1Si), 2 mM Si-treated plants (2Si), 150 µM GSNO + 2 mM Si-treated plants (GSNO+2Si), 4 mM Si-treated plants (4Si), and 150 µM GSNO + 4 mM Si-treated plants (GSNO+4Si).
Biomolecules 14 01417 g002
Figure 3. Assessment of leghaemoglobin content and gene expression in soybean nodules and roots treated with GSNO (150 µM) and Si (1, 2, and 4 mM) for 2 weeks, both individually and in combination. The figure illustrates (A) the cross section of nodules per treatment, (B,F) leghaemoglobin content in nodules and roots and (C,G) relative expression of Lba in nodules and in roots, (D,H) relative expression of FLbR-1 in nodules and roots, and (E,I) relative gene expression of FLbR-2 in nodules and roots. Data are presented as means with standard errors (n = 3). For panels (B,F), statistically significant differences between treatments, determined using the Tukey’s HSD test (p < 0.05), are indicated with different letters above the boxplots. For panels (CE,GI), significant differences were assessed using the Student’s t-test (**** p ≤ 0.0001). Treatments include: dH2O-treated plants (Control), 150 µM GSNO-treated plants (GSNO), 1 mM Si-treated plants (1Si), 150 µM GSNO + 1 mM Si-treated plants (GSNO+1Si), 2 mM Si-treated plants (2Si), 150 µM GSNO + 2 mM Si-treated plants (GSNO+2Si), 4 mM Si-treated plants (4Si), and 150 µM GSNO + 4 mM Si-treated plants (GSNO+4Si).
Biomolecules 14 01417 g003
Figure 4. Measurement of S-nitrosothiols (SNO) levels and related gene expression in soybean plants treated with GSNO (150 µM) and Si (1, 2, and 4 mM) for 2 weeks, both individually and in combination. The figure presents (AC) SNO level in the shoot, roots, and nodules and (DF) relative expression of GSNOR in the shoot, roots, and nodules. Data are presented as means with standard errors (n = 3). For panels (AC), statistically significant differences between treatments, determined using the Tukey’s HSD test (p < 0.05), are indicated with different letters above the boxplots. For panels (DF), significant differences were assessed using the Student’s t-test (* p ≤ 0.05, *** p ≤ 0.001, and **** p ≤ 0.0001). Treatments include: dH2O-treated plants (Control), 150 µM GSNO-treated plants (GSNO), 1 mM Si-treated plants (1Si), 150 µM GSNO + 1 mM Si-treated plants (GSNO+1Si), 2 mM Si-treated plants (2Si), 150 µM GSNO + 2 mM Si-treated plants (GSNO+2Si), 4 mM Si-treated plants (4Si), and 150 µM GSNO + 4 mM Si-treated plants (GSNO+4Si).
Biomolecules 14 01417 g004
Figure 5. Evaluation of growth attributes of soybean plants treated with GSNO (150 µM) and Si (1, 2, and 4 mM), both individually and in combination, for 2 weeks. The figure presents: (A) The shoot, root, and nodule growth of soybean plants treated for 2 weeks. (B) Growth parameters include shoot length, (C) root length, (D) shoot fresh weight, and (E) root fresh weight. Data are presented as means with standard errors (n = 3). Statistically significant differences between treatments, determined using the Tukey’s HSD test (p < 0.05), are indicated with different letters above the boxplots. Treatments include: dH2O-treated plants (Control), 150 µM GSNO-treated plants (GSNO), 1 mM Si-treated plants (1Si), 150 µM GSNO + 1 mM Si-treated plants (GSNO+1Si), 2 mM Si-treated plants (2Si), 150 µM GSNO + 2 mM Si-treated plants (GSNO+2Si), 4 mM Si-treated plants (4Si), and 150 µM GSNO + 4 mM Si-treated plants (GSNO+4Si).
Biomolecules 14 01417 g005
Figure 6. Effect of GSNO and Si on soybean nodulation processes, applied individually or in combination. While GSNO and Si separately enhanced leghaemoglobin synthesis, their combined application inhibited the synthesis and the expression of ferric leghaemoglobin reductases (FLbR-1 and FLbR-2) genes, which are crucial for reducing Lb3+ to Lb2+ to maintain O2 homeostasis in the nodule. However, the combined application of GSNO and Si increased S-nitrosothiol (SNO) levels by decreasing the S-nitrosoglutathione reductase (GSNOR) gene. These findings suggest that S-nitrosylation occurs within the nodule via post-translational modification. Despite this, both individual and combined applications of GSNO and Si enhanced flavonoid synthesis (phenylalanine ammonia-lyase, PAL), attracting rhizobia with the aid of Nod factors, leading to increased nodule formation and N fixation. Solid lines indicate activation or inhibition, where dotted lines are hypothetical. NC, nodule cortex; NE, nodule endodermis; NF, nitrogen fixation zone; S, senescent zone.
Biomolecules 14 01417 g006
Disclaimer/Publisher’s Note: The statements, opinions and data contained in all publications are solely those of the individual author(s) and contributor(s) and not of MDPI and/or the editor(s). MDPI and/or the editor(s) disclaim responsibility for any injury to people or property resulting from any ideas, methods, instructions or products referred to in the content.