


Factors Affecting the Population of Excited Charge Transfer States in Adenine/Guanine Dinucleotides: A Joint Computational and Transient Absorption Study

 ,
,  , and
, and
Abstract

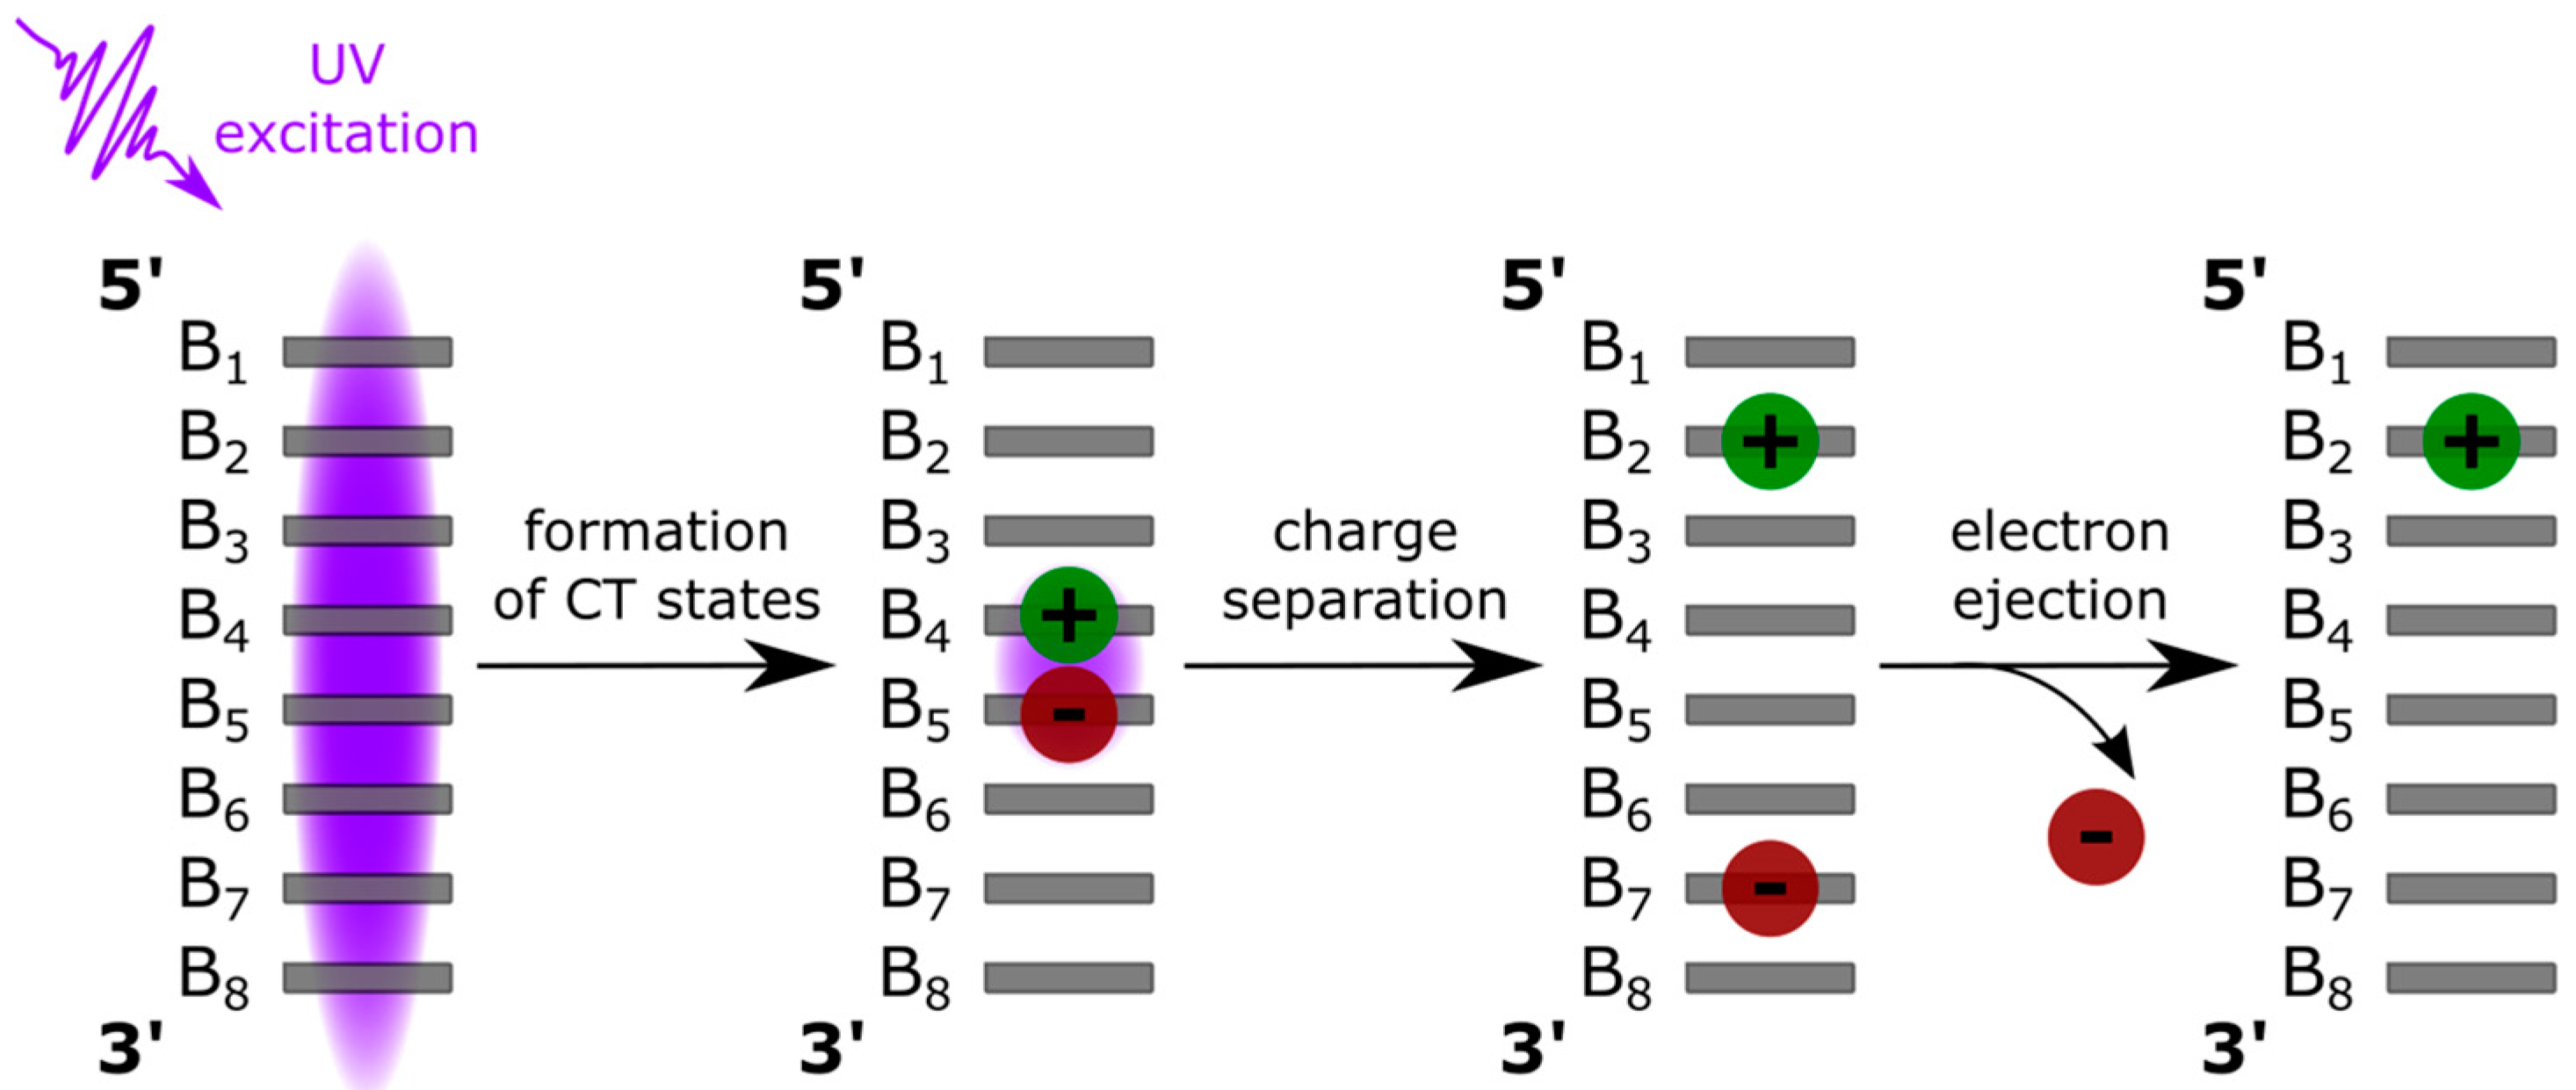
1. Introduction
2. Materials and Methods
2.1. Samples
2.2. Spectroscopic Setups
2.3. Computational Techniques
3. Results
3.1. Experimental
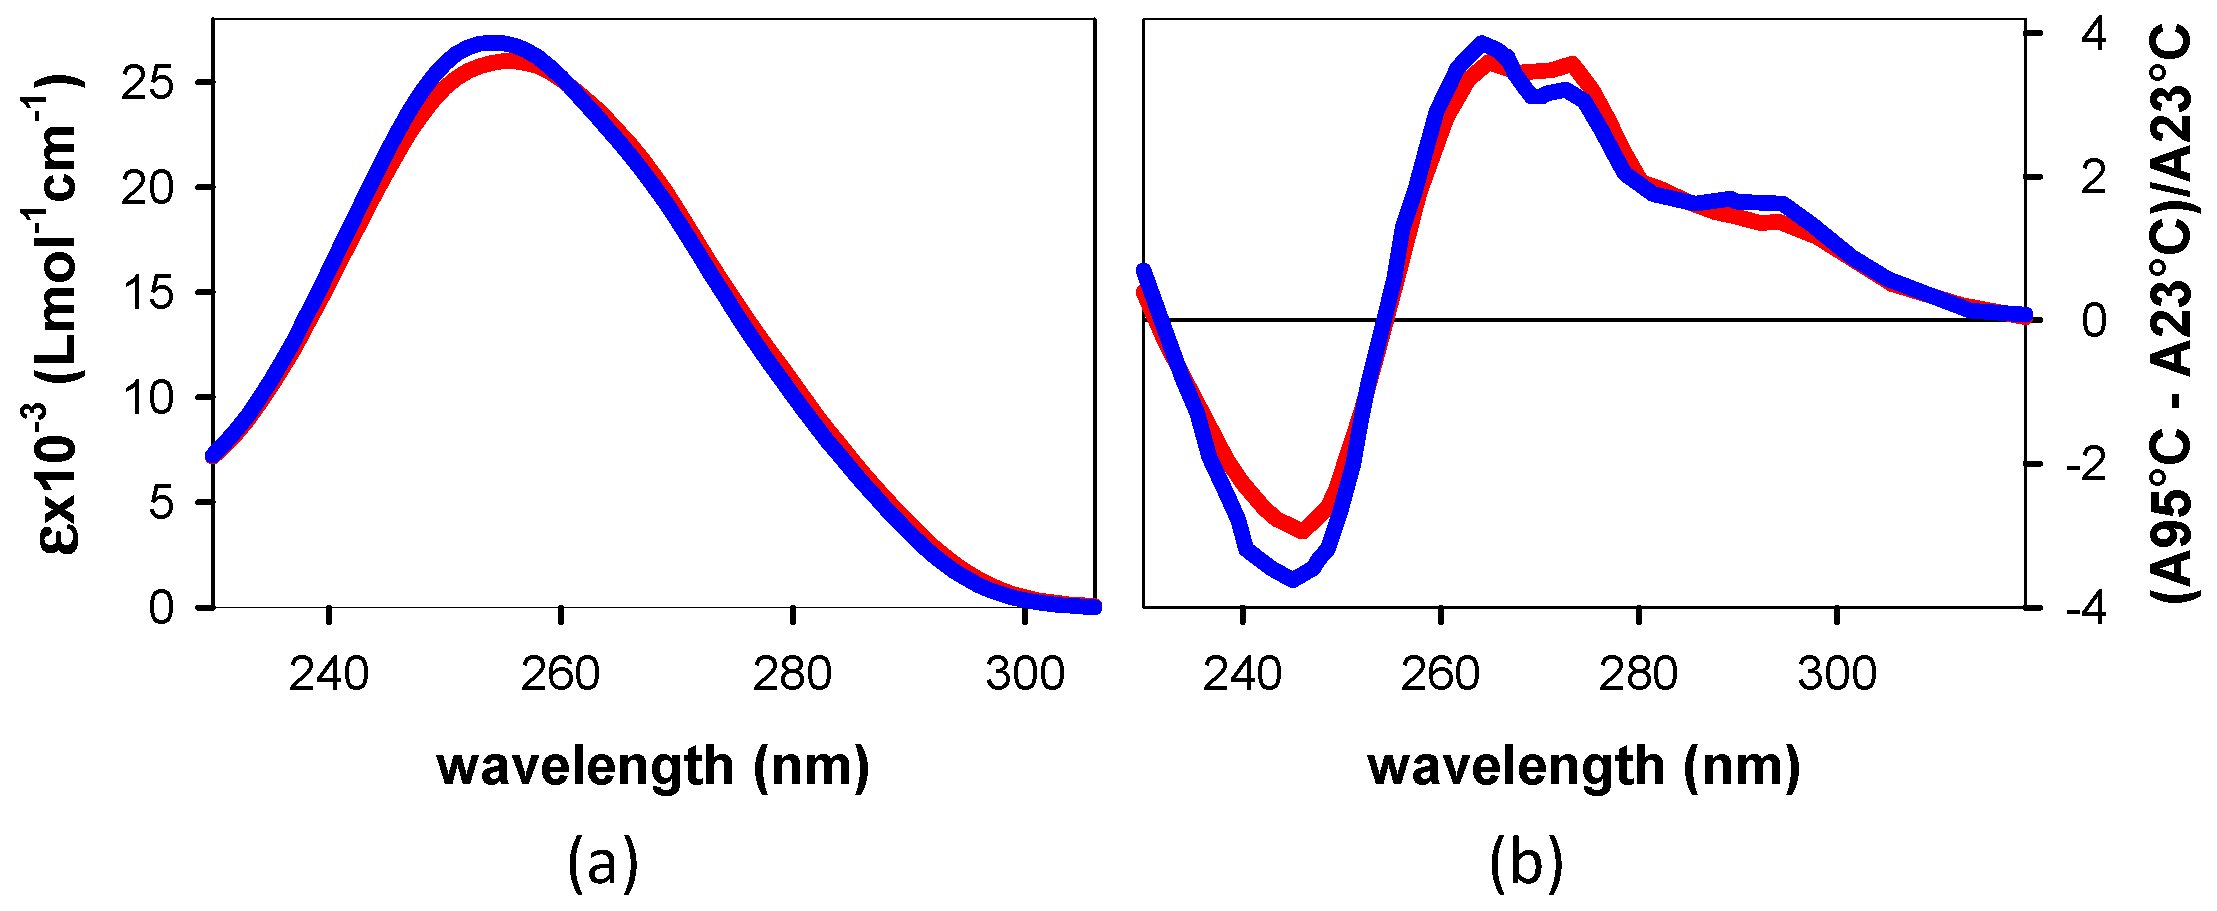
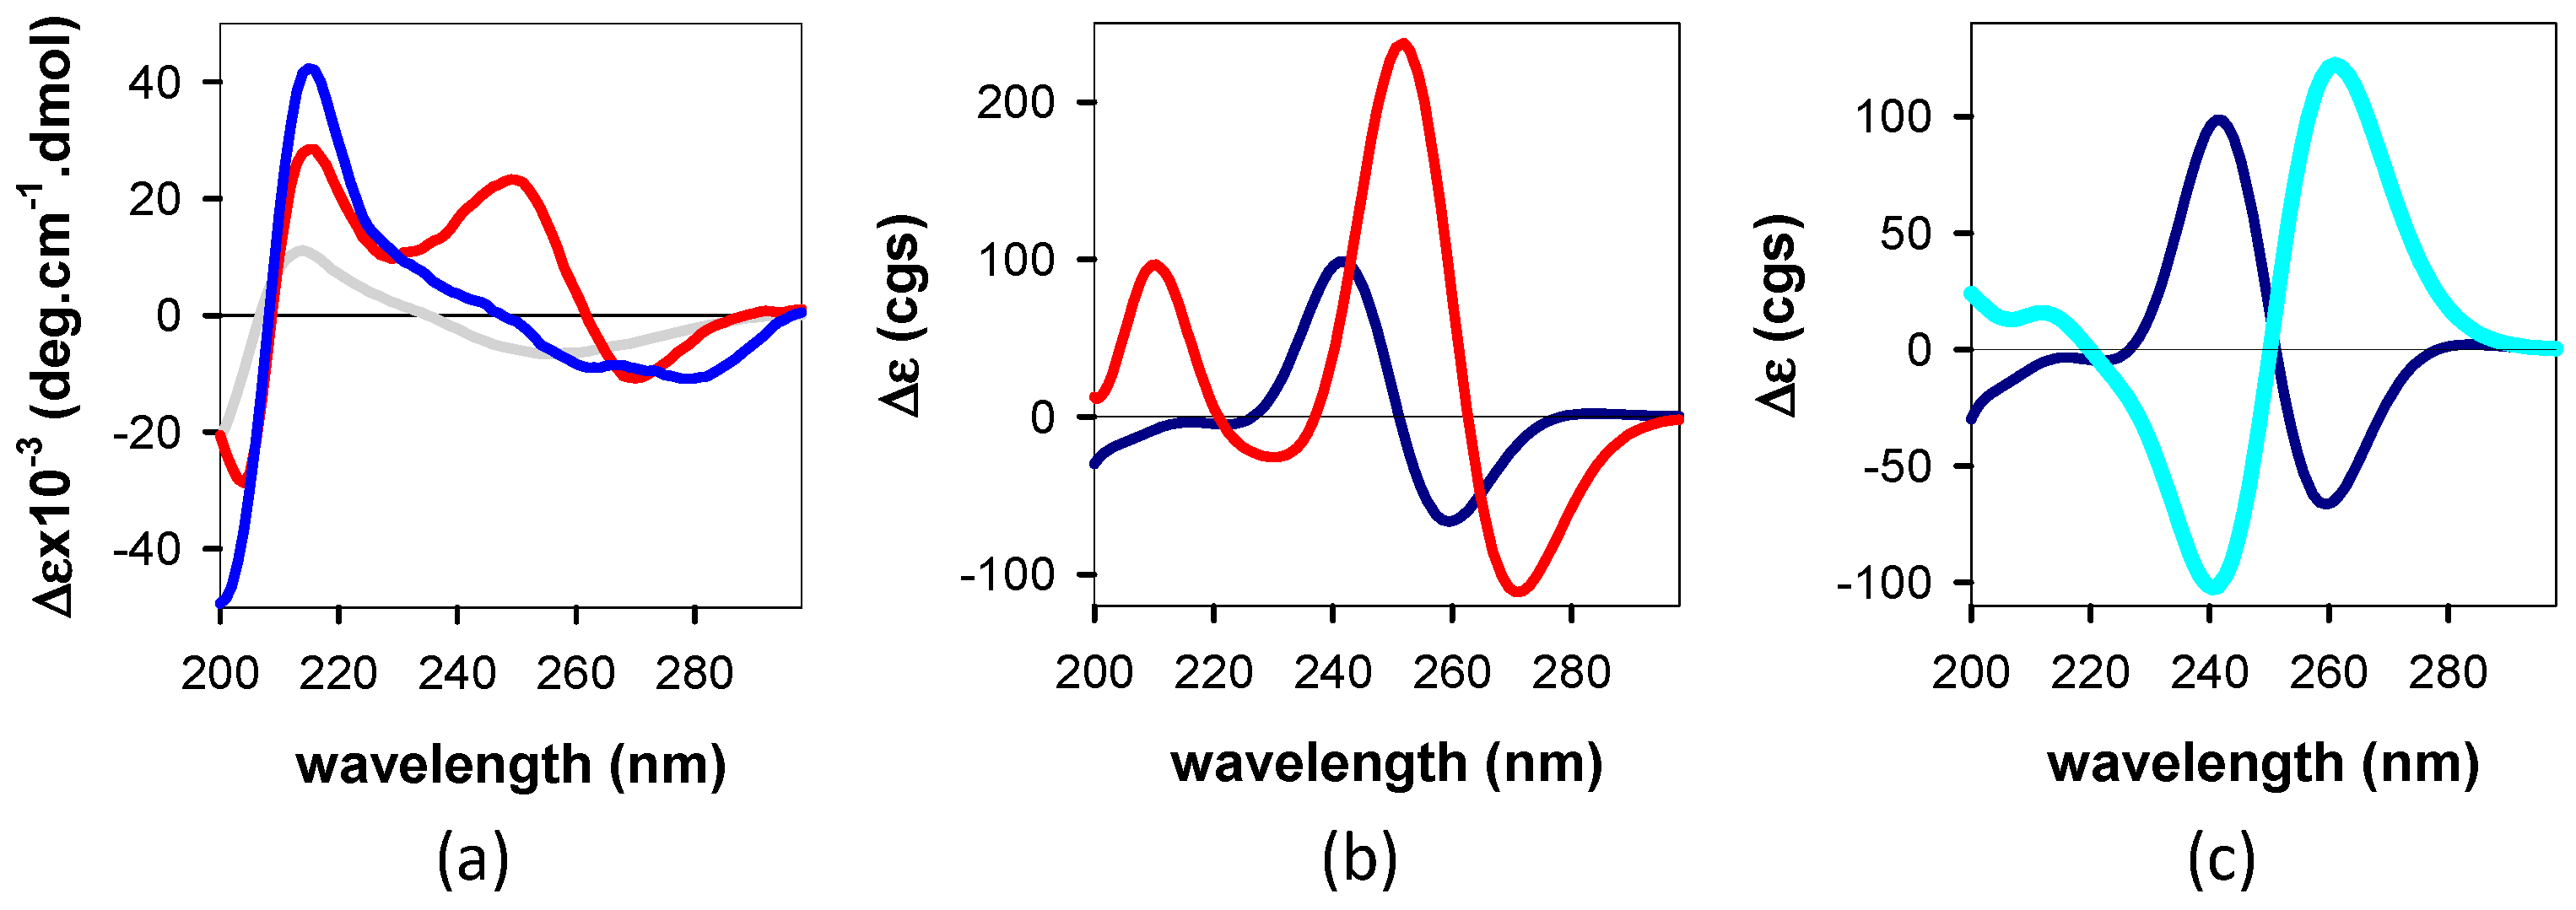
3.1.1. Steady-State Spectroscopy
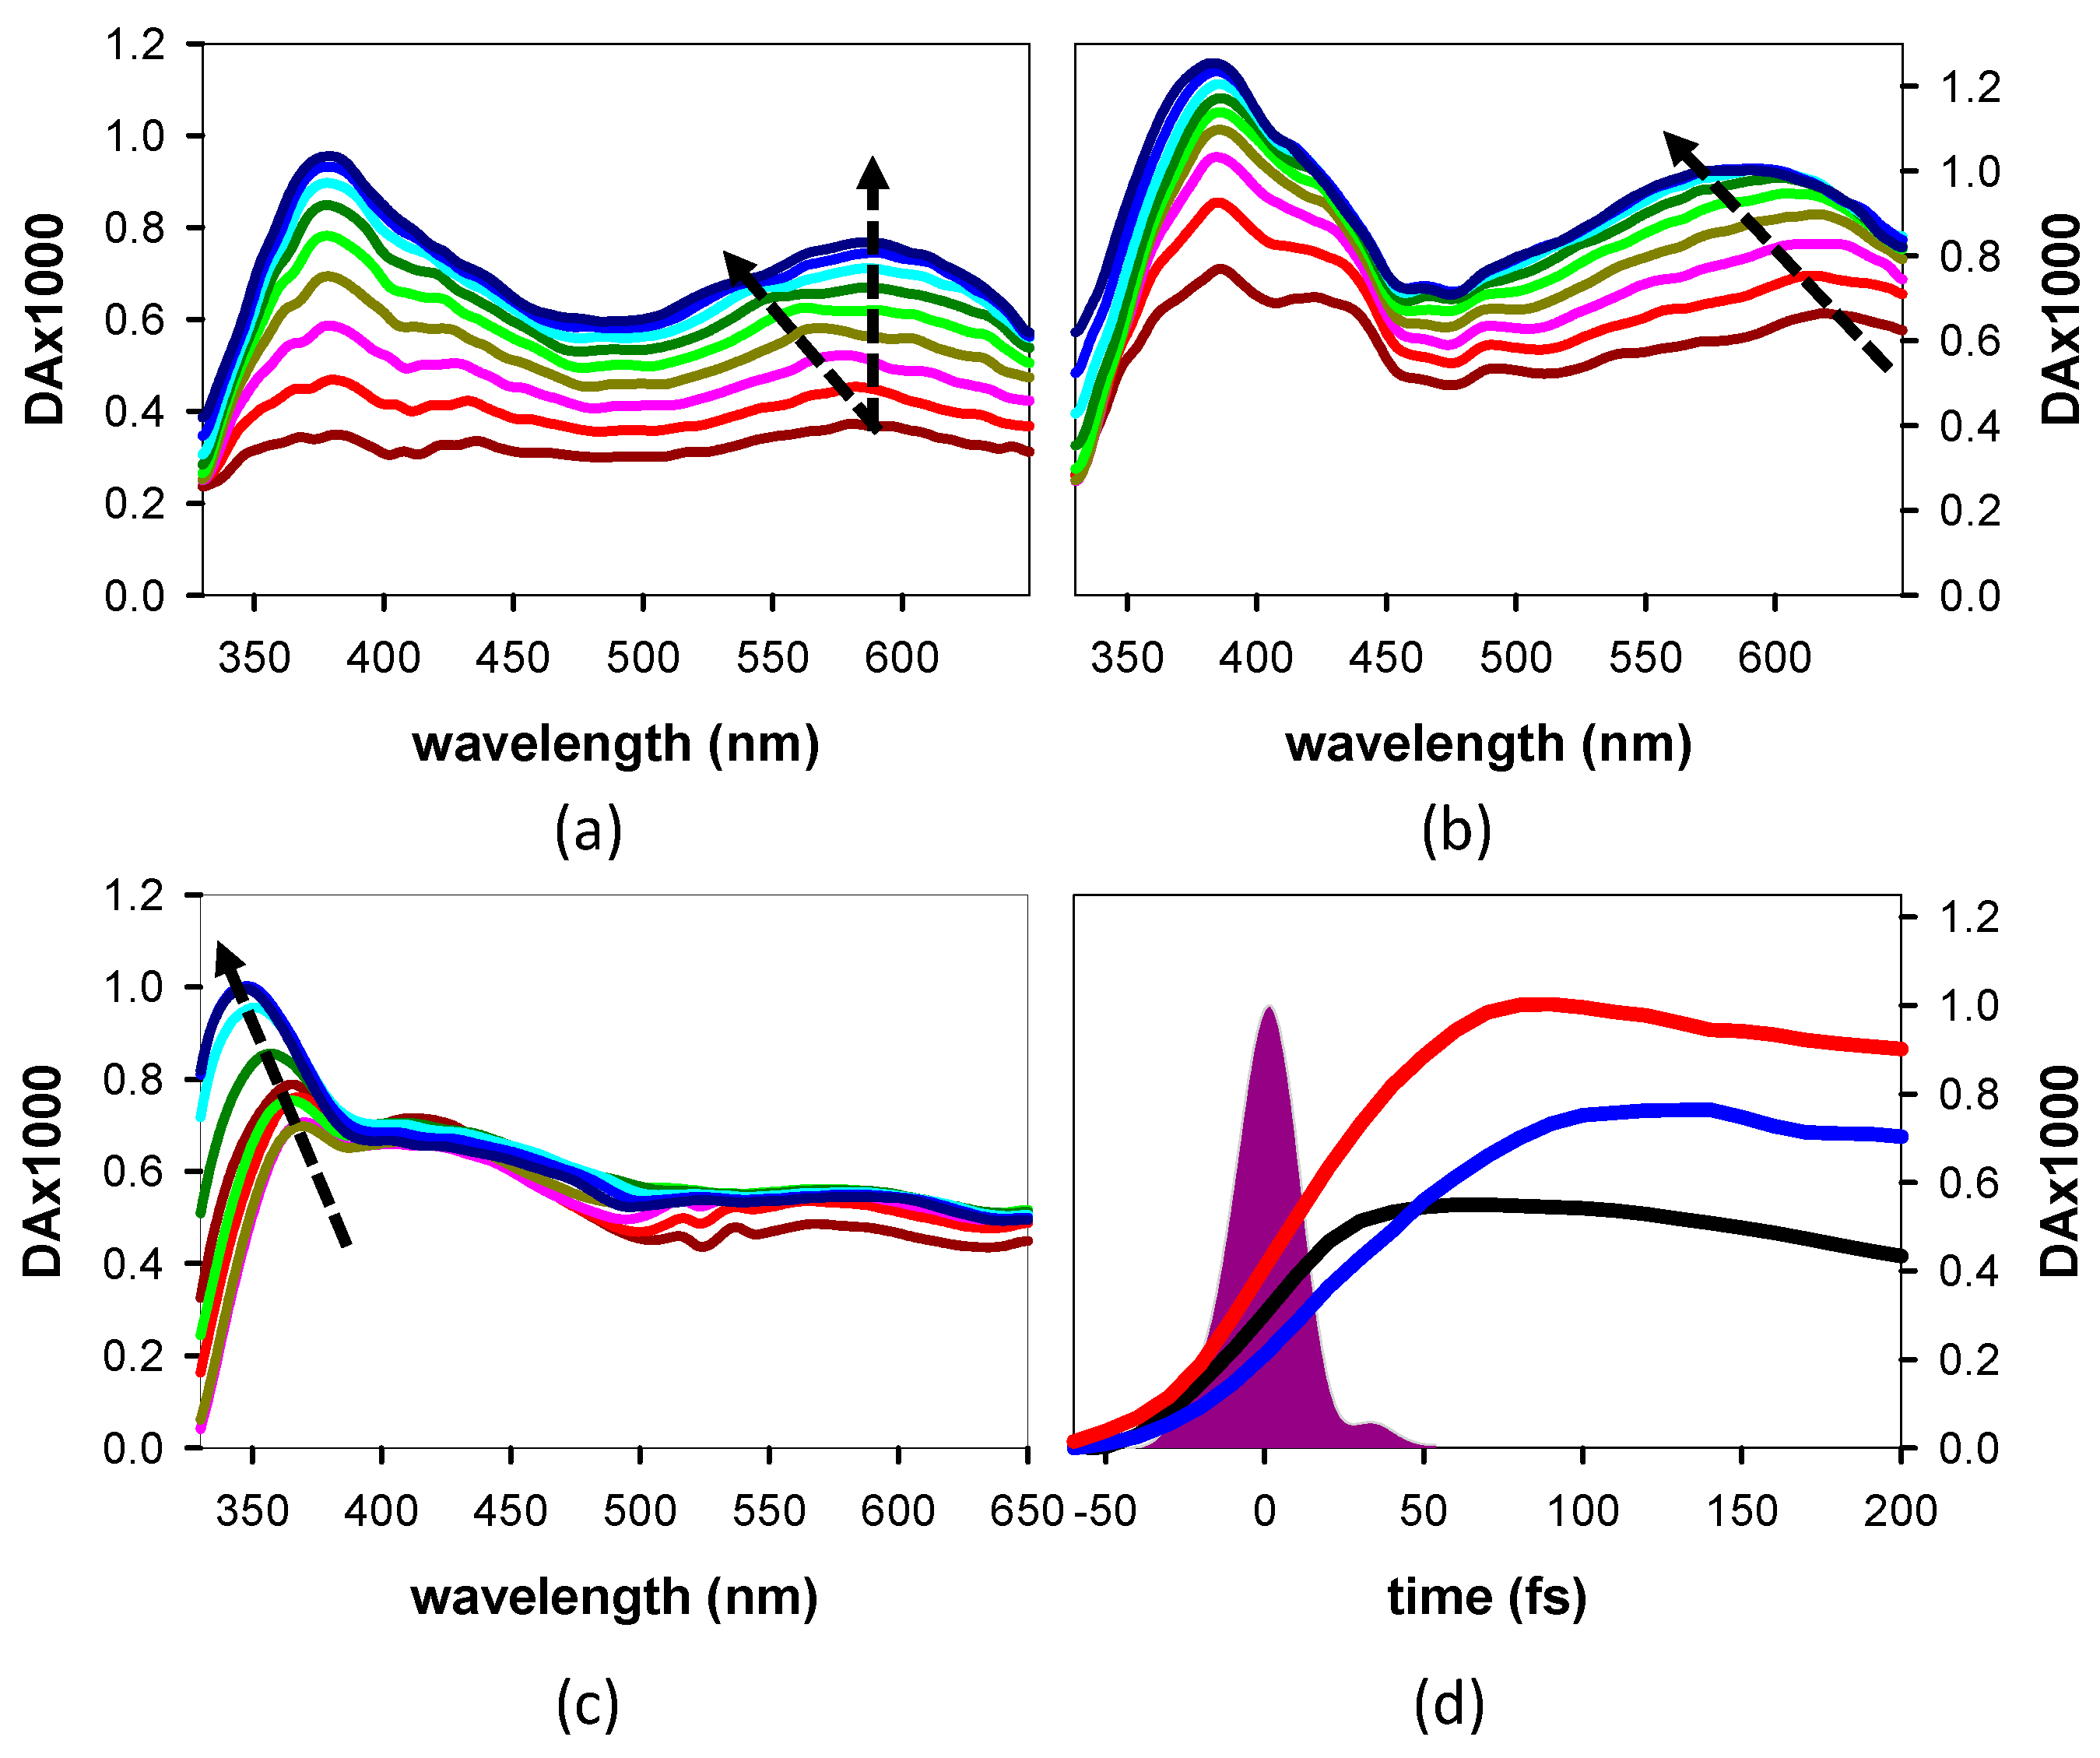
3.1.2. Time-Resolved Spectroscopy
3.2. Computational
3.2.1. Ground State Geometry
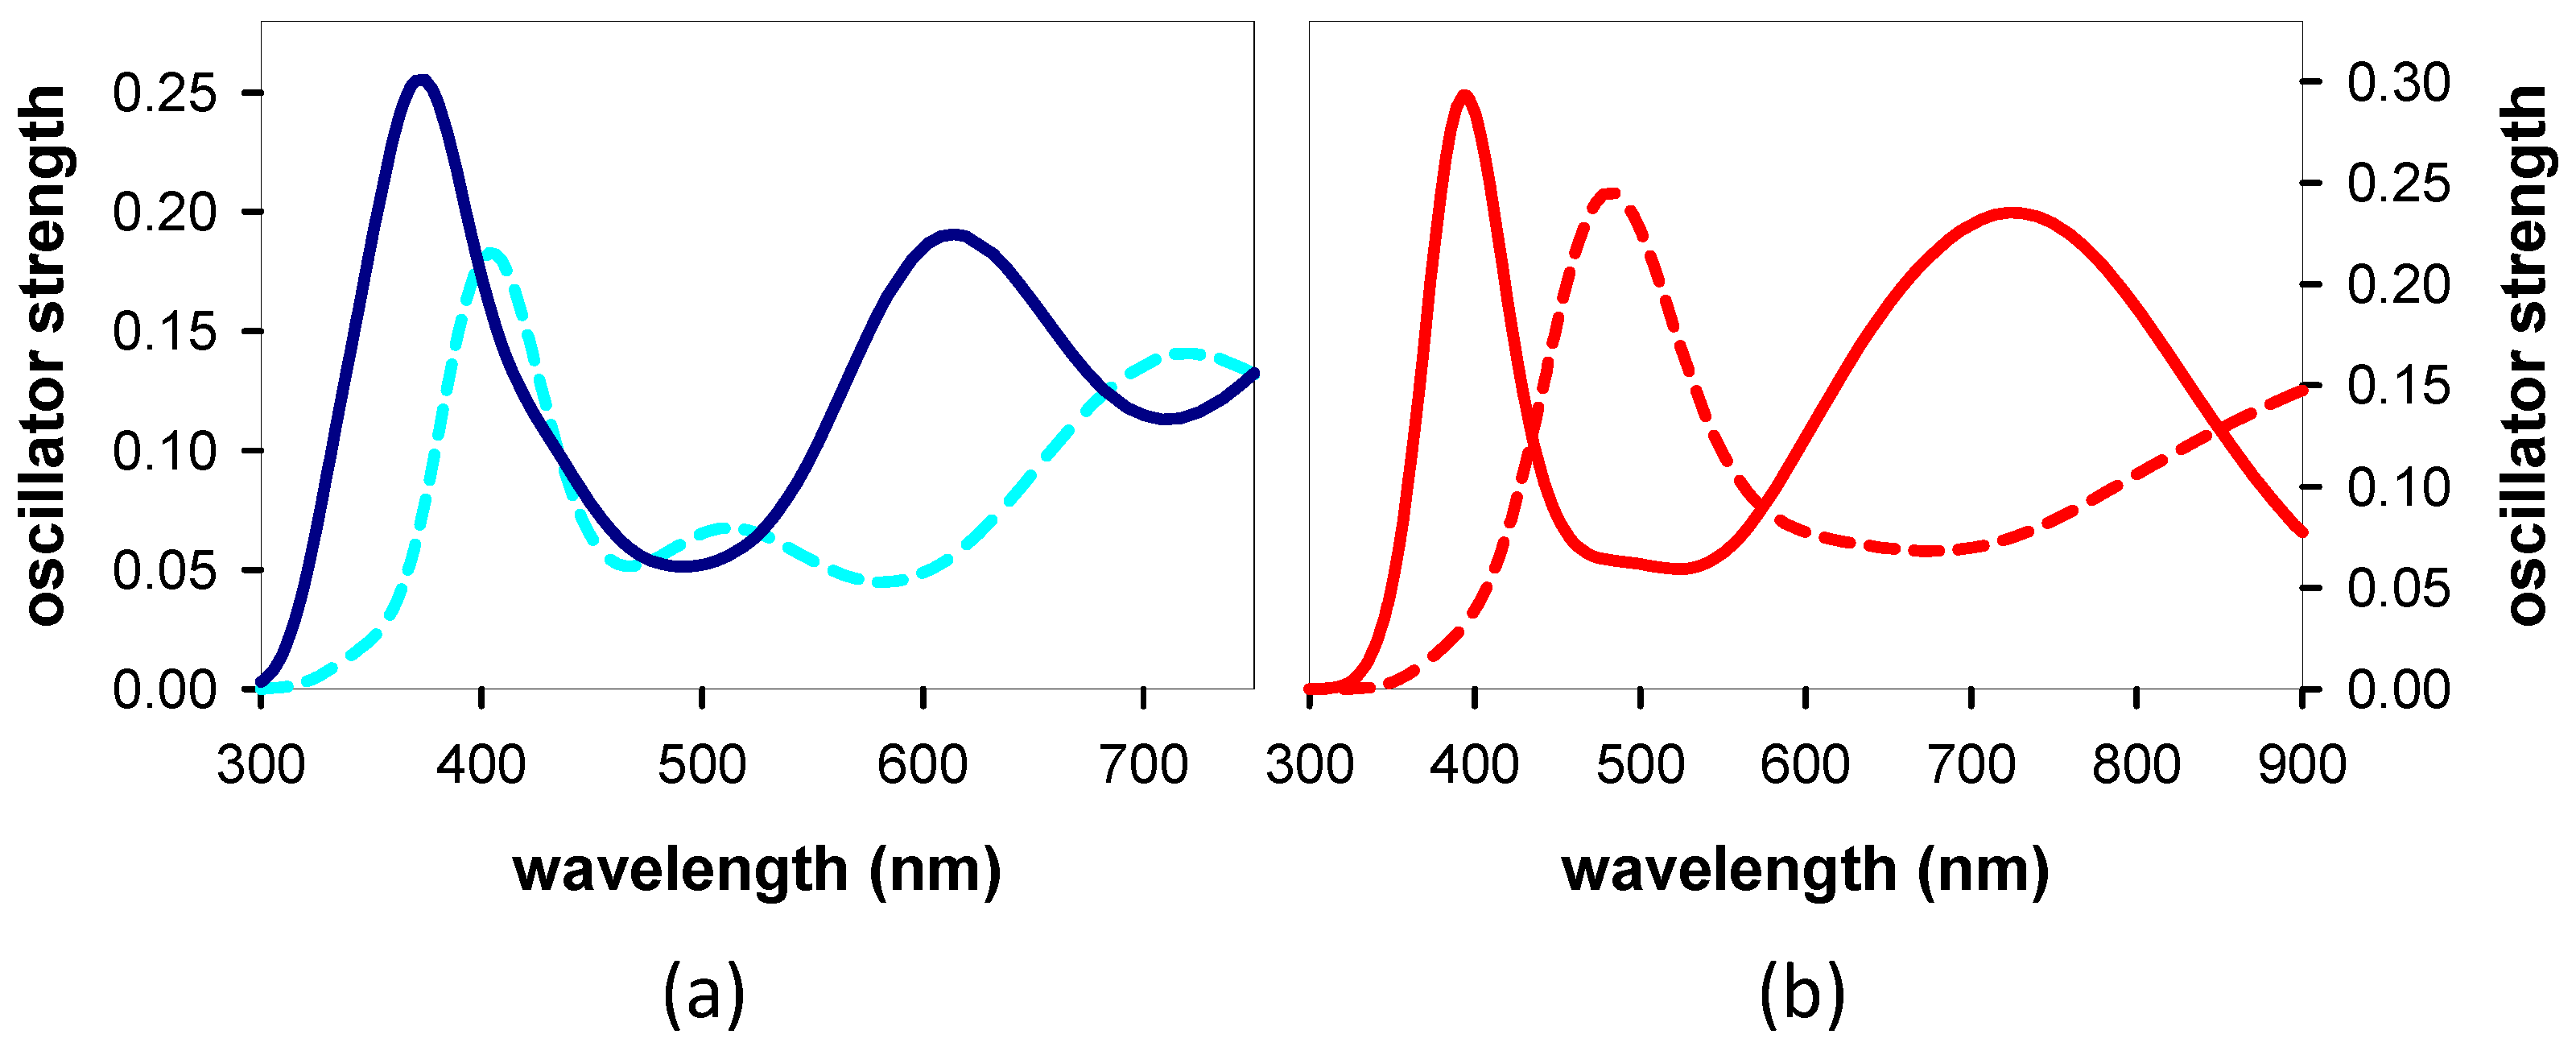
3.2.2. Franck–Condon States and Their Evolution
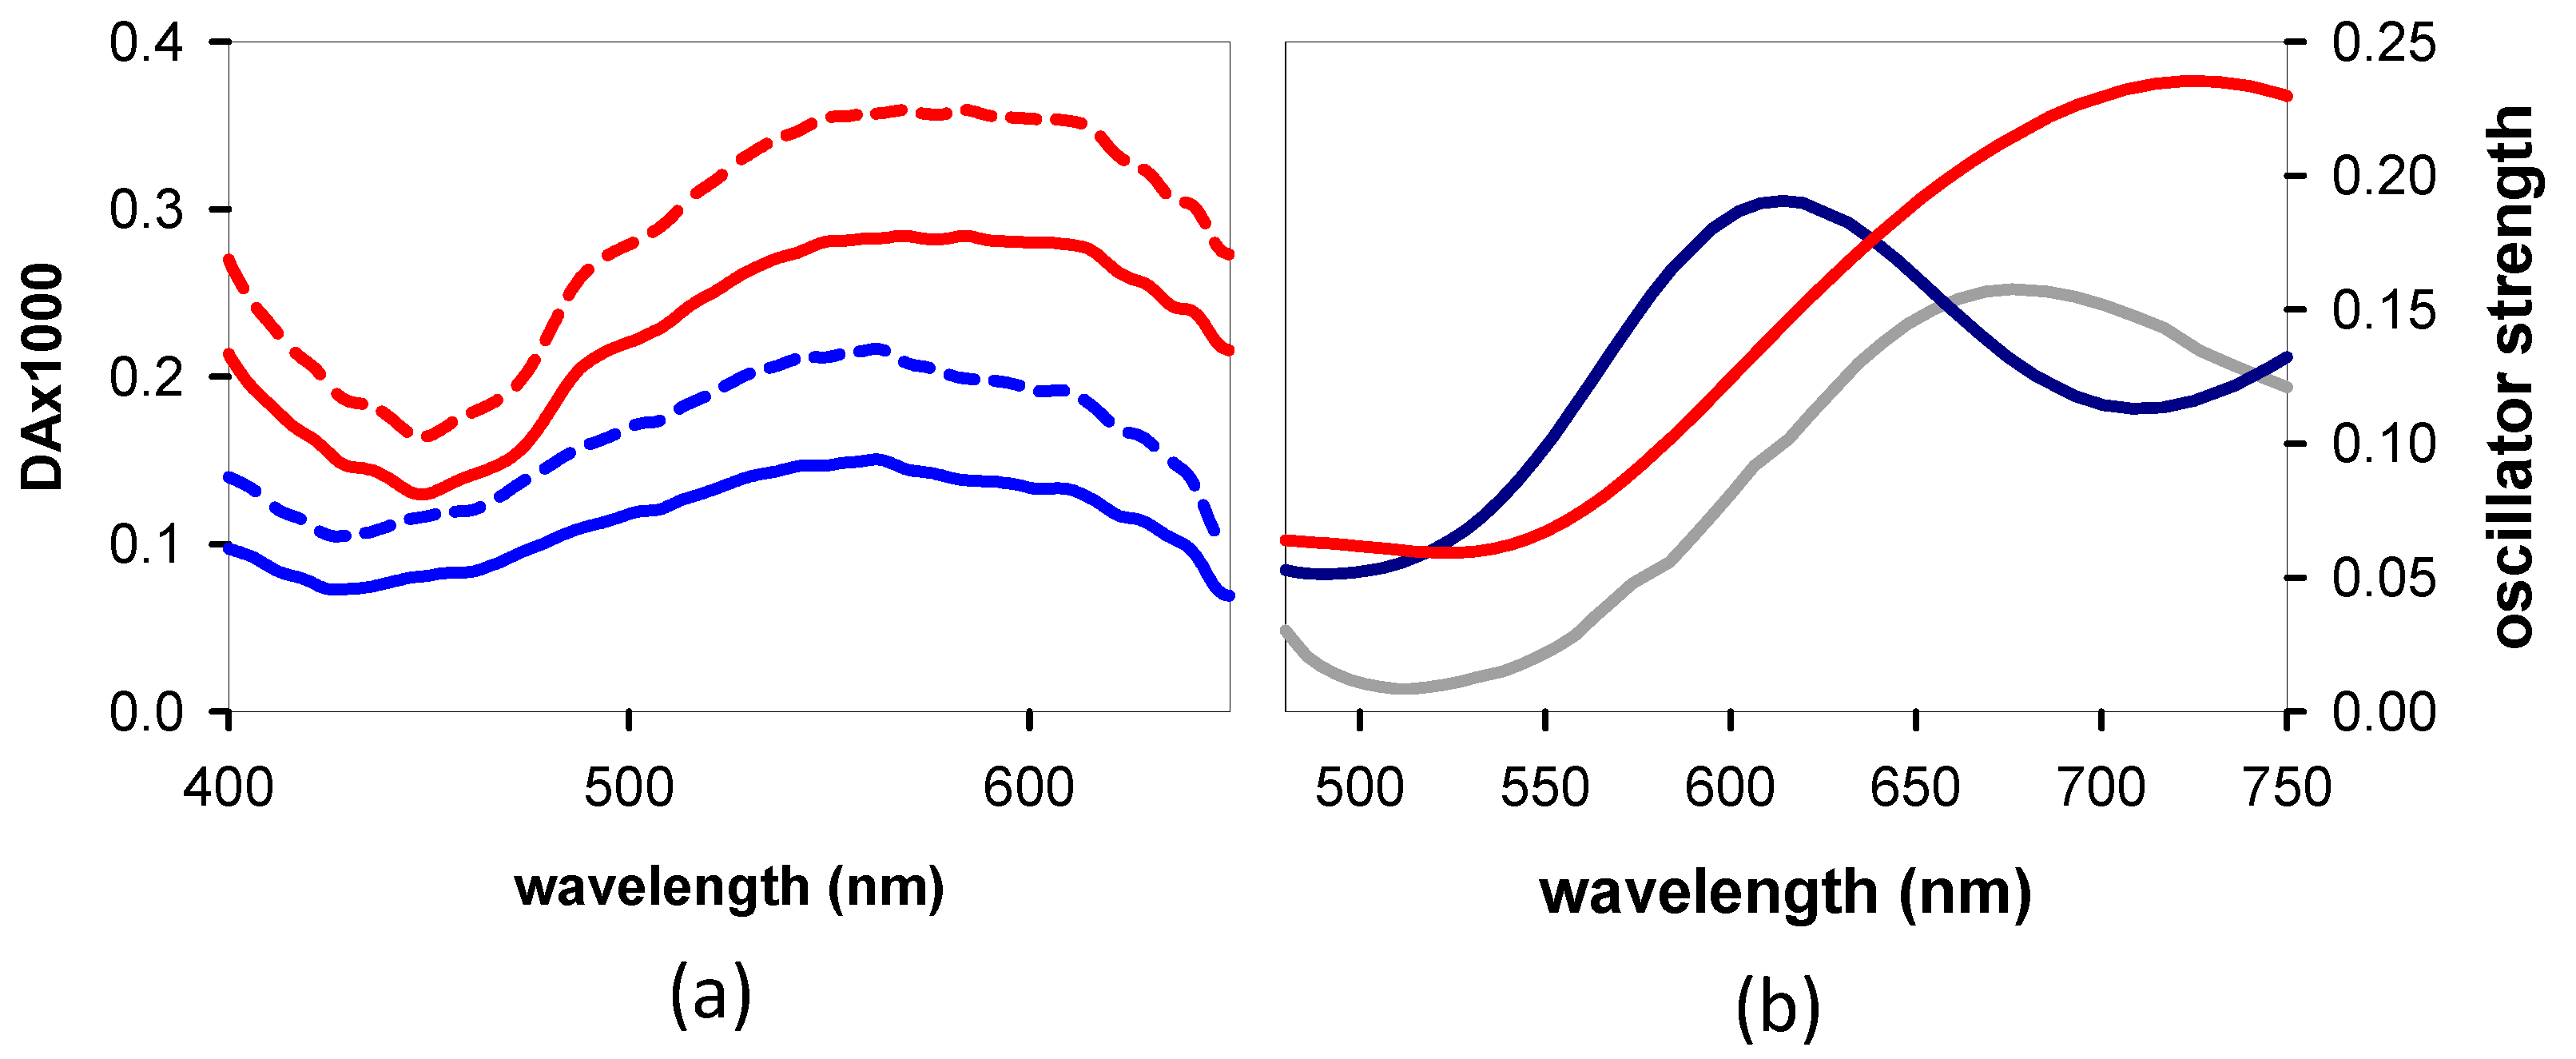
3.3. TAS of the Minima
4. Discussion
4.1. Base Stacking and Photon Absorption
4.2. Relaxation Dynamics: From the Franck–Condon States to the Minima
4.3. Quantum Yields
5. Conclusions
- ➢
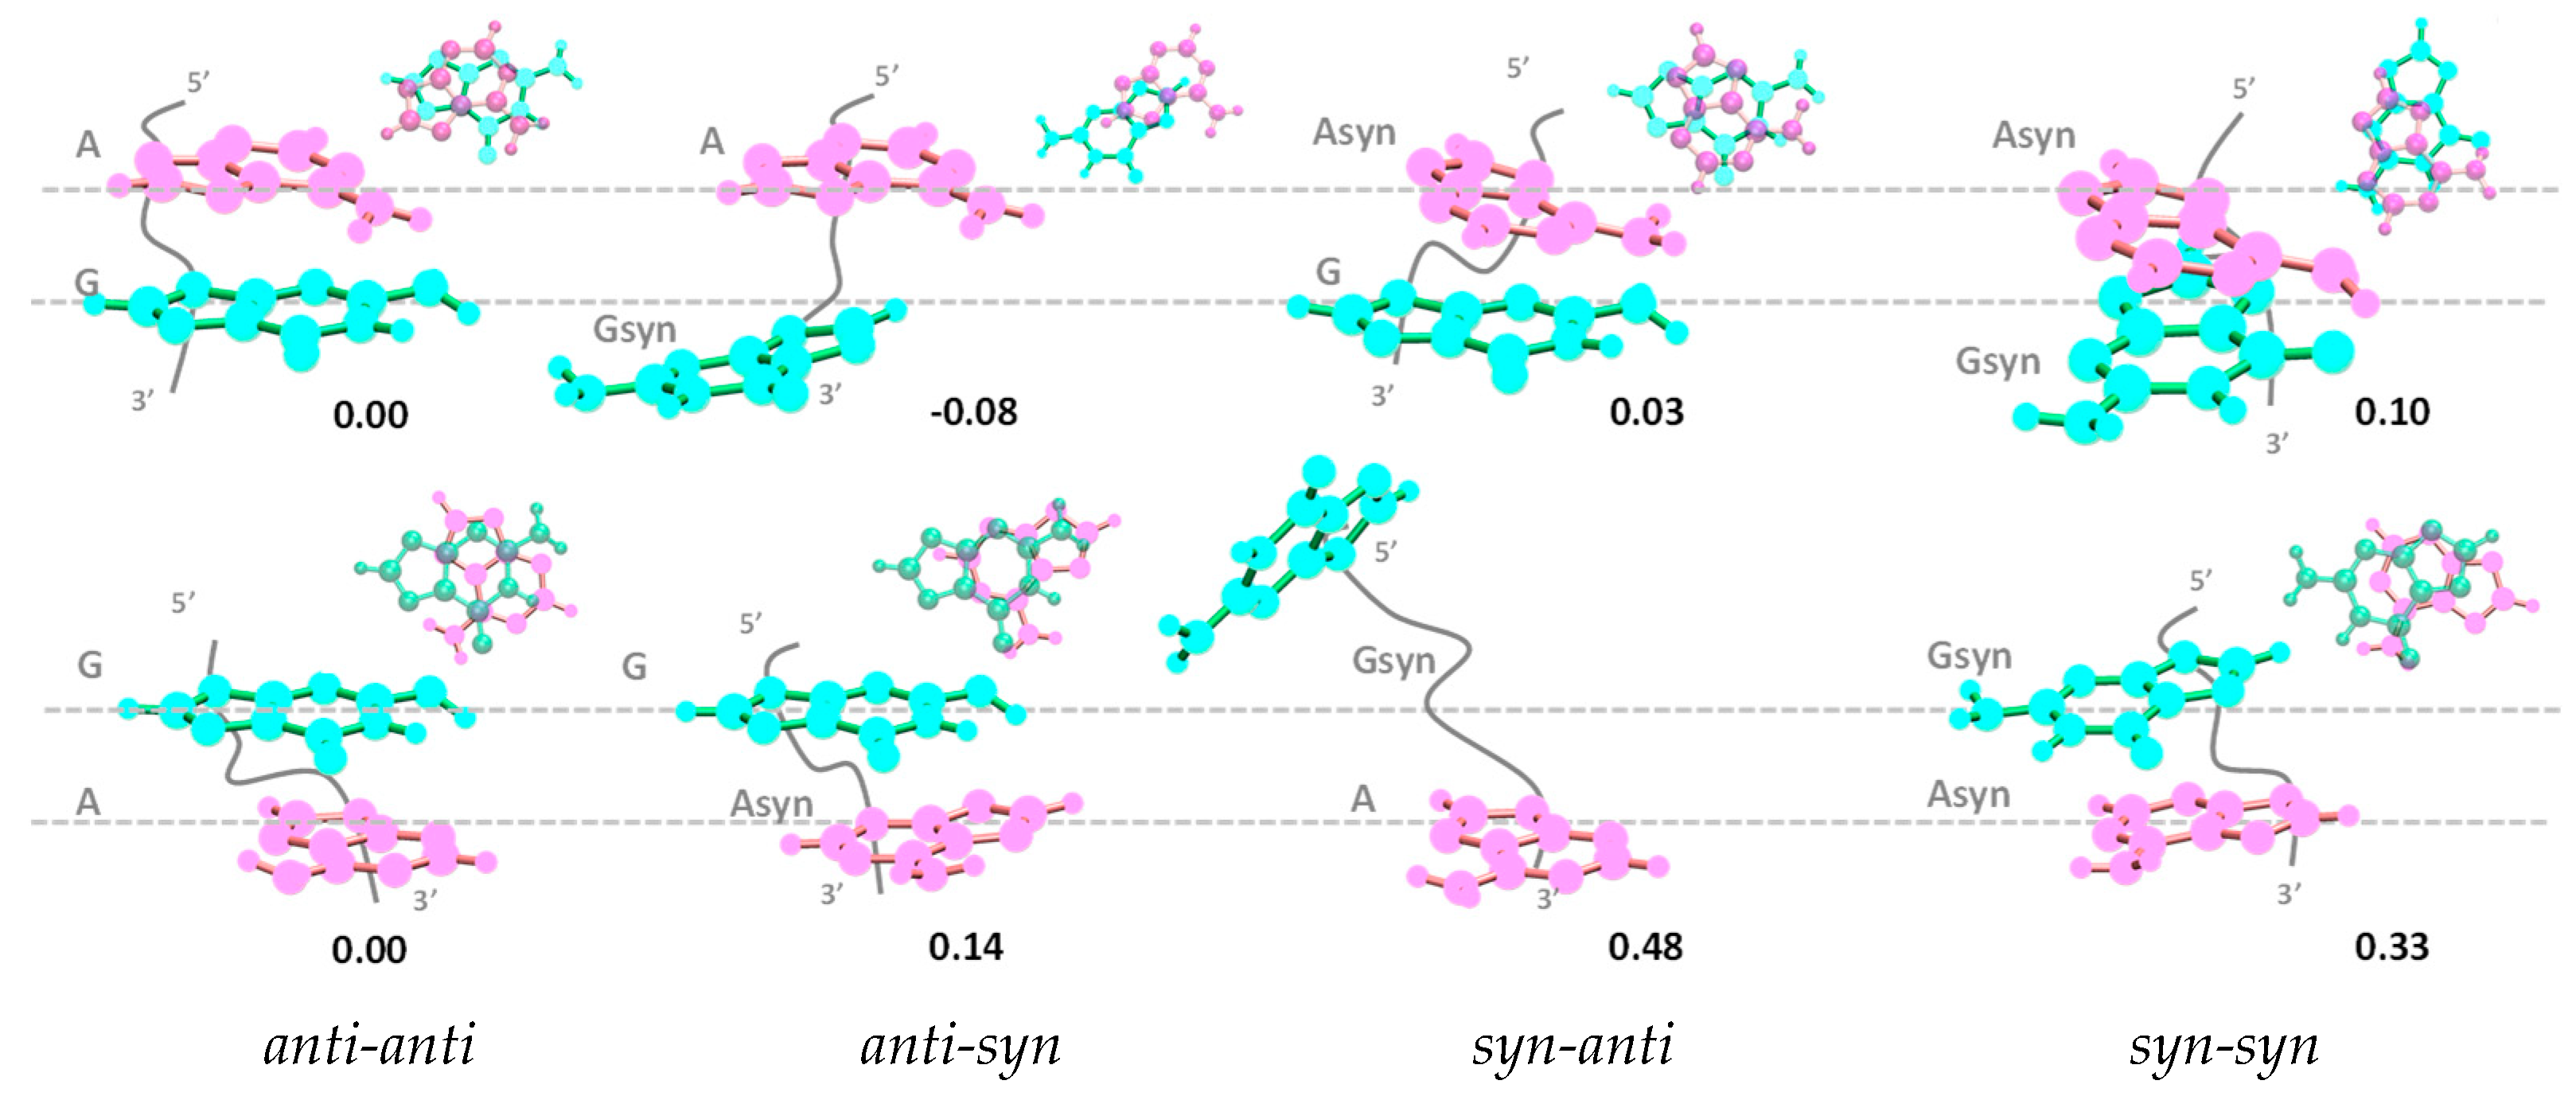
- Our computations on these systems showed that the stacking pattern corresponding to the most stable geometry of the studied systems depends on the dinucleotide polarity; while the anti-anti conformation present in B-form duplexes is adopted in GA, AG corresponds to the anti-syn configuration.
- ➢
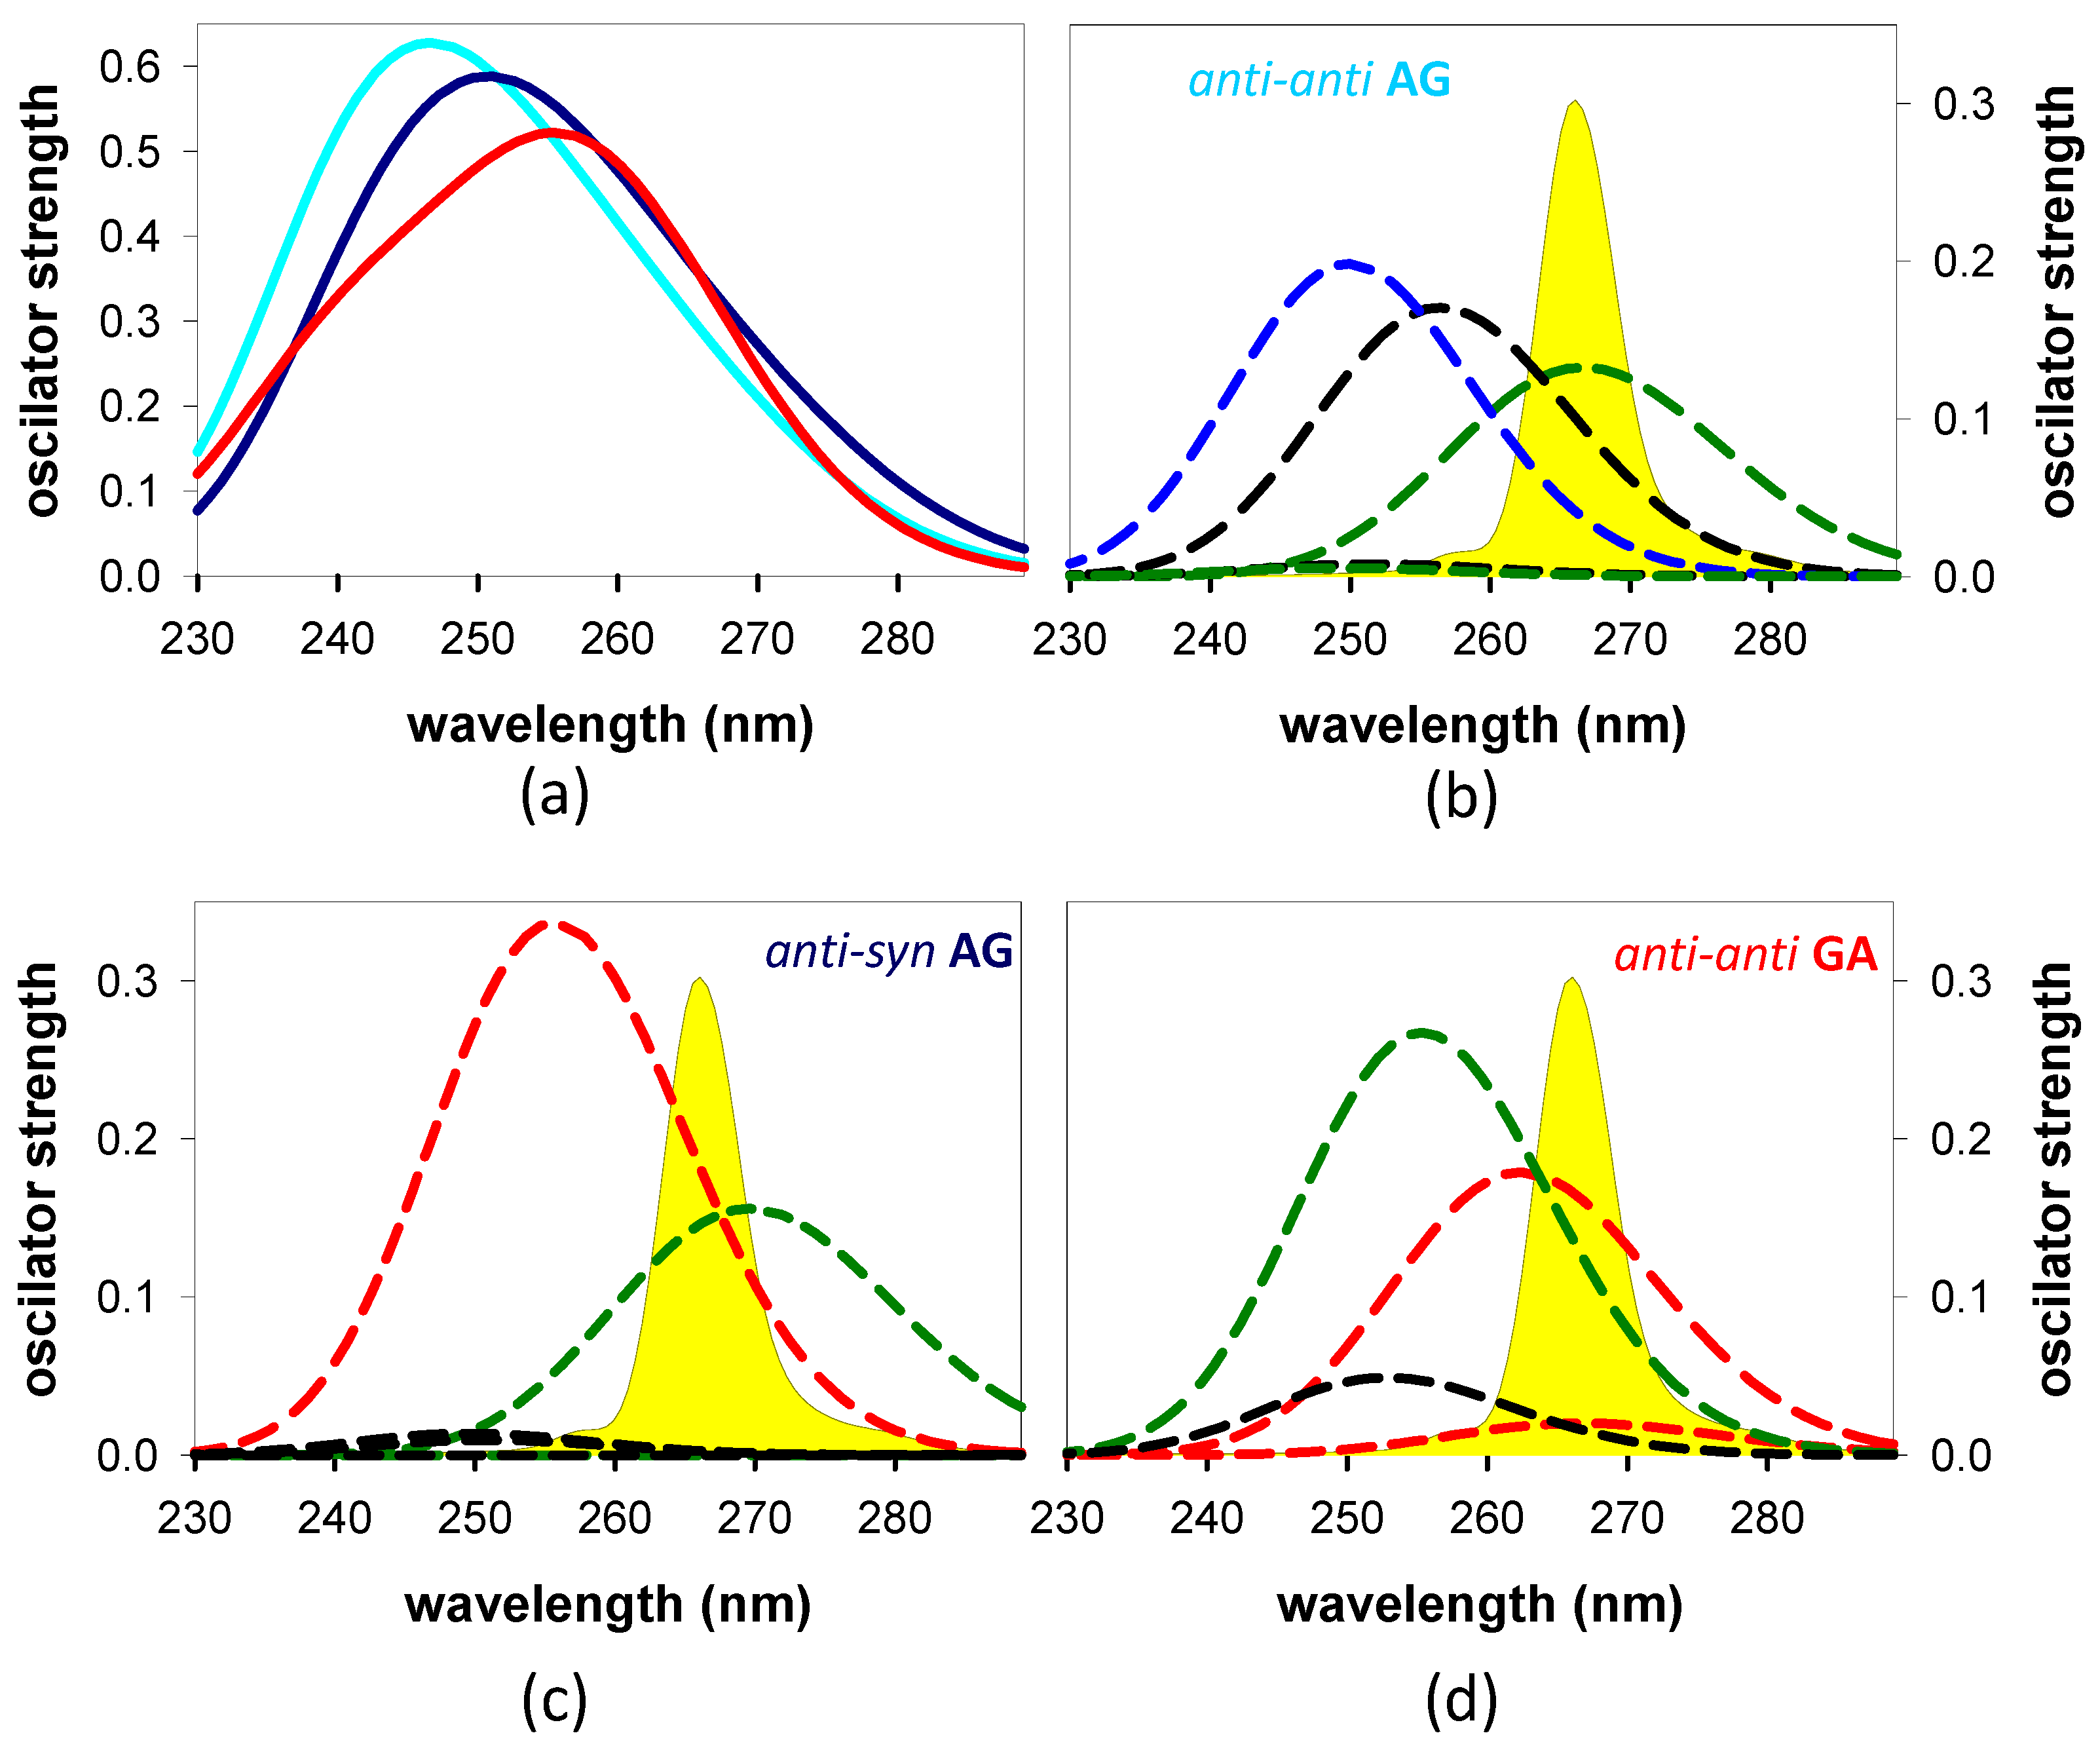
- The computed Franck–Condon states and their evolution depend both on the polarity and the stacking geometry.
- ➢
- The excited state minima predicted theoretically, min-CT, min-ππ*G(La), and min-nπ*A, were detected in the experimental TAS; they are reached within ~120 fs.
- ➢
- From the experimental TAS, we deduced that the largest portion of the nucleobases within the dinucleotides are electronically coupled in their ground state. This does not preclude the existence of a minimum localized on a single nucleobase, min-ππ*G(La), whose lifetime depends on the dinucleotide polarity.
- ➢
- As a result of the competition among the different relaxation paths, the quantum yields determined for the formation of the CT state are relatively low. The estimated upper values in AG and GA are 0.18 and 0.32, respectively.
- ➢
- From a methodological point of view, our computations showed that the TAS of the various excited states involved in the relaxation process exhibit different spectral shapes and oscillator strengths. This reason renders the use of the pre-exponential factors derived from fits of the TA signals inappropriate for the determination of their populations.
Supplementary Materials
Author Contributions
Funding
Institutional Review Board Statement
Informed Consent Statement
Data Availability Statement
Conflicts of Interest
References
- Becker, D.; Kumar, A.; Adhikary, A.; Sevilla, M.D. Gamma- and ion-beam DNA radiation damage: Theory and experiment. In DNA Damage, DNA Repair and Disease; Dizdaroglu, M., Stephen Lloyd, R., Eds.; Chemical Biology; RSC: Cambridge, UK, 2021; Volume 2, pp. 426–457. [Google Scholar]
- Candeias, L.P.; Steenken, S. Stucture and acid-base properties of one-electron-oxidized deoxyguanosine, guanosine, and 1-methylguanosine. J. Am. Chem. Soc. 1989, 111, 1094–1099. [Google Scholar] [CrossRef]
- O’Neill, P.; Parker, A.W.; Plumb, M.A.; Siebbeles, L.D.A. Guanine modifications following ionization of DNA occurs predominantly via intra- and not interstrand charge migration: An experimental and theoretical study. J. Phys. Chem. B 2001, 105, 5283–5290. [Google Scholar]
- Melvin, T.; Plumb, M.A.; Botchway, S.W.; Oneill, P.; Parker, A.W. 193 nm Light Induces Single-strand Breakage of DNA Predominantly at Guanine. Photochem. Photobiol. 1995, 61, 584–591. [Google Scholar] [CrossRef]
- Balanikas, E.; Banyasz, A.; Douki, T.; Baldacchino, G.; Markovitsi, D. Guanine Radicals Induced in DNA by Low-Energy Photoionization. Acc. Chem. Res. 2020, 53, 1511–1519. [Google Scholar] [CrossRef]
- Kawai, K.; Fujitsuka, M.; Majima, T. Selective guanine oxidation by UVB-irradiation in telomeric DNA. Chem. Commun. 2005, 1476–1477. [Google Scholar] [CrossRef] [PubMed]
- Balanikas, E.; Markovitsi, D. DNA photoionization: From high to low energies. In DNA Photodamage: From Light Absorption to Cellular Responses and Skin Cancer; Improta, R., Douki, T., Eds.; Comprehensive Series in Photochemical and Photobiological Science; RSC: Cambridge, UK, 2021; pp. 37–54. [Google Scholar]
- Candeias, L.P.; Oneill, P.; Jones, G.D.D.; Steenken, S. Iionization of polynucleotides and DNA in aqueous solution by 193 nm pulsed laser light—Identification of base-derived radicals. Int. J. Radiat. Biol. 1992, 61, 15–20. [Google Scholar] [CrossRef]
- Douki, T. Effect of denaturation on the photochemistry of pyrimidine bases in isolated DNA. J. Photochem. Photobiol B 2006, 82, 45–52. [Google Scholar] [CrossRef]
- Mouret, S.; Baudouin, C.; Charveron, M.; Favier, A.; Cadet, J.; Douki, T. Cyclobutane pyrimidine dimers are predominant DNA lesions in whole human skin exposed to UVA radiation. Proc. Natl. Acad. Sci. USA 2006, 103, 13765–13770. [Google Scholar] [CrossRef]
- Schroeder, C.A.; Pluharova, E.; Seidel, R.; Schroeder, W.P.; Faubel, M.; Slavicek, P.; Winter, B.; Jungwirth, P.; Bradforth, S.E. Oxidation Half-Reaction of Aqueous Nucleosides and Nucleotides via Photoelectron Spectroscopy Augmented by ab Initio Calculations. J. Am. Chem. Soc. 2015, 137, 201–209. [Google Scholar] [CrossRef]
- Pluharova, E.; Schroeder, C.; Seidel, R.; Bradforth, S.E.; Winter, B.; Faubel, M.; Slavicek, P.; Jungwirth, P. Unexpectedly Small Effect of the DNA Environment on Vertical Ionization Energies of Aqueous Nucleobases. J. Phys. Chem. Lett. 2013, 4, 3766–3769. [Google Scholar] [CrossRef]
- Pluharova, E.; Slavicek, P.; Jungwirth, P. Modeling Photoionization of Aqueous DNA and Its Components. Acc. Chem. Res. 2015, 48, 1209–1217. [Google Scholar] [CrossRef]
- Nogueira, J.J.; Plasser, F.; Gonzalez, L. Electronic delocalization, charge transfer and hypochromism in the UV absorption spectrum of polyadenine unravelled by multiscale computations and quantitative wavefunction analysis. Chem. Sci. 2017, 8, 5682–5691. [Google Scholar] [CrossRef] [PubMed]
- Plasser, F.; Aquino, A.; Lischka, H.; Nachtigallová, D. Electronic Excitation Processes in Single-Strand and Double-Strand DNA: A Computational Approach. Top. Curr. Chem. 2015, 356, 1–38. [Google Scholar] [PubMed]
- Spata, V.A.; Matsika, S. Role of Excitonic Coupling and Charge-Transfer States in the Absorption and CD Spectra of Adenine-Based Oligonucleotides Investigated through QM/MM Simulations. J. Phys. Chem. A 2014, 118, 12021–12030. [Google Scholar] [CrossRef] [PubMed]
- Santoro, F.; Improta, R.; Avila, F.; Segado, M.; Lami, A. The interplay between neutral exciton and charge transfer states in single-strand polyadenine: A quantum dynamical investigation. Photochem. Photobiol. Sci. 2013, 12, 1527–1543. [Google Scholar] [CrossRef] [PubMed]
- Aquino, A.J.A.; Nachtigallova, D.; Hobza, P.; Truhlar, D.G.; Hattig, C.; Lischka, H. The Charge-Transfer States in a Stacked Nucleobase Dimer Complex: A Benchmark Study. J. Comput. Chem. 2011, 32, 1217–1227. [Google Scholar] [CrossRef] [PubMed]
- Blancafort, L.; Voityuk, A.A. Exciton delocalization, charge transfer, and electronic coupling for singlet excitation energy transfer between stacked nucleobases in DNA: An MS-CASPT2 study. J. Chem. Phys. 2014, 140, 095102. [Google Scholar] [CrossRef] [PubMed]
- Improta, R.; Santoro, F.; Blancafort, L. Quantum Mechanical Studies on the Photophysics and the Photochemistry of Nucleic Acids and Nucleobases. Chem. Rev. 2016, 116, 3540–3593. [Google Scholar] [CrossRef]
- Chen, J.; Zhang, Y.; Kohler, B. Excited states in DNA strands investigated by ultrafast laser spectroscopy. Top. Curr. Chem. 2015, 356, 39–87. [Google Scholar]
- Schreier, W.J.; Gilch, P.; Zinth, W. Early Events of DNA Photodamage. Annu. Rev. Phys. Chem. 2015, 66, 497–519. [Google Scholar] [CrossRef]
- Kwok, W.M.; Ma, C.S.; Phillips, D.L. “Bright” and “Dark” excited states of an alternating AT oligomer characterized by femtosecond broadband spectroscopy. J. Phys. Chem. B 2009, 113, 11527–11534. [Google Scholar] [CrossRef] [PubMed]
- Bucher, D.B.; Pilles, B.M.; Carell, T.; Zinth, W. Charge separation and charge delocalization identified in long-living states of photoexcited DNA. Proc. Natl. Acad. Sci. USA 2014, 111, 4369–4374. [Google Scholar] [CrossRef]
- Kufner, C.L.; Crucilla, S.; Ding, D.; Stadlbauer, P.; Sponer, J.; Szostak, J.W.; Sasselov, D.D.; Szabla, R. Photoinduced charge separation and DNA self-repair depend on sequence directionality and stacking pattern. Chem. Sci. 2023, 15, 2158–2166. [Google Scholar] [CrossRef]
- Schiedt, J.; Weinkauf, R.; Neumark, D.M.; Schlag, E.W. Anion spectroscopy of uracil, thymine and the amino-oxo and amino-hydroxy tautomers of cytosine and their water clusters. Chem. Phys. 1998, 239, 511–524. [Google Scholar] [CrossRef]
- Balanikas, E.; Martinez-Fernadez, L.; Improta, R.; Podbevsek, P.; Baldacchino, G.; Markovitsi, D. The Structural Duality of Nucleobases in Guanine Quadruplexes Controls Their Low-Energy Photoionization. J. Phys. Chem. Lett. 2021, 12, 8309–8313. [Google Scholar] [CrossRef] [PubMed]
- Palecek, E.; Bartosik, M. Electrochemistry of Nucleic Acids. Chem. Rev. 2012, 112, 3427–3481. [Google Scholar] [CrossRef]
- Petropoulos, V.; Uboldi, L.; Maiuri, M.; Cerullo, G.; Martinez-Fernandez, L.; Balanikas, E.; Markovitsi, D. Effect of the DNA polarity on the relaxation of its electronic excited states. J. Phys. Chem. Lett. 2023, 14, 10219–10224. [Google Scholar] [CrossRef]
- Duchi, M.; O’Hagan, M.P.; Kumar, R.; Bennie, S.J.; Galan, M.C.; Curchod, B.F.E.; Oliver, T.A.A. Exploring ultraviolet photoinduced charge-transfer dynamics in a model dinucleotide of guanine and thymine. Phys. Chem. Chem. Phys. 2019, 21, 14407–14417. [Google Scholar] [CrossRef] [PubMed]
- Petropoulos, V.; Martinez-Fernandez, L.; Uboldi, L.; Maiuri, M.; Cerullo, G.; Balanikas, E.; Markovitsi, D. Real-time observation of sub-100-fs charge and energy transfer processes in DNA dinucleotides. Chem. Sci. 2024, 15, 12098–12107. [Google Scholar] [CrossRef]
- Ma, C.S.; Chan, R.C.-T.; Chan, C.T.-L.; Wong, A.K.-W.; Kwok, W.-M. Real-time Monitoring Excitation Dynamics of Human Telomeric Guanine Quadruplexes: Effect of Folding Topology, Metal Cation, and Confinement by Nanocavity Water Pool. J. Phys. Chem. Lett. 2019, 10, 7577–7585. [Google Scholar] [CrossRef]
- Martinez-Fernandez, L.; Changenet, P.; Banyasz, A.; Gustavsson, T.; Markovitsi, D.; Improta, R. A Comprehensive Study of Guanine Excited State Relaxation and Photoreactivity in G-Quadruplexes. J. Phys. Chem. Lett. 2019, 10, 6873–6877. [Google Scholar] [CrossRef]
- Takaya, T.; Su, C.; de La Harpe, K.; Crespo-Hernandez, C.E.; Kohler, B. UV excitation of single DNA and RNA strands produces high yields of exciplex states between two stacked bases. Proc. Natl. Acad. Sci. USA 2008, 105, 10285–10290. [Google Scholar] [CrossRef]
- Stuhldreier, M.C.; Temps, F. Ultrafast photo-initiated molecular quantum dynamics in the DNA dinucleotide d(ApG) revealed by broadband transient absorption spectroscopy. Faraday Disc. 2013, 163, 173–188. [Google Scholar] [CrossRef]
- Martínez-Fernández, L.; Green, J.A.; Esposito, L.; Jouybari, M.Y.; Zhang, Y.Y.; Santoro, F.; Kohler, B.; Improta, R. The photoactivated dynamics of dGpdC and dCpdG sequences in DNA: A comprehensive quantum mechanical study. Chem. Sci. 2024, 15, 9676–9693. [Google Scholar] [CrossRef]
- Kufner, C.L.; Zinth, W.; Bucher, D.B. UV-Induced Charge-Transfer States in Short Guanosine-Containing DNA Oligonucleotides. ChemBioChem 2020, 21, 2306–2310. [Google Scholar] [CrossRef] [PubMed]
- Black, P.J.; Bernhard, W.A. EPR Detection of an Electron Scavenging Contaminant in Irradiated Deoxyoligonucleotides: One-Electron Reduced Benzoyl. J. Phys. Chem. B 2011, 115, 8009–8013. [Google Scholar] [CrossRef] [PubMed]
- Baldassarri, E.; Ortore, M.G.; Spinozzi, F.; Round, A.; Ferrero, C.; Mariani, P. K+ vs. Na+ Effects on the Self-Assembly of Guanosine 5′-Monophosphate: A Solution SAXS Structural Study. Nanomaterials 2020, 10, 629. [Google Scholar] [CrossRef] [PubMed]
- Borrego-Varillas, R.; Ganzer, L.; Cerullo, G.; Manzoni, C. Ultraviolet Transient Absorption Spectrometer with Sub-20-fs Time Resolution. Appl. Sci. 2018, 8, 989. [Google Scholar] [CrossRef]
- Zhao, Y.; Schultz, N.E.; Truhlar, D.G. Design of density functionals by combining the method of constraint satisfaction with parametrization for thermochemistry, thermochemical kinetics, and noncovalent interactions. J. Chem. Theory Comput. 2006, 2, 364–382. [Google Scholar] [CrossRef]
- Zhao, Y.; Truhlar, D.G. Density functionals with broad applicability in chemistry. Acc. Chem. Res. 2008, 41, 157–167. [Google Scholar] [CrossRef]
- Tomasi, J.; Mennucci, B.; Cammi, R. Quantum mechanical continuum solvation models. Chem. Rev. 2005, 105, 2999–3093. [Google Scholar] [CrossRef] [PubMed]
- Martinez-Fernandez, L.; Esposito, L.; Improta, R. Studying the excited electronic states of guanine rich DNA quadruplexes by quantum mechanical methods: Main achievements and perspectives. Photochem. Photobiol. Sci. 2020, 19, 436–444. [Google Scholar] [CrossRef]
- Martinez-Fernandez, L.; Santoro, F.; Improta, R. Nucleic Acids as a Playground for the Computational Study of the Photophysics and Photochemistry of Multichromophore Assemblies. Acc. Chem. Res. 2022, 55, 2077–2087. [Google Scholar] [CrossRef]
- Frisch, M.J.; Trucks, G.W.; Schlegel, H.B.; Scuseria, G.E.; Robb, M.A.; Cheeseman, J.R.; Scalmani, G.; Barone, V.; Petersson, G.A.; Nakatsuji, H.; et al. Gaussian 16 Rev. C.01; Gaussian Inc.: Wallingford, CT, USA, 2016. [Google Scholar]
- Ferrer, F.J.A.; Cerezo, J.; Stendardo, E.; Improta, R.; Santoro, F. Insights for an Accurate Comparison of Computational Data to Experimental Absorption and Emission Spectra: Beyond the Vertical Transition Approximation. J. Chem. Theory Comput. 2013, 9, 2072–2082. [Google Scholar] [CrossRef] [PubMed]
- Bouvier, B.; Gustavsson, T.; Markovitsi, D.; Millié, P. Dipolar coupling between electronic transitions of the DNA bases and its relevance to exciton states in double helices. Chem. Phys. 2002, 275, 75–92. [Google Scholar] [CrossRef]
- Lu, T.; Chen, F.W. Multiwfn: A multifunctional wavefunction analyzer. J. Comput. Chem. 2012, 33, 580–592. [Google Scholar] [CrossRef]
- Karunakaran, V.; Kleinermanns, K.; Improta, R.; Kovalenko, S.A. Photoinduced dynamics of guanosine monophosphate in water from broad-band transient absorption spectroscopy and quantum-chemical calculations. J. Am. Chem. Soc. 2009, 131, 5839–5850. [Google Scholar] [CrossRef] [PubMed]
- Krul, S.E.; Hoehn, S.J.; Feierabend, K.J.; Crespo-Hernández, C.E. Excited state dynamics of 7-deazaguanosine and guanosine 5′-monophosphate. J. Chem. Phys. 2021, 154, 075103. [Google Scholar] [CrossRef]
- Wang, D.H.; Wang, X.L.; Jiang, Y.R.; Cao, S.M.; Jin, P.P.; Pan, H.F.; Sun, H.T.; Sun, Z.R.; Chen, J.Q. Excited State Dynamics of Methylated Guanosine Derivatives Revealed by Femtosecond Time-resolved Spectroscopy. Photochem. Photobiol. 2022, 98, 1008–1016. [Google Scholar] [CrossRef]
- Candeias, L.P.; Steenken, S. Electron adducts of adenine nucleosides and nucleotides in aqueous solution: Protonation at two carbon sites (C2 and C8) and Intra- and intermolecular catalysis by phosphate. J. Phys. Chem. 1992, 96, 937–944. [Google Scholar] [CrossRef]
- Candeias, L.P.; Steenken, S. Ionization of purine nucleosides and nucleotides and their components by 193-nm laser photolysis in aqueous solution: Model studies for oxidative damage of DNA. J. Am. Chem. Soc. 1992, 114, 699–704. [Google Scholar] [CrossRef]
- Stange, U.C.; Temps, F. Ultrafast electronic deactivation of UV-excited adenine and its ribo- and deoxyribonucleosides and -nucleotides: A comparative study. Chem. Phys. 2018, 515, 441–451. [Google Scholar] [CrossRef]
- Kwok, W.-M.; Ma, C.; Phillips, D.L. Femtosecond time- and wavelength-resolved fluorescence and absorption study of the excited states of adenosine and an adenine oligomer. J. Am. Chem. Soc. 2006, 128, 11894–11905. [Google Scholar] [CrossRef] [PubMed]
- Borrego-Varillas, R.; Cerullo, G.; Markovitsi, D. Exciton Trapping Dynamics in DNA Multimers. J. Phys. Chem. Lett. 2019, 10, 1639–1643. [Google Scholar] [CrossRef] [PubMed]
- Varsano, D.; Di Felice, R.; Marques, M.A.L.; Rubio, A. A TDDFT study of the excited states of DNA bases and their assemblies. J. Phys. Chem. B 2006, 110, 7129–7138. [Google Scholar] [CrossRef]
- Miannay, F.A.; Gustavsson, T.; Banyasz, A.; Markovitsi, D. Excited state dynamics of dGMP measured by steady-state and femtosecond fluorescence spectroscopy. J. Phys. Chem. A 2010, 114, 3256–3263. [Google Scholar] [CrossRef]
- Cheng, C.C.-W.; Ma, C.; Chan, C.T.-L.; Ho, K.Y.-F.; Kwok, W.-M. The solvent effect and identification of a weakly emissive state in nonradiative dynamics of guanine nucleosides and nucleotides—A combined femtosecond broadband time-resolved fluorescence and transient absorption study. Photochem. Photobiol. Sci. 2013, 12, 1351–1365. [Google Scholar] [CrossRef]
- Ortín-Fernández, J.; González-Vázquez, J.; Martínez-Fernández, L.; Corral, I. Molecular Identification of the Transient Species Mediating the Deactivation Dynamics of Solvated Guanosine and Deazaguanosine. Molecules 2022, 27, 989. [Google Scholar] [CrossRef]

| G-Quadruplex 1 | Φi × 103 [27] | Dinucleotide 2 | τCT (ps) |
|---|---|---|---|
| 4 × (5′-GGGGA-3′) | 12.6 ± 0.1 | GA | 170 ± 10 [29] |
| 4 × (5′-AGGGG-3′) | 9.9 ± 0.4 | AG | 112 ± 12 [29] |
| 4 × (5′-GGGGT-3′) | 8.8 ± 0.2 | GT | 13 ± 1 [30] |
| 4 × (5′-TGGGG-3′) | 4.7 ± 0.7 | TG | 5.44 ± 0.03 [31] |
| AG | GA |
|---|---|
| 105 ± 30 (267 nm/252 nm) 1 [34] | - |
| 124 ± 4 (260 nm/330–680 nm) 2 [35] | - |
| 280 ± 160 (266 nm/1500–1700 cm−1) 3 [37] | 420 ± 120 (266 nm/1500–1700 cm−1) 4 [37] |
| 112 ± 12 (266 nm/330–680 nm) [29] | 170 ± 10 (266 nm/500–645 nm) [29] |
Disclaimer/Publisher’s Note: The statements, opinions and data contained in all publications are solely those of the individual author(s) and contributor(s) and not of MDPI and/or the editor(s). MDPI and/or the editor(s) disclaim responsibility for any injury to people or property resulting from any ideas, methods, instructions or products referred to in the content. |
© 2024 by the authors. Licensee MDPI, Basel, Switzerland. This article is an open access article distributed under the terms and conditions of the Creative Commons Attribution (CC BY) license (https://creativecommons.org/licenses/by/4.0/).
Share and Cite
Petropoulos, V.; Martinez-Fernandez, L.; Uboldi, L.; Maiuri, M.; Cerullo, G.; Balanikas, E.; Markovitsi, D. Factors Affecting the Population of Excited Charge Transfer States in Adenine/Guanine Dinucleotides: A Joint Computational and Transient Absorption Study. Biomolecules 2024, 14, 1548. https://doi.org/10.3390/biom14121548
Petropoulos V, Martinez-Fernandez L, Uboldi L, Maiuri M, Cerullo G, Balanikas E, Markovitsi D. Factors Affecting the Population of Excited Charge Transfer States in Adenine/Guanine Dinucleotides: A Joint Computational and Transient Absorption Study. Biomolecules. 2024; 14(12):1548. https://doi.org/10.3390/biom14121548
Chicago/Turabian StylePetropoulos, Vasilis, Lara Martinez-Fernandez, Lorenzo Uboldi, Margherita Maiuri, Giulio Cerullo, Evangelos Balanikas, and Dimitra Markovitsi. 2024. "Factors Affecting the Population of Excited Charge Transfer States in Adenine/Guanine Dinucleotides: A Joint Computational and Transient Absorption Study" Biomolecules 14, no. 12: 1548. https://doi.org/10.3390/biom14121548
APA StylePetropoulos, V., Martinez-Fernandez, L., Uboldi, L., Maiuri, M., Cerullo, G., Balanikas, E., & Markovitsi, D. (2024). Factors Affecting the Population of Excited Charge Transfer States in Adenine/Guanine Dinucleotides: A Joint Computational and Transient Absorption Study. Biomolecules, 14(12), 1548. https://doi.org/10.3390/biom14121548