Article

The MNN2 Gene Knockout Modulates the Antifungal Resistance of Biofilms of Candida glabrata

1
CEB, Centre of Biological Engineering, LIBRO—Laboratório de Investigação em Biofilmes Rosário Oliveira, University of Minho, 4710-057 Braga, Portugal
2
Biosciences, College of Life and Environmental Sciences, University of Exeter, Exeter EX4 4QD, Devon, UK
*
Author to whom correspondence should be addressed.
Biomolecules 2018, 8(4), 130; https://doi.org/10.3390/biom8040130
Submission received: 10 September 2018 / Revised: 26 October 2018 / Accepted: 26 October 2018 / Published: 30 October 2018

Abstract

:
Candida glabrata biofilms are recognized to have high resistance to antifungals. In order to understand the effect of mannans in the resistance profile of C. glabrata mature biofilms, C. glabrata Δmnn2 was evaluated. Biofilm cell walls were analysed by confocal laser scanning microscopy (CLSM) and their susceptibility was assessed for fluconazole, amphotericin B, caspofungin, and micafungin. Crystal violet and Alcian Blue methods were performed to quantify the biomass and the mannans concentration in the biofilm cells and matrices, respectively. The concentration of β-1,3 glucans was also measured. No visible differences were detected among cell walls of the strains, but the mutant had a high biomass reduction, after a drug stress. When compared with the reference strain, it was detected a decrease in the susceptibility of the biofilm cells and an increase of β-1,3 glucans in the C. glabrata Δmnn2. The deletion of the MNN2 gene in C. glabrata induces biofilm matrix and cell wall variabilities that increase the resistance to the antifungal drug treatments. The rise of β-1,3 glucans appears to have a role in this effect.

1. Introduction

In opposition to Candida albicans and other Candida species, Candida glabrata grows only as blastoconidia, and has a haploid genome [1]. Despite being a part of the natural human microflora, under circumstances where the host immune system becomes severely compromised (e.g., chemotherapy, traumas), C. glabrata can invade epithelial cells, disseminating via the bloodstream, causing systemic diseases [1,2]. In fact, fungal diseases associated with non-Candida albicans Candida (NCAC) species have been globally increasing [3,4]. The frequency rates of candidemia attributed to C. glabrata are about 15% of all Candida species-related systemic bloodstream infections [5,6], which is particularly relevant since, compared with other Candida species infections, the mortality rate associated with C. glabrata is the highest (30%) [1,7]. As a matter of fact, the biofilm formation is a very important virulence factor for C. glabrata, allowing the yeasts to adhere to biotic and abiotic surfaces, developing into organized communities that are extremely refractory to antifungal treatment and environmental conditions [8].
The yeast cell wall is a dynamic structural organelle crucial for protection against hostile environments, maintaining cell shape, assisting adherence to host surfaces, and having a fundamental role for fungus-host interactions and immune recognition [2,9]. Per se, it is very likely to play an important part in mediating several interactions and hence virulence [9]. The cell wall is comprised of an internal central core of β-1,3 glucans and β-1,6 glucans linked to chitin via β-1,4 glucans, extended throughout the entire depth of the cell wall structure [10,11]. There is also an external layer of highly glycosylated mannoproteins [10,12], which play a major role in host recognition, adhesion, cell wall integrity, and include up to 40% of the cell wall dry weight [13,14]. These proteins are adorned with both N- and O-linked sugars, mainly mannans, and can end in the accumulation of up to 200 mannose units [9,15], attached via a phosphodiester linkage (phosphomannan) [16]. The number of mannans units and their molecular weights highly fluctuate between species [17], which have important consequences for host-fungus interactions [2,9]. Structural studies point out that C. glabrata mannan is more closely related to that of Saccharomyces cerevisiae than to C. albicans [18]. Even though, the core of the biosynthetic machinery appears to be relatively well conserved [9]. The N-linked protein glycosylation occurs in two stages. Concisely, in the first, proteins transverse though the endoplasmic reticulum, resulting in the mature N-mannan core, Man8GlcNAc2 [19]; in the second, a α-1,6-backbone is attached to a Och1 core and Mnn9 and added with side chains consisting of α-1,2-, and α-1,3-mannose residues, with the α-1,2-mannose extending out from the backbone [20]. It is recognised that the deletion of ScMNN2 inhibits the accumulation of α-1,2-mannose onto the mannan backbone, hence stopping the elaboration of N-mannan outer chains [21]. In C. albicans, this greatly conditions the growth, cell morphology, and immune recognition [20]. Several mannosyltransferases involved in mannan biosynthesis in S. cerevisiae, have been identified, and many of these enzymes are conserved in C. albicans and other pathogenic fungi. Remarkably, many of these fungal mannosyltransferases are absent from human cells, and thus its study shows prospective in the development of novel antifungals and vaccines. Yet, this subject is more advanced in S. cerevisiae and C. albicans, but little is known regarding the role in the pathogenesis of C. glabrata, especially in biofilms.
This work aims to evaluate and to understand the responsibility of mannans on the biofilm resistance of antifungals in C. glabrata, through the effect of a MNN2 knock out (KO)–a putative component of the N-linked glycosylation machinery on matured biofilm cells, on their cell wall and after different drug stresses.

2. Material and Methods

2.1. Organisms

Three strains of C. glabrata were used in the course of this study. One reference strain from the American Type Culture Collection (C. glabrata ATCC2001) and two strains kindly provided by Dr. Ken Haynes from the University of Exeter (United Kingdom) [9]: the C. glabrata mutant with a MNN2 gene disruption (C. glabrata Δmnn2) and its parent strain (C. glabrata ΔHT6) (see Table S1 of Supplementary Material). The effect of the revertant strain was already stated and reported previously by Dr. Ken Haynes lab [9].
The identity of all isolates was confirmed using CHROMagar Candida (CHROMagar, Paris, France) and by PCR-based sequencing [22]. The PCR products were sequenced using the ABI-PRISM Big Dye terminator cycle sequencing kit (Perkin Elmer, Applied Biosystems, Warrington, UK).

2.2. Growth Conditions

For each experiment, C. glabrata ATCC2001 and C. glabrata ΔHT6 strains were subcultured on Sabouraud dextrose agar (SDA) (Merck, Darmstadt, Germany) and the mutant C. glabrata Δmnn2 was cultured on SD-his, as indicated by West et al. [9], during 24 h at 37 °C. Cells were then inoculated in Sabouraud dextrose broth (SDB, Merck) and incubated for 18 h at 37 °C under agitation at 120 rpm. After incubation, the cells were harvested by centrifugation at 3000 g for 10 min at 4 °C and washed twice with phosphate buffered saline (PBS 0.1M, pH = 7.5). Pellets were then suspended in RPMI-1640 (Sigma-Aldrich, Roswell Park, St. Louis, MO, USA) and the cellular density was adjusted to 1 × 10⁵ cells/mL, using a Neubauer counting chamber.

2.3. Antifungal Drugs

Fluconazole (Flu), caspofungin (Csf) and micafungin (Mcf) were kindly provided by Pfizer, S.A. (New York, NY, USA), MSD (Kenilworth, NJ, USA) and Astellas (Tokyo, Japan) respectively, in its pure compound. Amphotericin B (AmB) was purchased in Sigma. Aliquots of 5000 mg/L were prepared using dimethyl-sulfoxide (DMSO). The final concentrations used were prepared with RPMI-1640.

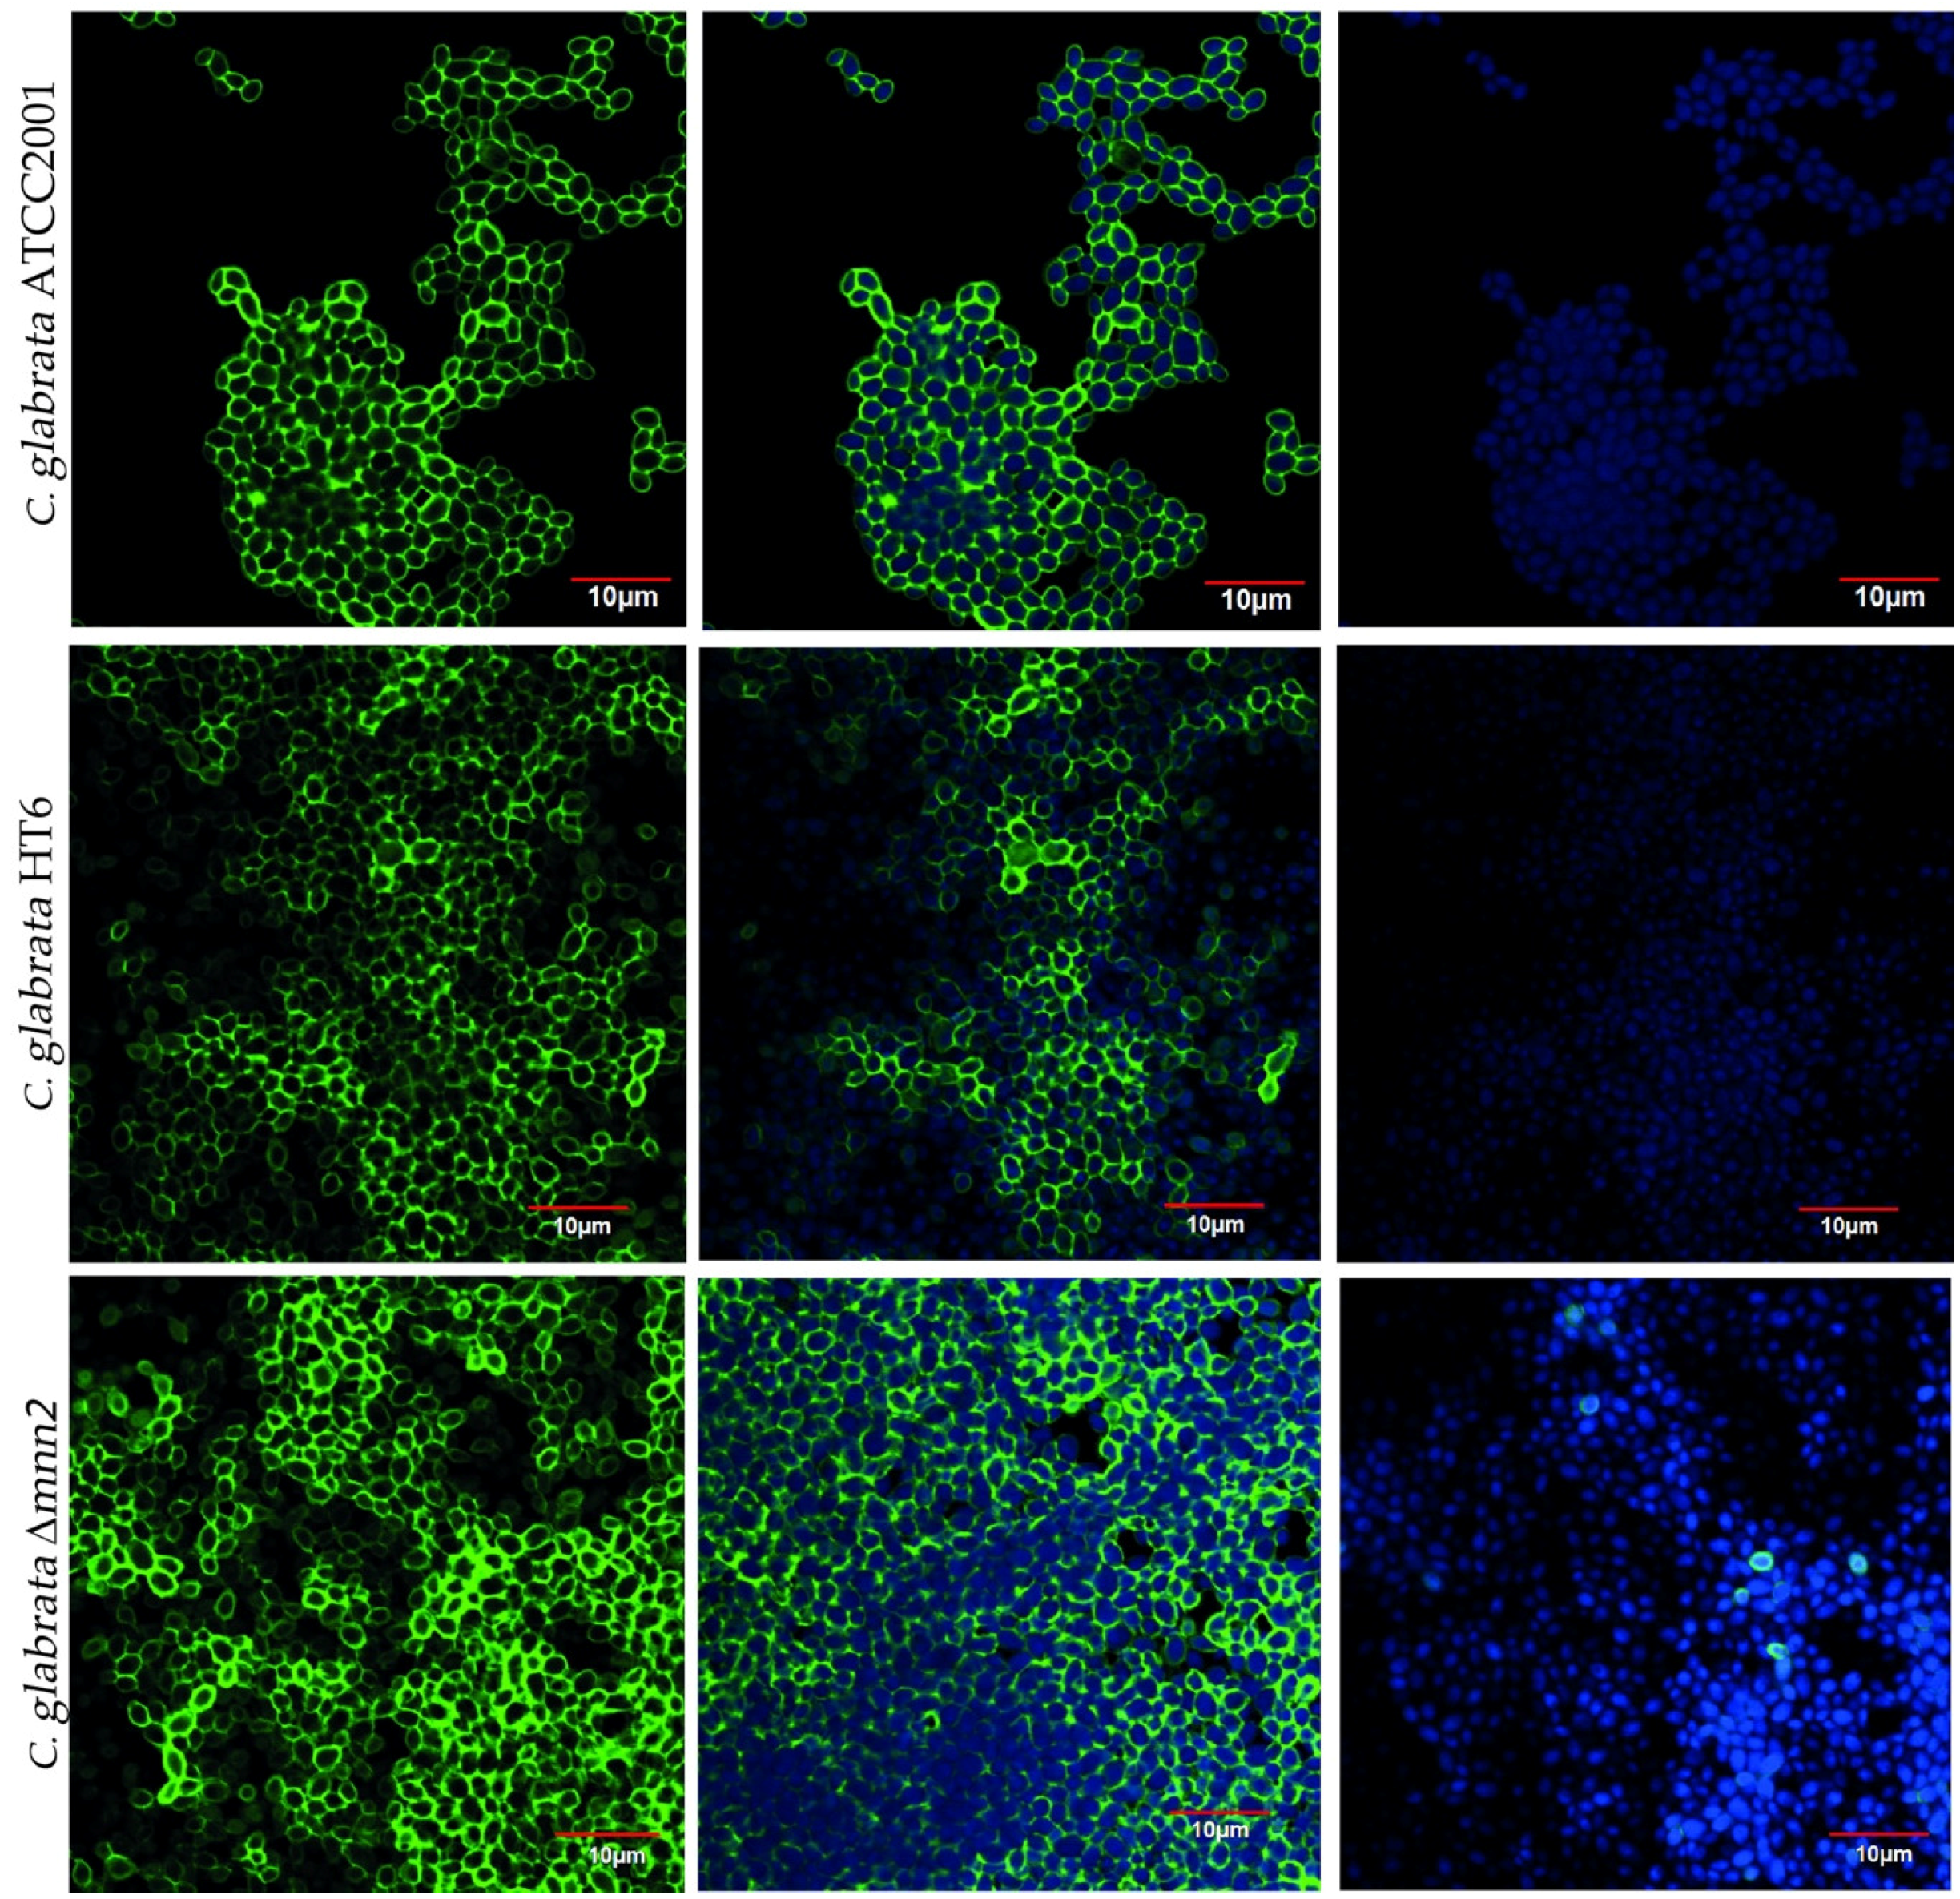
2.4. Biofilm Matrix Structure: Confocal Laser Scanning Microscopy

Biofilms were formed in 24-well polystyrene microtiter plates (Orange Scientific, Braine-l’Alleud, Belgium), on plastic highly adhesive round tissue culture coverslips (13 mm diameter, Sarstedt, Germany). For this, 1000 µL of yeast cell suspension (1 × 10⁵ cells/mL in RPMI-1640) were added to each well and the biofilms performed as described previously [23]. After 24 h, 500 µL of RPMI medium was removed and an equal volume of fresh RPMI with or without the antifungal agents was added.
The staining and confocal laser scanning microscopy (CLSM) were performed similarly to a method described previously [24]. Biofilms were fixed in 4% (w/v) of paraformaldehyde (Sigma-Aldrich) followed by 50% (v/v) ethanol for 10 min at room temperature and allowed to air dry. Then, to stain the α-mannopyranosyl residues of the glycosylated mannoproteins (that is, mannans) of the cells, they were overlayed with 25 μg/mL Concanavalin A-Alexa Fluor 488 conjugate (ThermoFisher Scientific, Bartlesville, OK, USA) in the dark for 10 min at room temperature [10,12,25]. For cell nucleus detection, the cells were stained with 100 mg/L of 4′,6-diamidino-2-phenylindole (DAPI, ThermoFisher Scientific) for 10 min at room temperature.
After this, the preparation was washed with water and allowed to air dry. Finally, the sample was immediately observed using the CLSM (Olympus BX61, Model FluoView 1000, Tokyo, Japan). Images were acquired with the program FV10-ASW 4.2 (Olympus) using a magnification of ×100.

2.5. Biofilm Antifungal Susceptibility Tests

The antifungal susceptibility tests were performed using the microdilution method, in accordance to the European Committee on Antimicrobial Susceptibility Testing guidelines [26,27].
The Minimum Biofilm Eradication Concentration (MBECs), that were previously determined for C. glabrata ATCC2001 for all drugs (Flu, AmB, Csf, and Mcf) [27,28], was used to evaluate the biofilm susceptibility of C. glabrata Δmnn2 and the parent strain, C. glabrata ΔHT6. For that, standardized cell suspensions (200 μL) were placed into selected wells of 96-wells polystyrene microtiter plates (Orange Scientific). RPMI-1640 was used without cells, but with antifungal agent, as a negative control. As positive control, cell suspensions were tested without antifungal agent. At 24 h, 100 μL of RPMI-1640 was removed and an equal volume of fresh RPMI-1640 plus the respective antifungal concentration were added (Flu: 1250 mg/L; AmB: 4 mg/L; Csf: 3 mg/L; Mcf: 17 mg/L–2x concentrated). The plates were incubated at 37 °C for more 24 h, a total of 48 h, at 120 rpm. The number of cultivable cells on biofilms was determined by the enumeration of colony forming units (CFUs). For that, after the period of biofilm formation, all medium was aspired and the biofilms washed once with 200 μL of PBS to remove non-adherent cells. Then, biofilms were scraped from the wells and the suspensions were vigorously vortexed for 2 min to disaggregate cells from the matrix. Serial decimal dilutions in PBS were plated on SDA and incubated for 24 h at 37 °C [29]. The results were presented in percentage of biofilm cell reduction.
Total biofilm biomass was quantified by Crystal Violet (CV) staining [28]. After biofilms formation, the medium was aspirated and non-adherent cells removed by washing the biofilms with sterile ultra-pure water. Then, biofilms were fixed with 200 μL methanol, which was removed after 15 min of contact. The microtiter plates were allowed to dry at room temperature, and 200 μL of CV (1% v/v) were added to each well and incubated for 5 min. Then, wells were gently washed twice with sterile, ultra-pure water and 200 μL of acetic acid (33% v/v) were added to release and dissolve the stain. The absorbance of the obtained solution was read in a microtiter plate reader (Bio-Tek Synergy HT, Izasa, Lisbon, Portugal) at 570 nm. The results were presented as absorbance per unit area (Abs/cm2).

2.6. Effect of the Antifungals on Biofilm Cells’ Walls and on Biofilm Matrix Composition

2.6.1. Matrix Extraction Method

Biofilms were formed as explained above. After 48 h, biofilms were scraped from the 24-well plates, resuspended in ultra-pure water, sonicated (Ultrasonic Processor, Cole-Parmer, IL, USA) for 30 s at 30 W, and then the suspension vortexed for 2 min. The suspension was centrifuged at 5000 g for 5 min at 4 °C and the supernatant filtered through a 0.2 μm nitrocellulose filter. The pellets were dried at 37 °C until a constant dry biofilm weight was achieved.

2.6.2. Quantification of Mannans on Biofilm Cells and on Biomass—Quantitative Alcian Blue Binding Assay

Alcian Blue assay was performed according previously described by Odani et al. [30] with slight adjustments [24]. Regarding the mannans on cell membranes, biofilms of C. glabrata strains were grown as previously described, scraped and sonicated (Ultrasonic Processor) for 30 s at 30 W, and then the suspension vortexed for 2 min, to separate cells form the biofilm matrices. Next, the isolated cells were washed with deionized water, the OD600 read and adjusted at an OD600 of 0.6 in deionized water. Afterwards, the cells were washed with 0.02 N HCl (pH = 3), the pellet was suspended in 1 mL of 30 μg/mL Alcian blue dye dissolved in 0.02 N HCl (pH = 3) and incubated for 10 min at room temperature. Then, the cells were pelleted and evaluated for dye binding. To quantify dye binding and dye remaining in the supernatant after binding the stain was measured spectrophotometrically at 600 nm. To calculate the Alcian Blue Binding the following equations were used:
Amount of dye adsorbed to the cells (T): T (μg) = 61.3 × (OD600 ori − OD600 sup) (OD600 ori—OD of the Alcian Blue Dye working solution; OD600 sup—OD of the supernatant);
Alcian Blue Binding (μg/OD600) = (T × d)/OD600 c.c.
(ODc.c.—the exact OD reading; d—dilution factor).

2.6.3. Alcian Blue Quantitative Assay on Biofilms

To measure the relative percentage of mannans on biofilm (total biomass), the medium with planktonic cells was all removed from the well and the biofilm was washed with 0.02 N HCl (pH = 3). Next, the biofilm was scraped, suspended in 1 mL of 30 μg/mL Alcian blue dye dissolved in 0.02 N HCl (pH = 3), incubated for 10 min at room temperature and pelleted for evaluation of dye binding. To calculate relative percentage of mannans on biofilm the following equation was used:
% mannans on biofilm: [(OD600 oriOD600 sup)/OD600 ori] × 100
(OD600 ori—OD of the Alcian Blue Dye working solution; OD600 sup—OD of the supernatant).

2.6.4. Isolation of Candida glabrata Biofilm Cells Walls

Cell wall fractionation was performed as described by Pitarch et al. [31] with slight modifications. For that, biofilms were prepared as described above. C. glabrata biofilm cells were collected by centrifugation, washed two times with PBS and sonicated at 30 W for 30 s, in order to allow separation of the cells from matrix. Next, biofilm cells were separated by centrifugation at 5000 g for 5 min in a cell wall fraction (pellet) and a soluble cytoplasmic fraction (supernatant). Following this, the cell wall fraction was dissolved in 500 μL of buffer with phenylmethylsulfonyl fluoride (PMSF) (1 mM) and transferred to “lysis” tube with 500 μL of glass beads for the cells disruption of the cells in the FastPrep (MP, Biomedicals, Illkirch-Graffenstaden, France) at maximum speed for 30 s. The “lysis” tube was placed in a mixture of ice and water for 30 s. These steps were repeated seven more times. This procedure was carried out until complete cell breakage, verified beforehand by phase-contrast microscopic examinations and a posteriori by the failure of cells to grow on YPD-chloramphenicol plates. Then, the samples were transferred to microcentrifuge tubes and spin in microfuge centrifuge at 4 °C for 3 min at 2500 g. Hereafter, the isolated cell walls were washed with solutions of decreasing concentrations of NaCl (five times with each of the following ice-cold solutions: 5% NaCl, 2% NaCl, 1% NaCl, and 1 mM PMSF) to remove any extracellular or cytosolic protein contaminants that might be adhered to the cell walls through electrostatic forces. The supernatant was transferred to fresh microfuge tubes and centrifuged at 4 °C for 10 min at 10,000× g. The supernatants were finally transferred to fresh tubes.

2.6.5. β-1,3 glucans Concentration Determination

The β-1,3 glucans concentration was determined using Glucatell kit (Cape Cod, East Falmouth, MA, USA). The values were normalized per dry weight of biofilm on biofilm matrices and per pg/mL of β-1,3 glucans on biofilm cells.

2.7. Statistical Analysis

The experiments were performed in triplicate and in three independent assays. The results were compared using one-way analysis of variance (ANOVA), Tukey’s post hoc multiple comparisons tests, using GraphPad Prism 7 software (GraphPad Software, San Diego, CA, USA). All tests were performed with a confidence level of 95%.

3. Results

First, with the purpose of visualizing the effect of the MNN2 gene KO on C. glabrata cell walls, the biofilms were observed microscopically by CLSM (Figure 1). The images of the 48-h-biofilms of C. glabrata ATCC2001, C. glabrata Δmnn2, and C. glabrata ΔHT6 showed that the gene deletion, apparently, had no effect on the cell wall, since there were no relevant differences among the three strains (Figure 1). All strains demonstrated to have good biofilm forming capacity, composed by yeasts in a continuous carpet [23,32,33] (Figure 1). Yet and curiously, C. glabrata Δmnn2 and C. glabrata ΔHT6 exhibited higher amount of multilayer structures, whereas C. glabrata ATCC2001 showed a less amount of yeast cells forming these structures (Figure 1).

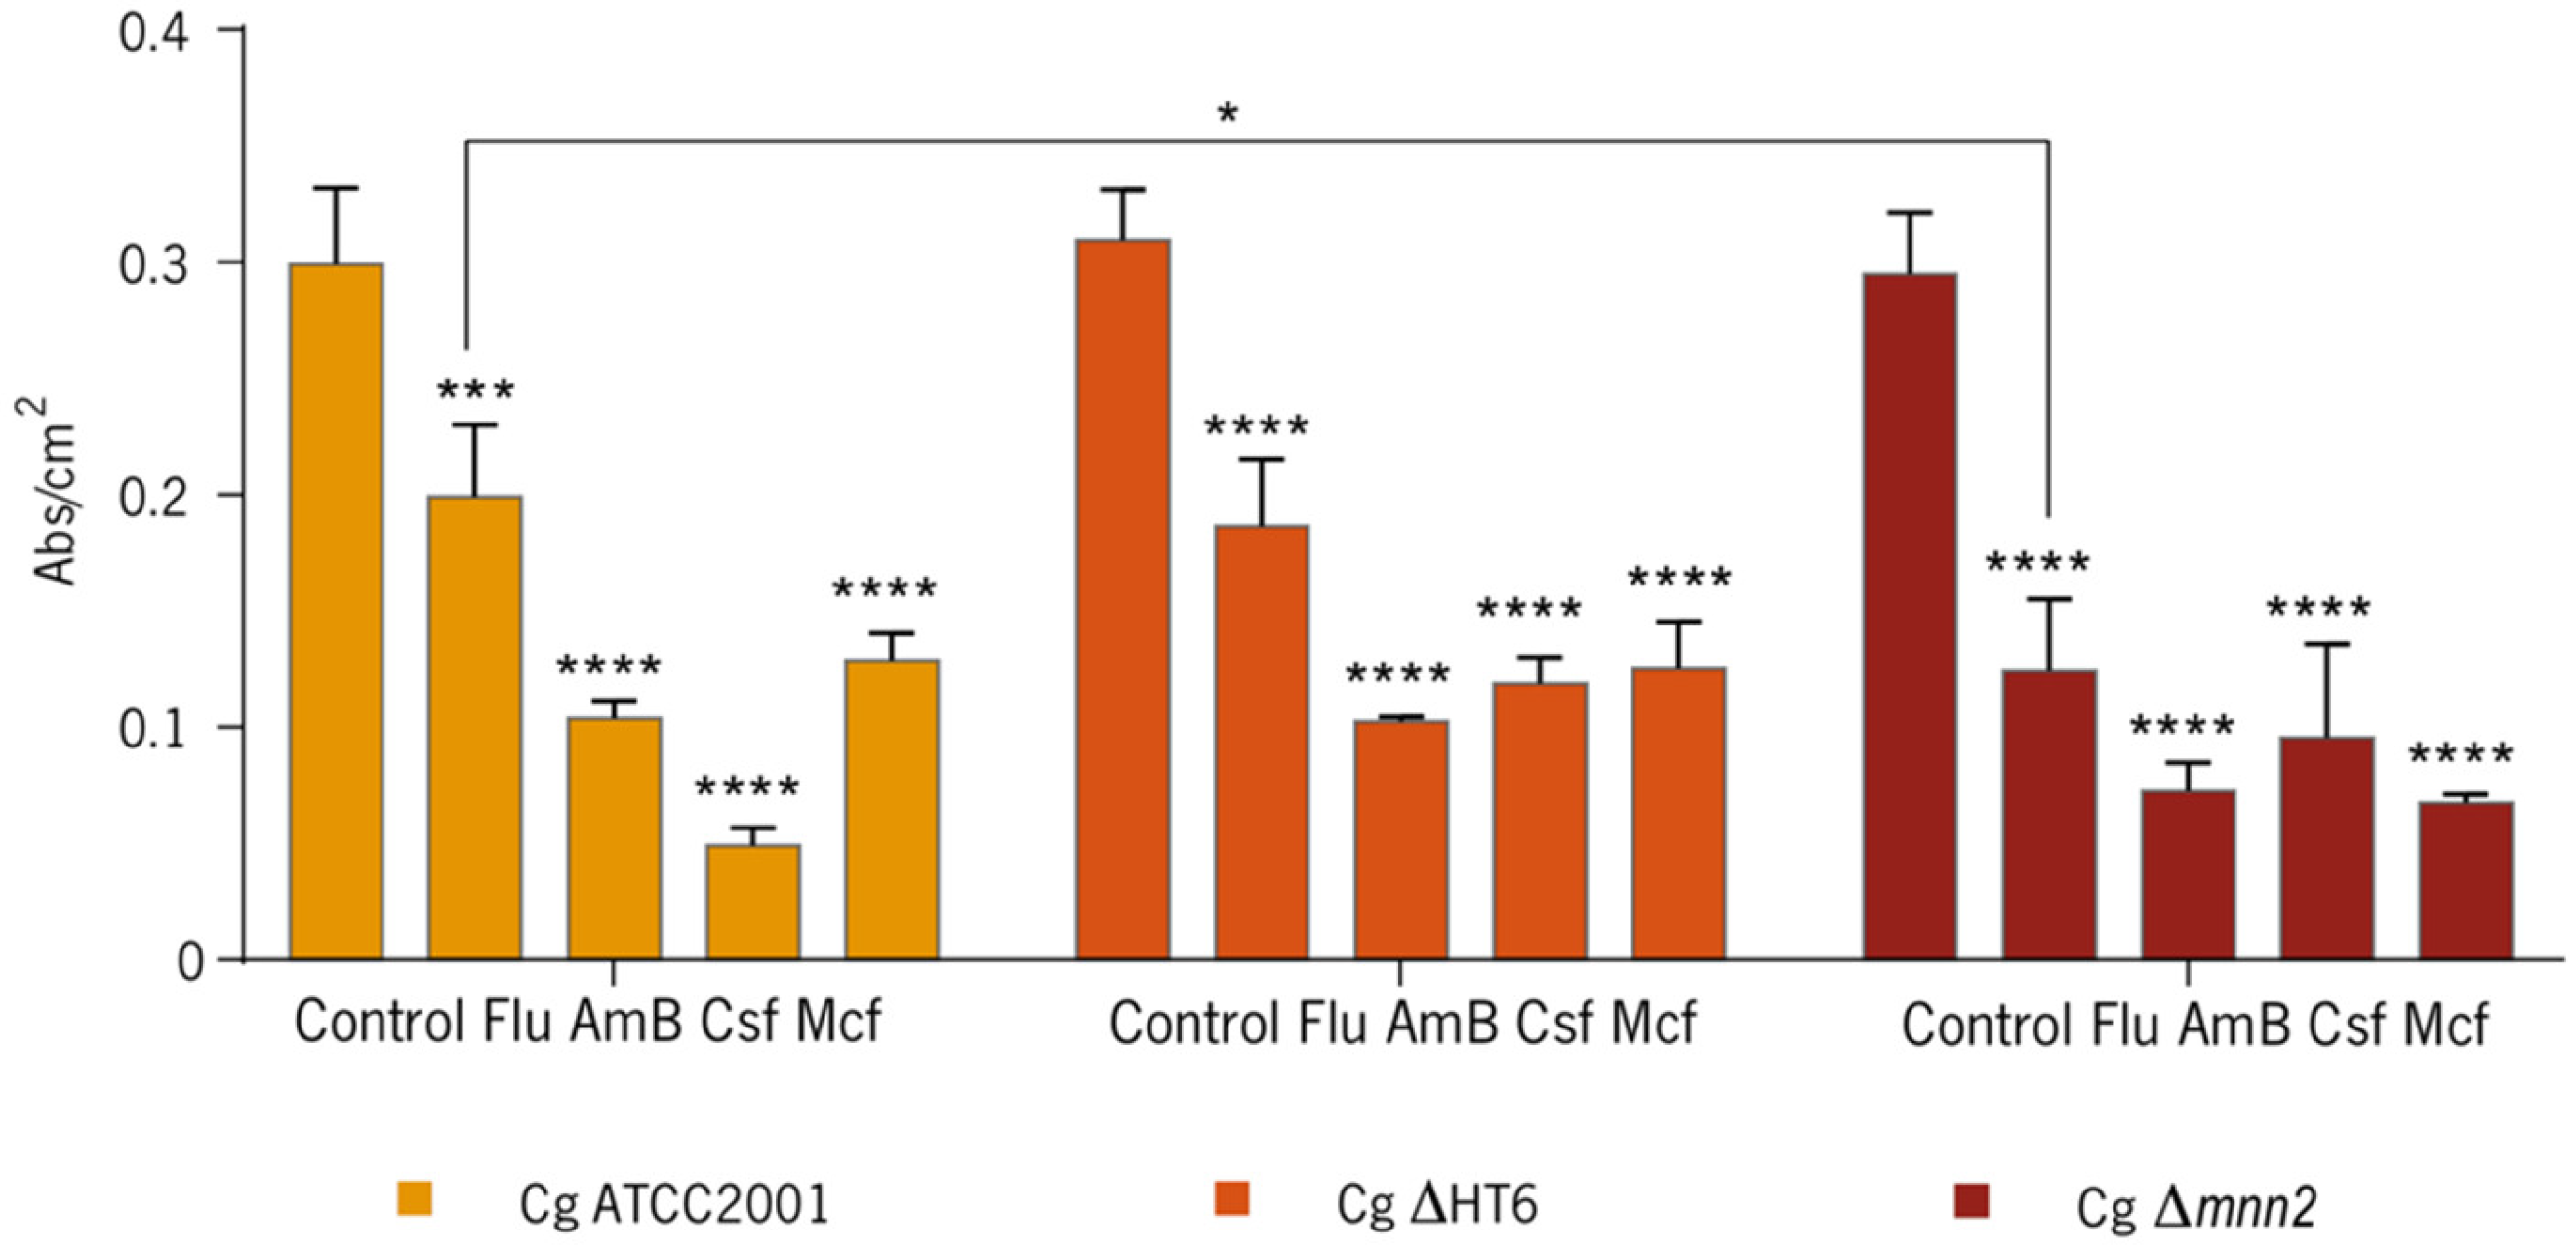
3.1. Effect of the Antifungals on Biofilms

The effect of several drugs—Flu, AmB, Csf, and Mcf—was tested on C. glabrata ATCC2001, C. glabrata Δmnn2, and C. glabrata ΔHT6 biofilms. The MBECs for C. glabrata ATCC2001 were determined previously [28,29,34] and used as the reference value for the other strains in this study. The results of the determination of the total biomass quantification are shown in Figure 2. In general, all strains showed a biomass reduction after contact with antifungals, but the response was not linear for the three C. glabrata strains. The controls revealed high capacities to produce biofilm, demonstrating that the lack of mannans in the mutant did not affect the quantity of biofilm produced. When the drugs were added, the mutant strain had a higher biomass loss, when compared with the controls and with C. glabrata ATCC2001 and C. glabrata ΔHT6 (Figure 2).
Table 1 shows the CFU count of the biofilm cells. When in contact with the drugs (MBEC), both the mutant and the parent strain were more tolerant to Flu, AmB, Csf, and Mcf, than ATCC2001.
Interestingly, only AmB was capable of reducing more than 1 Log10 of the initial CFU in the mutant strain, evidencing a higher resistance profile, when compared to the wild type strain, in which the echinocandins showed to have a good antifungal activity. Results demonstrate that, the initial CFU of the biofilm cells were very similar among the strains. It is, thus, probable that the differences in the antifungals susceptibilities were related to the biofilm matrices and/or in differences in the cell wall composition of each strain. In order to evaluate this, the composition of the cells walls and the biofilm matrices were also determined.

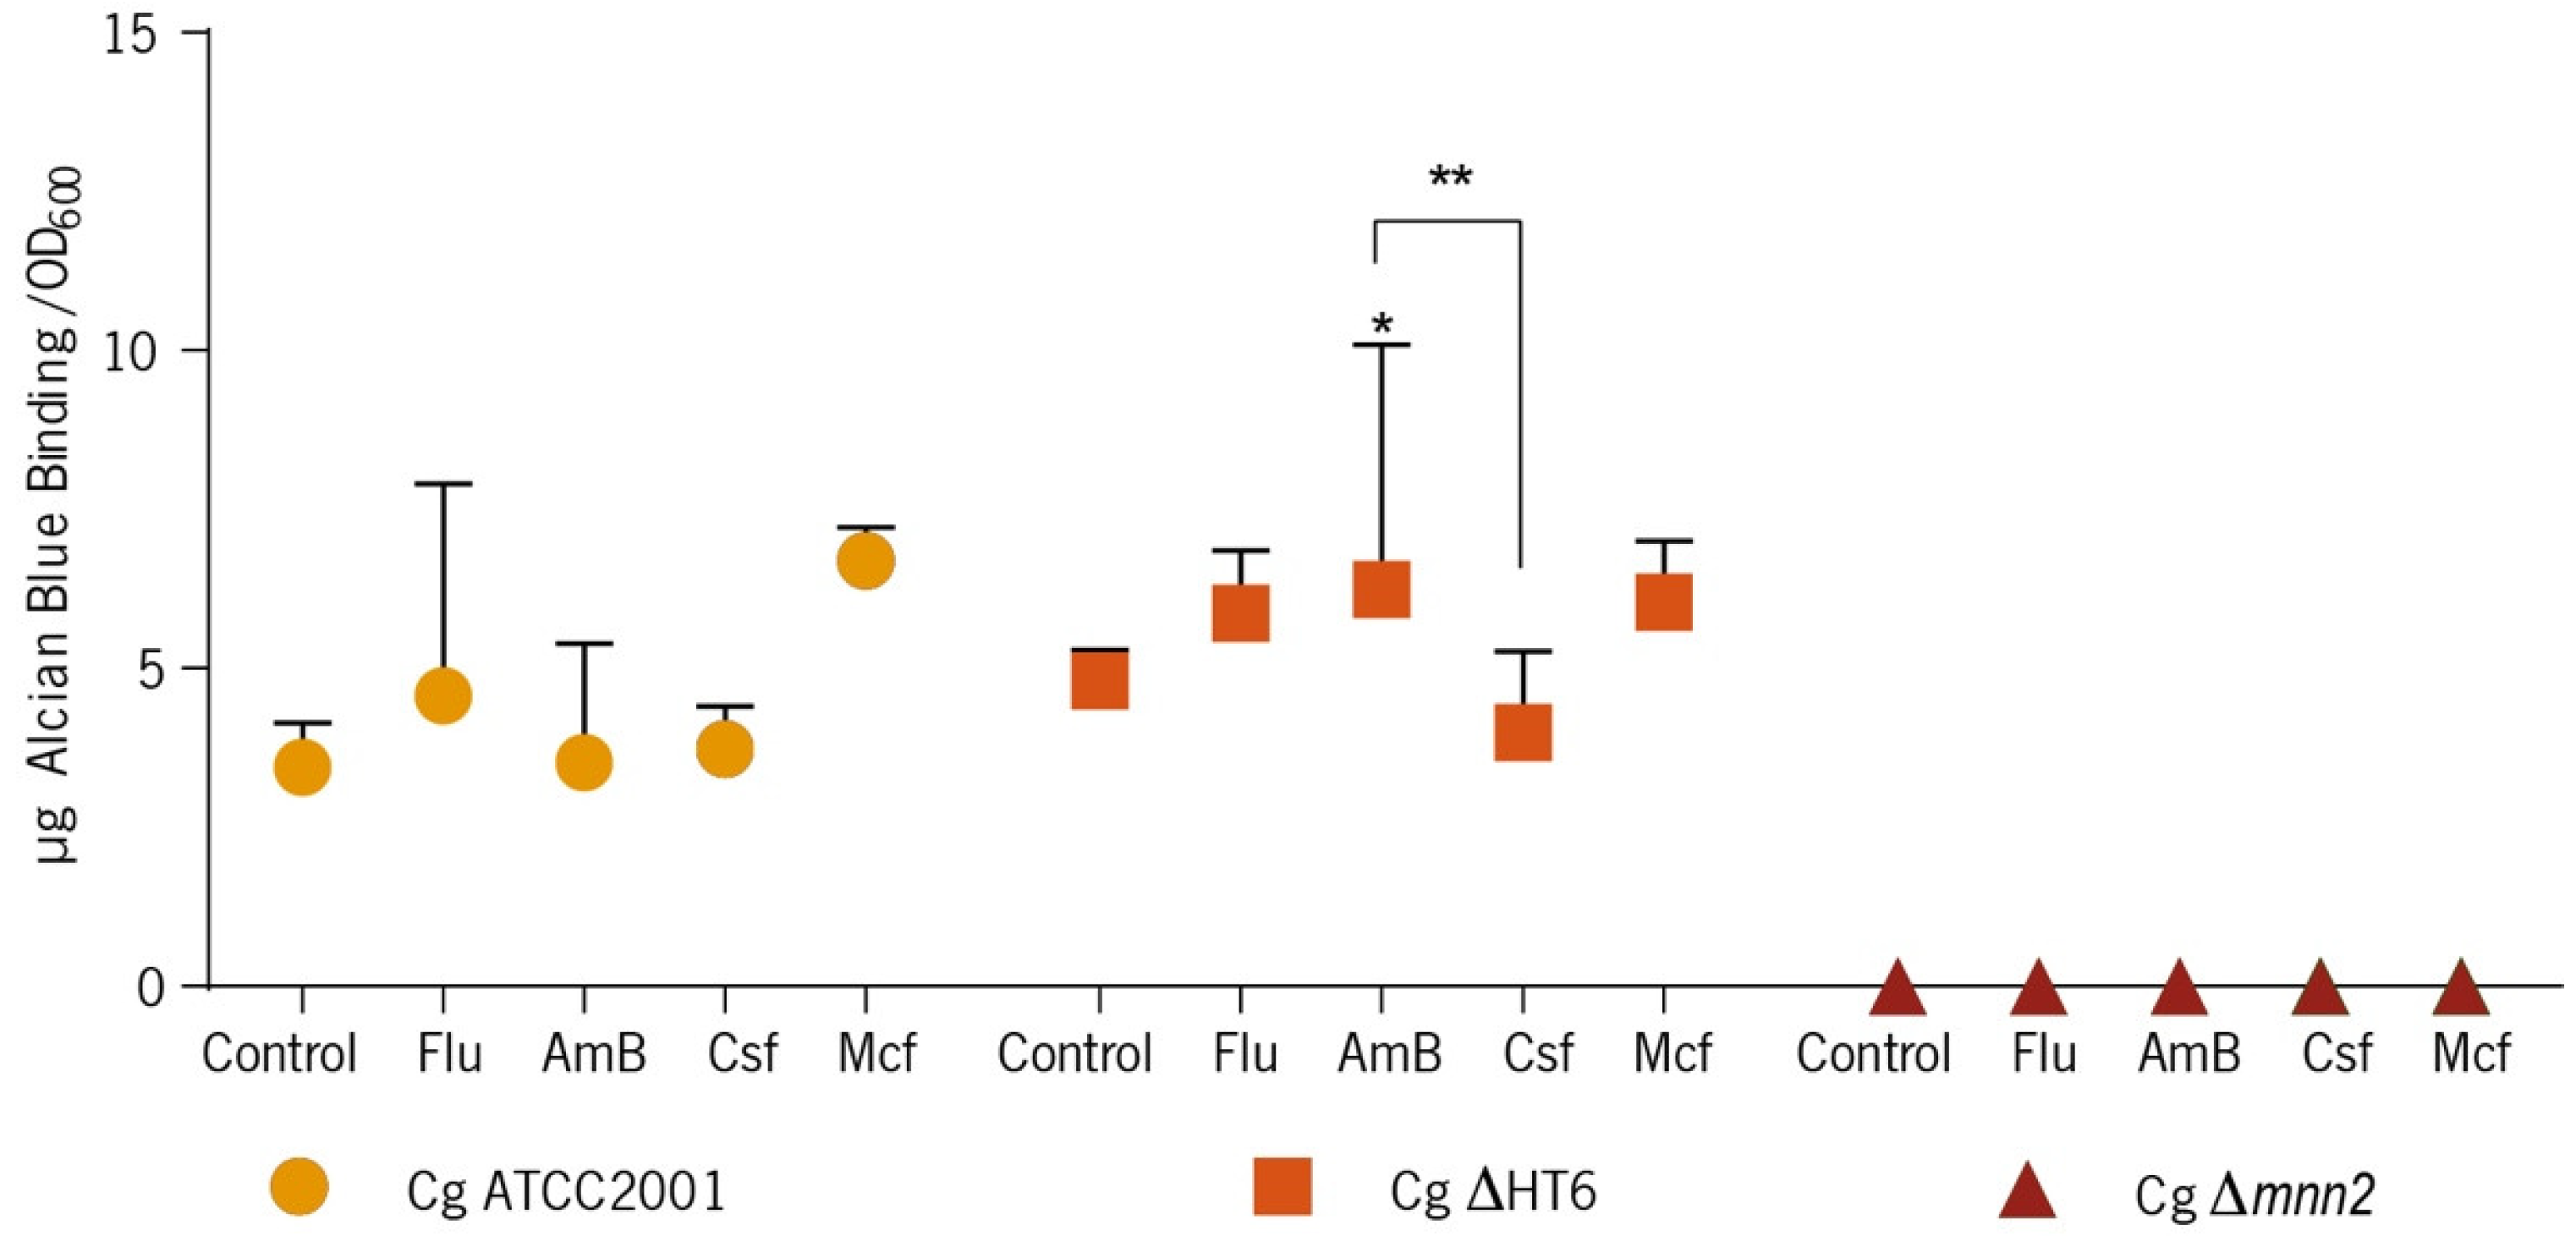
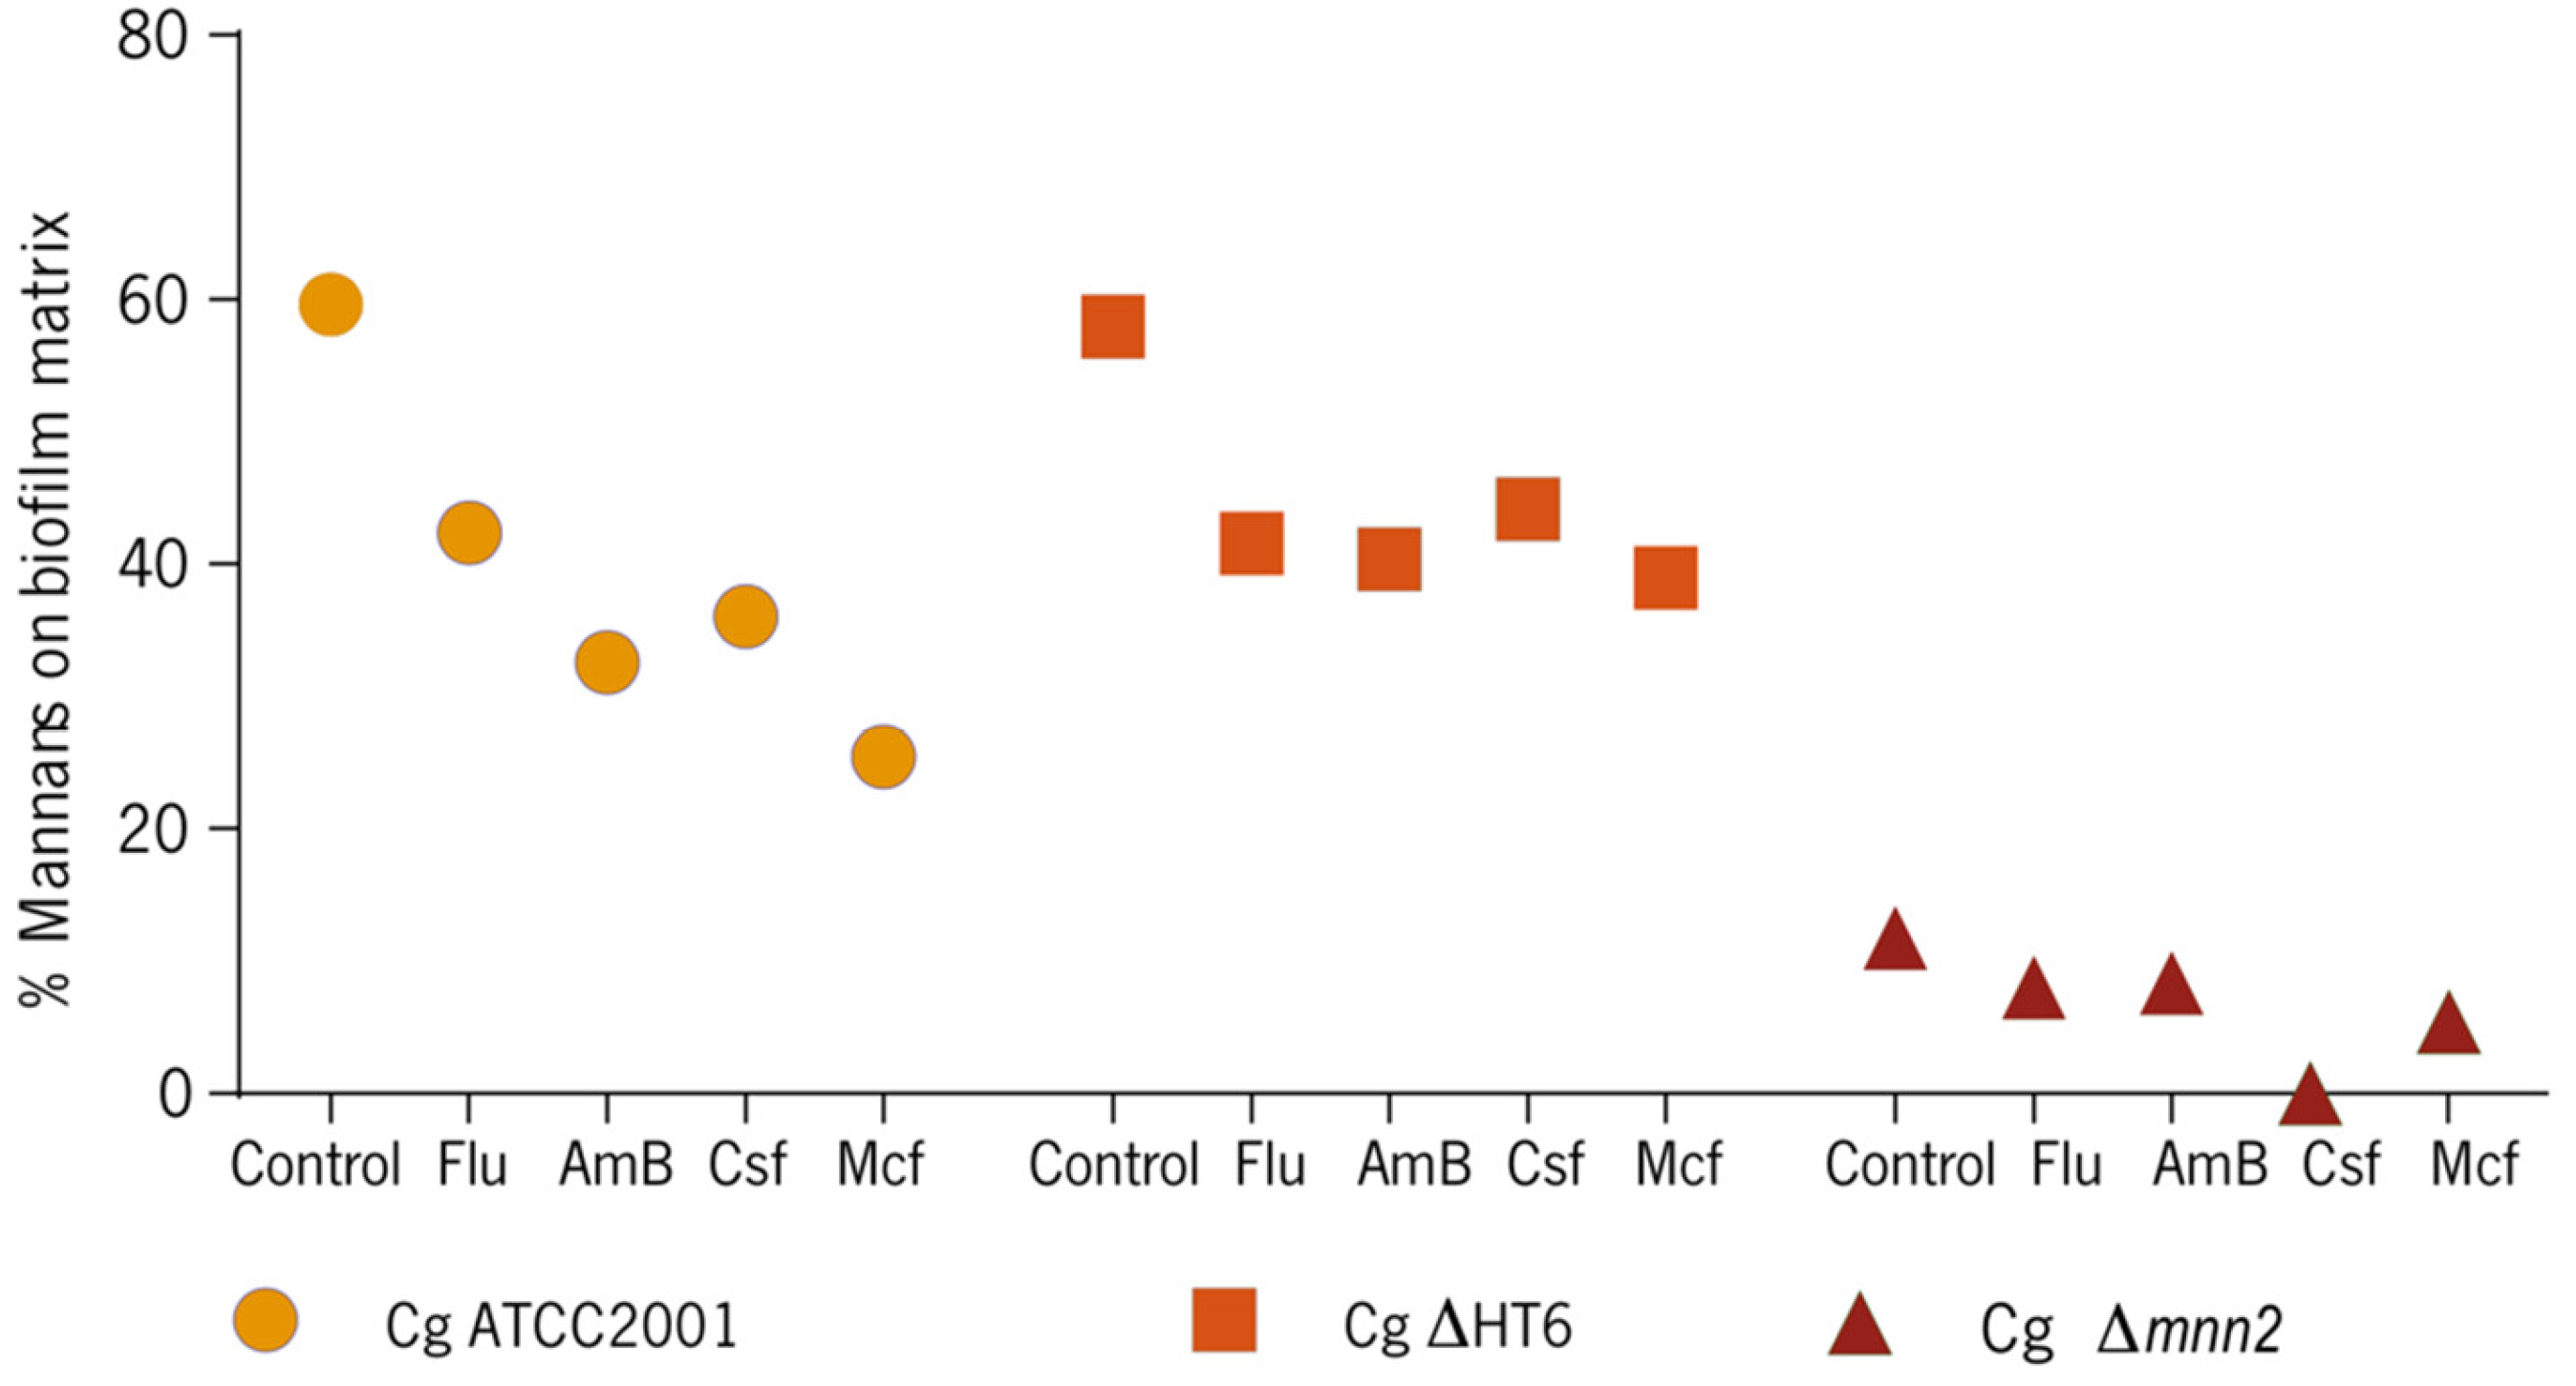
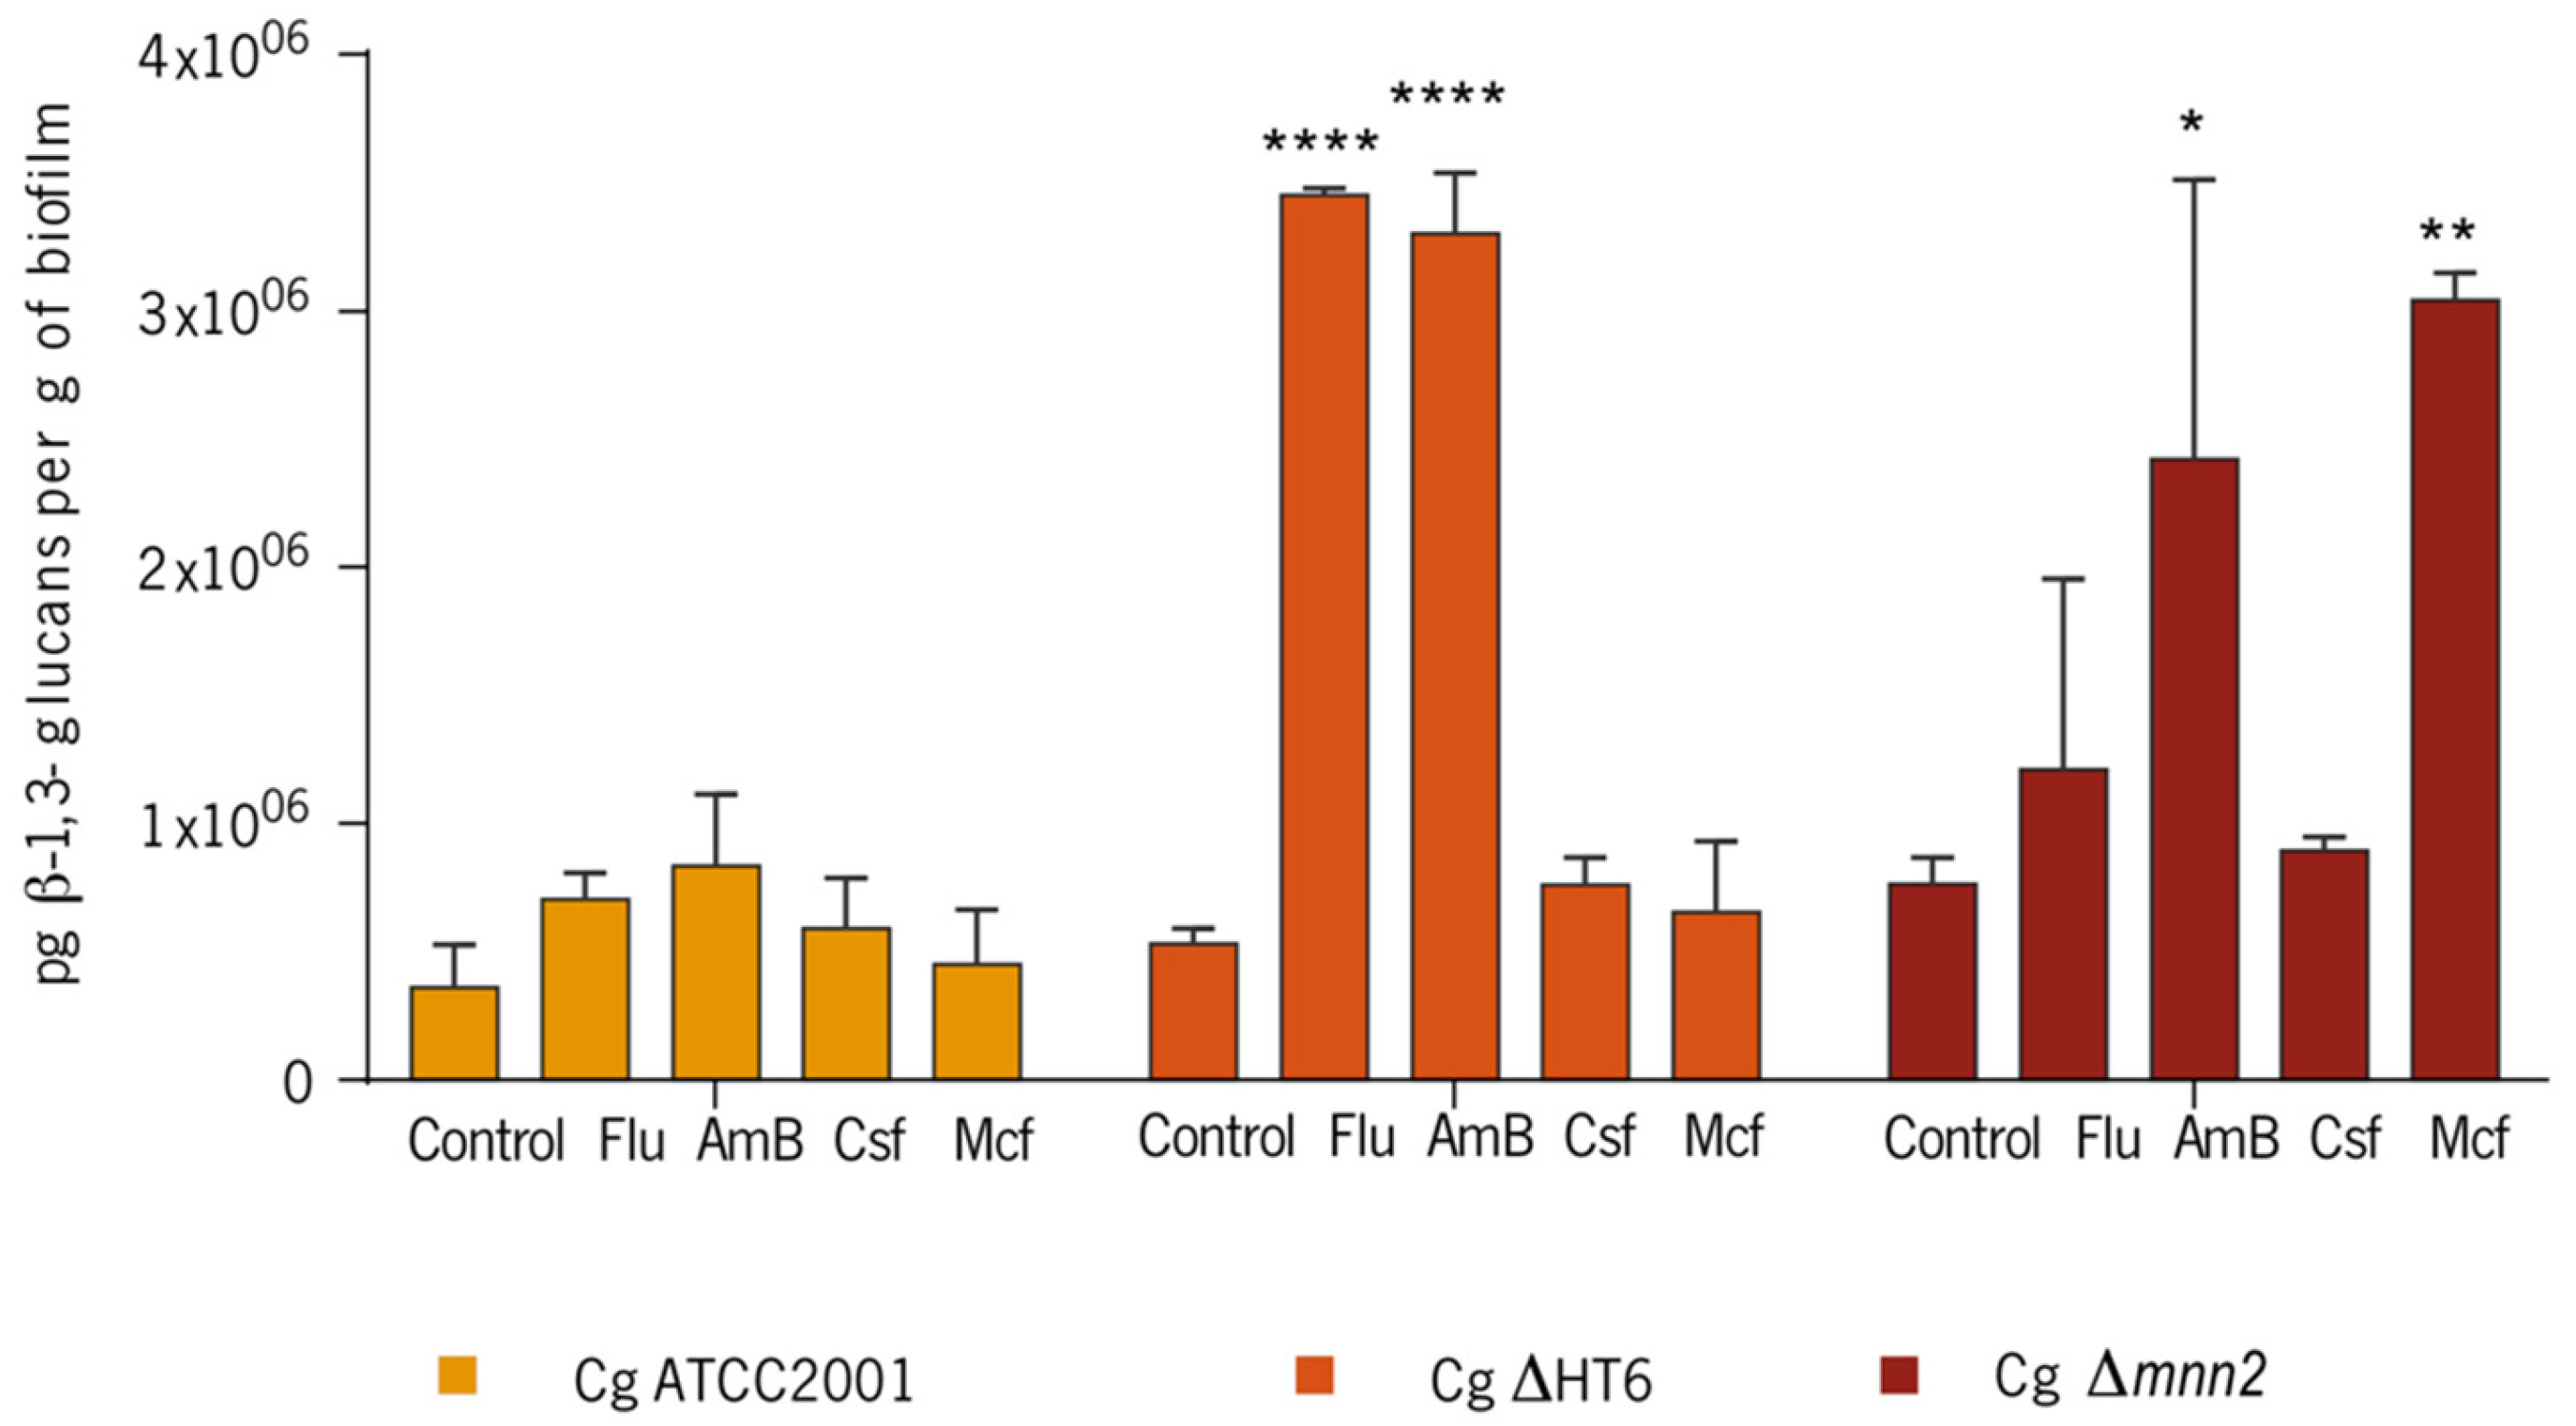
3.2. Effect of the Antifungals on Biofilm’s Cells Walls and Matrix

So as to estimate the phosphomannans content in the biofilm cells, the quantitative Alcian Blue binding assay was performed (Figure 3).
The results showed that there was an increase in the mannans in the biofilm cells after the contact with antifungals drugs in C. glabrata ATCC2001 (Figure 3) and, comparing with the control group, C. glabrata ΔHT6 showed to have an increase in mannans only when Flu, AmB, and Mcf was applied to the biofilm, but not with Csf. Regarding C. glabrata Δmnn2, the performance was different. The results showed that the KO of MNN2 gene significantly reduced the ability of cells to bind to Alcian Blue, in comparison with the other strains, to a point that it could not be quantified (Figure 3).
In addition, the content in mannans was also quantified on the biofilm matrices, which was, to authors’ knowledge, performed here for the first time (Figure 4).
In comparison with the controls, the results showed that all strains had less mannans content on the matrices in presence of antifungal drugs. Not surprisingly, the mutant had the lower quantity of these compounds on its matrices. In average, the controls had 50 to 60% of mannans in the matrices compositions, while C. glabrata Δmnn2 had less than 20% (Figure 4). The percentage decreased to about 20% after applying almost all drugs, for C. glabrata ATCC2001 and C. glabrata ΔHT6 and around 10% for the mutant, except for Csf, in which condition, no mannans were detected (p < 0.0005) (Figure 4).
The quantification of the β-1,3 glucans on the biofilm matrices of the three C. glabrata strains (Figure 5) showed that, comparing with the controls, the content of β-1,3 glucans increased in the matrices of C. glabrata ATCC2001. In the case of C. glabrata ΔHT6, particularly with Flu 1250 mg/L (p < 0.0001) and AmB 4 mg/L (p < 0.0001) there was a statistically significant rise in glucans production. Regarding C. glabrata Δmnn2 in contact with AmB 4 mg/L and Mcf 17 mg/L (p < 0.05 and p < 0.001, respectively), statistically significant rises were also detected. Curiously, although the mutant revealed to have less quantity of total polysaccharides in the biofilm matrix than the reference and the parent strain (data not shown), it showed to have the highest quantity of β-1,3 glucans per dry weight of biofilm matrix among all strains (7.66 × 10⁵ ± 1.03 × 10⁵), demonstrating a matrix richer in glucans’ polymers than the other two strains (Figure 5).
Afterwards, and in order to verify if the C. glabrata Δmnn2 initial cells were compensating the lack mannans of their cell walls with glucans, it was performed the quantification of β-1,3 glucans of the biofilm cells’ walls of the controls of the three strains (Table 2). The results confirmed that the content of β-1,3 glucans increased, in the mutant cell walls meaning that they have, indeed, a cell wall richer in β-1,3 glucans, when compared with the others (statistically significant).

4. Discussion

Systemic candidiasis is a worldwide emergent problem [1,35], associated with high mortality and high economic costs [33,34,35,36]. The fungal cell wall consists of β-1,3 glucans, β-1,4 glucans, β-1,6 glucans and chitin [10] and a layer of highly glycosylated mannoproteins [10,12,25]. Immunologically, these proteins called phosphomannans [16] are mainly organised in mannans, having a crucial role in adhesion and host recognition (host-fungus interactions) [9,13,37].
The results of the CLSM images (Figure 1) revealed that, microscopically among the strains, there were no variances on the cell wall, but the total biomass quantification (Figure 2) showed nonlinear biomass reduction after contact with antifungals. When compared with the other two strains, C. glabrata Δmnn2 demonstrated a higher biomass loss, which was assumed to be correlated to the KO in the MNN2 gene and subsequently, the reduced quantity of mannans in its biofilm matrix (Figure 2).
The Alcian Blue is a cationic dye, binding to the negatively charged phosphate group of the phosphomannan [2,24,30]. This capacity is used to estimate the cell wall phosphomannan content [2,24,30]. The N-linked phosphomannan is attached to the branched mannan through α1,2-mannose residues, which extend out from the α1,6-mannose backbone. Consequently, a deletion of any the MNN2 family members was expected to disturb the phosphomannan content of the cell wall [2]. C. glabrata ATCC2001 increased the quantities of mannans on the cell wall in the presence of drugs (Figure 3), which may be a possible adaptation of the cells to the stress caused by the antifungal agents. Similar cell walls adjustments during drug pressure have been described extensively as being directly responsible for antifungal resistance events [1,38,39,40]; compared with the control group, the parent strain (C. glabrata ΔHT6) increased the mannans content when stressed by Flu, AmB, and Mcf, but not by Csf (statistically significant, comparing with the AmB, p < 0.001), which demonstrated the intra-strain variability, genotypic and phenotypic alterations and also adaptable drug responses [41,42], but can also be a result of the molecular changes between Mcf and Csf. Both drugs have a cyclic peptide structure with an N-aryl group but with different patterns of hydroxylations and amino groups (R2 to R4). The N-aryl side chain (position R1) plays a critical role in the potency and toxicity and is the main point for chemical modification of the echinocandin analogues [43,44]. Csf is more hydroxylated and has more amino groups, while Mcf has more aryl groups. The substitution of the linoleoyl side chain with aryl side chains of low lipophilicity, nonlinear configuration or chains changed with highly polar groups end in loss of antifungal activity, proposing that planar, non-polar substitutions are critical for the antifungal activity [43,44]. Mcf molecule presents these modifications which are also a probable explanation for the differences found in this and in previous works of our group [29]. C. glabrata Δmnn2 considerably reduced the ability of cells to bind Alcian Blue (Figure 3), which has also been demonstrated on planktonic cells [9], suggesting that MNN2 genes family are essential for phosphomannan integration, while deletion of other genes indicated a minor reduction in phosphomannan concentration [2,16]. This has been previously revealed for other species [14,16,45]. Those results raised the possibility that other polysaccharides’ metabolism (e.g., β-1,3 glucans) could be enhanced in the detriment of mannans in the mutant. Concerning the Alcian Blue binding assay in the biofilm matrices, all the C. glabrata strains showed to have less mannans on the matrices stressed by the presence of antifungal drugs, especially the mutant (Figure 4), which revealed that a poorer mannans’ matrix is more fragile, more sensible to environmental stresses and, thus, more susceptible to biomass loss (corroborating the biomass results).
Additionally, the β-1,3 glucans tended to increase their presence in the matrices when the biofilms were in contact with the drugs (Figure 5). It appears that, after a stress situation, the reduction in mannans, that was observed earlier (Figure 4), matches the β-1,3 glucans increase in C. glabrata (Figure 5). Moreover, the controls of the reference and the parent strains had ≈60% of mannans in the matrices compositions, while C. glabrata Δmnn2 had less than 20%. This reinforces the fact that the C. glabrata Δmnn2 biofilm matrix was mostly constituted by β-glucans, as it was determined (Figure 5). The quantification of β-1,3 glucans of the cells walls of the biofilm cells of the strains (Table 2) confirmed that the quantity of these biopolymers is variable in the cell walls of C. glabrata strains. The mutant displayed a cell wall richer in β-1,3 glucans, when compared with the others (statistically significant), which demonstrates higher capacities of compensation mechanisms, which, adding to the increase in the β-1,3 glucans content of the matrix, may be responsible for a more resistance profile to the drugs (Table 2).
The strong variability in the biofilm matrices and in the cell walls composition of C. glabrata has been formerly stated after any drug pressure, being related to higher pathogenicity and virulence states. Though, other factors are related to the biofilm drug resistance and one single feature is not able to clarify the complete phenomenon of resistance [23,34,46]. The KO of the MNN2 gene has demonstrated to influence the drug response profile of biofilm cells, by inducing key changes in the matrices and cell wall’s compositions, validating again the great importance of β-glucans in the resistance of C. glabrata biofilms to antifungal drugs. Finally, this work also suggests that the identification and blocking of genes directly related to the plasticity of the composition of the matrices and cell walls are a good path to the search to new antifungal agents.

Supplementary Materials

The following are available online at https://www.mdpi.com/2218-273X/8/4/130/s1, Table S1: Fungal strains used in this study.

Author Contributions

C.F.R., K.H. and M.H. contributed to experimental design. C.F.R. and D.V.B. executed the experiments. C.F.R., D.V.B. and M.H. performed analysis and interpretation of experiments. C.F.R. and M.H. contributed in writing the manuscript.

Funding

This study was supported by the Portuguese Foundation for Science and Technology (FCT) under the scope of the strategic funding of UID/BIO/04469/2013 unit and COMPETE 2020 (POCI-01-0145-FEDER-006684) and BioTecNorte operation (NORTE-01-0145-FEDER-000004) funded by the European Regional Development Fund under the scope of Norte2020–Programa Operacional Regional do Norte and Célia F. Rodrigues’ [SFRH/BD/93078/2013] PhD grant.

Acknowledgments

The authors would like to thank: Ken Haynes’ Lab, Lauren Ames and Lara West from the College of Life and Environmental Sciences, University of Exeter, United Kingdom, for the kind donation of the mutants and the complementary strains used in this work; James Masuoka, from Midwestern State University Wichita Falls, TX, United States, for helping us on the Alcian Blue assay; Pfizer®, MSD®, Astellas® for the kind donation of fluconazole, caspofungin and micafungin.

Conflicts of Interest

All authors declare no conflict of interest.

References

  1. Rodrigues, C.F.; Rodrigues, M.; Silva, S.; Henriques, M. Candida glabrata Biofilms: How Far Have We Come? J. Fungi 2017, 3, 11. [Google Scholar] [CrossRef] [PubMed]
  2. Hall, R.A.; Bates, S.; Lenardon, M.D.; Maccallum, D.M.; Wagener, J.; Lowman, D.W.; Kruppa, M.D.; Williams, D.L.; Odds, F.C.; Brown, A.J.P.; et al. The Mnn2 mannosyltransferase family modulates mannoprotein fibril length, immune recognition and virulence of Candida albicans. PLoS Pathog. 2013, 9, e1003276. [Google Scholar] [CrossRef] [PubMed] [Green Version]
  3. Colombo, A.L.; Guimarães, T.; Silva, L.R.; de Almeida Monfardini, L.P.; Cunha, A.K.; Rady, P.; Alves, T.; Rosas, R.C. prospective observational study of candidemia in sao paulo, brazil: incidence rate, epidemiology, and predictors of mortality. Infect. Control Hosp. Epidemiol. 2007, 28, 570–576. [Google Scholar] [CrossRef] [PubMed]
  4. Hasan, F.; Xess, I.; Wang, X.; Jain, N.; Fries, B.C. Biofilm formation in clinical Candida isolates and its association with virulence. Microbes Infect. 2009, 11, 753–761. [Google Scholar] [CrossRef] [PubMed]
  5. Sardi, J.C.O.; Scorzoni, L.; Bernardi, T.; Fusco-Almeida, A.M.; Mendes Giannini, M.J.S. Candida species: Current epidemiology, pathogenicity, biofilm formation, natural antifungal products and new therapeutic options. J. Med. Microbiol. 2013, 62, 10–24. [Google Scholar] [CrossRef] [PubMed]
  6. Lim, C.S.-Y.; Rosli, R.; Seow, H.F.; Chong, P.P. Candida and invasive candidiasis: Back to basics. Eur. J. Clin. Microbiol. Infect. Dis. 2012, 31, 21–31. [Google Scholar] [CrossRef] [PubMed]
  7. Ruan, S.-Y.; Lee, L.-N.; Jerng, J.-S.; Yu, C.-J.; Hsueh, P.-R.; Saral, R. Candida glabrata fungaemia in intensive care units. Clin. Microbiol. Infect. 2008, 14, 136–140. [Google Scholar] [CrossRef] [PubMed]
  8. Costa-Orlandi, C.; Sardi, J.; Pitangui, N.; de Oliveira, H.; Scorzoni, L.; Galeane, M.; Medina-Alarcón, K.; Melo, W.; Marcelino, M.; Braz, J.; et al. Fungal Biofilms and Polymicrobial Diseases. J. Fungi 2017, 3, 22. [Google Scholar] [CrossRef] [PubMed]
  9. West, L.; Lowman, D.; Mora-Montes, H.; Grubb, S.; Murdoch, C.; Thornhill, M.; Gow, N.; Williams, D.; Haynes, K. Differential virulence of Candida glabrata glycosylation mutants. J. Biol. Chem. 2013, 288, 22006–22018. [Google Scholar] [CrossRef] [PubMed] [Green Version]
  10. Netea, M.G.; Brown, G.D.; Kullberg, B.J.; Gow, N.A.R. An integrated model of the recognition of Candida albicans by the innate immune system. Nat. Rev. Microbiol. 2008, 6, 67–78. [Google Scholar] [CrossRef] [PubMed]
  11. Bowman, S.M.; Free, S.J. The structure and synthesis of the fungal cell wall. BioEssays 2006, 28, 799–808. [Google Scholar] [CrossRef] [PubMed]
  12. Latge, J.-P. The cell wall: A carbohydrate armour for the fungal cell. Mol. Microbiol. 2007, 66, 279–290. [Google Scholar] [CrossRef] [PubMed]
  13. Gow, N.A.; Hube, B. Importance of the Candida albicans cell wall during commensalism and infection. Curr. Opin. Microbiol. 2012, 15, 406–412. [Google Scholar] [CrossRef] [PubMed]
  14. Murciano, C.; Moyes, D.L.; Runglall, M.; Islam, A.; Mille, C.; Fradin, C.; Poulain, D.; Gow, N.A.R.; Naglik, J.R. The mnn2 mutant of Saccharomyces cerevisiae is affected in phosphorylation of N-linked oligosaccharides. FEBS Lett. 2000, 475, 111–116. [Google Scholar]
  15. Dean, N. Asparagine-linked glycosylation in the yeast Golgi. Biochim. Biophys. Acta 1999, 1426, 309–322. [Google Scholar] [CrossRef]
  16. Hall, R.A.; Gow, N.A.R. Mannosylation in Candida albicans: Role in cell wall function and immune recognition. Mol. Microbiol. 2013, 90, 1147–1161. [Google Scholar] [CrossRef] [PubMed]
  17. Takahashi, S.; Kudoh, A.; Okawa, Y.; Shibata, N. Significant differences in the cell-wall mannans from three Candida glabrata strains correlate with antifungal drug sensitivity. FEBS J. 2012, 279, 1844–1856. [Google Scholar] [CrossRef] [PubMed]
  18. Okawa, Y.; Goto, K. Disappearance of antigenic factor 6 in Candida glabrata IFO 0622 strain cells cultured at high temperature. Biol. Pharm. Bull. 2006, 29, 187–189. [Google Scholar] [CrossRef] [PubMed]
  19. Mora-Montes, H.M.; Bates, S.; Netea, M.G.; Diaz-Jimenez, D.F.; Lopez-Romero, E.; Zinker, S.; Ponce-Noyola, P.; Kullberg, B.J.; Brown, A.J.P.; Odds, F.C.; et al. Endoplasmic Reticulum-Glycosidases of Candida albicans Are Required for N Glycosylation, Cell Wall Integrity, and Normal Host-Fungus Interaction. Eukaryot. Cell 2007, 6, 2184–2193. [Google Scholar] [CrossRef] [PubMed]
  20. Bates, S.; Hughes, H.B.; Munro, C.A.; Thomas, W.P.H.; MacCallum, D.M.; Bertram, G.; Atrih, A.; Ferguson, M.A.J.; Brown, A.J.P.; Odds, F.C.; et al. Outer Chain N-Glycans Are Required for Cell Wall Integrity and Virulence of Candida albicans. J. Biol. Chem. 2006, 281, 90–98. [Google Scholar] [CrossRef] [PubMed]
  21. Rayner, J.C.; Munro, S. Identification of the MNN2 and MNN5 mannosyltransferases required for forming and extending the mannose branches of the outer chain mannans of Saccharomyces cerevisiae. J. Biol. Chem. 1998, 273, 26836–26843. [Google Scholar] [CrossRef] [PubMed]
  22. Williams, D.W.; Wilson, M.J.; Lewis, M.A.O.; Potts, A.J.C. Identification of Candida Species by PCR and Restriction Fragment Length Polymorphism Analysis of Intergenic Spacer Regions of Ribosomal DNA. J. Clin. Microbiol. 1995, 33, 2476–2479. [Google Scholar] [PubMed]
  23. Fonseca, E.; Silva, S.; Rodrigues, C.F.; Alves, C.; Azeredo, J.; Henriques, M. Effects of fluconazole on Candida glabrata biofilms and its relationship with ABC transporter gene expression. Biofouling 2014, 30, 447–457. [Google Scholar] [CrossRef] [PubMed]
  24. Singleton, D.R.; Masuoka, J.; Hazen, K.C. Surface Hydrophobicity Changes of Two. Society 2005, 4, 639–648. [Google Scholar] [CrossRef]
  25. Ruiz-Herrera, J.; Victoria Elorza, M.; Valentín, E.; Sentandreu, R. Molecular organization of the cell wall of Candida albicans and its relation to pathogenicity. FEMS Yeast Res. 2006, 6, 14–29. [Google Scholar] [CrossRef] [PubMed]
  26. Arendrup, M.C.; Arikan, S.; Barchiesi, F.; Bille, J.; Dannaoui, E.; Denning, D.W.; Donnelly, J.P.; Fegeler, W.; Moore, C.; Richardson, M.; et al. EUCAST Technical Note on the method for the determination of broth dilution minimum inhibitory concentrations of antifungal agents for conidia—Forming moulds. Clin. Microbiol. Infect. 2008, 14, 982–984. [Google Scholar] [CrossRef]
  27. European Committee on Antimicrobial Susceptibility Testing (EUCAST). Breakpoint Tables for Interpretation of MICs, Version 8.1. Available online: http://www.eucast.org/ast_of_bacteria/previous_versions_of_documents/ (accessed on 30 October 2018).
  28. Rodrigues, C.F.; Henriques, M. Portrait of Matrix Gene Expression in Candida glabrata Biofilms with Stress Induced by Different Drugs. Genes 2018, 9, 205. [Google Scholar] [CrossRef] [PubMed]
  29. Rodrigues, C.F.; Rodrigues, M.E.; Henriques, M. Susceptibility of Candida glabrata biofilms to echinocandins: Alterations in the matrix composition. Biofouling 2018, 34, 569–578. [Google Scholar] [CrossRef] [PubMed]
  30. Odani, T.; Shimma, Y.I.; Wang, X.H.; Jigami, Y. Mannosylphosphate transfer to cell wall mannan is regulated by the transcriptional level of the MNN4 gene in Saccharomyces cerevisiae. FEBS Lett. 1997, 420, 186–190. [Google Scholar] [CrossRef]
  31. Pitarch, A.; Sánchez, M.; Nombela, C.; Gil, C. Sequential fractionation and two-dimensional gel analysis unravels the complexity of the dimorphic fungus Candida albicans cell wall proteome. Mol. Cell. Proteom. 2002, 1, 967–982. [Google Scholar] [CrossRef]
  32. Hawser, S.P.; Douglas, L.J. Resistance of Candida albicans biofilms to antifungal agents in vitro. Antimicrob. Agents Chemother. 1995, 39, 2128–2131. [Google Scholar] [CrossRef] [PubMed]
  33. Silva, S.; Rodrigues, C.F.; Araújo, D.; Rodrigues, M.; Henriques, M. Candida Species Biofilms’ Antifungal Resistance. J. Fungi 2017, 3, 8. [Google Scholar] [CrossRef] [PubMed]
  34. Rodrigues, C.F.; Henriques, M. Liposomal and Deoxycholate Amphotericin B Formulations: Effectiveness against Biofilm Infections of Candida spp. Pathogens 2017, 6, 62. [Google Scholar] [CrossRef] [PubMed]
  35. Cataldi, V.; Di Campli, E.; Fazii, P.; Traini, T.; Cellini, L.; Di Giulio, M. Candida species isolated from different body sites and their antifungal susceptibility pattern: Cross-analysis of Candida albicans and Candida glabrata biofilms. Med. Mycol. 2016, 55, 624–634. [Google Scholar] [CrossRef] [PubMed]
  36. Pfaller, M.A.; Castanheira, M. Nosocomial candidiasis: Antifungal stewardship and the importance of rapid diagnosis. Med. Mycol. 2015, 54, 1–22. [Google Scholar] [CrossRef] [PubMed]
  37. Murciano, C.; Moyes, D.L.; Runglall, M.; Islam, A.; Mille, C.; Fradin, C.; Poulain, D.; Gow, N.A.R.; Naglik, J.R. Candida albicans Cell Wall Glycosylation May Be Indirectly Required for Activation of Epithelial Cell Proinflammatory Responses. Infect. Immun. 2011, 79, 4902–4911. [Google Scholar] [CrossRef] [PubMed]
  38. Ferrari, S.; Sanguinetti, M.; Torelli, R.; Posteraro, B.; Sanglard, D. Contribution of CgPDR1-regulated genes in enhanced virulence of azole-resistant Candida glabrata. PLoS ONE 2011, 6, e17589. [Google Scholar] [CrossRef] [PubMed]
  39. Mathé, L.; Van Dijck, P. Recent insights into Candida albicans biofilm resistance mechanisms. Curr. Genet. 2013, 59, 251–264. [Google Scholar] [CrossRef] [PubMed]
  40. Taff, H.T.; Nett, J.E.; Zarnowski, R.; Ross, K.M.; Sanchez, H.; Cain, M.T.; Hamaker, J.; Mitchell, A.P.; Andes, D.R. A Candida biofilm-induced pathway for matrix glucan delivery: Implications for drug resistance. PLoS Pathog. 2012, 8, e1002848. [Google Scholar] [CrossRef] [PubMed]
  41. Hoyer, L.L. Detection and Clinical Significance of Variability among Candida Isolates. In Candida and Candidiasis, 2nd ed.; American Society of Microbiology: Washington, DC, USA, 2012; pp. 91–99. [Google Scholar]
  42. Ivanova, K.; Ramon, E.; Hoyo, J.; Tzanov, T. Innovative Approaches for Controlling Clinically Relevant Biofilms: Current Trends and Future Prospects. Curr. Top. Med. Chem. 2017, 17, 1889–1914. [Google Scholar] [CrossRef]
  43. Debono, M.; Gordee, R.S.S. Antibiotics that inhibit fungal cell wall development. Annu. Rev. Microbiol. 1994, 48, 471–497. [Google Scholar] [CrossRef] [PubMed]
  44. Wiederhold, N.P.; Lewis, R.E. The echinocandin antifungals: An overview of the pharmacology, spectrum and clinical efficacy. Expert Opin. Investig. Drugs 2003, 12, 1313–1333. [Google Scholar] [CrossRef] [PubMed]
  45. Gow, N.A.R. Components of the fungal cell wall that turn on and turn off the immune inflammatory response. In Proceedings of the TIMM2015, Lisbon, Portugal, 9–12 October 2015. [Google Scholar]
  46. Chandra, J.; Mukherjee, P.K. Candida Biofilms: Development, Architecture, and Resistance. Microbiol. Spectr. 2015, 3, 157–176. [Google Scholar] [CrossRef] [PubMed]
Figure 1. Confocal laser scanning microscopy image a 48-h-biofilm of Candida glabrata ATCC2001, C. glabrata ΔHT6 and C. glabrata Δmnn2. The biofilm images were acquired using a confocal scanning laser microscope (Olympus BX61, Model FluoView 1000). Filters: DAPI (100 mg/L emissions filters BA 430–470) and Concanavalin A, Alexa Fluor 488 conjugate (50 mg/L emissions filters BA 505–605). Images were acquired with the program FV10-ASW 4.2 (Olympus) using a magnification of 100×. Measure bar: 10 µm.
Biomolecules 08 00130 g001
Figure 2. Crystal Violet in a 48-h-biofilm of C. glabrata ATCC2001, C. glabrata ΔHT6, and C. glabrata Δmnn2 with and without antifungal agents. The quantification of the biomass is presented by abs/cm2. (* p < 0.05; *** p < 0.0005; **** p < 0.0001). Cg: C. glabrata; Flu: fluconazole; AmB: amphotericin B; Csf: caspofungin; Mcf: micafungin.
Biomolecules 08 00130 g002
Figure 3. Alcian Blue binding assay. Data represent the mean amount of dye bound per biofilm cell of C. glabrata ATCC2001, C. glabrata ΔHT6, and C. glabrata Δmnn2 (undetected). (Cg—C. glabrata. * p < 0.05; ** p < 0.001).
Biomolecules 08 00130 g003
Figure 4. Alcian Blue binding assay in biofilm matrices of C. glabrata ATCC2001, C. glabrata ΔHT6, and C. glabrata Δmnn2. Data represent the percentage of mannans on biofilm. (Cg—C. glabrata).
Biomolecules 08 00130 g004
Figure 5. β-1,3 glucans concentration (pg/mL) on the biofilm matrices of C. glabrata ATCC2001, C. glabrata ΔHT6, and C. glabrata Δmnn2. The values were normalised per dry weight of biofilm. (Cg—C. glabrata. * p < 0.05; ** p < 0.001; **** p < 0.0001).
Biomolecules 08 00130 g005
Table 1. Log10 of CFU/cm2 ± Standard Deviation of biofilm cells using the minimum biofilm eradication concentrations (MBECs) of the reference strain (C. glabrata ATCC2001) for Flu, AmB, Csf, and Mcf for C. glabrata ΔHT6 and C. glabrata Δmnn2.
StrainControlFluAmBCsfMcf
C. glabrata ATCC20015.90 ± 0.184.95 ± 0.444.40 ± 0.303.80 ± 1.273.40 ± 0.07
C. glabrata ΔHT65.80 ± 0.363.69 ± 0.024.37 ± 0.455.42 ± 0.425.53 ± 0.41
C. glabrata Δmnn26.16 ± 0.315.10 ± 0.434.23 ± 0.585.61 ± 0.114.98 ± 0.13
Table 2. β-1,3 glucans concentration (pg/mL) on the biofilm cells C. glabrata ATCC2001, C. glabrata HT6, and C. glabrata Δmnn2. (* p < 0.05).
Strainβ-1,3 glucans Biofilm Cells Concentration (pg/mL) ± SD
C. glabrata ATCC2001359.00 ± 8.20
C. glabrata ΔHT6370.00 ± 5.08
C. glabrata Δmnn2387.00 ± 7.00 (*)
(SD—standard deviation).

