Article

Integrating Evacuation and Storm Surge Modeling Considering Potential Hurricane Tracks: The Case of Hurricane Irma in Southeast Florida

1
Department of Civil and Environmental Engineering, Florida State University, Tallahassee, FL 32310, USA
2
Department of Civil and Environmental Engineering, Florida Agricultural and Mechanical University-Florida State University College of Engineering, Tallahassee, FL 32310, USA
*
Author to whom correspondence should be addressed.
ISPRS Int. J. Geo-Inf. 2021, 10(10), 661; https://doi.org/10.3390/ijgi10100661
Submission received: 3 August 2021 / Revised: 23 September 2021 / Accepted: 27 September 2021 / Published: 30 September 2021

Abstract

:
Hurricane Irma, in 2017, made an unusual landfall in South Florida and the unpredictability of the hurricane’s path challenged the evacuation process seriously and left many evacuees clueless. It was likely to hit Southeast Florida but suddenly shifted its path to the west coast of the peninsula, where the evacuation process had to change immediately without any time for individual decision-making. As such, this study aimed to develop a methodology to integrate evacuation and storm surge modeling with a case study analysis of Irma hitting Southeast Florida. For this purpose, a coupled storm surge and wave finite element model (ADCIRC+SWAN) was used to determine the inundation zones and roadways with higher inundation risk in Broward, Miami-Dade, and Palm Beach counties in Southeast Florida. This was fed into the evacuation modeling to estimate the regional clearance times and shelter availability in the selected counties. Findings show that it takes approximately three days to safely evacuate the populations in the study area. Modeling such integrated simulations before the hurricane hit the state could provide the information people in hurricane-prone areas need to decide to evacuate or not before the mandatory evacuation order is given.

1. Introduction

In recent decades, hurricanes have had devastating impacts on communities and infrastructure in the U.S. due to the strong winds, flooding, and storm surges they bring, especially along the coastal areas [1,2]. The National Oceanic and Atmospheric Administration (NOAA) estimates a total cost of USD 1.875 trillion in the U.S. from 1980 to 2020 due to weather- and climate disaster-related damages [3]. Among the U.S. states, the State of Florida, due to its unique geography which is surrounded on three sides by water and long coastlines, is significantly vulnerable to severe storms and hurricanes [4]. Florida, with 15.8 million people living in the coastal region, ranks third after California and New York based on a comparison of the populations who live in coastal counties [5]. During hurricane seasons, many Floridians must evacuate to safer locations following the voluntary and mandatory evacuation orders. Severe traffic congestion caused by hurricanes on the roadways makes this problem even more challenging for the residents of affected regions as they need to evacuate on time [6,7]. Recent hurricanes including Hurricanes Hermine (2016), Irma (2017), Michael (2018), Dorian (2019), and Sally (2020) have clearly shown that the evacuation process has been significantly affected by the hurricane track forecasting as well as the number of people who want to evacuate via evacuation routes.
Hurricane Irma is a clear example of such a dependence on hurricane forecast tracks within the cone of uncertainty. It posed a unique challenge for evacuees in Florida due to the uncertainty associated with the projected path of the hurricane and its unusual landfall in South Florida. Florida Governor Rick Scott declared a state of emergency for the entire state and urged residents to evacuate [8]. Many evacuees in Southeast Florida (i.e., the Miami metropolitan area) evacuated to Southwest Florida based on the hurricane’s initial forecasted track; however, they had to come back or travel further north since Irma shifted its path toward the west rather than hitting the southeast. Enveloping the whole state, Irma forced evacuees to drive farther and farther north, creating an evacuation route longer than any recent storm [9]. Thousands of Floridians fled from Irma using major interstates including I-95 and I-75 to travel north. However, heavy gridlocks along these major highways increased the travel times for evacuees. In addition, fuel shortages due to a high number of vehicles on major roadways and evacuation routes intensified the risk of life losses during the evacuation process [10,11].
The decision process of evacuations begins with the forecasts on the track and intensity of a storm, and subsequent determination of probable storm surge zones, which are expected to be inundated by flood water. State emergency management agencies like the Florida Division of Emergency Management (FDEM) determine such surge zones using hydrodynamic numerical models. The surge zones are estimated by numerically modeling a large number of hypothetical storms of different intensities. The second step is to determine evacuation zones by the superimposition of digital elevation models over storm surge zones [12], which are then used to answer key questions like how many people need to evacuate and when to start the process. It is to be noted that a hydrodynamic model is not used in this step, only an overlap of two layers is carried out. In short, surge and evacuation zones are based on a long-term, probabilistic approach, whereas evacuation decisions are given in a shorter time frame, constrained by track and intensity changes of individual hurricanes.
This type of hydrodynamic modeling has some shortcomings as brought to light during Hurricane Irma. Presently used numerical models consider only inundation due to storm surge and do not include short period waves and river discharges that enhance the floodwater levels significantly. In addition, the evacuation zones are fixed for a given area, determined only by the forecasted intensity of the storm. The zones do not change with changes in a hurricane track, and the size of its wind field. The effect of such changes in a hurricane track further complicates the evacuation process, especially when there is a limited time frame [13]. A post-storm assessment of Hurricane Irma indicates only a moderate storm surge and wind damage near the landfall location of Marco Island on the Southwest coast of Florida given its Category 5 strength [14]. However, it was expected to hit the Miami metropolitan area based on earlier forecasts, bringing a much larger population under risk, necessitating an evacuation of the whole region.
In this study, a coupled storm surge and wave model is used for numerical modeling to address the first limitation, the results of which are then used to model the inland inundation in order to improve the identification of storm surge zones. Additionally, such zones are flexible and are subject to change with track and intensity changes between successive forecasts, which help streamline hurricane evacuations. The coupled ADCIRC+SWAN model is previously validated in terms of its long-term impact on storm surge on the Gulf coast [15,16,17]. Inland inundation modeling requires a small, fine resolution finite element domain to capture flood water behavior over small-sized land features [18]. This smaller domain is nested within the larger coupled model domain as performed in a number of studies [19,20,21].
There has been substantial research associated with hurricane evacuations [22,23,24,25,26]. In [22], a review was conducted on the highway-based evacuation modeling and simulation, and its evolution over the past decade. This review included the current state of modeling in the forecasting of evacuation travel demand, distribution and assignment of evacuation demand to roadway networks to reach destinations, assignment of evacuees to various modes of transportation, and evaluation and testing of alternative management strategies to increase capacity. Traffic impacts of large-scale and regional evacuations due to hurricanes were studied in [23,24,25], with a focus on traffic simulations, dispersal patterns on secondary roadways, and routing strategies, respectively. In [26], lessons learned and best practices in evacuation planning based on Hurricane Katrina were identified.
Specifically, the focus of evacuation studies in recent years has changed mainly due to the rise in the frequency and intensity of these disasters as well as the unpredictability of these extreme events [27,28,29,30]. The efficiency of the contraflow (one-way) evacuation has been studied in [27] whereas Hurricane Matthew and Sandy evacuation patterns were studied in [28,29], respectively. Agent-based models have also been used in the literature for simulation the emergency evacuations [30]. Zhang et al. [31] suggested a conceptual framework to explore the concepts of risk, resiliency, and investment in evacuation planning using a set of variables including evacuation demand and supply. The concepts of evacuation modeling, as well as evacuation management strategies in large-scale evacuations, were explained in detail in [32]. Please refer to [33,34,35,36,37] for more information on the literature on evacuation studies with a focus on evacuation modeling, emergency plans, policies, and current practices. Yabe and Ukkusuri [38] assessed the effects of income inequality on evacuation behavior using mobile phone location data during the Hurricane Irma evacuation process. The results revealed that higher-income populations were more likely to evacuate to safe areas in comparison to lower-income evacuees. Zhu et al. [39] proposed an integrated evacuation behavior model with an agent-based simulation model built in MATSim to model hurricane evacuation for Northern New Jersey.
Vitetta et al. simulated a transport system via the use of the decision support systems (DSS) in an evacuation scenario to support evacuation planning [40,41] whereas Marcianò et al. proposed a system of models for the signal setting design of signalized intersections during evacuations. The authors defined an optimization problem (design model) and used a heuristic genetic algorithm to solve this [42]. In addition, Di Gangi et al. applied different static and dynamic models to simulate the evacuation of an urban area in Italy [43,44]. Likewise, Russo and Rindone applied a Data Envelopment Analysis (DEA) approach to evaluate different evacuation plans in an urban transport system [45]. Furthermore, Wong et al. [46] conducted an online survey to collect data based on the decisions made by those impacted by Hurricane Irma. In this study, a latent class choice model and, subsequently, a portfolio choice model (multi-dimensional choice modeling) were developed to analyze the evacuation behavior. In another study, Yin et al. [30] developed an agent-based travel demand model and applied this to the Miami-Dade region for a hypothetical category 4 hurricane. More recently, Roy and Hasan developed an approach to model the dynamics of evacuation behaviors using Twitter data of active users from Hurricane Irma [47]. Sadri et al. [48] developed a mixed logit model to determine the variables affecting residents in Miami Beach, Florida in selecting one of the six major bridges while evacuating during a major hurricane. Elsewhere, Kocatepe assessed the vulnerable citizens’ evacuation in South Florida via a transportation evacuation model, namely Transportation Interface for Modeling Evacuations (TIME), which was developed by CDM Smith for the (FDEM) and Florida Department of Transportation (FDOT) [49,50]. In another effort, Marasco et al. [51] evaluated the evacuation travel times patterns in the Hurricane Irma case using Google Distance Matrix API travel time estimates focusing on Florida, Georgia, and South Carolina states.
Recently, a few studies have focused on analyzing spatial and temporal traffic patterns during Hurricane Irma utilizing real-world traffic datasets [52]. For instance, Ghorbanzadeh et al. [53] assessed the spatiotemporal traffic impacts of Irma on Florida’s major highways including I-95, I-75, I-10, I-4, and turnpike (SR-91) using real-time traffic data before, during, and after the landfall. The authors conducted the analysis in an interval of six hours between 5 September 2017 and 15 September 2017 given Irma’s landfall on 10 September 2017. Their findings showed high levels of congestion a few days before and after hurricane landfall. More recently, Huang et al. [54] assessed the feasibility of integrating storm surge modeling and traffic analysis to evaluate the Hurricane Irma evacuation in Florida. Results revealed that the uncertainty of hurricane forecasting caused an overreaction in the evacuation process. This massive evacuation caused serious traffic congestions and a shortage of gasoline in the entire state.
Reviewing the underlying literature, there is still a research gap regarding the integration of storm surge and evacuation modeling, specifically for a large-scale hurricane evacuation. As such, this study aims to develop a methodology to integrate evacuation and storm surge modeling with a case study analysis of Hurricane Irma hitting Southeast Florida. More specifically, this paper intends to address the following research question: What would have happened in the context of evacuations if Hurricane Irma hit Southeast Florida? Answering this question and studying the findings would help the emergency officials in understanding the impact of potential hurricane tracks bounded by the hurricane cone and their uncertainties on the potential hurricane impact area. As such, this study provides a methodology to integrate storm surge modeling with evacuation modeling focusing on the hurricane evacuations by considering potential hurricane tracks bounded by the hurricane cone, with a case study application on Hurricane Irma. The storm surge modeling portion provides a novel approach to identifying the risk of a hurricane’s occurrence at a specific location. Evacuation modeling, on the other hand, contributes to the reduction in this exposure on the impacted populations. This type of modeling will provide valuable information to the residents in the potential hurricane impact area so that they can make informed decisions in evacuating or not.
For this purpose, a coupled storm surge and wave finite element model (ADCIRC+SWAN) was used to determine the inundation zones and inundated roadways in Broward, Miami-Dade, and Palm Beach counties in Southeast Florida. The water levels at the coast, forced by hurricane winds, were determined first. The domain covers the hurricane track in the ocean until landfall. The obtained surge and wave water levels were applied as boundary conditions to a numerical inundation model which derives inland inundation water levels. The model results were then exported ArcGIS to determine the inundation zones and to identify the risk of inundation of roadways in the study area. This was fed into the evacuation modeling in order to estimate the regional clearance times and shelter availability in the selected counties. The findings of this study can provide vital insights for emergency management agencies and state officials to prepare more efficient preparedness and response plans for potential hurricanes in Florida. The proposed approach and results will be discussed in detail in the following sections.

2. Methods

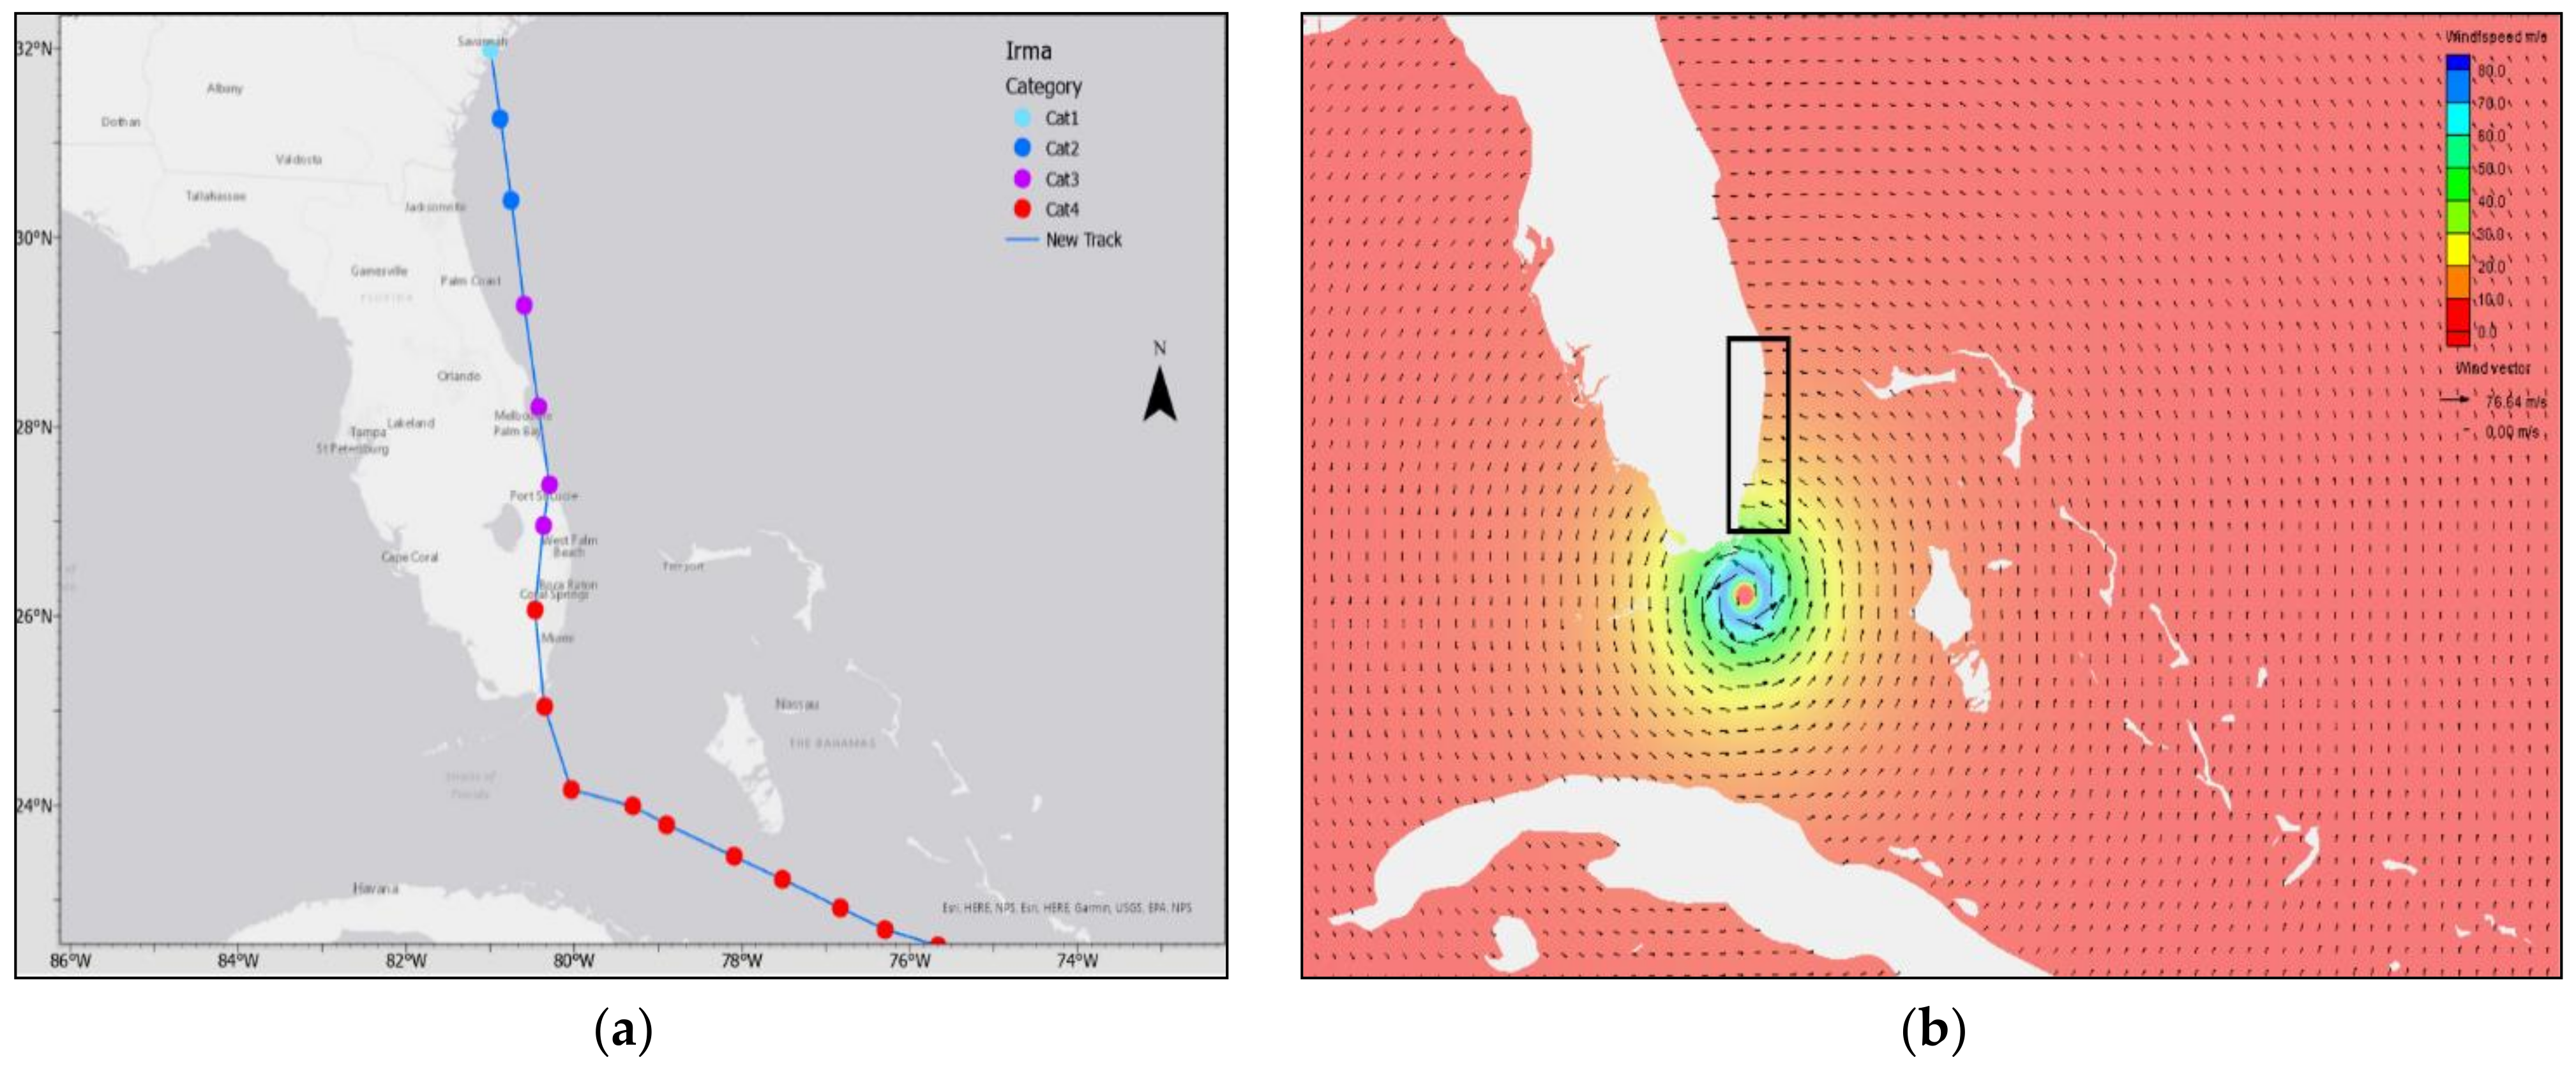
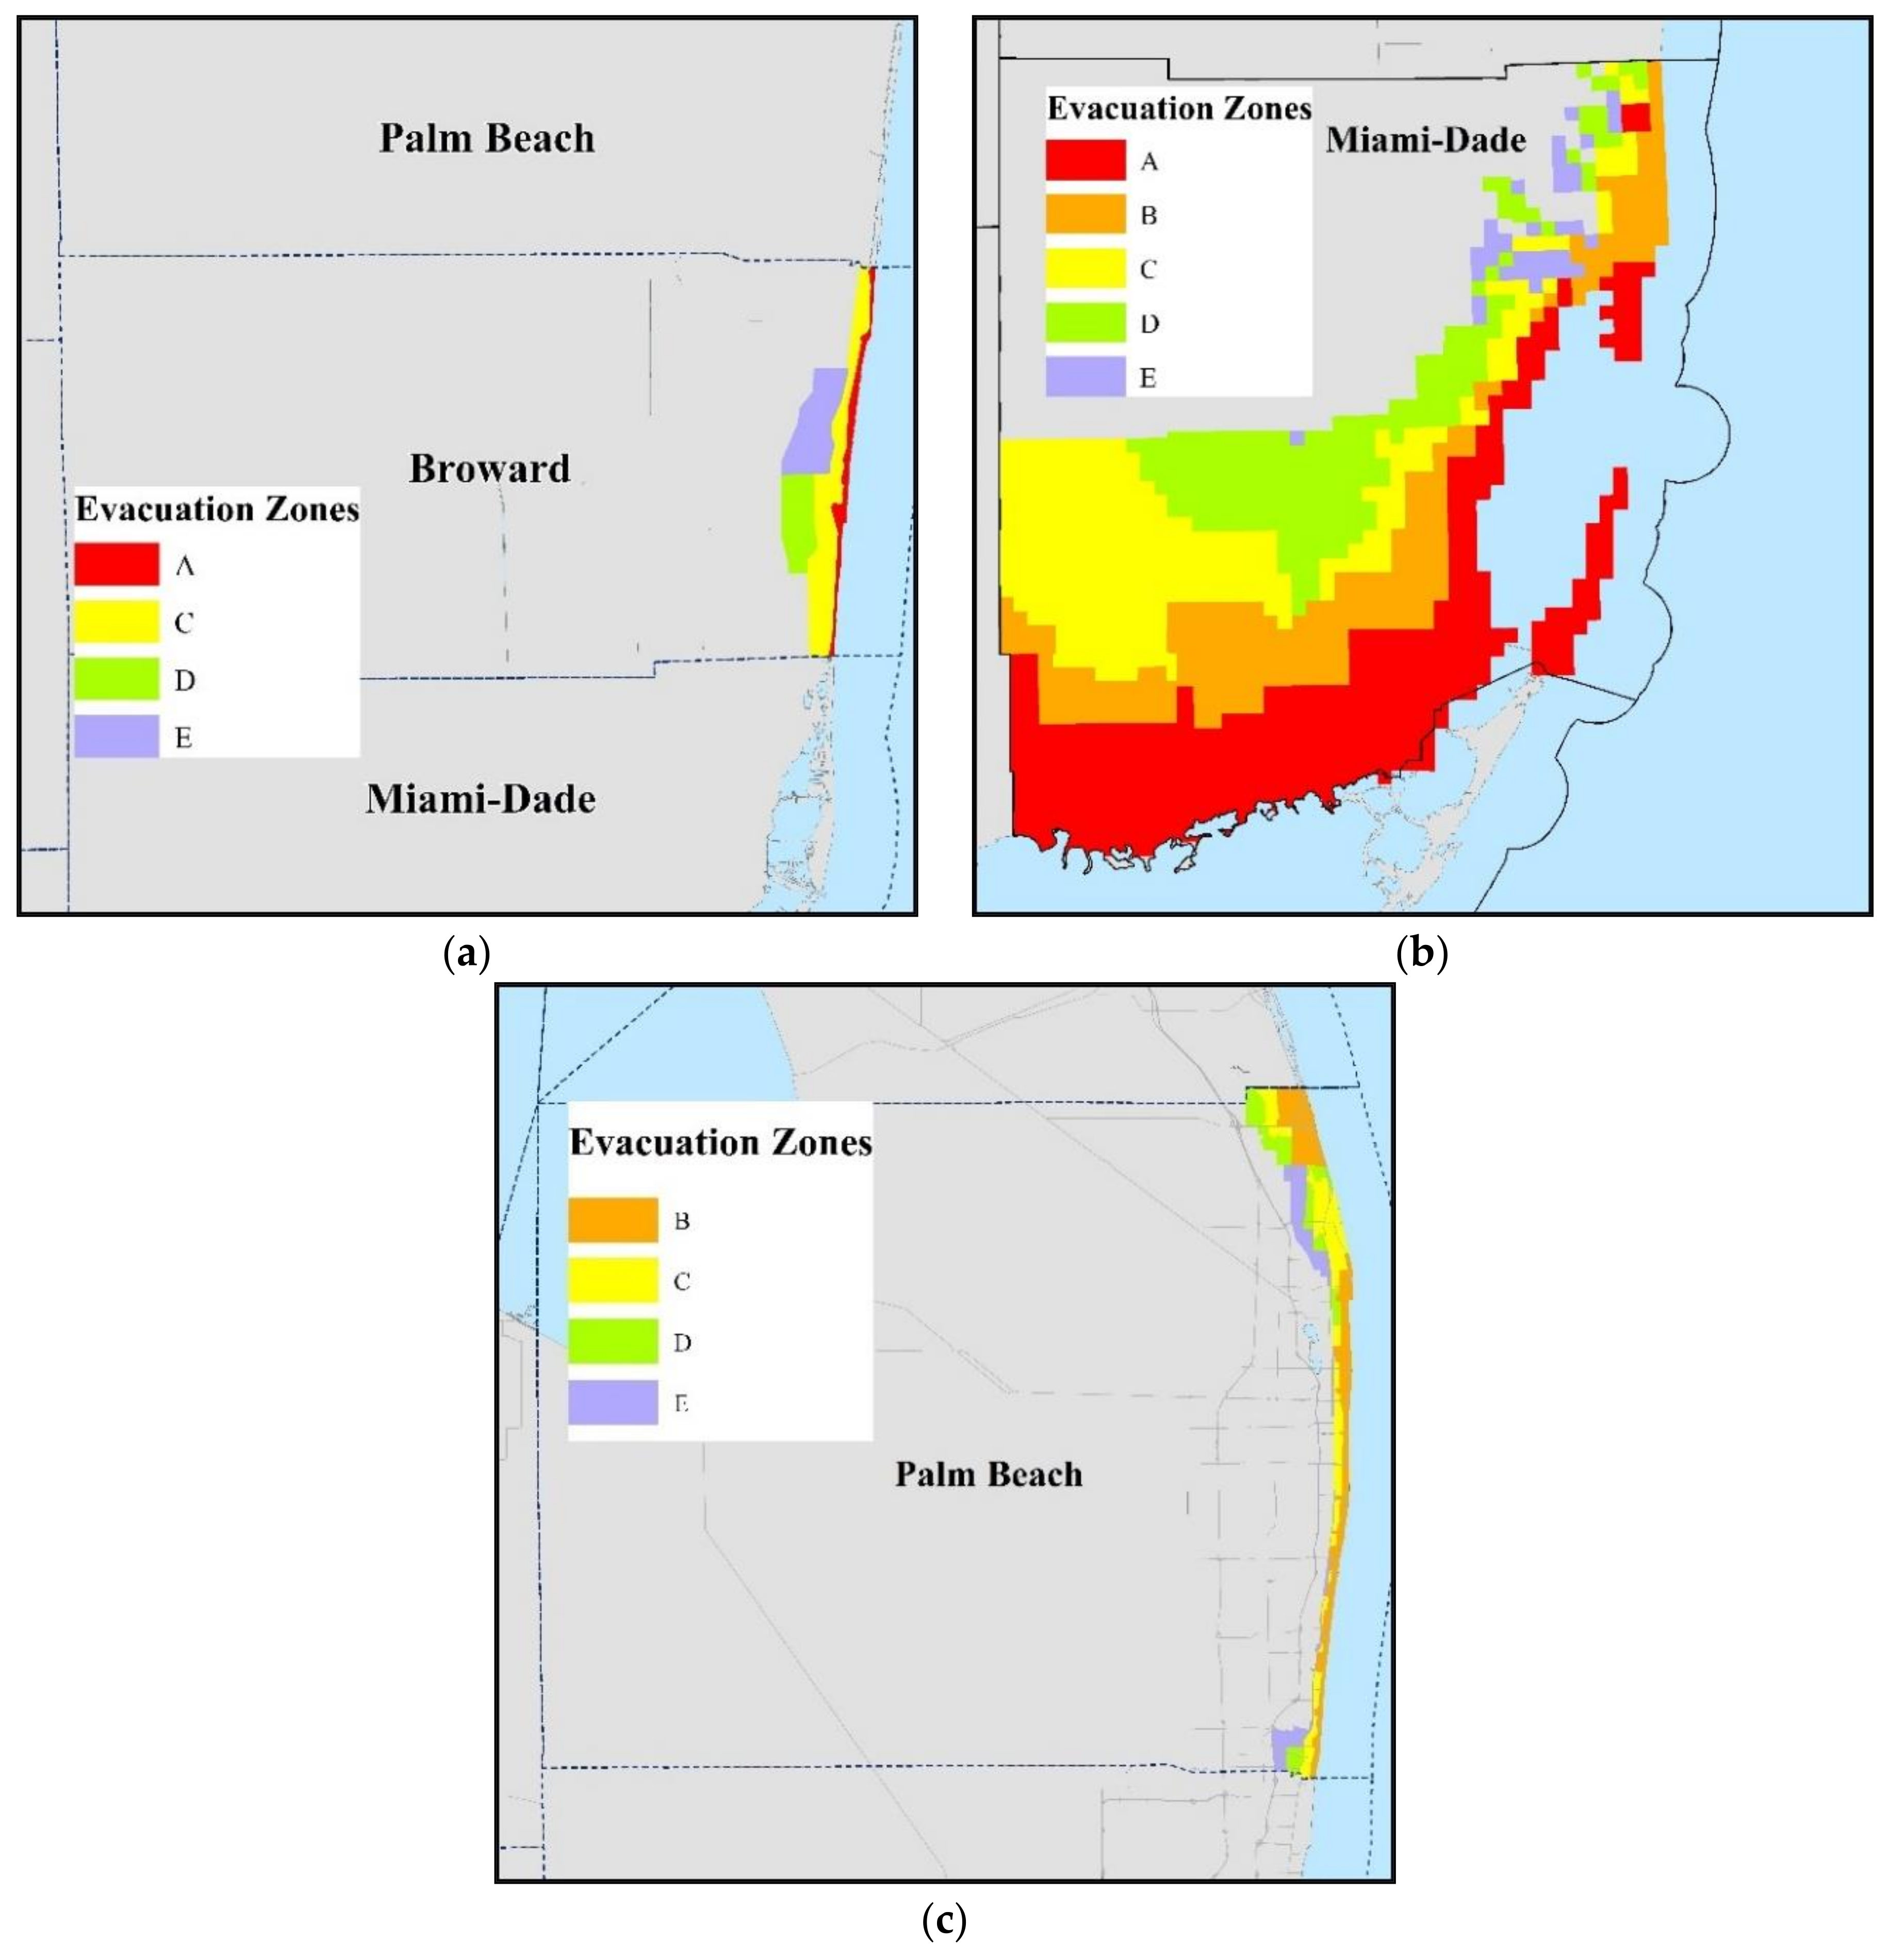
2.1. Study Area and Hurricane Irma

Irma, with maximum sustained wind speeds of 185 mph, was the most powerful Atlantic Ocean hurricane ever recorded in the history of the U.S. Hurricane Irma made landfall in Florida as a Category 5 hurricane on 10 September 2017 [55,56,57]. Irma with a total approximate cost of USD 50 billion is the fifth most costly hurricane in the U.S. and caused 47 direct deaths [58]. Over six million people were ordered to evacuate ahead of the storm, which is the largest hurricane evacuation in the history of Florida [46,56]. In 54 out of 67 Florida counties, evacuation orders were issued, including 42 counties with mandatory and 12 other counties with voluntary orders. This massive evacuation resulted in extreme traffic delays and bottlenecking along the highways in the entire state, specifically major interstates [59]. Moreover, the uncertainty surrounding Irma’s path seriously challenged the evacuation process and left many evacuees clueless. Irma was likely to strike Southeast Florida but suddenly shifted its path to the west coast of the peninsula. While thousands of residents moved to the west to flee from the hurricane, the unexpected path change of Irma made them go back. This quick mobilization also resulted in heavy traffic congestion and bottleneck along several major highways across Florida [10]. Figure 1a–d obtained from the National Hurricane Center (NHC) and NOAA present Hurricane Irma’s track on 6 September 2017, 7 September 2017, 8 September 2017, and 10 September 2017, at 8 a.m., respectively [60]. These figures are given to clearly show the unpredictability of the hurricane’s path. As seen, Hurricane Irma’s predicted path varied from affecting the east coast to the west coast. As such, this study aimed to assess the impact of Hurricane Irma if it had hit Southeast Florida rather than the west coast of the state. Hence, we considered three counties located in South Florida for the proposed case study, including Broward, Miami-Dade, and Palm Beach counties. Figure 2 illustrates the selected counties along with the transportation network.

2.2. Data Description

In this study, several data sources were used to develop the proposed integrated methodology to estimate the evacuation clearance times. Demographic, socioeconomics, shelters, and behavioral assumptions data were obtained from the Statewide Regional Evacuation Study Program (SRESP) and South Florida regional planning councils (SFRPC) [61,62]. The roadway network was based on the FDOT Statewide Model Network [63]. In addition, NHC data of Hurricane Irma’s track and intensity were used to derive wind fields for the storm surge numerical model. Table 1 summarizes all the data were used in the present study for modeling purposes along with their types and sources.

2.3. Methodology under Hurricane Irma-Hypothetical Track Hitting Miami

This study proposes an integrated methodology that utilizes storm surge and hurricane evacuation modeling with a case study application of Hurricane Irma in Southeast Florida. This type of analysis can provide valuable information for emergency management agencies to develop more efficient evacuation plans for potential hurricanes in the state that they may encounter in the future. Figure 3 illustrates the conceptual flowchart of the research methodology. The methodology steps are discussed in the following subsections.

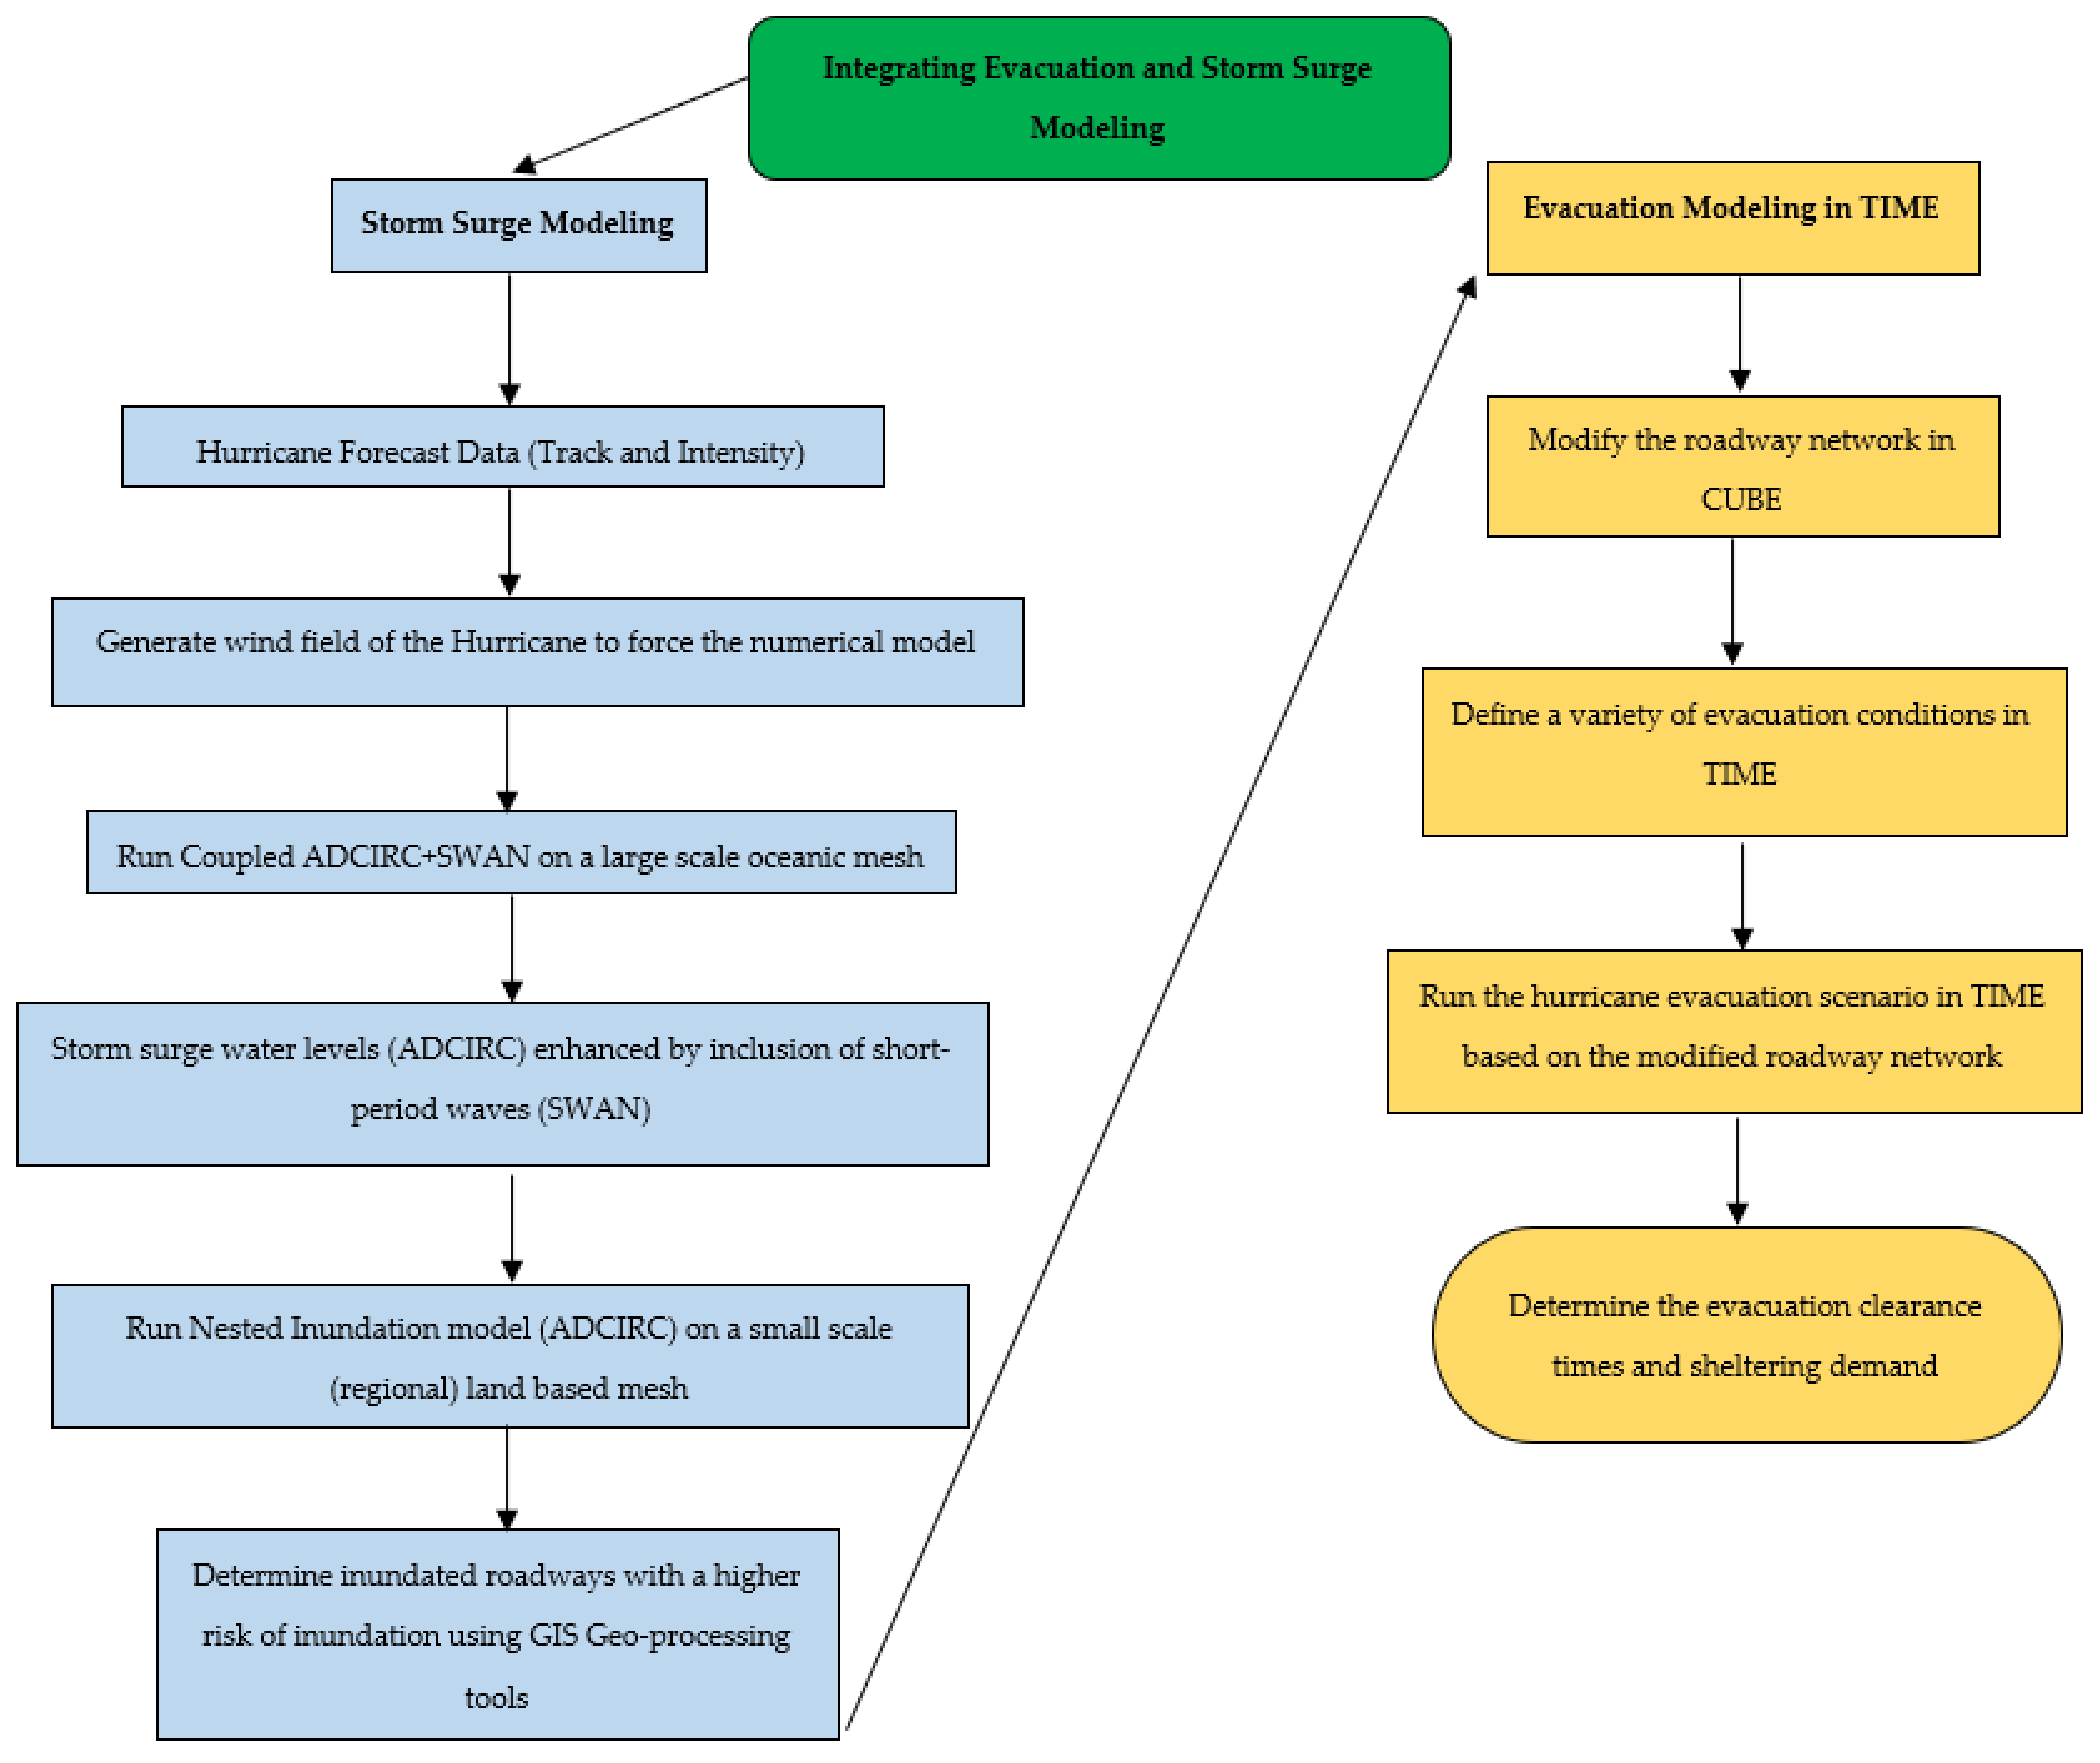
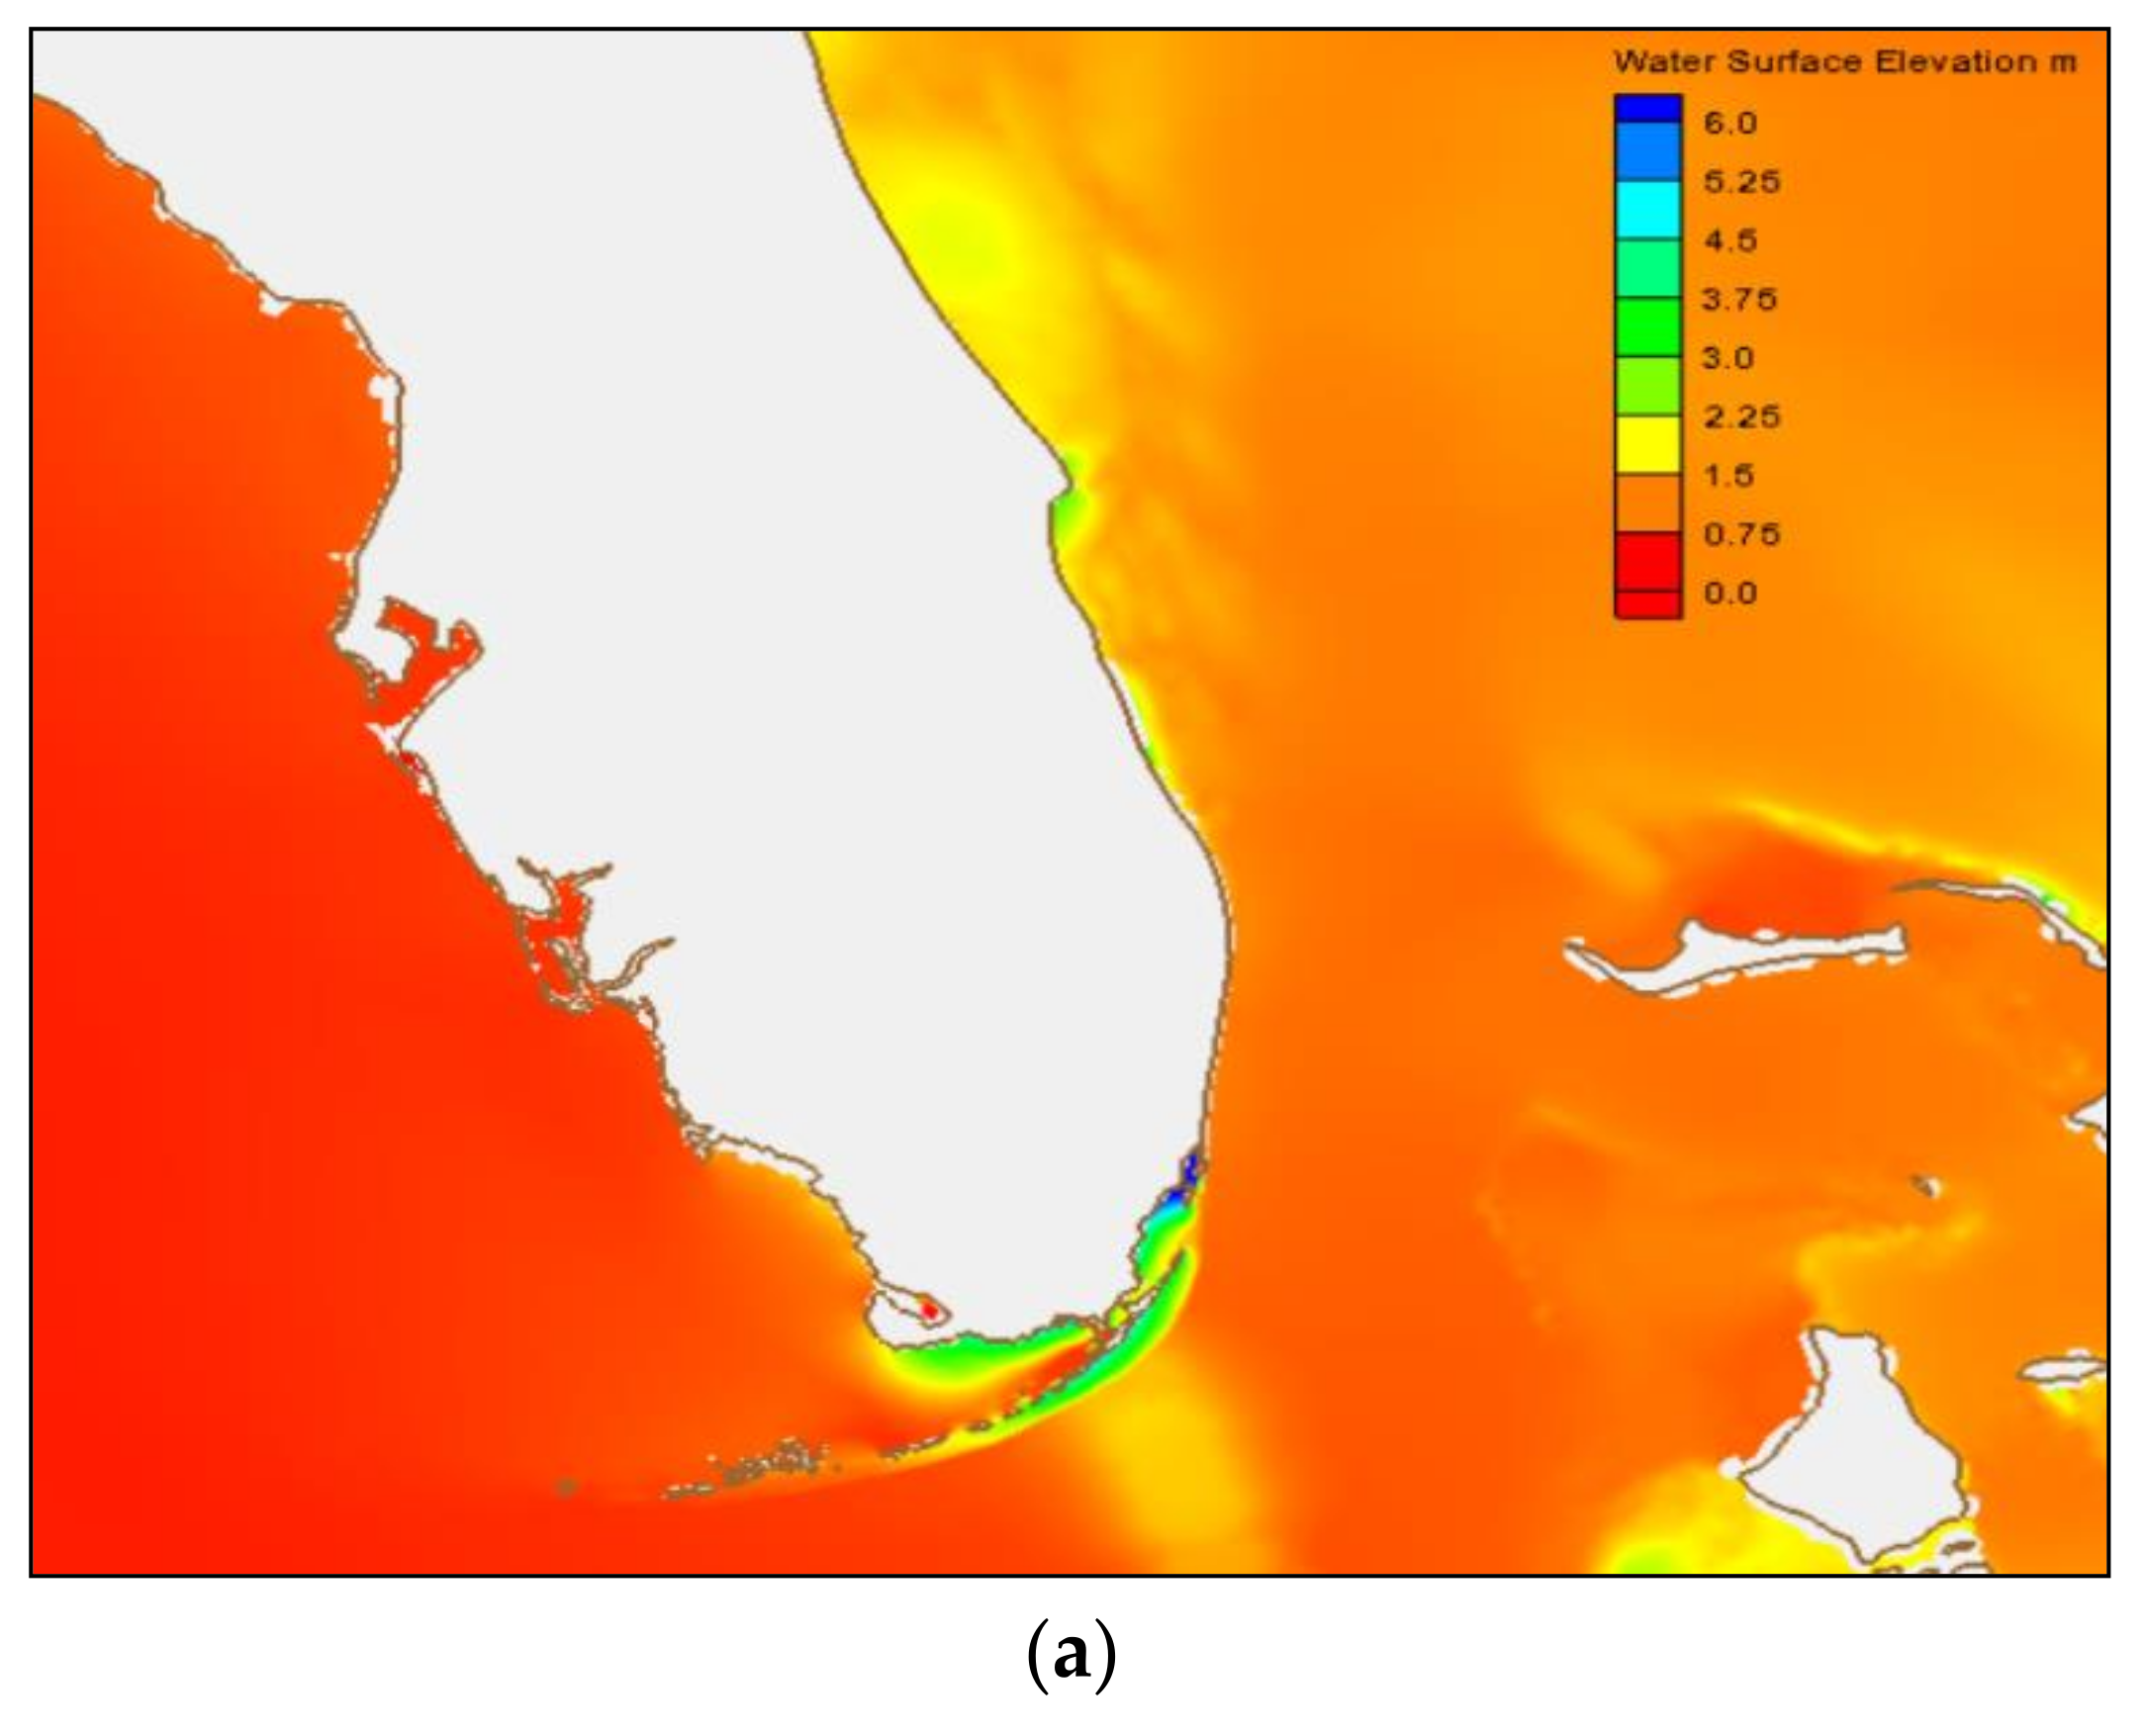
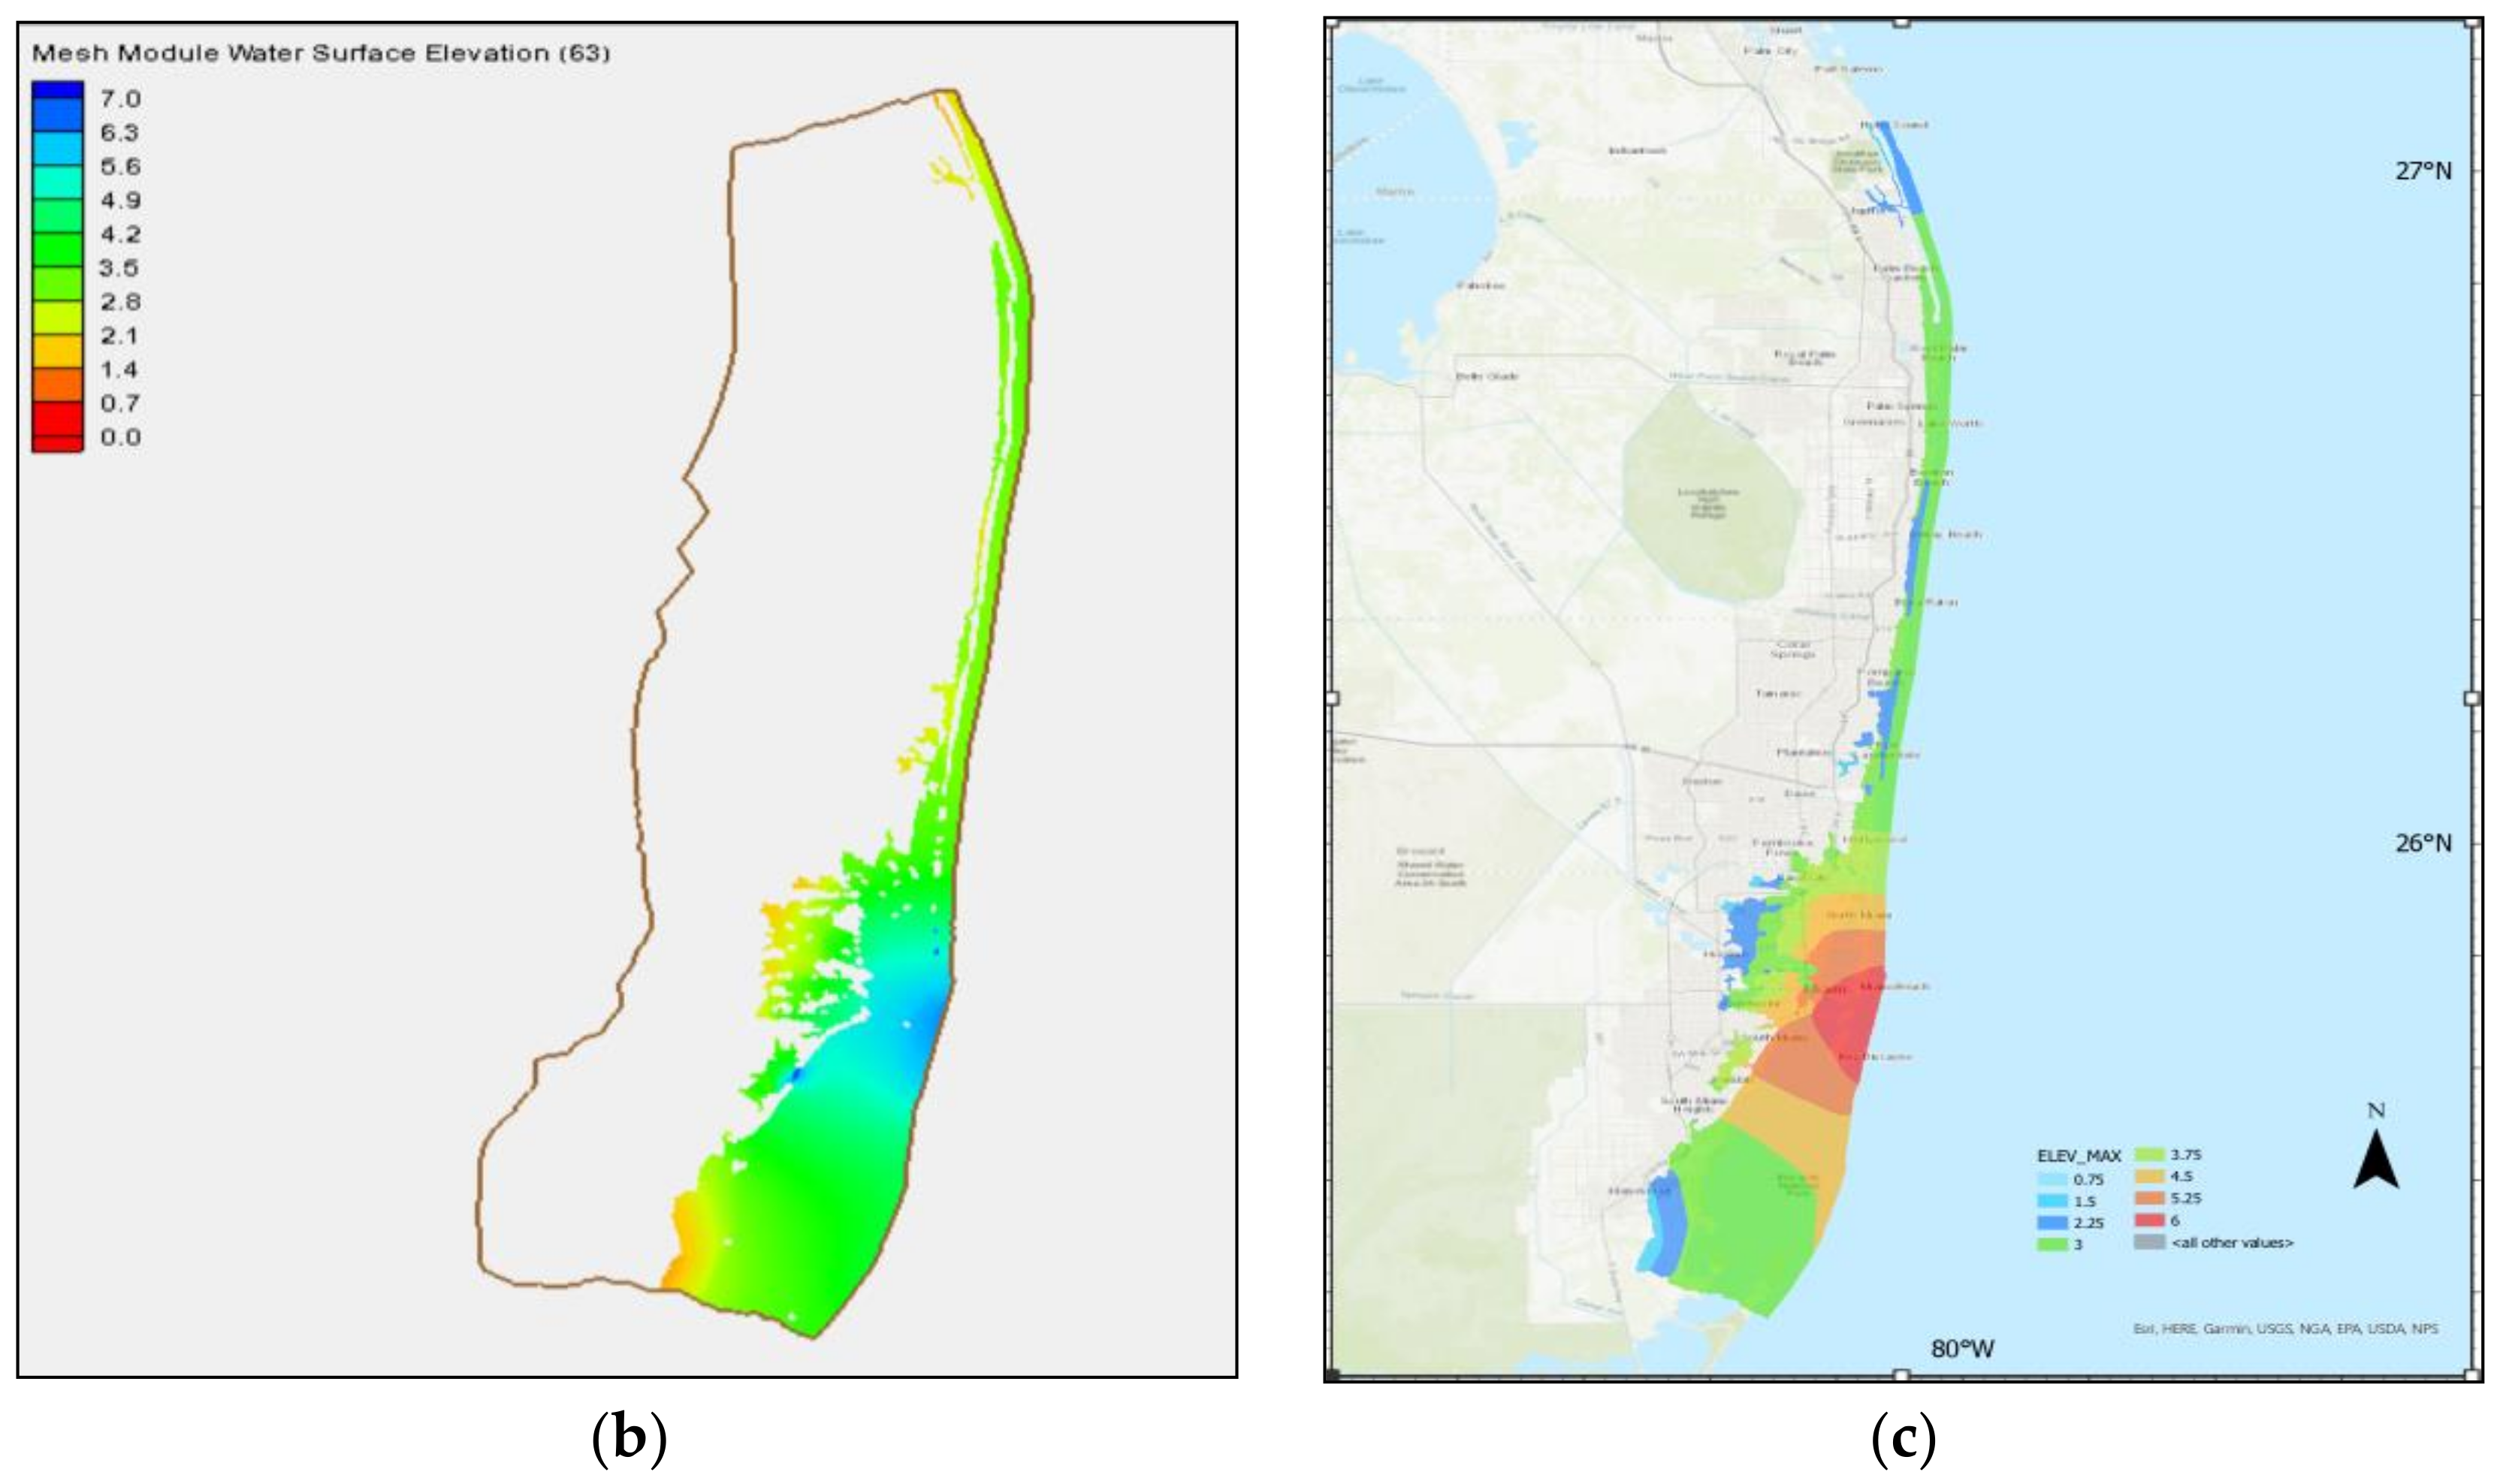
2.3.1. Storm Surge Modeling

ADCIRC is a finite element numerical model which solves the 2D depth-integrated shallow water equations to determine surge water levels at the coast due to hurricanes. SWAN is a spectral wave model dynamically coupled with ADCIRC, adding the effect of water levels due to short period waves. The coupled model was forced with Irma’s wind field, hypothetically making landfall in the Miami area (Figure 4a). Hourly wind fields were calculated by the method used and validated for the region [64]. Figure 4b shows a snapshot of the hurricane wind field near the landfall. The large-scale model was simulated for a 5-day period. The output of the coupled model around landfall, when maximum surge levels were obtained, was used as the boundary condition for a 6-h simulation of inland inundation which subsequently resulted in the storm surge zones. A regional domain nested inside the larger domain was used here. The ADCIRC model has been previously validated in the study of storm surge induced by Hurricane Irma [54]. Further enhancement was performed by dynamic coupling of storm surge (ADCIRC) and wave (SWAN) models.

2.3.2. Integrating Storm Surge and Evacuation Modeling

At this stage, a hurricane evacuation scenario was developed in Transportation Interface for Modeling Evacuations (TIME) software given the inundated zones and roadways that had the risk of flooding obtained through the first step. In 2010, CDM Smith initially developed TIME software to be used by the Northeast Florida Regional Council and the FDEM as part of the SRESP. Generally, TIME is used to analyze evacuation scenarios under a variety of conditions and estimate evacuation clearance times [65]. Clearance time is the time it takes for all evacuees to leave the vulnerable areas following an evacuation order. In other words, clearance time is the total time it will take for the residents of an impacted area to prepare for an evacuation and leave that region before the hurricane hits. TIME integrates CUBE transportation demand modeling software of Bentley Systems and Esri’s ArcGIS Desktop.
Although evacuations generally happen before the hurricane hits and therefore roadways would be open, Hurricane Irma, with its uncertain path, also brought a lot of rain to a very large region leading to a higher risk of flooding on vulnerable roadways. As such, first, those roadways that had a higher risk of inundation were considered as flooded in CUBE. Then, an evacuation scenario was created using the modified roadway network as well as other assumptions to model the hurricane evacuation in the selected counties of Florida.

2.3.3. Scenario Assumptions

To develop an evacuation scenario within the TIME software, there are a variety of evacuation conditions that should be defined precisely, including evacuating counties, analysis year for socioeconomic data and transportation network, behavioral assumptions, shelters, and tourist population. TIME emergency evacuation model was used in this research to find the dynamic travel times during an evacuation. This model provides a realistic evacuation simulation based on the evacuation demand loading curves for each time segment, considering the evacuation zones, response rates, shadow evacuation, background traffic, and shelter usage. In this study, population projections and transportation networks for 2020 were utilized. The study area network was obtained from the Florida Standard Urban Transportation Modeling System (FSUTMS) [66]. In each evacuation scenario, the number of student populations in residence (university population) were assigned to the model. Since Irma happened in September 2017 in which the major universities and colleges were open at the time of the hurricane evacuation process, 100% of students in residence were considered in the model.
Moreover, evacuations were modeled in the Statewide Regional Evacuation Study Program (SRESP) model by designating an intensity of evacuation for each county. The evacuation level has a direct impact on the amount of evacuation traffic that is ultimately loaded onto the model’s highway network. Evacuation level ranges from A through E with E being the most intense (category 1 to 5). The level of the evacuation is consistent with the evacuation zone being ordered to evacuate. For each county, there may be up to five major evacuation zones ranging from Zones A to E as well as an inland area. Evacuation zones were designated based on the storm surge impact. During evacuation orders, inland areas are not always mandated to evacuate; however, including inland areas in the scenarios helps in accounting for shadow evacuations. This is since people living in these areas may also decide to evacuate even if evacuation orders are placed in other zones of a county [67]. The number of individuals who evacuate from evacuation zones as well as inland areas (areas other than the designated evacuation zones) or shadow evacuation is considered as “demand”. Based on the storm surge zones obtained in the previous step, an evacuation level D (based on category 4 hurricane impact) was assigned to the three selected counties. Evacuation zones corresponding to Broward, Miami-Dade, and Palm Beach counties are illustrated in Figure 5a–c, respectively. Additionally, those counties can experience shadow evacuations during the evacuation process. As seen in Figure 5b, Miami-Dade has all evacuation zones from A through E. Broward and Palm Beach counties have four evacuation zones.
In addition, there are two types of evacuation participation rates for each scenario: planning assumptions and 100% response rates. An evacuation scenario with a 100% response assumes that 100% of people including those who live in site-built homes and mobile homes in evacuation zones will evacuate. Furthermore, this also assumes that some people located outside the evacuation zones will also evacuate (shadow evacuations) corresponding to the planning assumptions of the SRESP. For an evacuation scenario using planning assumptions, the evacuation participation rate is based on the participation rates from the behavioral analysis portion of the SRESP. Here, a 100% response scenario was implemented in the counties based on the SRESP for the South Florida region. Furthermore, due to the tourist attraction of the State of Florida and more specifically in the selected counties, we included the tourist population for each county in the evacuation analysis. In addition, there are two types of shelters that can be considered in the scenario: all open and primary open. “All open” considers that all public shelters are open and “primary open” only uses those primary shelters in the evacuating counties. According to the SRESP base scenario, we assumed that “all open” shelters are open in the evacuation scenario. There are 478 shelters with a total capacity of 258,188 in the study area. The regional destination rates represent the percentages of the evacuees who stay in their county or evacuate to other regions. Florida’s ten RPCs are shown in Figure 6 [68]. Table 2 also presents the destination rates corresponding to the different regions. These rates were selected in accordance with the planning assumptions developed by the SRESP and South Florida RPC [62]. This is derived from behavioral surveys and analyses conducted in Southeast Florida. These values were assigned to the 10 regions in TIME software to develop the evacuation scenarios. “Others” in Table 2 show those evacuees who leave the State of Florida. As seen, “South Florida”, “Others”, and “East Central Florida” have the highest destination rates compared to other regions. We also note that this study assumes all evacuation zones to begin the evacuation process at 7 a.m. of the next day when an evacuation order is issued.
In the present study, the CUBE Voyager macroscopic travel demand model was used which is based on a four-step modeling process (trip generation, trip distribution, mode choice, and trip assignment). It utilizes the Bureau of Public Roads (BPR) function to move the vehicles throughout the highway network. CUBE Avenue is an add-on to the CUBE Voyager that facilitates the dynamic traffic assignment through a mesoscopic approach. [69,70]. In general, TIME runs the evacuation scenarios on top of CUBE Voyager and CUBE Avenue [71]. Please refer to [72] for more information on using DTA in FSUTMS for transportation planning in Florida. Table 3 summarizes the scenario assumptions that were considered in this paper to build the hurricane evacuation model in Southeast Florida. Clearance times and sheltering demand in the selected counties were estimated based on the following scenario assumptions:
  • 12-h S-curve loading was used.
  • Evacuation level D (based on a category 4 hurricane) was considered.
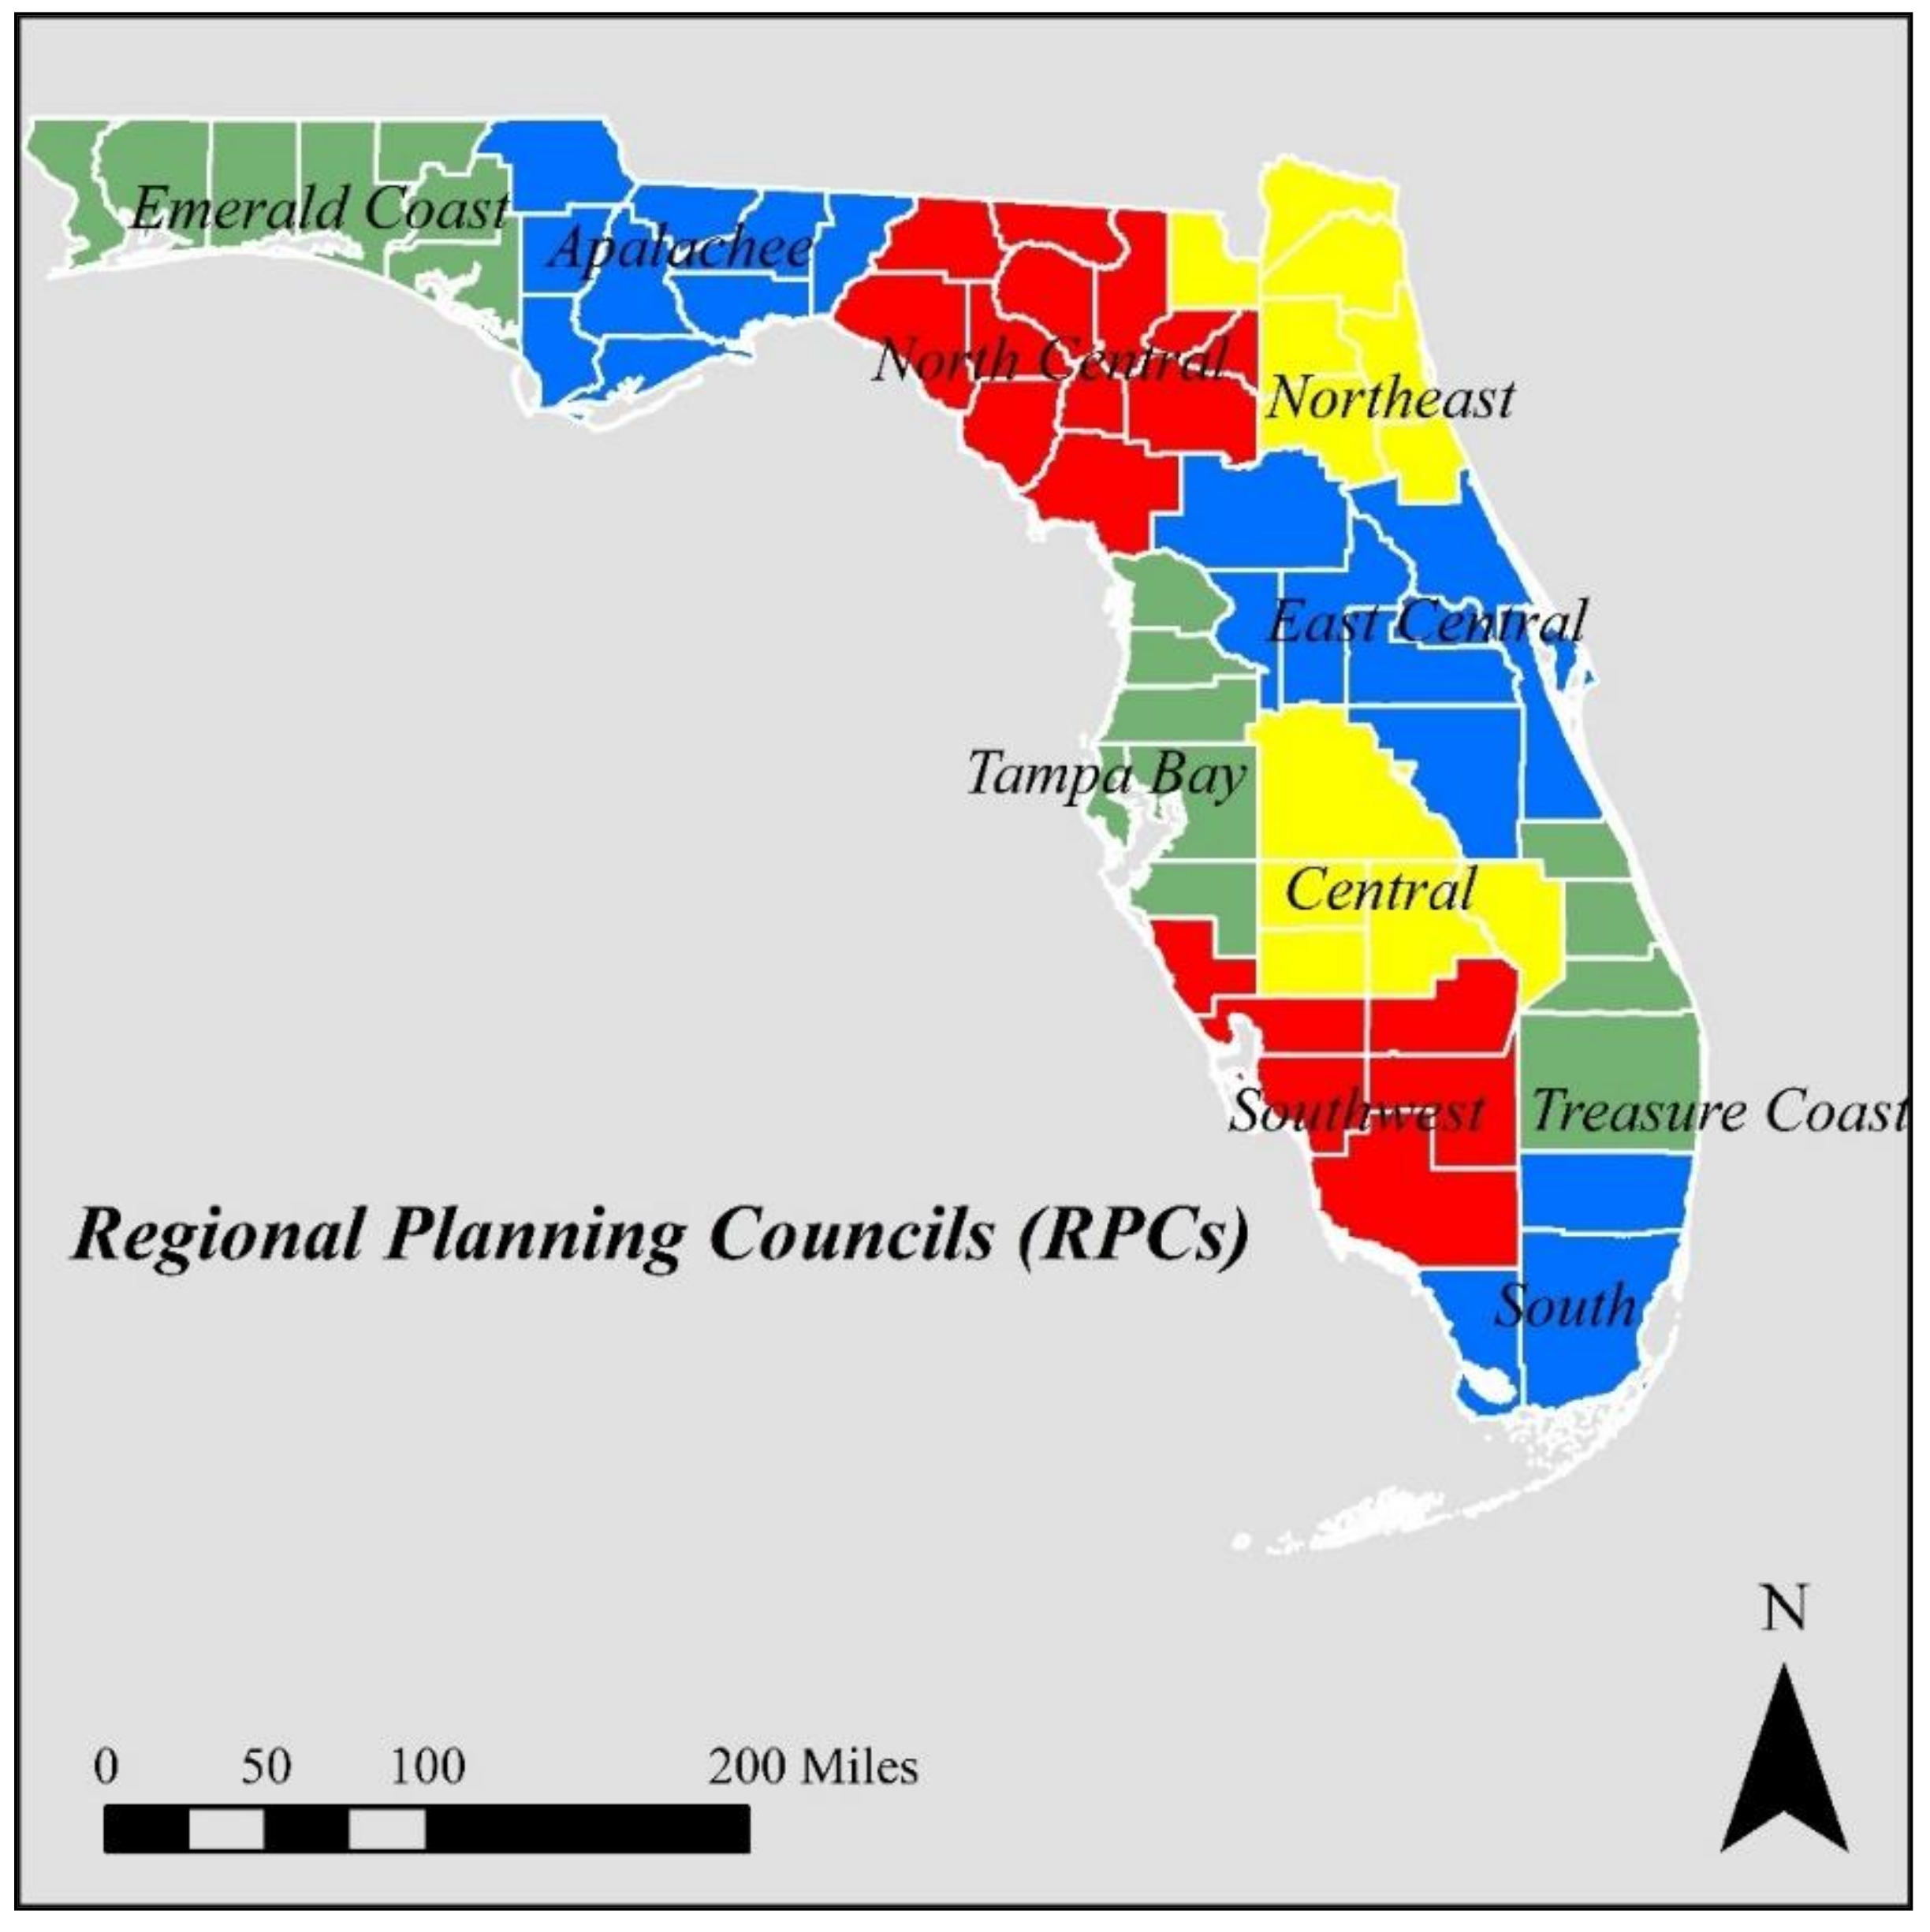
  • Inland areas (areas other than the designated evacuation zones) usually experience a shadow evacuation, which was accounted for in the proposed methodology. Evacuations emanating from areas under mandatory evacuation orders were modeled in accordance with the planning assumptions developed by the Statewide Regional Evacuation Study Program (SRESP).
  • Background traffic was implemented as link capacity fluctuations due to the computational power limitations of the TIME software.
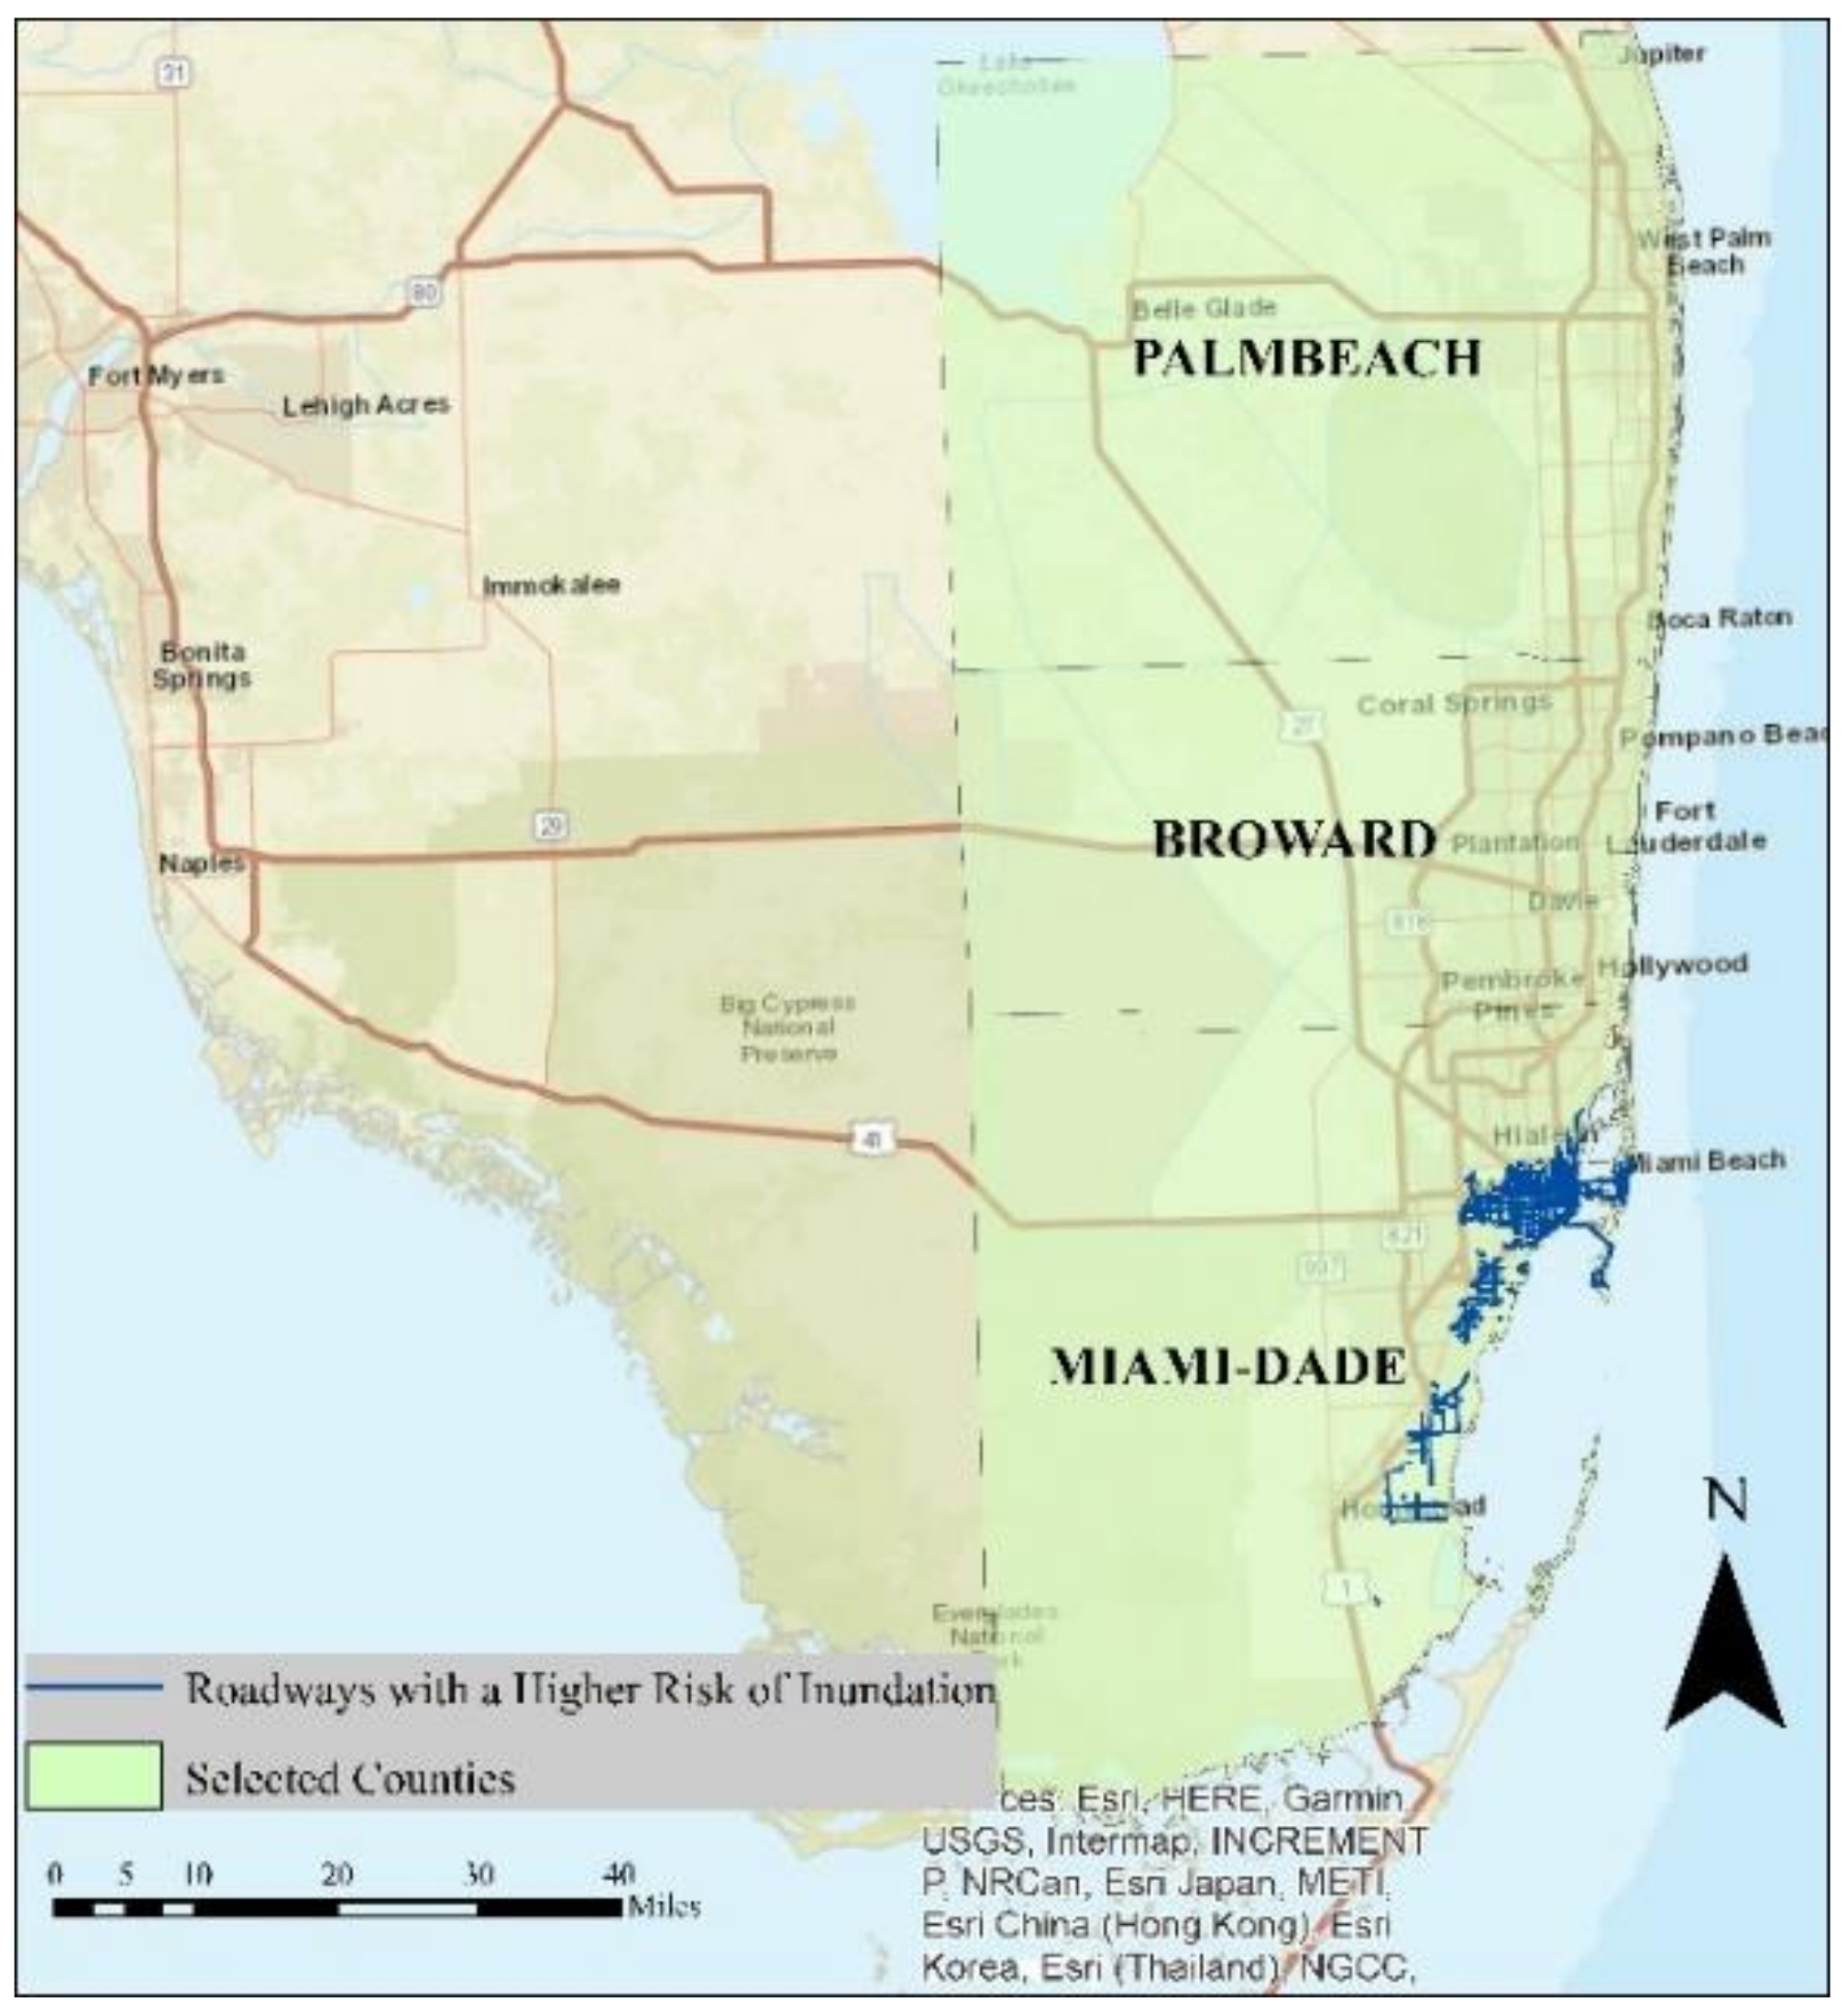
  • Highway network was modified based on the roadways that have a higher risk of inundation to model a post-disaster network.
  • All public shelters were considered.
  • Dynamic travel times were obtained for the time segment where evacuation volume was the highest overall in the network.
  • We assumed a passenger per vehicle rate of 1.8 during the evacuation in the TIME software.
Table 3. Scenario assumptions.
Demographic Data2020
Highway Network2020
One-Way OperationsNone
University PopulationInclude
Tourist RateInclude
SheltersAll open
Response Curve12-h S-curve Loading
Behavioral Response100% Response
Evacuation LevelLevel D (Category 4)
Regional Destination RatesSouth Florida RPC
Counties EvacuatingBroward, Miami-Dade, and Palm Beach

3. Results and Discussions

As stated previously, the first step in this study was to accurately model the storm surge and subsequent inland flooding. Here, a category 4 hurricane hypothetically hitting Miami was modeled using the coupled ADCIRC+SWAN model. Results indicate that the storm surge water levels on the coast were as high as 6 m, which is enhanced by the waves in the model (Figure 7a). This maximum occurred during the landfall of the hurricane in the model. This water level was applied to the nested model as an ocean boundary condition. This nested model was not coupled since the wave model SWAN was incapable to work on land-based domains. The maximum inundation water level obtained in this phase was of the same order close to the bay area (~6 m). Note that the water level reduces as it propagates further inland (Figure 7b). This was then exported to ArcGIS, where the roadways that had the highest risk of inundation were determined based on the obtained surge zones. (Figure 7c). It should be noted that the zones were discretized into eight bands based on the water level. The zones indicate regions that would be flooded if a category 4 hurricane along the track shown in Figure 4a hits Southeast Florida. These zones were then exported to ArcGIS so that roadways of higher flooding risk were found out for subsequent use in hurricane evacuation models. The inundated roadways are shown in Figure 8. It is important to note that interstates such as I-95 and I-75 are all elevated and it is very unlikely that they would be flooded. Hence, the flooded roadways are mainly minor arterial or coastal roads that have sections at the same level of the ocean.
After conducting the storm surge model, a transportation evacuation model was created based on the inundation zones and roadways to determine the evacuation clearance times for Broward, Miami-Dade, and Palm Beach counties in Southeast Florida. The evacuating population and vehicles, sheltering demand as well as clearance time for each county, are summarized in Table 4. As seen, the total evacuating population ranges from more than 564,000 to more than 2 million people within the three counties. According to the results, Miami-Dade County, with a total evacuating population of over 2 million people and more than 746,000 of total evacuating vehicles, has the highest evacuation demand compared to other counties. Broward ranks second in terms of the number of evacuees and evacuating vehicles. Another interesting finding is that Broward County has more than 51,000 mobile homes, which is the highest compared to others. However, Miami-Dade County still ranks first in terms of site-built population (more than 1.9 million) and evacuating vehicles (more than 682,000). Additionally, Broward is the only county without a university population and university evacuating vehicles.
According to Table 4, shelter demand in the three counties ranges from more than 33,500 persons in Broward and Palm Beach counties to more than 98,000 persons for Miami-Dade. Shelter demand in each county is the number of the population who will seek public shelter during the evacuation process. Furthermore, Miami-Dade County due to the existence of the City of Miami and Miami Beach has the highest tourist population and therefore, tourist evacuating vehicles. In addition, the obtained evacuation clearance times via the TIME model are provided for each county in Table 4. “County” clearance time values show the time it takes when an evacuation order is issued until the last evacuee leaves the evacuation zone or reaches a safe shelter within the county. Clearance time “To Shelter” is the time when an evacuation order is issued until the last vehicle reaches a safe shelter within the county. In contrast to Miami-Dade County, Broward and Palm Beach counties have clearance times to shelters less than the county clearance times (Figure 9). Based on the evacuation scenario results, Palm Beach County with a total clearance time of 68 h has the highest clearance time in comparison to other counties. Miami-Dade also has the highest evacuation clearance time to shelter (60.5 h) compared to others, which possibly shows the combined vulnerability of the roadways against evacuation congestion and flooding. Broward, with a county clearance time of 61 h and 40 h to shelter, ranks second among the other counties. Based on the findings, the regional clearance time is 68 h. Regional clearance time here is defined as the time required to safely evacuate vulnerable people to a point of safety within the Southeast RPC region. The obtained results reveal that it takes approximately three days to safely evacuate residents only in Broward, Miami-Dade, and Palm Beach counties in South Florida. This means that, if a category 4 hurricane like Irma hits Southeast Florida, it could still cause serious traffic problems for people in those areas in terms of evacuation. Comparing the obtained regional clearance time for the selected counties to what occurred in September 2017 during Hurricane Irma’s evacuations, it can be concluded that it is very close to what happened in South Florida (72 h). Scanning the literature, Lindell et al. estimated hurricane evacuation times for Hurricanes Lili, Katrina, and Rita based on the collected data in surveys of the evacuations [73].

4. Conclusions, Limitations, and Future Work

This study aimed to develop a methodology to integrate evacuation and storm surge modeling with a case study analysis of Hurricane Irma hitting Southeast Florida. For this purpose, a coupled storm surge and wave finite element model (ADCIRC+SWAN) was used to determine the inundation zones and roadways with higher inundation risk in Broward, Miami-Dade, and Palm Beach counties in Southeast Florida. This was fed into the evacuation modeling using TIME and CUBE software in order to estimate the regional clearance times and shelter availability in the selected counties. The aim was to answer the following research question: What would have happened in the context of evacuations if Hurricane Irma hit Southeast Florida? Answering this question and studying the findings would help the emergency officials in understanding the impact of potential hurricane tracks bounded by the hurricane cone and their uncertainties on the potential hurricane impact area. Findings indicate that Miami-Dade had a higher number of evacuees and evacuating vehicles compared to other counties. Therefore, the highest shelter demand was observed in Miami-Dade County. Results show that it takes approximately 3 days (68 h) to safely evacuate the vulnerable residents in the selected counties. Comparing the obtained clearance times to what happened in 2017 reveals the vulnerability of those areas to severe hurricanes and serious challenges that residents will face during the evacuation process from those affected regions.
The actual Irma’s evacuations led to approximately 6.5 million Floridians evacuating with nearly 700 hurricane shelters that were opened to house 191,764 people. Of these people, 40% stayed at the shelters in the South Florida counties selected in this study [74]. The evacuation clearance time was around 72 h [53]. In this study, compared to Hurricane Irma’s actual impact, we assessed the evacuation patterns in the event that it hit Southeast Florida. Note that this is the area with the highest population in the entire state. We observe that clearance times out of the county reach up to 60 h and more, which shows the criticality of the problem. Since we are talking about more than 3,000,000 people evacuating, and more than 150,000 people in need of shelters, this would still have a huge impact on the state’s roadways and therefore require extra attention. Especially for such a slow onset disaster like Irma, modeling such integrated simulations before the hurricane hit the state could provide the information people in hurricane-prone areas need to make the decision to evacuate or not before the mandatory evacuation order is given, potentially avoiding traffic congestion.
The findings of this study can help emergency management planners and state officials better assess the hurricane evacuations based on the uncertainty of its track for the South Florida region, specifically based on what would happen with uncertain hurricane tracks (e.g., the potential tracks of Hurricane Irma). Given the high number of the aging population who live in South Florida, more attention can be given to the evacuation of these vulnerable groups in the case of such a severe hurricane. This type of analysis would be vital for state and municipal authorities to develop more efficient statewide hurricane evacuation plans. From a policy perspective, the insights and obtained knowledge of this research could provide valuable information for decision-makers and Utilities and Transportation Commission (UTC) operators in the state to have a better understanding of the emergency evacuation process. This can lead to mitigating the traffic congestion during the evacuation process, especially in those highly populated areas such as South Florida. Based on the proposed methodology that integrated evacuation and storm surge modeling, new hypothetical scenarios could be modeled and the findings of these scenarios can inform the emergency officials to be prepared in advance of a hurricane. They can also help identify the hurricane-prone areas and more specifically the vulnerable populations and infrastructures located in those regions. As a result, more efficient resilience-focused evacuation plans can be developed by emergency managers and policymakers. This can raise the awareness of society and help people in vulnerable areas to evacuate in a timely manner which has the potential to reduce the risk of loss of many lives for potential hurricanes and storms in the future. To summarize, this type of research can improve transportation planning in the context of facilitating more informed emergency evacuations. This can reduce the risk that has three main components: occurrence, in terms of event probability or frequency, vulnerability, related only to the resistance of the infrastructures when the event has occurred, and exposure, that is an equivalent homogeneous weighted value of people, goods and infrastructures affected during and after the event.
There are certain caveats and limitations to this study worth noting. For example, in the current study, the total evacuating population was considered in the evacuation scenario. Focusing on the vulnerable populations including people with disabilities or elderly residents as well as evacuee’s behavior would be interesting directions for further research. Additionally, in the present paper, the total evacuating vehicles were used in the model. However, considering different types of vehicles such as public transit and how they can affect the evacuation process can be an interesting future research direction. In addition, population projections for 2020 were used in this study to develop the evacuation scenarios. The United States Census of 2020 data can be a more accurate dataset and can provide more reliable results given the data availability. Furthermore, the TIME evacuation model that was used in the present study can only evacuate individuals to designated locations. Hence, a new model could be developed to address this limitation in order to evacuate people to other locations.
In terms of other future research directions, assessing the spatial accessibility of evacuees to safe shelters given the capacity of these facilities and roadways would be interesting. As another potential future research, the integrated methodology was proposed in this paper could be extended to other case studies in different locations given the data availability. This has the potential to raise the awareness of individuals in hurricane-prone regions to decide whether evacuate or not ahead of a storm. The role of training in evacuation planning and how training and education can contribute to risk reduction are also important issues that should be assessed in future studies [75].

Author Contributions

Conceptualization, Mahyar Ghorbanzadeh, Linoj Vijayan, Eren Erman Ozguven, and Wenrui Huang; methodology, Mahyar Ghorbanzadeh, Linoj Vijayan, and Jieya Yang; software, Mahyar Ghorbanzadeh and Linoj Vijayan; validation, Mengdi Ma and Linoj Vijayan; investigation, Mahyar Ghorbanzadeh, Linoj Vijayan, Eren Erman Ozguven, and Wenrui Huang; resources, Mahyar Ghorbanzadeh, Eren Erman Ozguven and Wenrui Huang; data curation, Mahyar Ghorbanzadeh and Linoj Vijayan; writing—original draft preparation, Mahyar Ghorbanzadeh and Linoj Vijayan; writing—review and editing, Eren Erman Ozguven and Wenrui Huang; visualization, Mahyar Ghorbanzadeh and Linoj Vijayan; supervision, Eren Erman Ozguven and Wenrui Huang; project administration, Wenrui Huang and Eren Erman Ozguven. All authors have read and agreed to the published version of the manuscript.

Funding

This research was funded by the National Science Foundation, grant number 1832068.

Institutional Review Board Statement

Not applicable.

Informed Consent Statement

Not applicable.

Data Availability Statement

Publicly available datasets were analyzed in this study. This data can be found here: https://www.fsutmsonline.net/index.php.

Acknowledgments

The authors would like to thank the National Science Foundation for supporting this research. We would also like to thank Roberto Miquel and Andrew Sussman from the Florida Division of Emergency Management for providing valuable insights. The contents of this paper and discussion represent the authors’ opinion and do not reflect the official views of the National Science Foundation and the Florida Division of Emergency Management.

Conflicts of Interest

The authors declare no conflict of interest.

References

  1. Ghorbanzadeh, M.; Koloushani, M.; Ulak, M.B.; Ozguven, E.E.; Arghandeh, R. Statistical and spatial analysis of Hurricane-induced roadway closures and power outages. Energies 2020, 13, 1098. [Google Scholar] [CrossRef] [Green Version]
  2. Zou, Q.; Chen, S. Resilience Modeling of Interdependent Traffic-Electric Power System Subject to Hurricanes. J. Infrastruct. Syst. 2020, 26, 04019034. [Google Scholar] [CrossRef]
  3. National Oceanic and Atmospheric Administration. Hurricane Costs. Available online: https://coast.noaa.gov/states/fast-facts/hurricane-costs.html (accessed on 20 March 2021).
  4. Ghorbanzadeh, M.; Koloushani, M.; Ozguven, E.E.; Vanli, A.; Arghandeh, R. City transportation network vulnerability to disasters: The case of Hurricane Hermine in Florida. Environ. Hazards 2021, 1–19. [Google Scholar] [CrossRef]
  5. National Oceanic and Atmospheric Administration. Economics and Demographics. Available online: https://coast.noaa.gov/states/fast-facts/economics-and-demographics.html (accessed on 20 July 2021).
  6. Dow, K.; Cutter, S.L. Emerging hurricane evacuation issues: Hurricane Floyd and South Carolina. Hazards Vulnerabil. Environ. Justice 2012, 385–397. [Google Scholar] [CrossRef]
  7. Tanaka, K.; Nagatani, T.; Hanaura, H. Traffic congestion and dispersion in Hurricane evacuation. Phys. A Stat. Mech. Its Appl. 2007, 376, 617–627. [Google Scholar] [CrossRef]
  8. Hurricane Central Irma Prompts Mandatory Evacuation Order in Florida Keys: “The Sooner People Leave, the Better”. Available online: https://weather.com/storms/hurricane/news/hurricane-irma-florida-puerto-rico-caribbean (accessed on 20 July 2021).
  9. Stein, P.; Berman, M.; Lowery, W. Hurricane Irma Makes Second Landfall in Florida and Will Roar up the State’s Gulf Coast. The Washington Post. 10 September 2017. Available online: https://www.washingtonpost.com/news/post-nation/wp/2017/09/10/hurricane-irma-makes-landfall-in-florida-keys-targets-gulf-coast/ (accessed on 10 July 2021).
  10. Zhu, Y.J.; Hu, Y.; Collins, J.M. Estimating road network accessibility during a hurricane evacuation: A case study of hurricane Irma in Florida. Transp. Res. Part D Transp. Environ. 2020, 83, 102334. [Google Scholar] [CrossRef]
  11. Yang, H.; Morgul, E.F.; Ozbay, K.; Xie, K. Modeling evacuation behavior under hurricane conditions. Transp. Res. Rec. 2016, 2599, 63–69. [Google Scholar] [CrossRef] [Green Version]
  12. Wilmot, C.G.; Meduri, N. Methodology to establish hurricane evacuation zones. Transp. Res. Rec. 2005, 1922, 129–137. [Google Scholar] [CrossRef]
  13. Senkbeil, J.; Reed, J.; Collins, J.; Brothers, K.; Saunders, M.; Skeeter, W.; Cerrito, E.; Chakraborty, S.; Polen, A. Perceptions of hurricane-track forecasts in the united states. Weather. Clim. Soc. 2020, 12, 15–29. [Google Scholar] [CrossRef]
  14. FEMA. Mitigation Assessment Report of Hurricane Irma in Florida; FEMA: Miami, FL, USA, 2018. [Google Scholar]
  15. Dietrich, J.C.; Tanaka, S.; Westerink, J.J.; Dawson, C.N.; Luettich, R.A.; Zijlema, M.; Holthuijsen, L.H.; Smith, J.M.; Westerink, L.G.; Westerink, H.J. Performance of the unstructured-mesh, SWAN+ ADCIRC model in computing hurricane waves and surge. J. Sci. Comput. 2012, 52, 468–497. [Google Scholar] [CrossRef]
  16. Sebastian, A.; Proft, J.; Dietrich, J.C.; Du, W.; Bedient, P.B.; Dawson, C.N. Characterizing hurricane storm surge behavior in Galveston Bay using the SWAN+ADCIRC model. Coast. Eng. 2014, 88, 171–181. [Google Scholar] [CrossRef]
  17. Siverd, C.G.; Hagen, S.C.; Bilskie, M.V.; Braud, D.W.H.; Gao, S.; Peele, R.H.; Twilley, R.R. Assessment of the temporal evolution of storm surge across coastal Louisiana. Coast. Eng. 2019, 150, 59–78. [Google Scholar] [CrossRef]
  18. Rucker, C.A.; Tull, N.; Dietrich, J.C.; Langan, T.E.; Mitasova, H.; Blanton, B.O.; Fleming, J.G.; Luettich, R.A. Downscaling of real-time coastal flooding predictions for decision support. Nat. Hazards 2021, 107, 1341–1369. [Google Scholar] [CrossRef]
  19. Wang, Y.; Mao, X.; Jiang, W. Long-term hazard analysis of destructive storm surges using the ADCIRC- SWAN model: A case study of Bohai Sea, China. Int. J. Appl. Earth Obs. Geoinf. 2018, 73, 52–62. [Google Scholar] [CrossRef]
  20. Reffitt, M.; Orescanin, M.M.; Massey, C.; Raubenheimer, B.; Jensen, R.E.; Elgar, S. Modeling Storm Surge in a Small Tidal Two-Inlet System. J. Waterw. Port Coast. Ocean Eng. 2020, 146, 04020043. [Google Scholar] [CrossRef]
  21. Liu, Z.; Wang, H.; Zhang, Y.J.; Magnusson, L.; Loftis, J.D.; Forrest, D. Cross-scale modeling of storm surge, tide, and inundation in Mid-Atlantic Bight and New York City during Hurricane Sandy, 2012. Estuar. Coast. Shelf Sci. 2020, 233, 106544. [Google Scholar] [CrossRef]
  22. Murray-Tuite, P.; Wolshon, B. Evacuation transportation modeling: An overview of research, development, and practice. Transp. Res. Part C Emerg. Technol. 2013, 27, 25–45. [Google Scholar] [CrossRef]
  23. Edara, P.; Sharma, S.; McGhee, C. Development of a large-scale traffic simulation model for hurricane evacuation-methodology and lessons learned. Nat. Hazards Rev. 2010, 11, 127–139. [Google Scholar] [CrossRef]
  24. Wolshon, B.; McArdle, B. Traffic impacts and dispersal patterns on secondary roadways during regional evacuations. Nat. Hazards Rev. 2011, 12, 19–27. [Google Scholar] [CrossRef]
  25. Sadri, A.M.; Ukkusuri, S.V.; Murray-Tuite, P.; Gladwin, H. How to evacuate: Model for understanding the routing strategies during hurricane evacuation. J. Transp. Eng. 2013, 140, 61–69. [Google Scholar] [CrossRef]
  26. Major, W.; Can, D.; Transportation, T. Lessons From Katrina and Rita. J. Transp. Eng. 2006, 132, 11–18. [Google Scholar]
  27. Wolshon, B. “One-way-out”: Contraflow freeway operation for hurricane evacuation. Nat. Hazards Rev. 2001, 2, 105–112. [Google Scholar] [CrossRef]
  28. Martín, Y.; Li, Z.; Cutter, S.L. Leveraging Twitter to gauge evacuation compliance: Spatiotemporal analysis of Hurricane Matthew. PLoS ONE 2017, 12, e0181701. [Google Scholar] [CrossRef] [Green Version]
  29. Squicciarini, A.; Tapia, A.; Stehle, S. Sentiment analysis during Hurricane Sandy in emergency response. Int. J. Disaster Risk Reduct. 2017, 21, 213–222. [Google Scholar] [CrossRef] [Green Version]
  30. Yin, W.; Murray-Tuite, P.; Ukkusuri, S.V.; Gladwin, H. An agent-based modeling system for travel demand simulation for hurricane evacuation. Transp. Res. Part C Emerg. Technol. 2014, 42, 44–59. [Google Scholar] [CrossRef]
  31. Zhang, Z.; Wolshon, B.; Murray-Tuite, P. A conceptual framework for illustrating and assessing risk, resilience, and investment in evacuation transportation systems. Transp. Res. Part D Transp. Environ. 2019, 77, 525–534. [Google Scholar] [CrossRef]
  32. Lindell, M.K.; Murray-Tuite, P.; Wolshon, B.; Baker, E.J. Large-Scale Evacuation; CRC Press: New York, NY, USA, 2018. [Google Scholar]
  33. Lindell, M.K.; Murray-Tuite, P.; Wolshon, B.; Baker, E.J. Large-Scale Evacuation: The Analysis, Modeling, and Management of Emergency Relocation from Harzardous Areas; CRC Press: New York, NY, USA, 2019. [Google Scholar]
  34. Huang, S.K.; Lindell, M.K.; Prater, C.S. Who Leaves and Who Stays? A Review and Statistical Meta-Analysis of Hurricane Evacuation Studies. Environ. Behav. 2016, 48, 991–1029. [Google Scholar] [CrossRef]
  35. Thompson, R.R.; Garfin, D.R.; Silver, R.C. Evacuation from Natural Disasters: A Systematic Review of the Literature. Risk Anal. 2017, 37, 812–839. [Google Scholar] [CrossRef] [Green Version]
  36. Wolshon, B.; McArdle, B. Temporospatial Analysis of Hurricane Katrina Regional Evacuation Traffic Patterns. J. Infrastruct. Syst. 2009, 15, 12–20. [Google Scholar] [CrossRef]
  37. Wolshon, B.; Urbina Hamilton, E.; Levitan, M.; Wilmot, C. Review of Policies and Practices for Hurricane Evacuation. II: Traffic Operations, Management, and Control. Nat. Hazards Rev. 2005, 6, 143–161. [Google Scholar] [CrossRef]
  38. Yabe, T.; Ukkusuri, S.V. Effects of income inequality on evacuation, reentry and segregation after disasters. Transp. Res. Part D Transp. Environ. 2020, 82, 102260. [Google Scholar] [CrossRef]
  39. Zhu, Y.; Xie, K.; Ozbay, K.; Yang, H. Hurricane Evacuation Modeling Using Behavior Models and Scenario-Driven Agent-based Simulations. Procedia Comput. Sci. 2018, 130, 836–843. [Google Scholar] [CrossRef]
  40. Vitetta, A.; Musolino, G.; Marcianò, F.A. Safety of users in road evacuation: Modelling and DSS for transport supply and supply-demand interaction. WIT Trans. Ecol. Environ. 2009, 120, 475–484. [Google Scholar] [CrossRef] [Green Version]
  41. Vitetta, A.; Musolino, G.; Marcian, F.A. Safety of users in road evacuation: Supply and demand-supply interaction models for users. WIT Trans. Built Environ. 2007, 96, 783–792. [Google Scholar] [CrossRef] [Green Version]
  42. Marcianò, F.A.; Musolino, G.; Vitetta, A. A system of models for signal setting design of a signalized road network in evacuation conditions. WIT Trans. Built Environ. 2010, 111, 313–323. [Google Scholar] [CrossRef] [Green Version]
  43. Di Gangi, M.; Musolino, G.; Russo, F.; Velonà, P.; Vitetta, A. Analysis and comparison of several urban road transportation assignment models in emergency conditions. Sustain. World 2003, 8, 247–257. [Google Scholar] [CrossRef] [Green Version]
  44. Marcianò, F.A.; Musolino, G.; Vitetta, A. Signal setting optimization on urban road transport networks: The case of emergency evacuation. Saf. Sci. 2015, 72, 209–220. [Google Scholar] [CrossRef]
  45. Russo, F.; Rindone, C. Data Envelopment Analysis (DEA) for evacuation planning. WIT Trans. Inf. Commun. Technol. 2010, 43, 455–467. [Google Scholar] [CrossRef] [Green Version]
  46. Wong, S.D.; Pel, A.J.; Shaheen, S.A.; Chorus, C.G. Fleeing from hurricane Irma: Empirical analysis of evacuation behavior using discrete choice theory. Transp. Res. Part D Transp. Environ. 2020, 79, 102227. [Google Scholar] [CrossRef] [Green Version]
  47. Roy, K.C.; Hasan, S. Modeling the dynamics of hurricane evacuation decisions from twitter data: An input output hidden markov modeling approach. Transp. Res. Part C Emerg. Technol. 2021, 123, 102976. [Google Scholar] [CrossRef]
  48. Sadri, A.M.; Ukkusuri, S.V.; Murray-Tuite, P.; Gladwin, H. Hurricane evacuation route choice of major bridges in Miami Beach, Florida. Transp. Res. Rec. 2015, 2532, 164–173. [Google Scholar] [CrossRef]
  49. Kocatepe, A. Evacuating and Sheltering Aging Populations: A GIS- and Optimization-Based Methodology; Florida State University: Tallahassee, FL, USA, 2017; Available online: https://www.proquest.com/openview/688f5c5b0dcfe0fe13f38f9ef6c5e6f4/1?pq-origsite=gscholar&cbl=18750&diss=y. (accessed on 15 September 2021).
  50. CDM Smith. Building a Robust Hurricane Evacuation Model for Florida. Available online: https://www.cdmsmith.com/en/Client-Solutions/Projects/Florida-Department-of-Emergency-Management-Hurricane-Evacuation-Model?fbclid=IwAR3SIon2j5yxkKJ_8uH8BjjkYeNgJT6Bw0Cq1BGh-sZWA3sLc-UGDcYZuWc (accessed on 15 September 2021).
  51. Marasco, D.; Murray-Tuite, P.; Guikema, S.; Logan, T. Time to leave: An analysis of travel times during the approach and landfall of Hurricane Irma. Nat. Hazards 2020, 103, 2459–2487. [Google Scholar] [CrossRef]
  52. Staes, B.; Menon, N.; Bertini, R.L. Analyzing transportation network performance during emergency evacuations: Evidence from Hurricane Irma. Transp. Res. Part D Transp. Environ. 2021, 95, 102841. [Google Scholar] [CrossRef]
  53. Ghorbanzadeh, M.; Burns, S.; Rugminiamma, L.V.N.; Erman Ozguven, E.; Huang, W. Spatiotemporal Analysis of Highway Traffic Patterns in Hurricane Irma Evacuation. Transp. Res. Rec. J. Transp. Res. Board 2021, 036119812110018. [Google Scholar] [CrossRef]
  54. Huang, W.; Yin, K.; Ghorbanzadeh, M.; Vijayan, L.; Ozguven, E.E. Integrating storm surge modeling with traffic data analysis to evaluate the effectiveness of hurricane evacuation. Front. Struct. Civ. Eng. 2021. [Google Scholar] [CrossRef]
  55. National Oceanic and Atmospheric Administration. 2018; Administration. Available online: https://oceanservice.noaa.gov/annualreport/2017/hurricane-irma.html (accessed on 20 January 2018).
  56. Maul, W. Preparedness, Response and Rebuilding: Lessons from the 2017 Disasters; Florida Division of Emergency Management: Tallahassee, FL, USA, 2018.
  57. So, S.; Juarez, B.; Valle-Levinson, A.; Gillin, M.E. Storm surge from Hurricane Irma along the Florida Peninsula. Estuar. Coast. Shelf Sci. 2019, 229, 106402. [Google Scholar] [CrossRef]
  58. Cangialosi, J.; Latto, A.; Berg, R. Hurricane Irma. 2018. Available online: https://www.nhc.noaa.gov/data/tcr/AL112017_Irma.pdf (accessed on 25 September 2021).
  59. Rahman, R.; Bhowmik, T.; Eluru, N.; Hasan, S. Assessing the crash risks of evacuation: A matched case-control approach applied over data collected during Hurricane Irma. Accid. Anal. Prev. 2021, 159, 106260. [Google Scholar] [CrossRef] [PubMed]
  60. National Hurricane Center and National Oceanic and Atmospheric Administration. Available online: https://www.nhc.noaa.gov/archive/2017/IRMA_graphics.php?product=5day_cone_with_line_and_wind (accessed on 8 January 2020).
  61. Florida Division of Emergency Management. Florida Statewide Regional Evacuation Study Program (SRESP); Florida Division of Emergency Management: Tallahassee, FL, USA, 2015.
  62. Florida Division of Emergency Management. South Florida Regional Planning Council; Florida Division of Emergency Management: Tallahassee, FL, USA, 2015.
  63. Florida Department of Transportation (FDOT) Florida Statewide Model. Available online: https://www.fsutmsonline.net/index.php?/model_pages/modDS1/index/ (accessed on 10 March 2021).
  64. Vijayan, L.; Huang, W.; Yin, K.; Ozguven, E.; Burns, S.; Ghorbanzadeh, M. Evaluation of parametric wind models for more accurate modeling of storm surge: A case study of Hurricane Michael. Nat. Hazards 2021, 106, 2003–2024. [Google Scholar] [CrossRef]
  65. Burns, S. Assessing the Vulnerability of Florida Panhandle Communities Impacted by Hurricane Michael Using Geographic Information Systems; Florida Agricultural and Mechanical University: Tallahassee, FL, USA, 2020; Available online: https://www.proquest.com/openview/985da4256064a4a54a22d07b001eefb2/1?pq-origsite=gscholar&cbl=18750&diss=y. (accessed on 25 September 2021).
  66. Florida Department of Transportation (FDOT). Florida Standard Urban Transportation Modeling System (FSUTMS). 2020. Available online: https://www.fsutmsonline.net/index.php (accessed on 20 March 2020).
  67. Zhang, Z.; Herrera, N.; Tuncer, E.; Parr, S.; Shapouri, M.; Wolshon, B. Effects of Shadow Evacuation on Megaregion Evacuations. Transp. Res. Part D Transp. Environ. 2020, 83, 102295. [Google Scholar] [CrossRef]
  68. Florida Regional Councils Association (FRCA); Florida Regional Councils Association (FRCA). 2019. Available online: http://www.flregionalcouncils.org/ (accessed on 20 July 2021).
  69. Sin, H.G.; Joo, Y.J. Development of urban disaster evacuation model using Cube Avenue. Spat. Inf. Res. 2017, 25, 513–521. [Google Scholar] [CrossRef]
  70. Wong, K.F. Transportation Planning: Travel Demand Modeling Forecast Model Conversion from TransCAD to Cube Voyager. In Proceedings of the 7th International Conference of Chinese Transportation Professionals Congress 2007: Plan, Build, and Manage Transportation Infrastructures in China, Shanghai, China, 21–22 May 2007; ASCE: Reston, VA, USA, 2008; pp. 30–42. [Google Scholar] [CrossRef]
  71. Miquel, R. Florida Statewide Hurricane Evacuation Model—TIME. Available online: https://www.fsutmsonline.net/index.php/model_task_f/mtfdocs/ (accessed on 21 September 2021).
  72. Hadi, M.; Ozen, H.; Shabanian, S.; Xiao, Y. Use of Dynamic Traffic Assignment in FSUTMS in Support of Transportation Planning in Florida; Florida International University Lehman Center for Transportation: Research: Miami, FL, USA, 2012. [Google Scholar]
  73. Lindell, M.K.; Sorensen, J.H.; Baker, E.J.; Lehman, W.P. Community response to hurricane threat: Estimates of household evacuation preparation time distributions. Transp. Res. Part D Transp. Environ. 2020, 85, 102457. [Google Scholar] [CrossRef]
  74. Effects of Hurricane Irma in Florida. 2021. Available online: https://en.wikipedia.org/wiki/Effects_of_Hurricane_Irma_in_Florida (accessed on 10 September 2021).
  75. Kim, K.; Wolshon, B.; Pant, P.; Yamashita, E.; Ghimire, J. Assessment of evacuation training needs: Targeting instruction to meet the requirements of local communities and agencies. J. Emerg. Manag. 2020, 18, 475–487. [Google Scholar] [CrossRef] [PubMed]
Figure 1. Hurricane Irma’s track (a) 6 September 2017; (b) 7 September 2017; (c) 8 September 2017; (d) 10 September 2017 [60].
Ijgi 10 00661 g001
Figure 2. Study area.
Ijgi 10 00661 g002
Figure 3. Methodology conceptual flowchart.
Ijgi 10 00661 g003
Figure 4. (a) Hurricane Irma-hypothetical track hitting Miami; (b) Wind field used in the coupled model—a snapshot close to landfall. Location of the nested domain shown in rectangle.
Ijgi 10 00661 g004
Figure 5. Evacuation Zones (a) Broward; (b) Miami-Dade; (c) Palm Beach.
Ijgi 10 00661 g005
Figure 6. Florida’s 10 regional planning councils (RPCs).
Ijgi 10 00661 g006
Figure 7. (a) Maximum water levels—output from the coupled ADCIRC+SWAN model; (b) Water level obtained from the nested inundation model; (c) Surge zones from the inundation model using ArcGIS.
Ijgi 10 00661 g007aIjgi 10 00661 g007b
Figure 8. Roadways with a higher risk of inundation.
Ijgi 10 00661 g008
Figure 9. Clearance times.
Ijgi 10 00661 g009
Table 1. Data types and sources.
DataTypeSource
DemographicsmdbSRESP and American Community Survey
SheltersmdbSFRPC
Behavioral AssumptionsmdbSRESP and SFRPC
Hurricane Irma’s Track and IntensityCSVNHC
Evacuation ZonesmdbNHC
Roadway Networkshp, NETFDOT Statewide Model Network
Table 2. Regional destination rates.
RegionsDestination Rates
Apalachee1.85821
Central Florida2.44308
East Central Florida19.96652
North Central Florida2.16183
Northeast Florida3.37536
South Florida24.96993
Southwest Florida3.90035
Tampa Bay5.61075
Treasure Coast10.97532
Emerald Coast3.15146
Others21.58720
Table 4. Evacuation demand and clearance times.
BrowardMiami-DadePalm BeachTotal
Site-Built Population636,6671,955,245505,2013,097,113
Mobile Home Population51,15537,90246,652135,709
Tourist Population37,97793,38711,987143,351
University Population015393551894
Total Evacuating Population725,8002,088,072564,1963,378,068
Sheltering Demand33,78598,54235,226167,553
Site-Built Evacuating Vehicles275,323682,627246,9341,204,884
Mobile Home Evacuating Vehicles22,54716,03719,93958,523
University Evacuating Vehicles015393551894
Tourist Evacuating Vehicles18,98946,693599471,676
Total Evacuating Vehicles316,858746,895273,2221,336,975
County6160.568
To Shelter4060.528
Regional Clearance Time:68
Publisher’s Note: MDPI stays neutral with regard to jurisdictional claims in published maps and institutional affiliations.

