1. Introduction
Ensuring the adequacy and quality of urban ecosystem services and green infrastructure has been widely highlighted in the urban land use and planning literature in recent years. In an urban setting, ecosystem services distinguish between nature’s functions in production, regulation, support and cultural services, and also recognize nature’s intrinsic function [
1]. Like ecosystem services, urban green infrastructure (UGI) has become a central concept in land-use planning and policy [
2]. It refers to, or is managed for, both natural and artificial elements of nature that are designed to provide ecosystem services [
3]. UGI covers for example parks, public green space, allotments, green corridors, street trees, urban forests, roof and vertical greening, and private yards [
4].
Urbanization and densification of housing are global phenomena [
5]. Apart from the structural change, urban living seems to be a matter of dwelling preferences, too. At the same time, observation of and movement in nature have been shown to play a part in housing desires and proven to enhance human well-being and health [
6,
7,
8], which the global circumstances under COVID-19 continue to underline [
9,
10,
11]. This poses a challenge for the densification of cities and puts pressure on preserving and promoting the natural environment as much as possible in densely populated areas. Thus, recent studies on urban greening have pointed out the environmental justice and importance of small-scale solutions, as they enable access to nature in cities more widely than large-scale and more concentrated urban green projects, while most likely being easier to implement [
12,
13].
Yards have, until recently, played a minor role in the scope of UGI assessments, even if their importance is similar to other urban green areas [
14,
15]. Their proportion in the urban morphology is usually not insignificant, either; according to the survey of Loram et al. [
16], the urban area covered by domestic yards ranged from 21.8% to 26.8% in six studied cities in the UK. According to Cameron et al. [
4], there are significant differences in both the form and management of yards which radically influence their benefits; that is, their quality affects their impact on ecosystem services, such as carbon sequestration and storage potential [
15]. According to Clark et al. [
17], in many cities, private trees dominate tree canopy cover. As densification often means fewer private trees, it might lead to diminishing urban tree canopy cover. By acknowledging the role of private land and yards, the discussion on UGI expands into the private realm [
18].
Awareness on the importance of local UGI and the requirement for its comprehensive planning has led to the implementation of the green factor (i.e., green area ratio, green space factor) tool in cities such as Berlin in 1997 [
19], Helsinki in 2014 [
20], and Melbourne in 2020 [
18]. The purpose of the green factor is usually to ensure the sufficient amount of total green [
21], as well as quality in the planning of a new district [
22] by generating a numeric value for the planned and remaining green elements of the area. In the case of Helsinki’s green factor, for example, each element is given a multiplier, which is then used to calculate the value of the plan. This way, it is possible to compare distinct plans and to assess how the sustainability goals and targets are achieved. The green factor is still less dealt with in research, and only few practical application experiences are described in the literature [
20,
21]. However, in Helsinki, for example, the recent political debate has pointed out the necessity to extend the use of the green factor tool to urban infill projects, instead of limiting its use to new area development [
23]. This puts pressure on developing the tool further, and on evaluating its possibilities to assess the already existing vegetation, instead of using it only as a regulative tool in the planning phase.
Three-dimensional point clouds generated with laser scanning and photogrammetry allow monitoring of physical properties and visually detectable elements of the environment. 3D point clouds are applied in natural resource management and forestry [
24,
25,
26], disaster management [
27,
28], landscape monitoring and planning [
29,
30] as well as in the monitoring of individual urban buildings and urban scenery [
31], urban trees [
32,
33], and streetscapes [
34,
35]. However, especially in 3D city modeling, the emphasis has traditionally been on buildings, rather than on small-scale natural environments, yards, and their elements. The applications on forestry research have been widely studied from both structural [
36,
37,
38] and individual tree points of view [
39,
40,
41,
42,
43], including forest inventory and change prediction [
44,
45,
46]. Studies in forestry have also specified levels of detail for a single tree model [
47]; however, methods in the field mainly concentrate on tree attributes. According to Casalegno et al. [
48], Alavipanah et al. [
49], and Feltynowski et al. [
50], until recent years, the use of laser scanning and photogrammetry-aided methods have been implemented in surprisingly few applications in UGI assessments, even if its 2D-based applications, such as satellite data and mapping, are diverse.
The existing point cloud-based applications for UGI include, for example, quantitative metrics to estimate its overall volume and to demonstrate the spatial and volumetric heterogeneity of it. Casalegno et al. [
48] demonstrated a voxel (volumetric pixels)-based assessment of UGI from waveform airborne lidar, including three different structures: grass, shrubs, and trees. The study resulted in differing outcomes with the evaluations based on other remote sensing data. A similar result has been achieved with the so-called green view index (GVI), a method usually utilizing panoramic photographs to assess the greenery of urban views enabling the local vertical assessment of the views. Larkin and Hystad [
51] noted that the green views did not always correlate with the satellite-based normalized difference vegetation index (NDVI). Hence, UGI research could benefit from digital vertical (3D) data to supplement the hegemonic role of horizontal (2D) data.
Our aim is to develop 3D point cloud-based assessment of local UGI. We assess how well the green elements central to green factor assessment are visible and detectable in 3D point cloud data, focusing on the local scale. The idea is therefore not to include the existing criteria of the green factor in the study set, as it is, in many ways, bound to the planning phase, as well as to the two-dimensional information used in the planning documents. Instead, the idea is to point out aspects and possibilities that could be useful in the future’s 3D measuring-assisted assessment of local green infrastructure. Hence, our approach advocates the use of digital 3D data for built and existing local green elements in contrast to the typical approach in which the green factor tool is used mainly for planning and as 2D information.
More specifically, our objective is to explore the distinct point cloud data sets’ ability to convey information on green elements, especially when comparing them qualitatively in terms of geometry and appearance, and further with details and completeness of various green elements. Finally, the results are discussed in terms of the development of 3D point cloud-based assessments for local UGI.
3. Results
The quality of the parameters, that is, details in the context of appearance and of geometry, and completeness in the context of appearance and geometry, were tested for all the included green elements with all the point cloud data sets. The results of the ratings are given in
Table 3 for parameters on geometry and
Table 4 for parameters on appearance. The results are further explained in the text.
The visual comparisons for the green elements are presented in
Figure 6,
Figure 7,
Figure 8,
Figure 9,
Figure 10,
Figure 11,
Figure 12,
Figure 13 and
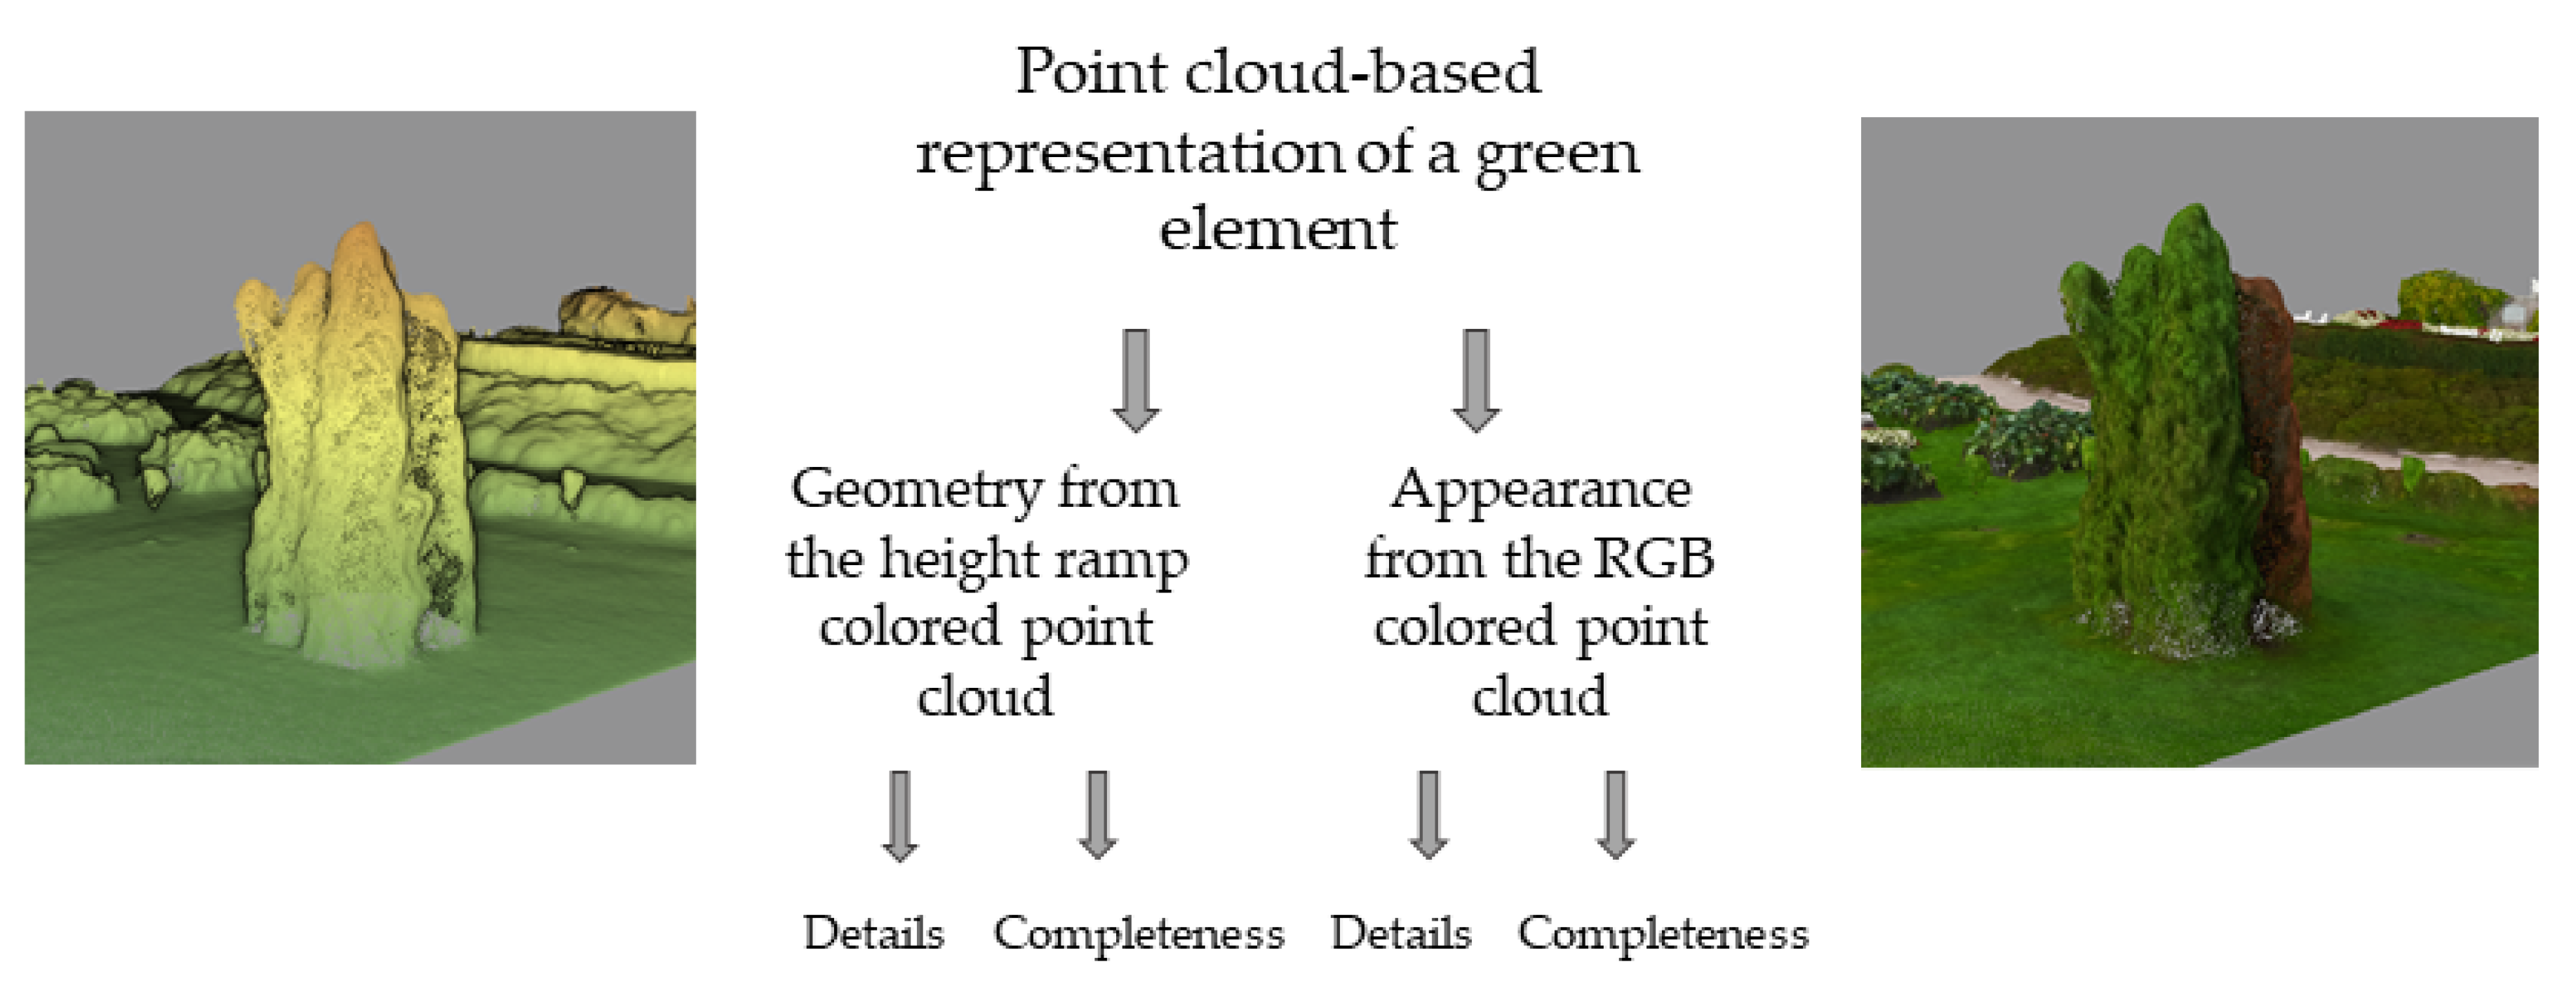
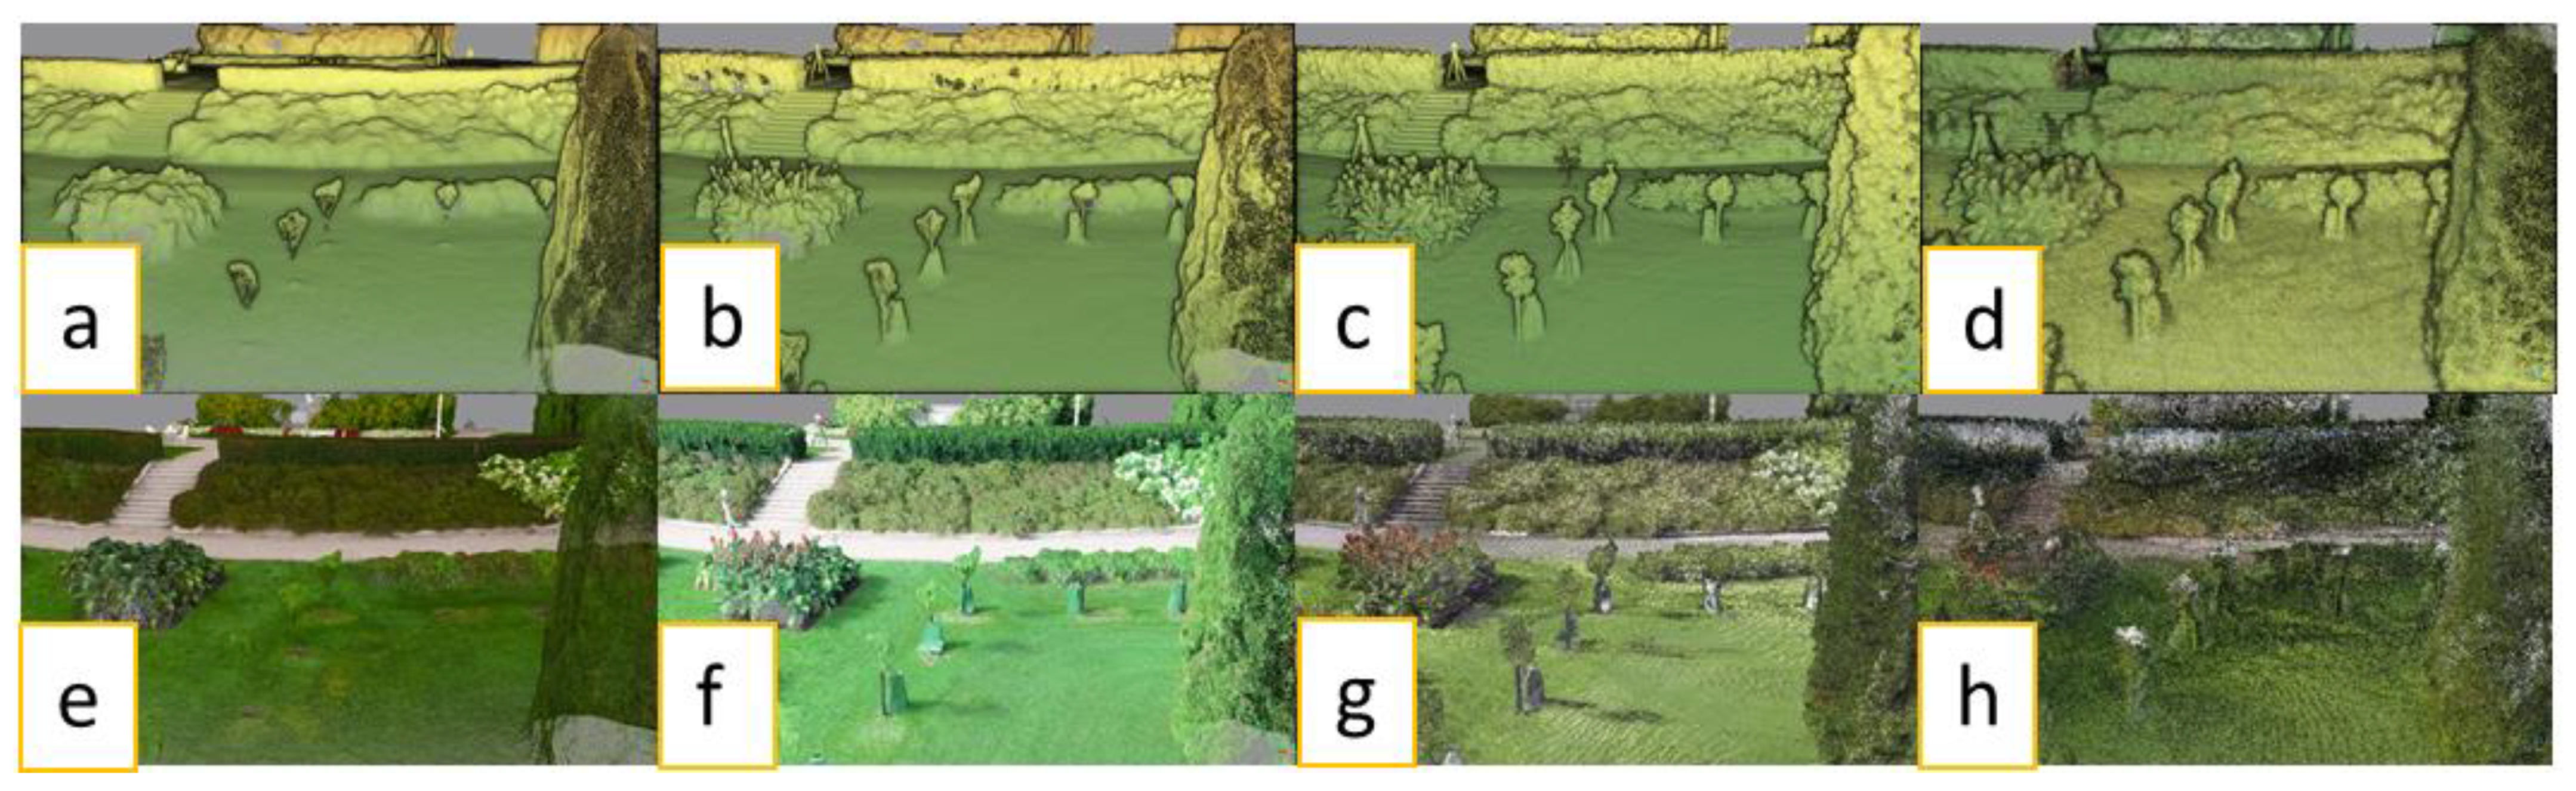
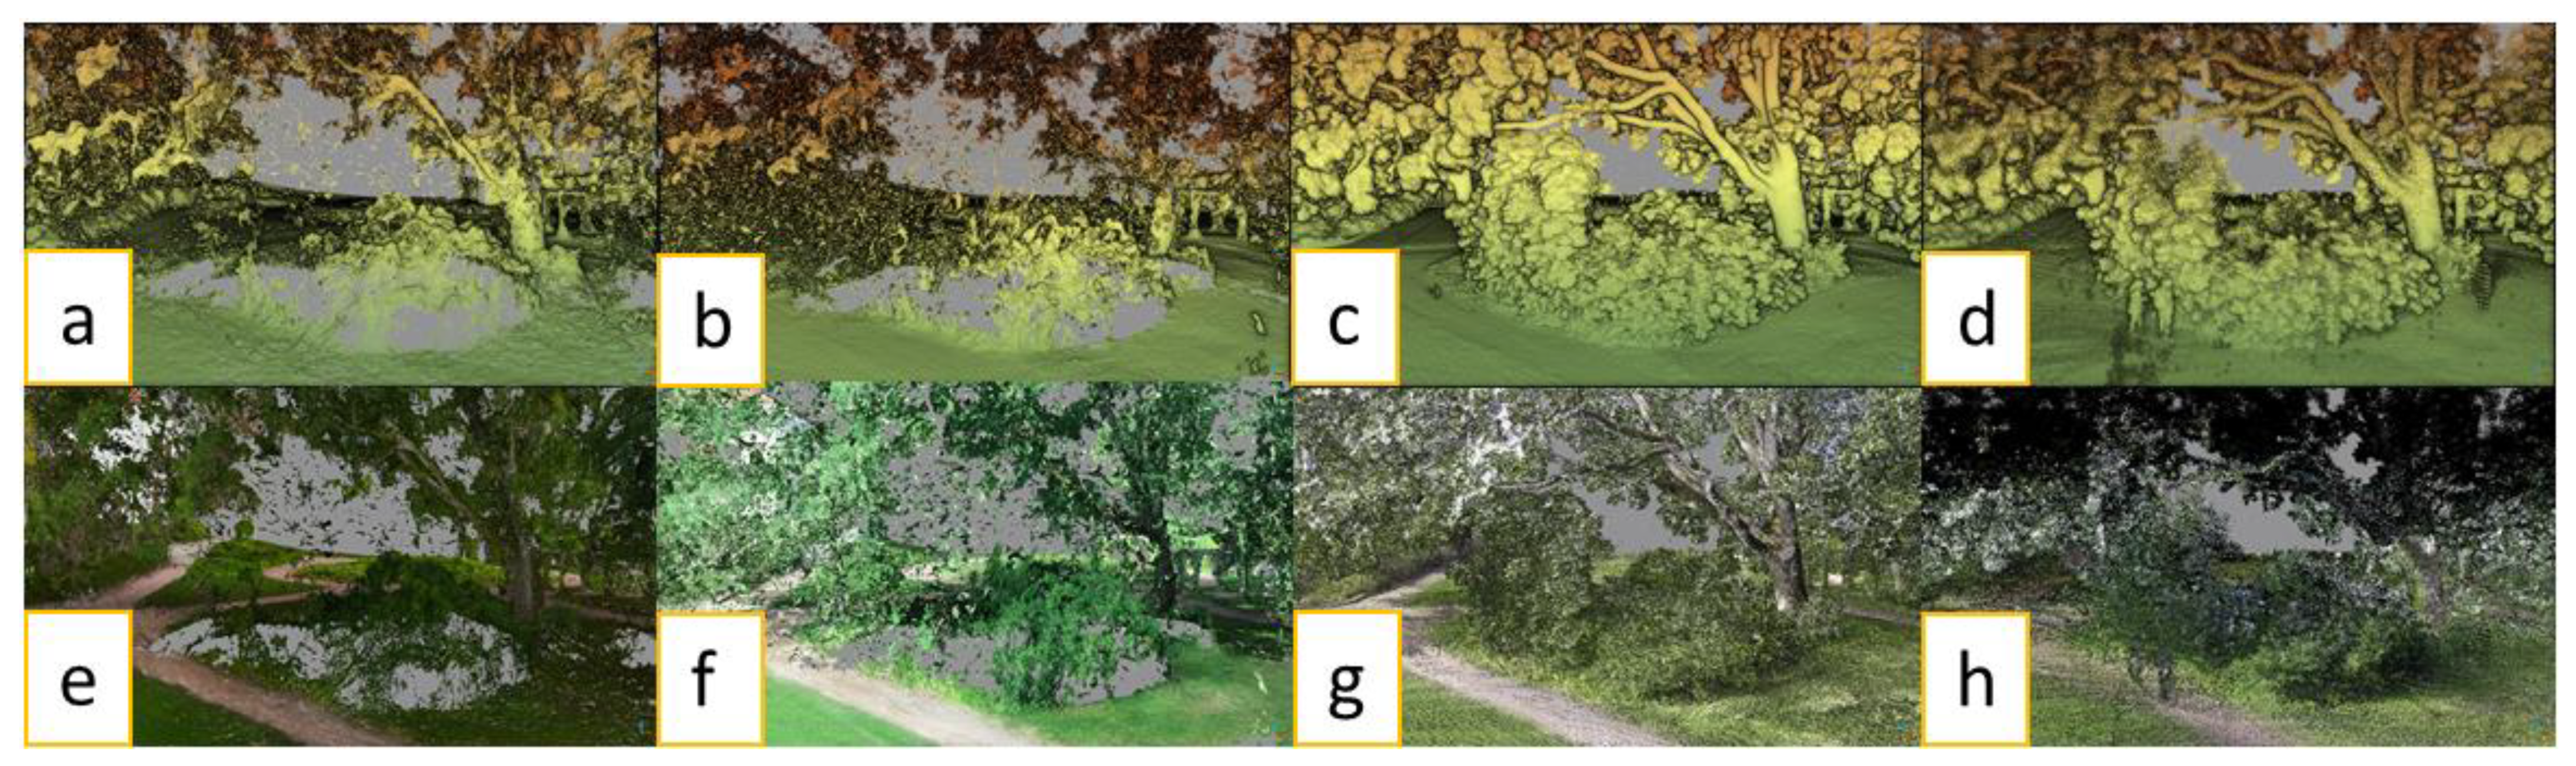
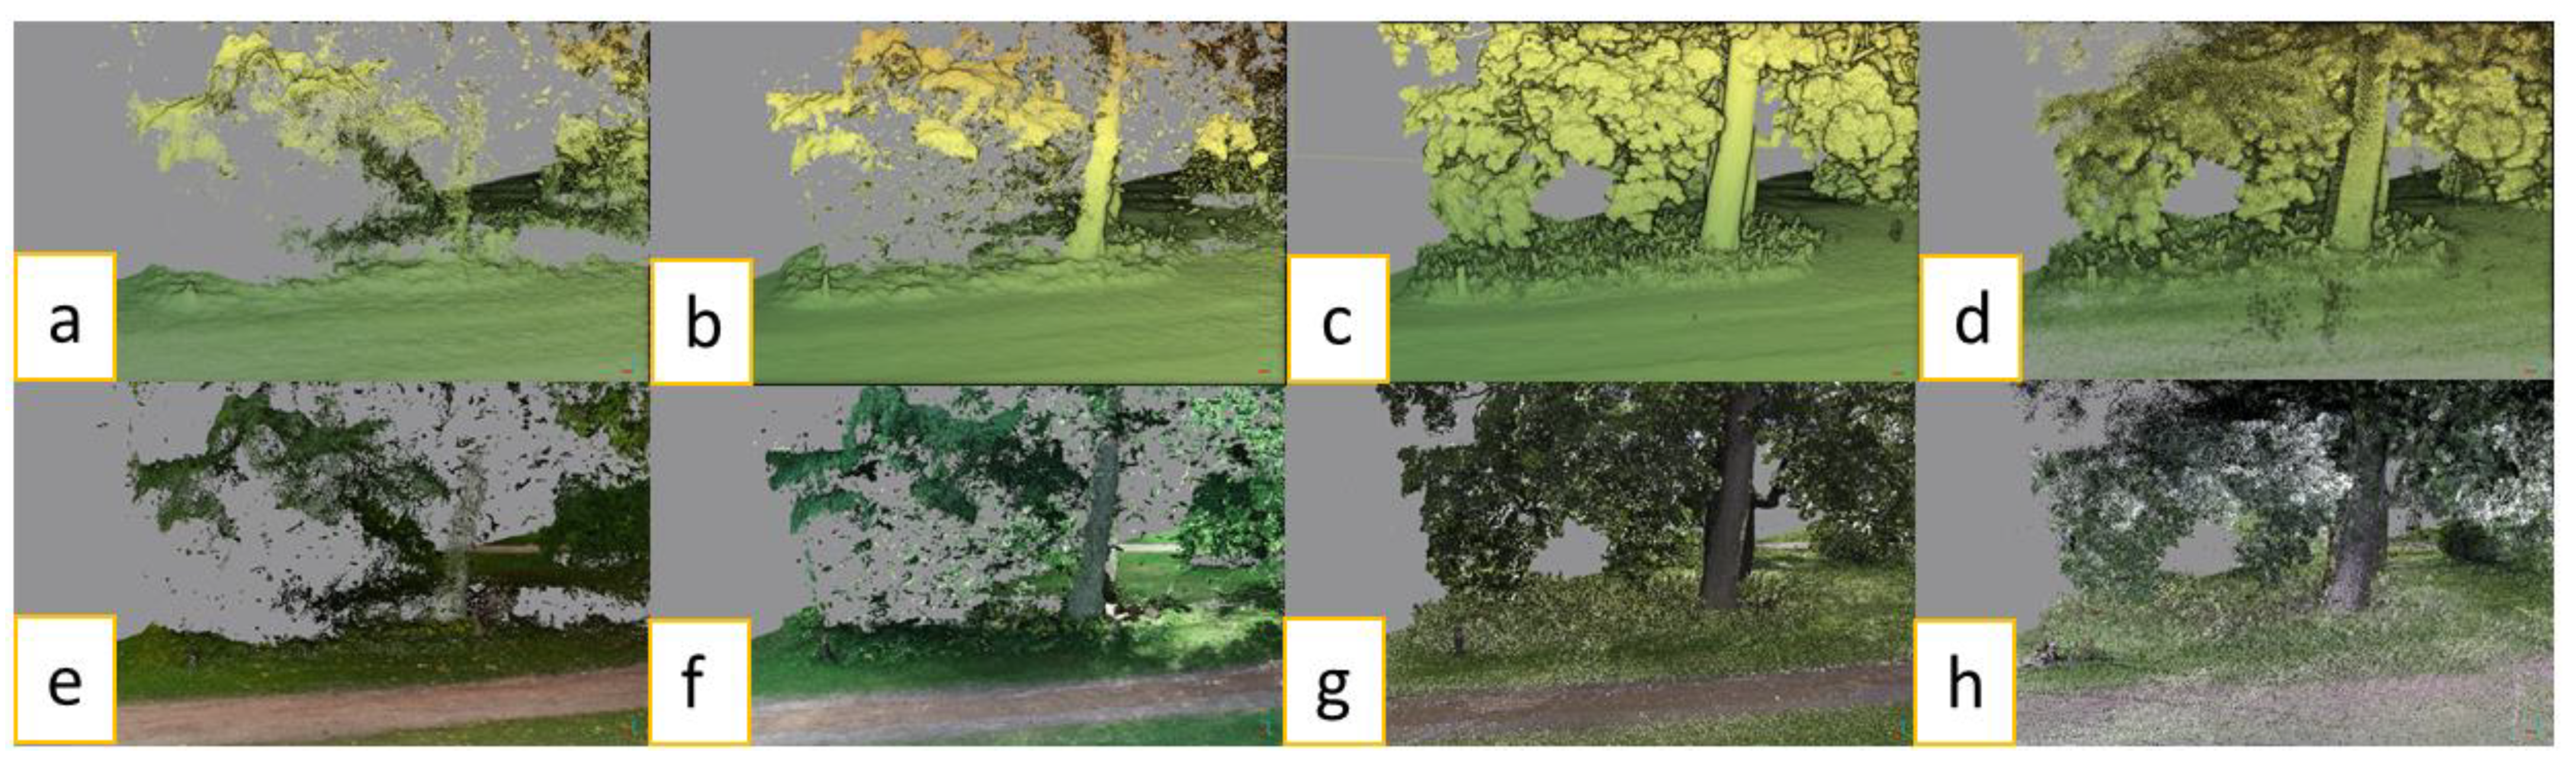
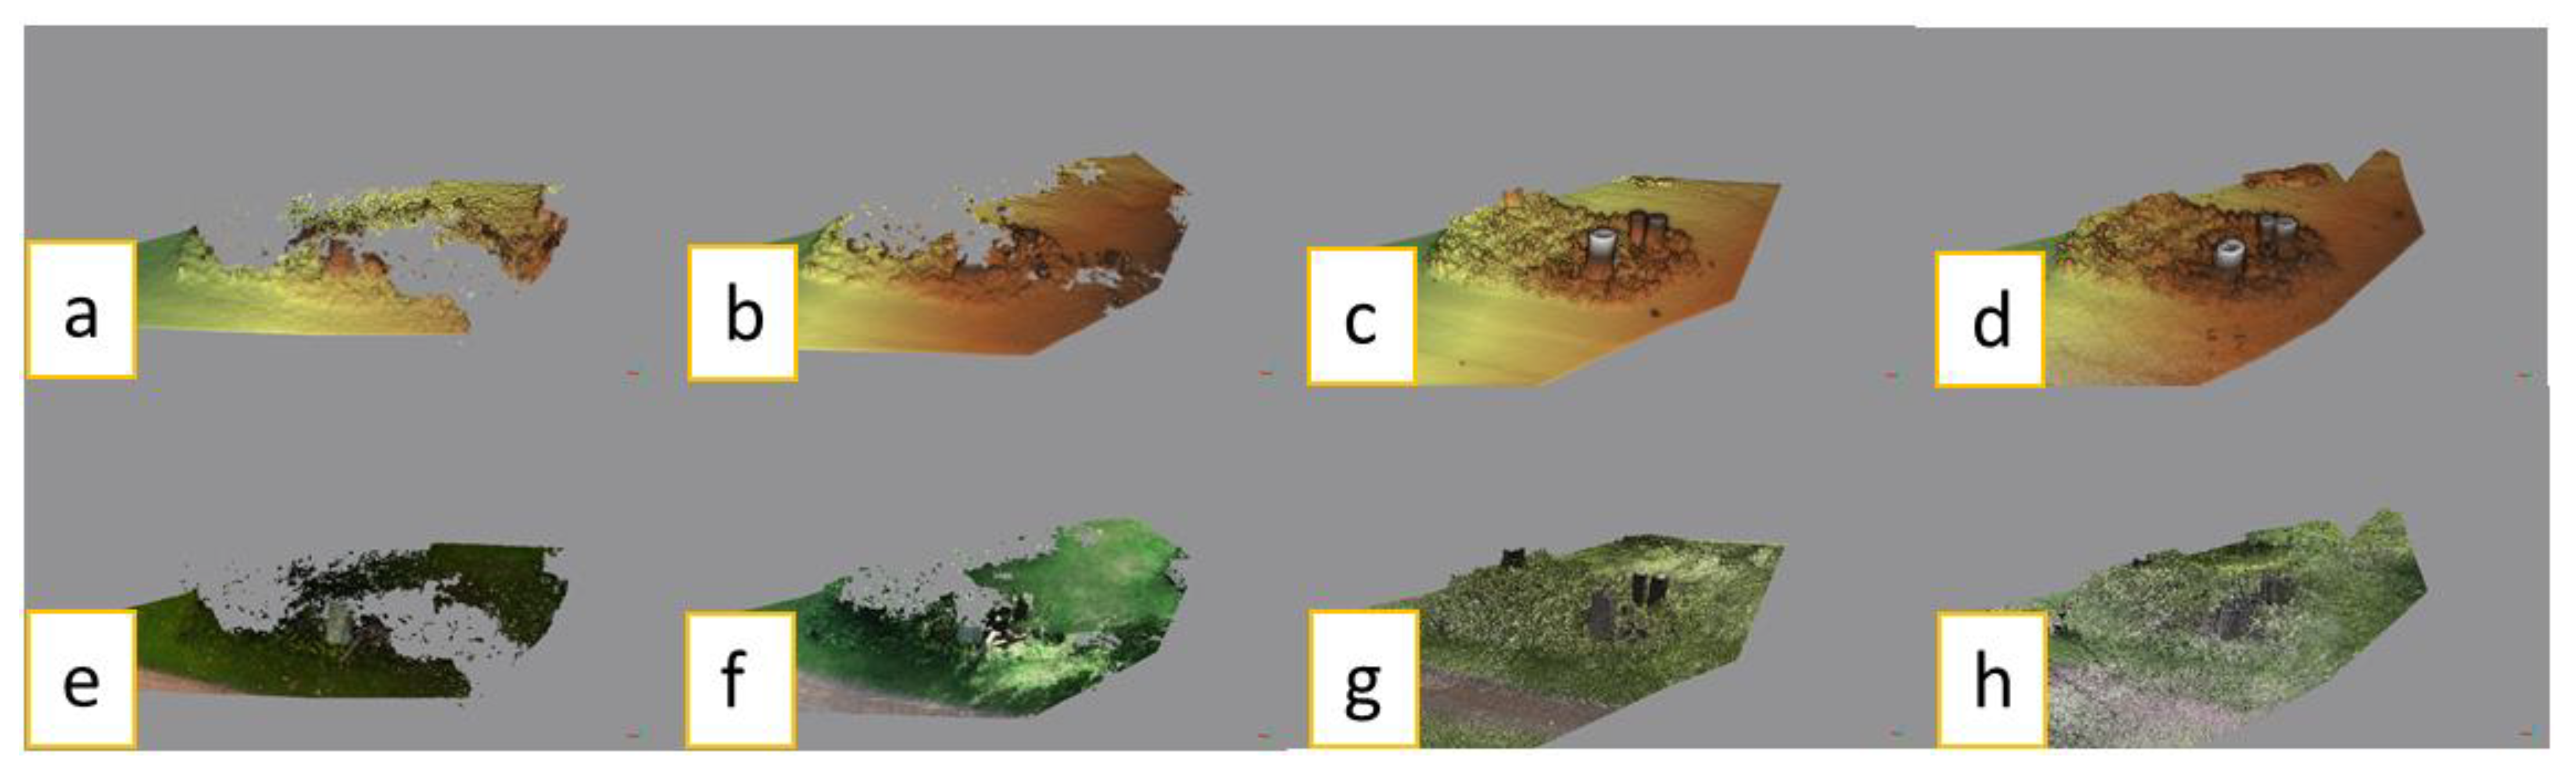
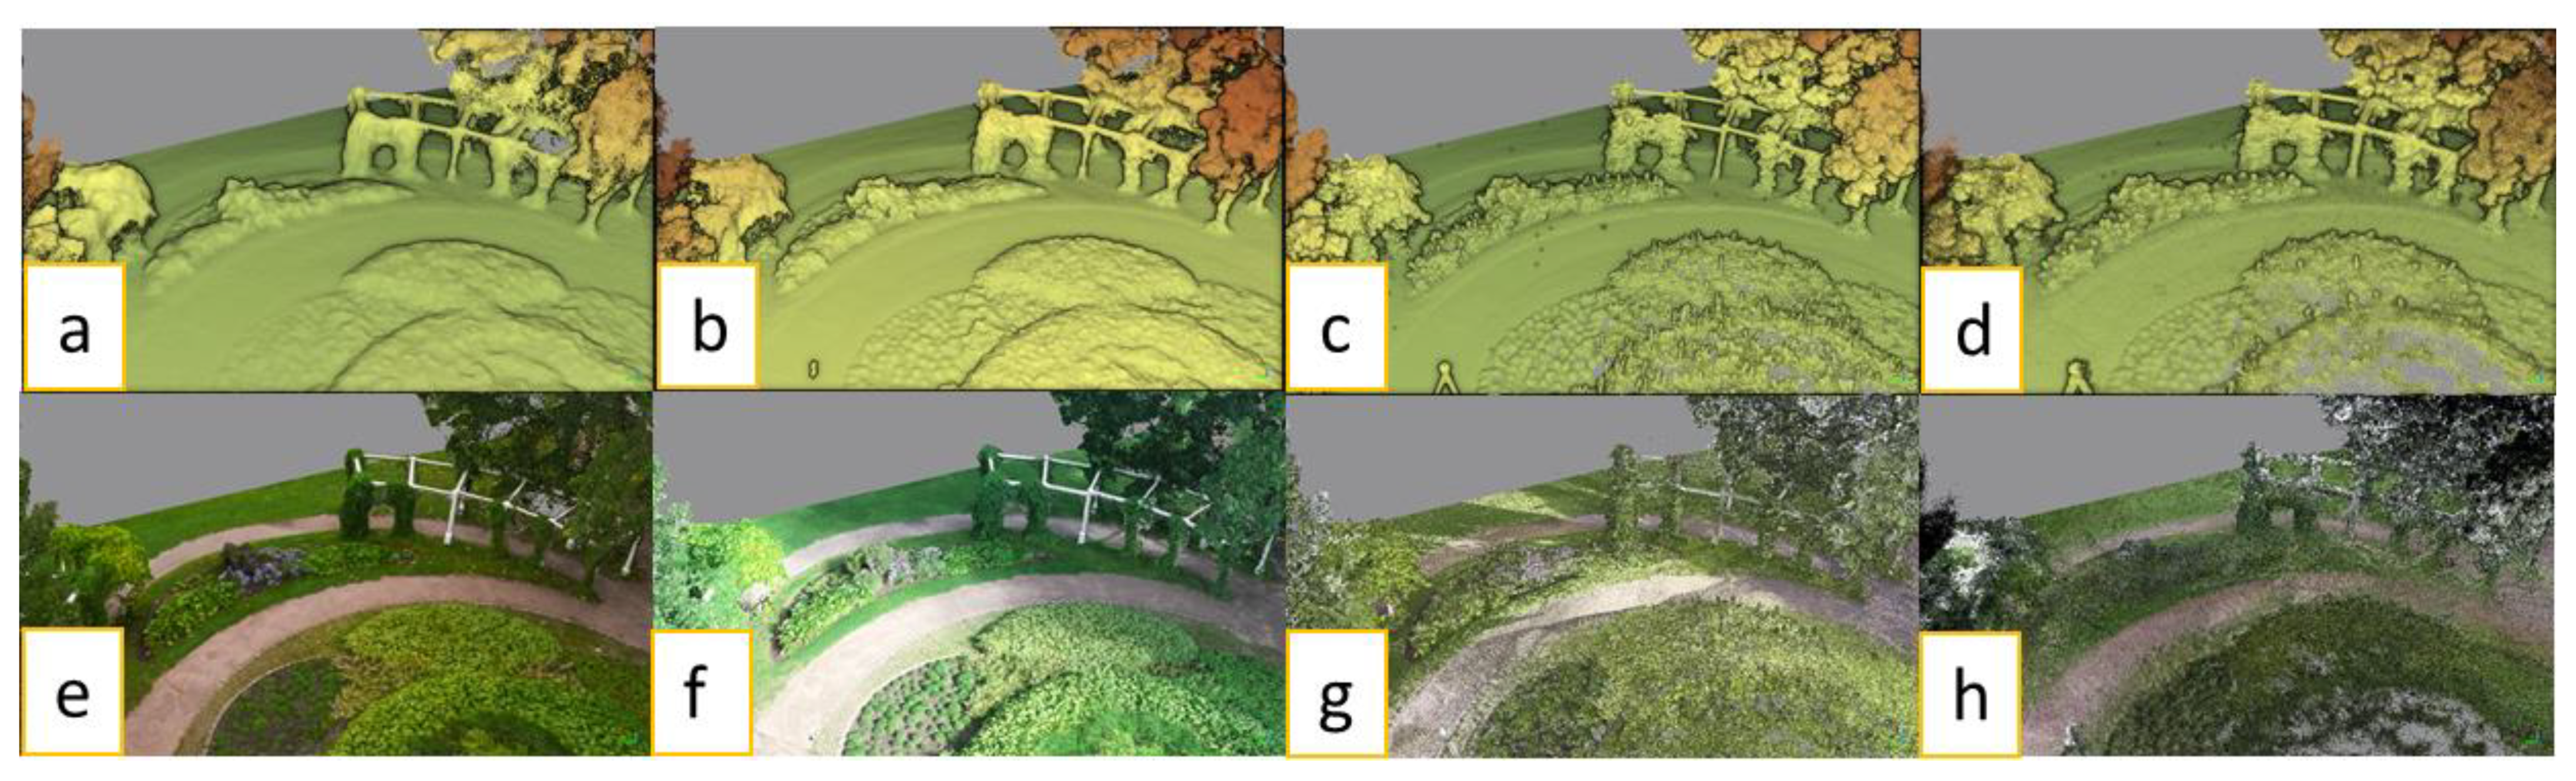
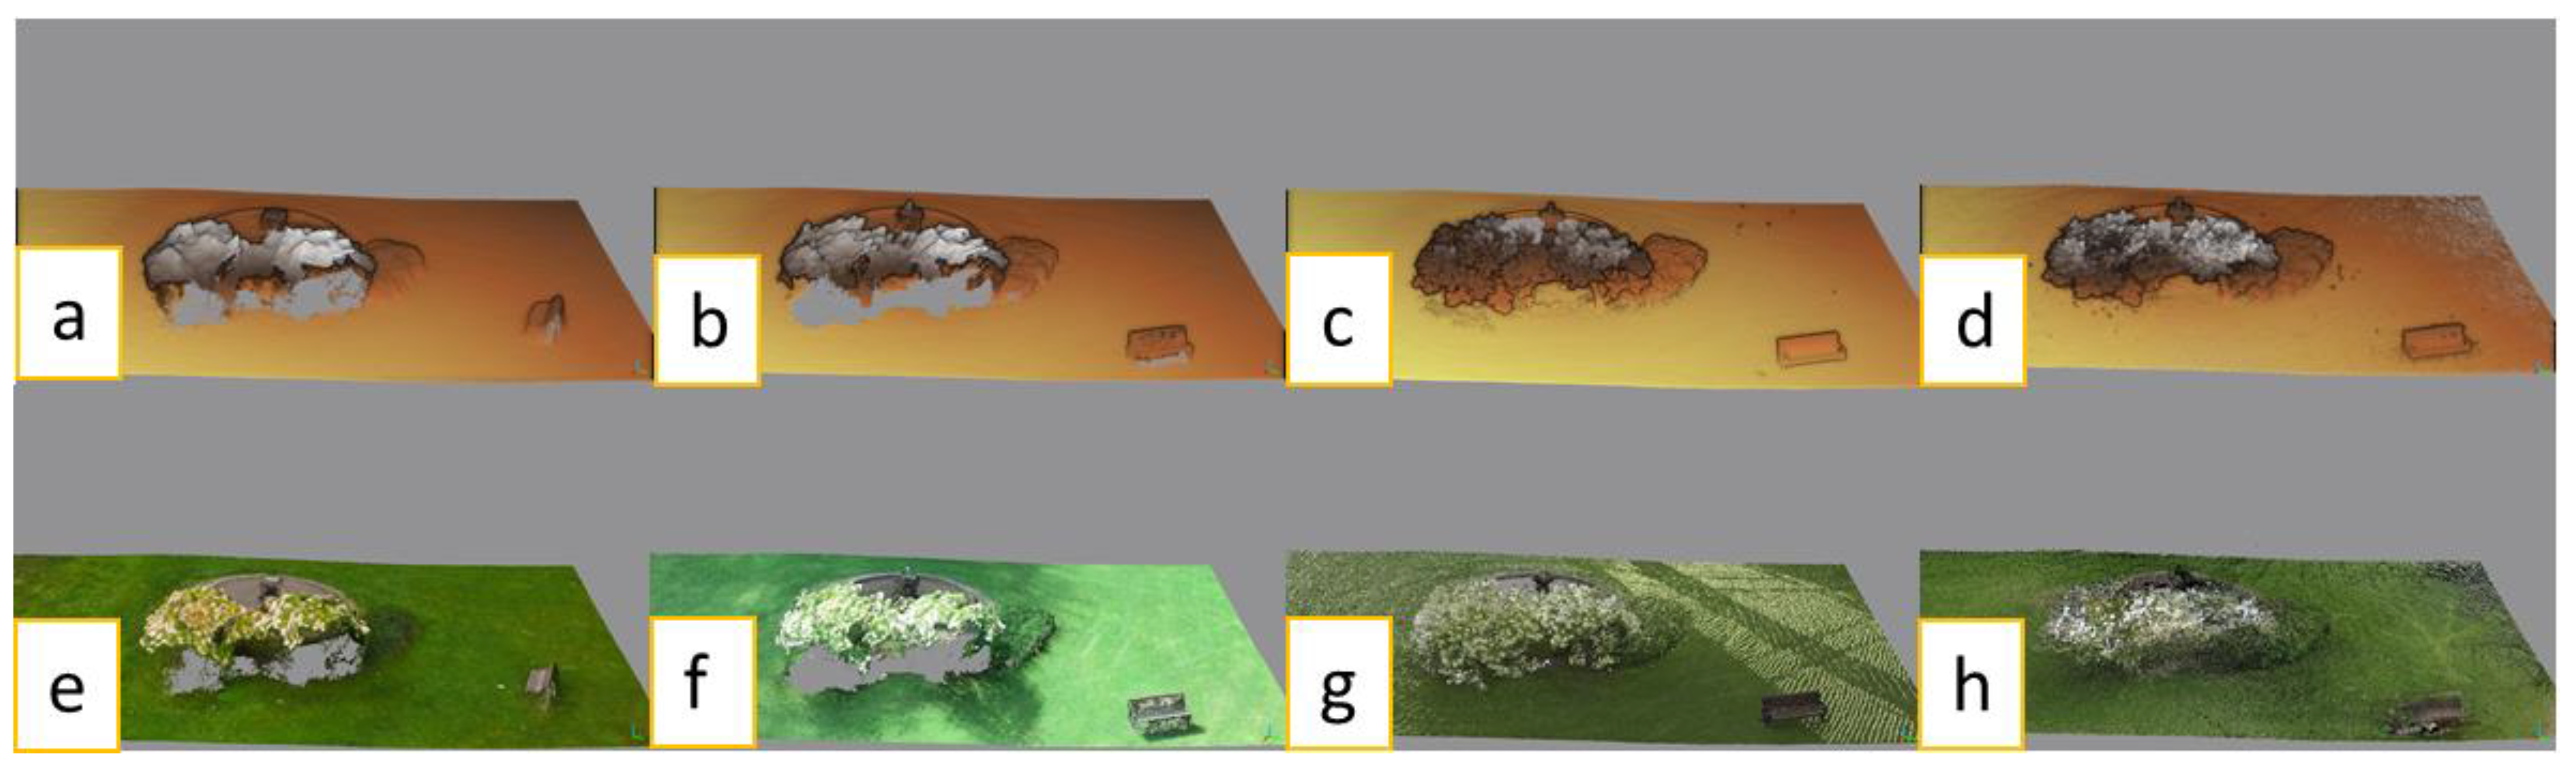
Figure 14. In all the figures, the point clouds are denoted as the following: (a) Tarot T960 for geometry, (b) DJI Phantom 4 Pro+ for geometry, (c) Leica RTC360 for geometry, (d) GeoSLAM ZEB Revo RT for geometry, (e) Tarot T960 for appearance, (f) DJI Phantom 4 Pro+ for appearance, (g) Leica RTC360 for appearance, and (h) GeoSLAM ZEB Revo RT for appearance.
Trees of different sizes were generally well-visible in all the point clouds (
Figure 6,
Figure 7 and
Figure 8); however, the appearance of trees was of somewhat poor quality in the RGB colored point cloud generated by GeoSLAM ZEB Revo RT. For the very small tree, the point cloud generated with Tarot T960 could not provide a complete form (as the trunk was missing) which eventually also affected the appearance.
The location of the investigated green elements affected the results; the elements located under the tree canopy were generally less visible in the data than elements located in the open area, as shown in
Figure 8,
Figure 10 and
Figure 11.
Apart from the location in the study field (under the canopy vs. open area), the form of the element affected the results; sand surfaces and lawns were given lower scores than elements with a more geometric form. For those elements, laser scanning-based solutions could more likely provide a well-presented geometry; however, the results show the strengths in appearance of the UAV-based solutions in conveying information on distinct visual details in elements, such as perennials (
Figure 12 and
Figure 13).
As shown for blooming shrubs (
Figure 14), the laser scanning-based data were more likely to cover the geometry of the element as a whole. However, for the appearance, the RGB visualization of the colors was not as informative with GeoSLAM ZEB Revo RT (
Figure 14d,h). RGB visualization would be essential in defining the blooming element of the shrub.
4. Discussion
By implementing a case test study in Espoo, Finland, our study aim was to support the monitoring of existing UGI on a local scale. We tested the suitability of distinct 3D point cloud data by exploring the detectability of visible green elements. In the following, we conclude the most interesting results with all the tested green elements.
In the case of large trees, the appearance of the top canopy was somewhat lower in quality in the laser scanning-derived point cloud data due to the perspective of the terrestrial sensors (
Figure 6). The small trees were captured almost equally with all the tested sensing methods; however, the appearance rating was slightly lower in the laser scanning -derived point cloud data (
Figure 7). In the case of very small trees, the higher flight altitude reduced Tarot T960’s capacity to capture minor geometries of the elements, leaving the trunks of the trees missing (
Figure 8). The large shrub was located under a large tree canopy in the test area, which negatively affected both the appearance and geometry of the element in the UAV-based point cloud data sets. However, the appearance of the large shrub was also generally low in the laser scanning-derived point cloud data sets, while its geometry was generally good in them (
Figure 9). The results with natural vegetation (
Figure 10) and dead wood (
Figure 11) were similar to the large shrub due to a similar location under a large tree canopy, even if the elements itself were of different size and geometry.
The tested pavements, including grass stones and sand surfaces (
Figure 12), were not detectable in terms of geometry in any of the point cloud data, and thus were rated with the lowest possible scores. However, from the appearance point of view and due to the RGB-coloring, these elements were varyingly detectable. The geometry of the lawn showed slightly better results in all the point cloud data sets (
Figure 12). Geometry of the perennials, perennial wines (
Figure 12), and plants with impressive blooming (
Figure 13) resulted in moderate to good ratings in the photogrammetrically derived point clouds, and good ratings in the laser scanning-derived point clouds. For these elements, the appearance was somewhat better with the photogrammetrically derived point clouds, except for the plants with impressive blooming, for which Leica RTC360 generated equally good appearance ratings. The UAV-based point clouds had issues with the flowering shrub’s geometry (
Figure 14). Further, the flowering shrub was the only green element which showed the best appearance with a laser scanning-derived point cloud data set; however, the differences in the results were only small.
4.1. Suitability of Point Cloud-Based Information for the Purposes of Monitoring Local Green Elements
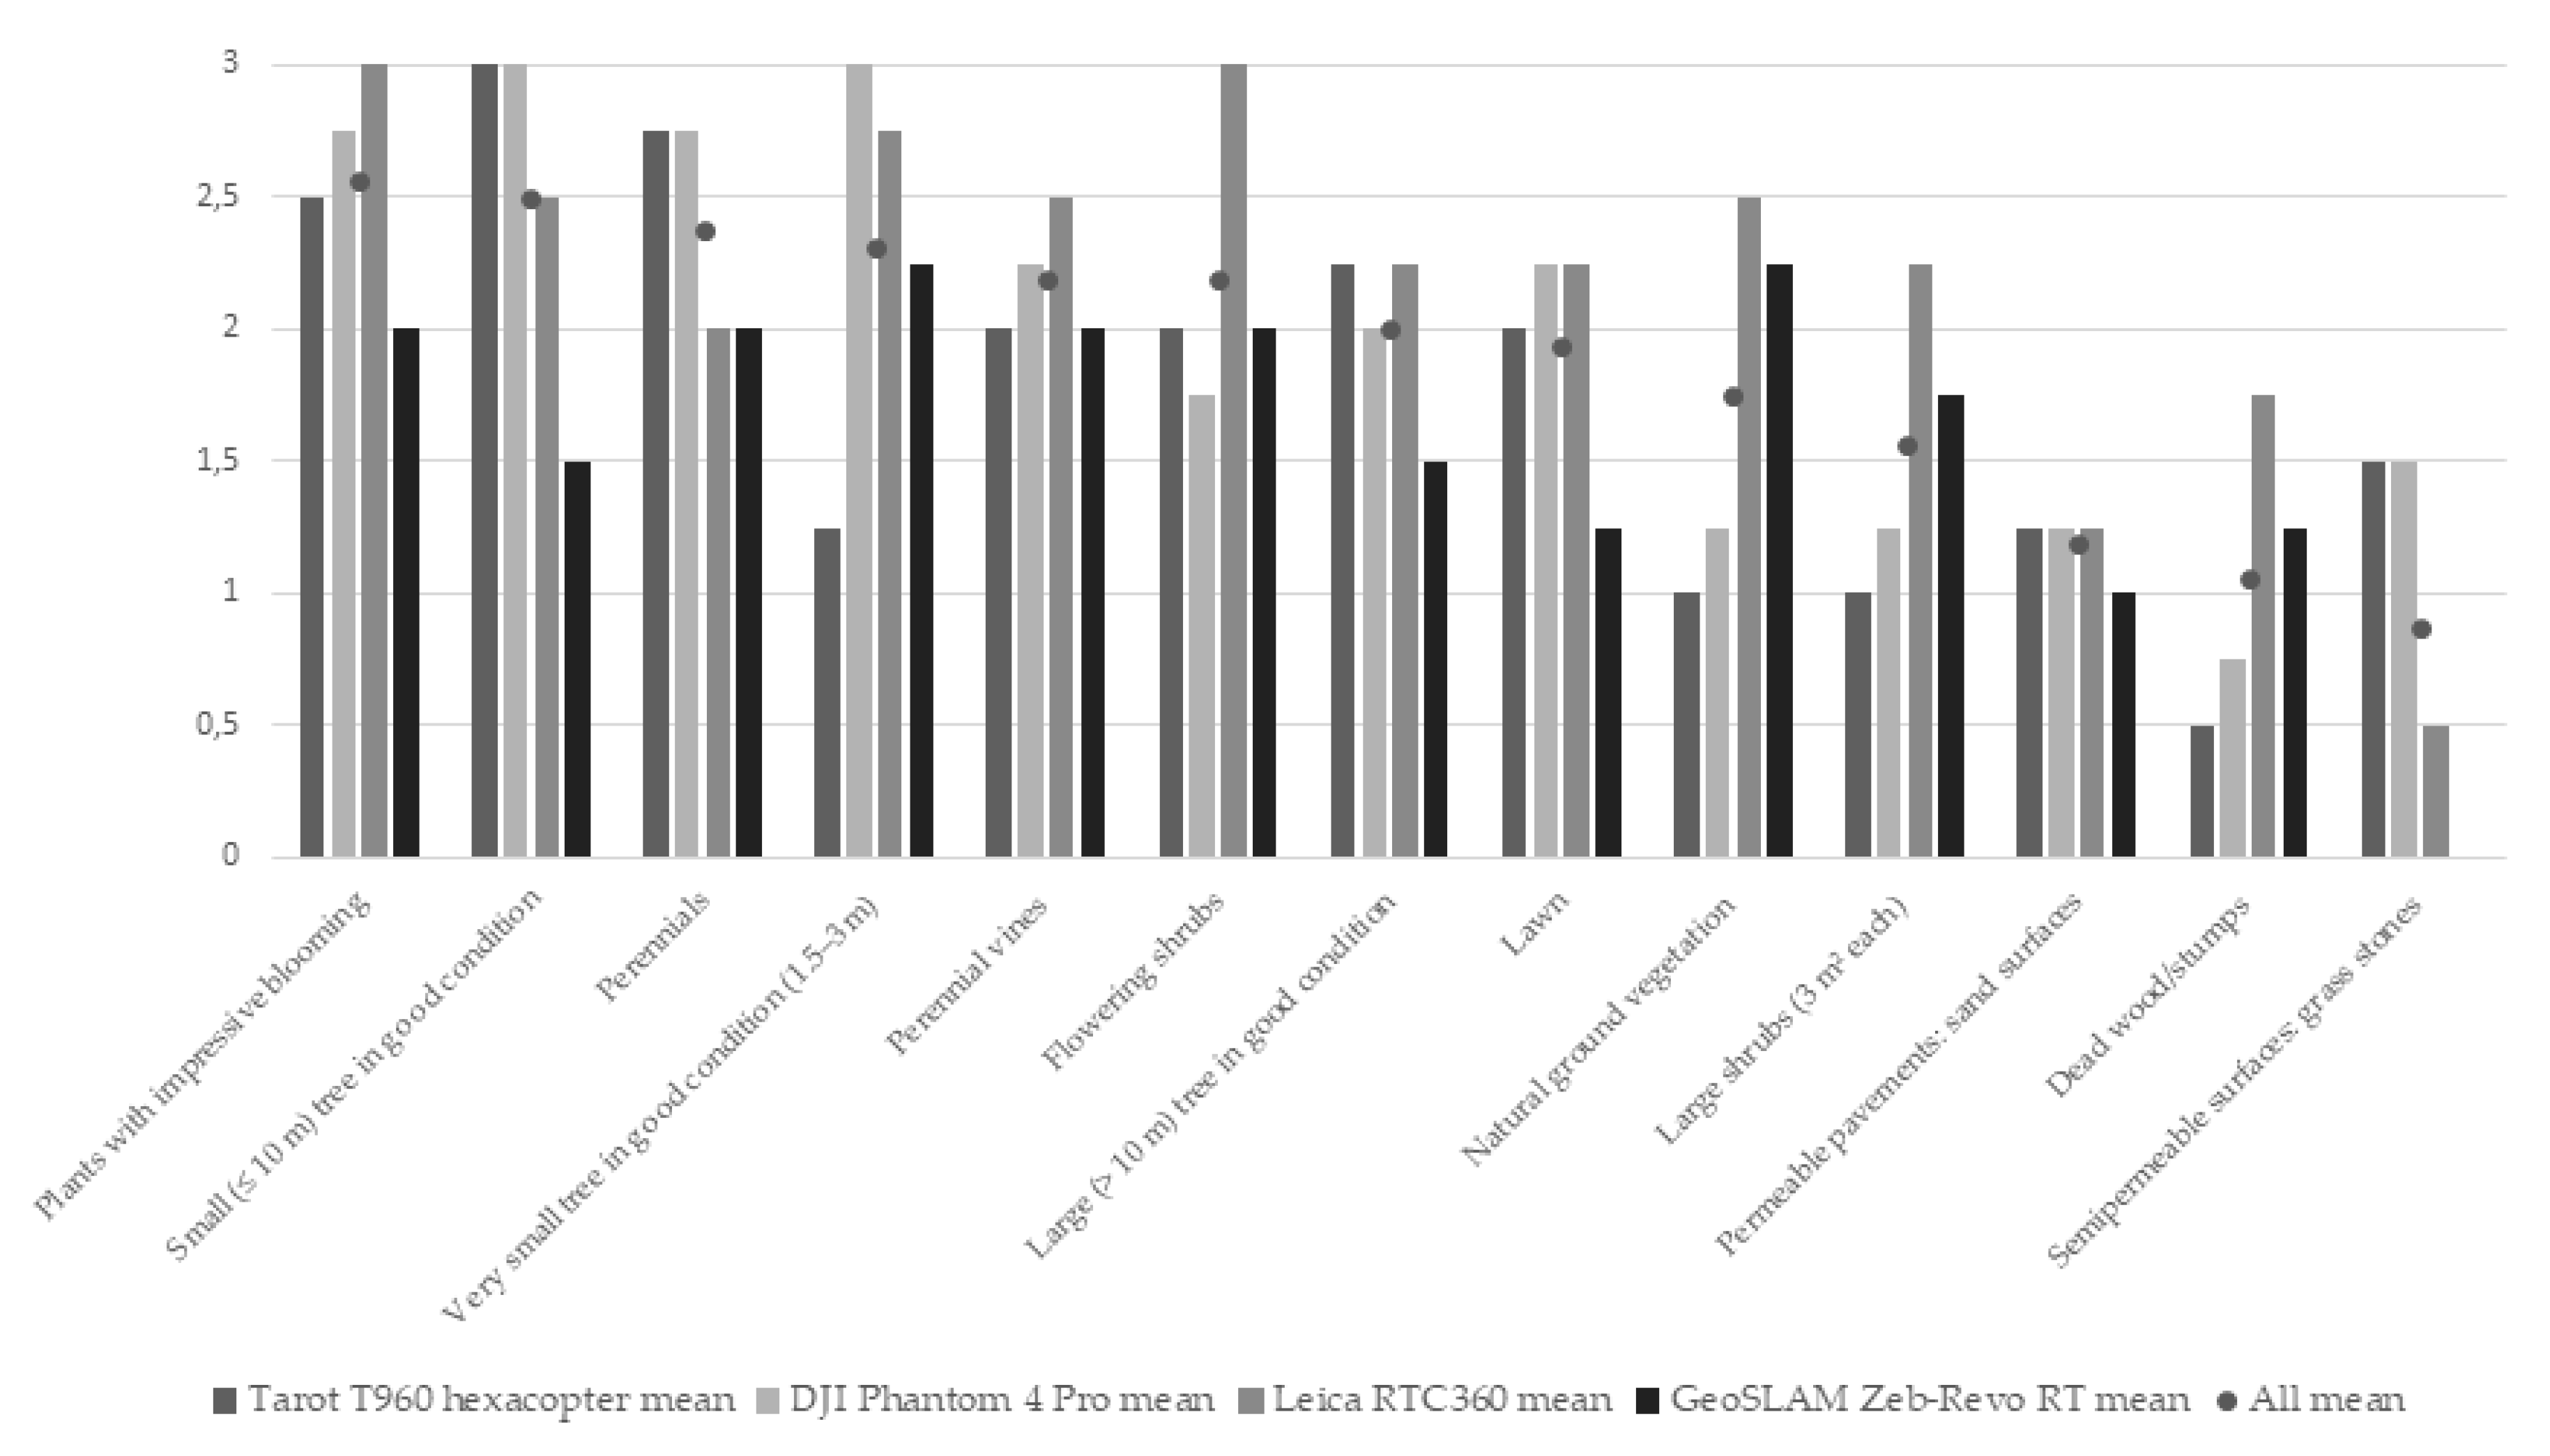
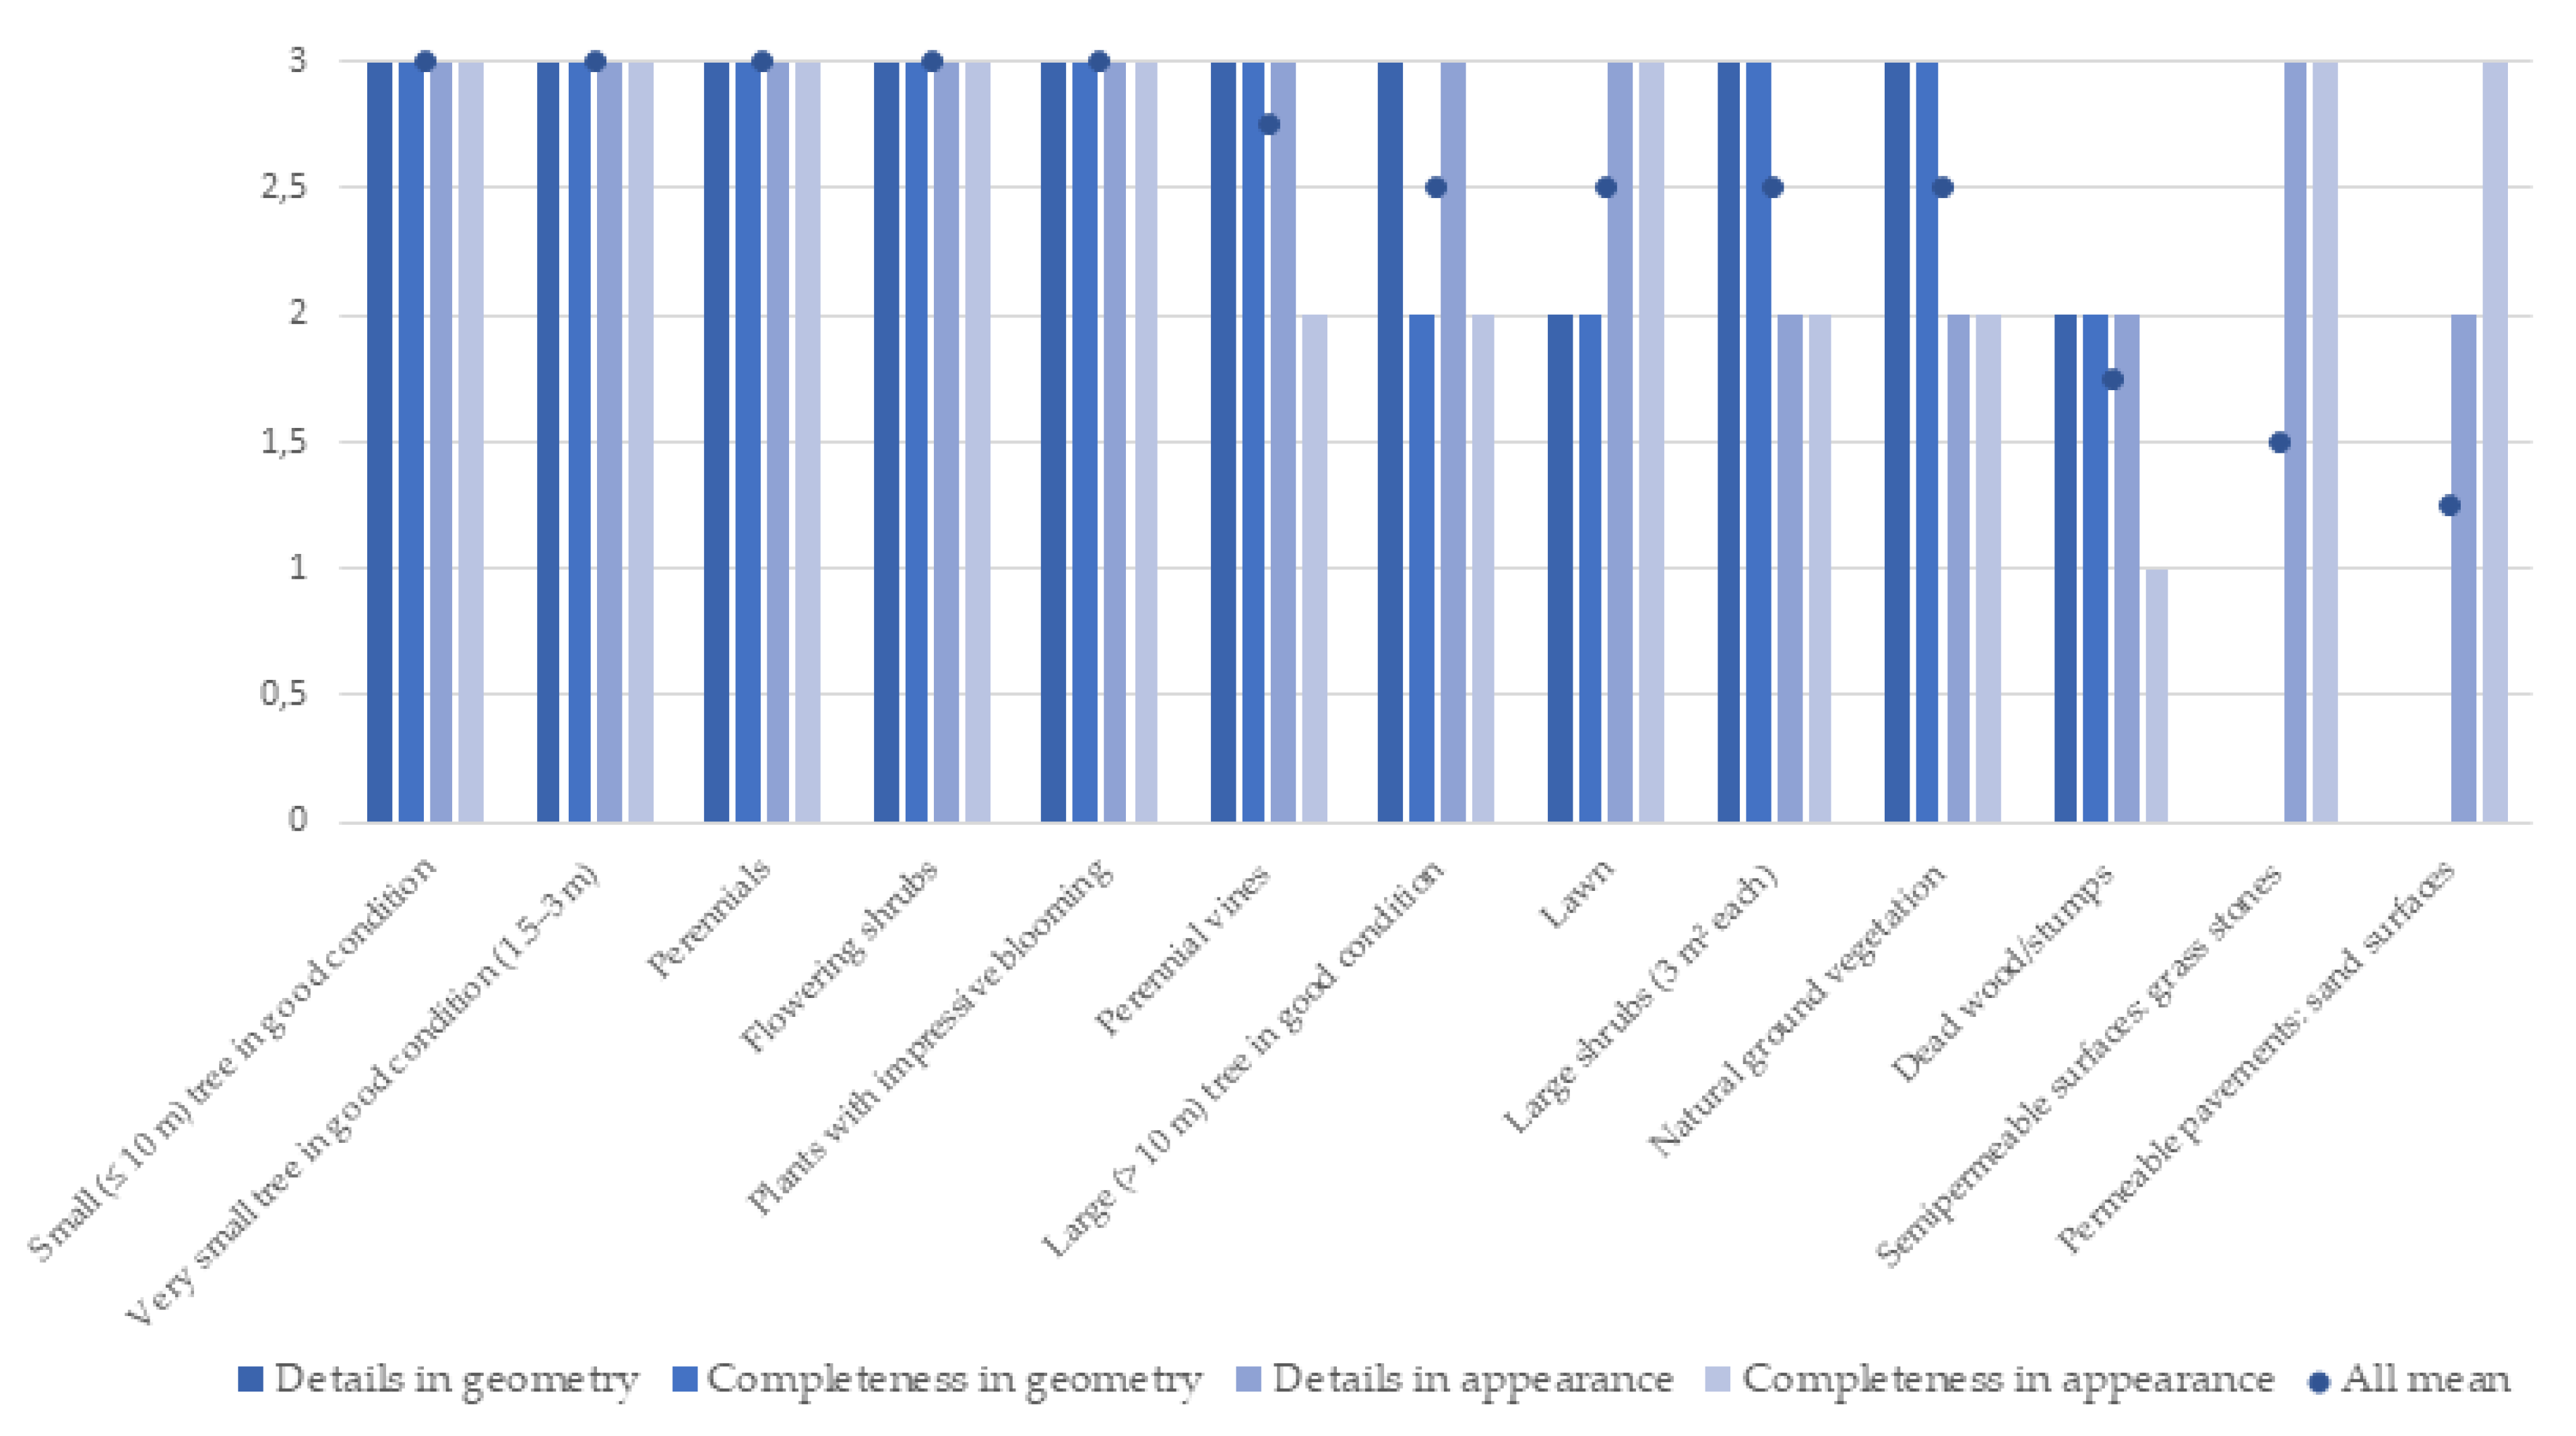
The results show that the point clouds originating from different systems have differing abilities in conveying information on green elements. When looking at the mean results, there are clear differences in how well the point clouds were able to convey information. In some cases, there were quite remarkable differences even within single elements as shown in the results with natural ground vegetations, semipermeable surfaces, and perennials (
Figure 15).
To highlight the best observed ability of the point clouds to convey information on green elements, the top results received with any of the point cloud data sets are shown in
Figure 16. For this, it was enough that the green element quality parameter received the top score of 3 with at least one of the point cloud data sets. We can conclude that the differences between the green elements were relatively low when looking at the best performing results from any sensor system. Five of the thirteen green elements could be assessed with the point clouds as they were evaluated to have a good ability to convey information on them (full scores). Five elements received less than a full score, but at least 2–5 points in the mean, indicating that point clouds have a moderate ability to convey information on them. Surface-like elements that have similar textures to one other, that is, grass stones and sand surfaces, as well as dead wood located within the natural ground vegetation and under the canopy, were given less than 2 points in the mean, meaning that point clouds have only a low ability to convey information on them.
4.2. Differences of Data Acquisition Methods
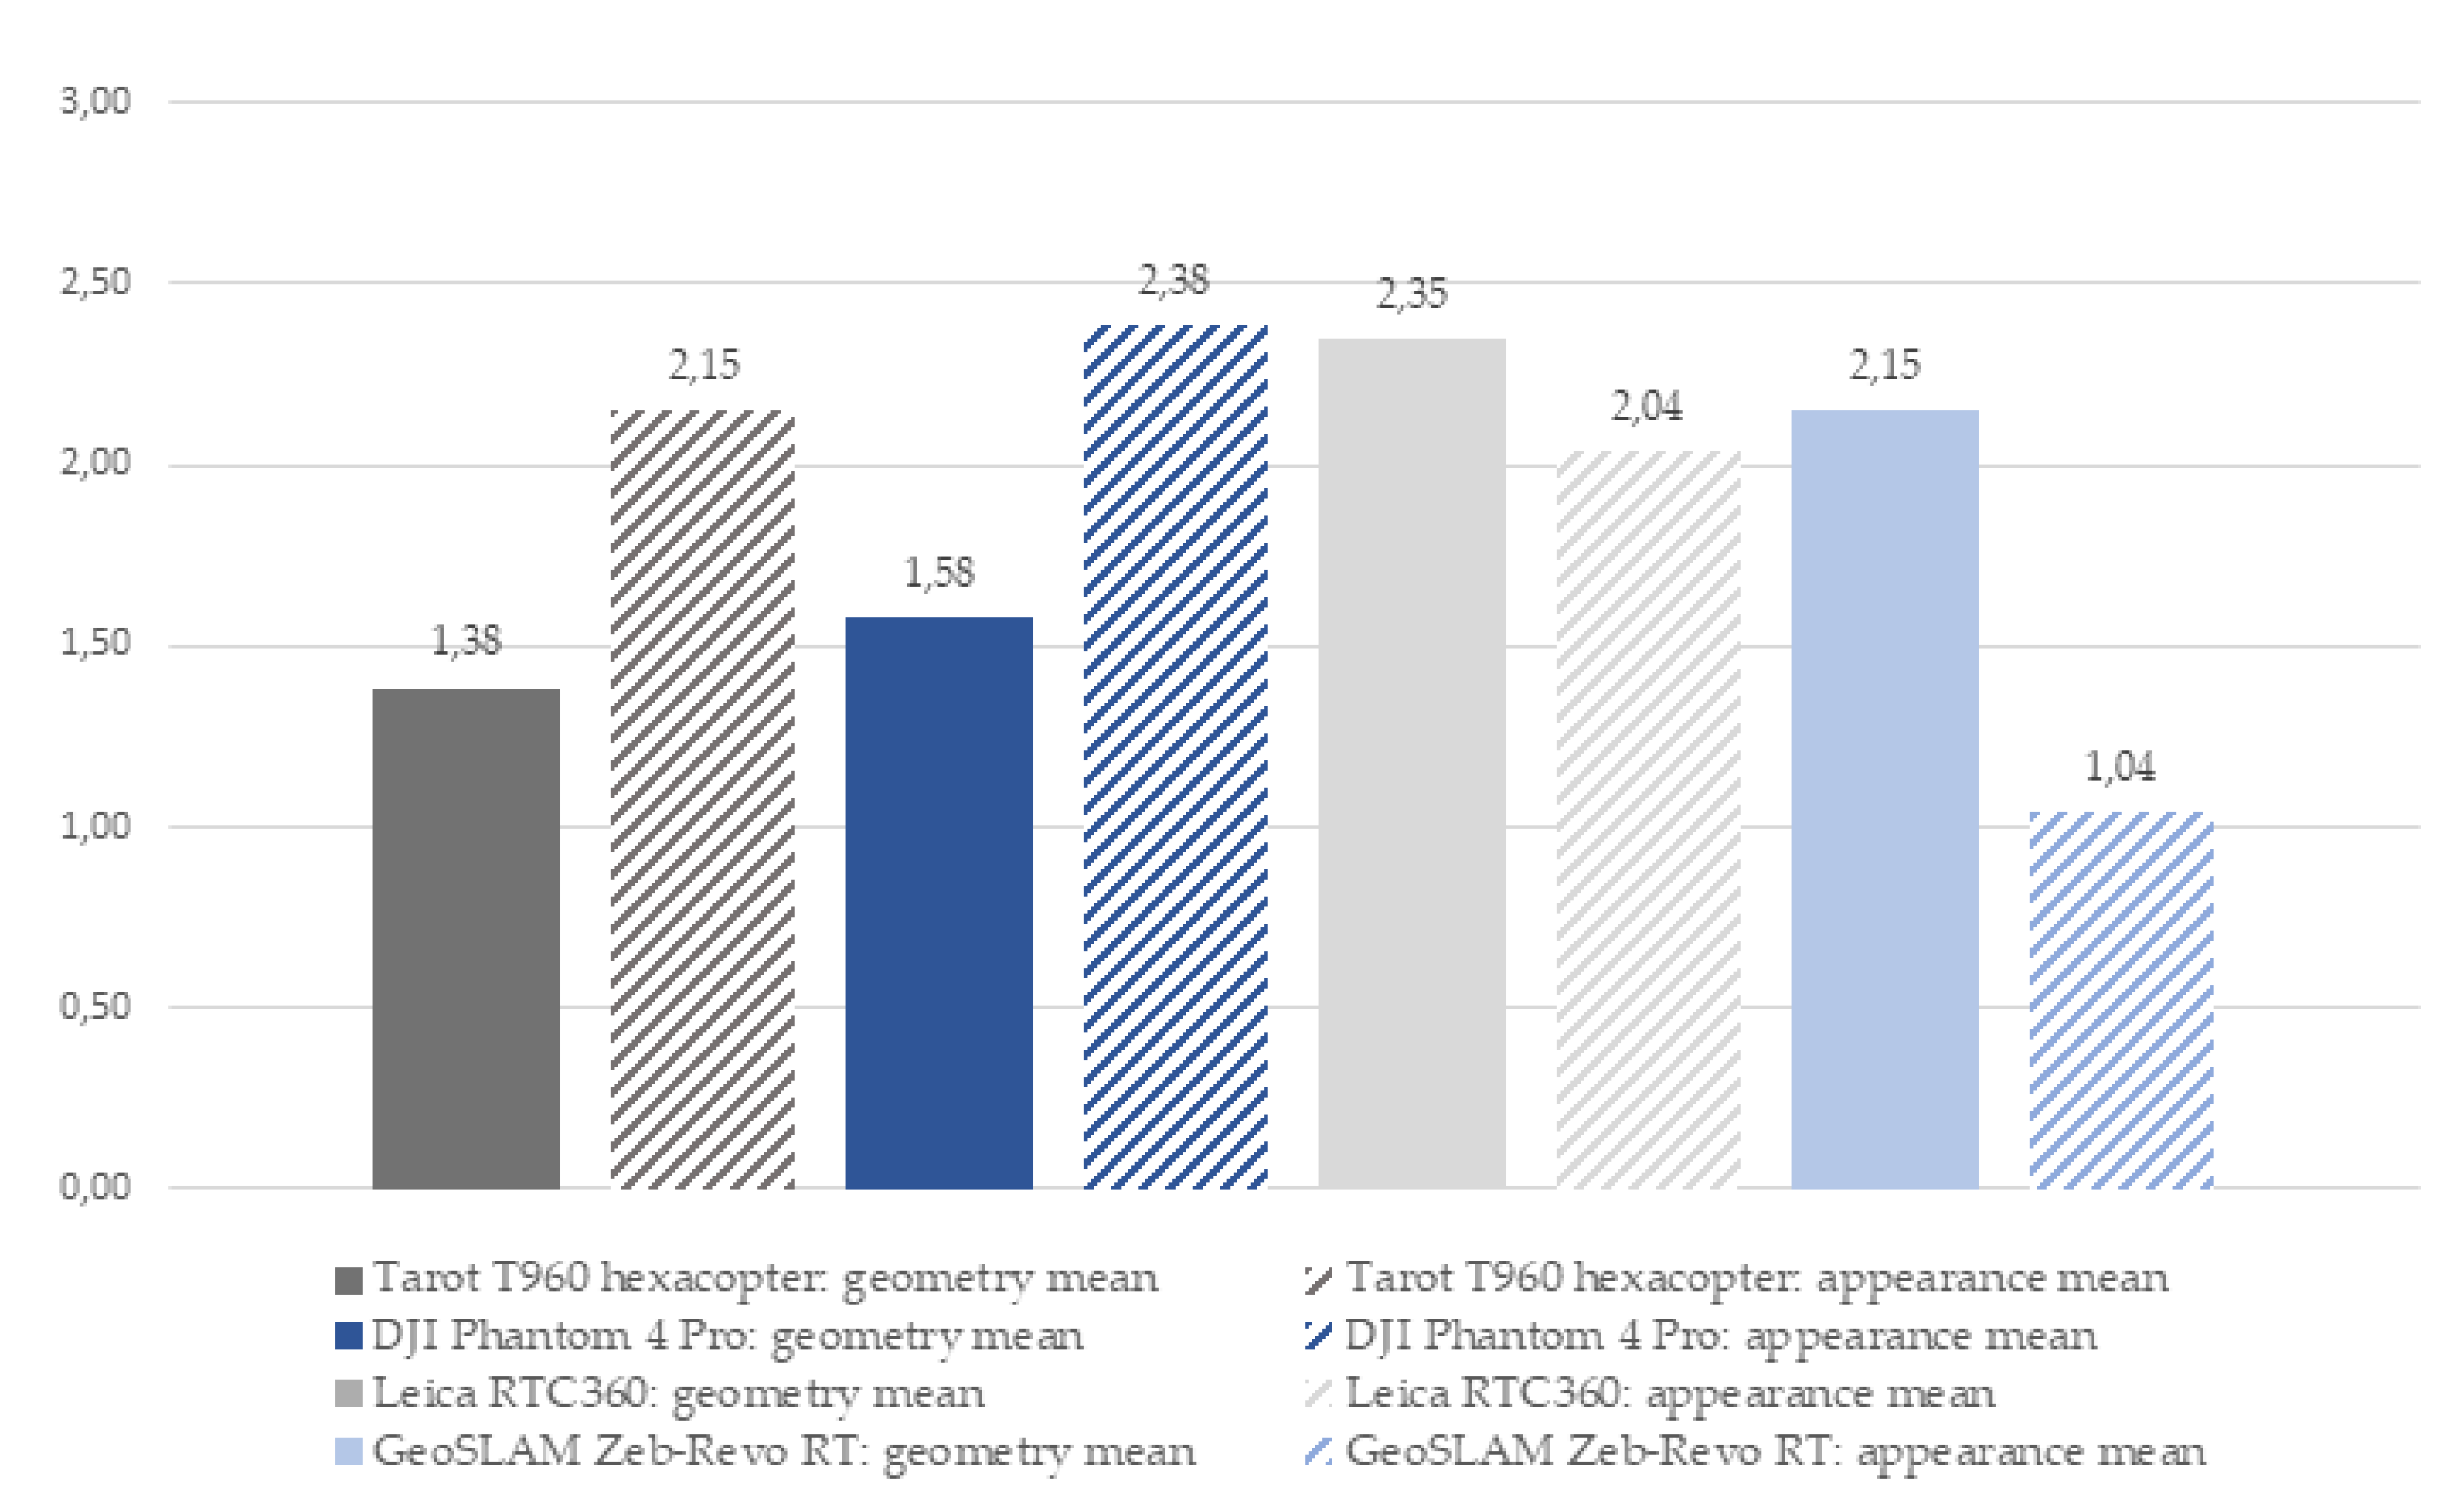
The results with point cloud data sets were compared in terms of conveying information on geometry and appearance (
Figure 17). According to the results, differences are not only found between UAV photogrammetry and laser scanning-based solutions, but also between UAV photogrammetry methods, as shown in the results with very small trees, and between laser scanning methods, as shown in the results with flowering shrubs and lawns. For geometry, Leica RTC360 generated the best mean results, and for appearance, DJI Phantom 4 Pro+ generated the best mean results. The differences in the latter are explained by the generally low performance of GeoSLAM ZEB Revo RT in qualities considering appearance.
DJI Phantom 4 Pro+ generated more detailed results when compared to Tarot T960. This difference in accuracy is explained by the flight altitude, as the GSD of DJI Phantom 4 Pro+ was 7.8 mm/px, and of Tarot T960 12 mm/px. Similarly, Leica RTC360 generally resulted in more detailed and comprehensive point clouds than GeoSLAM ZEB Revo RT. This was expected, as terrestrial laser scanning has been shown to enable high-quality point clouds with high accuracy (0.1–5 mm) and precision (0.6–4 mm), and a high level of detail [
66]. Prior studies show that the accuracy of SLAM techniques are at the 1–3 cm level [
67,
68,
69,
70]. The strengths of UAV photogrammetry-derived point clouds are related to appearance parameters, while lower flight altitude seems to generally generate better results when many of the targets are small-scale elements, like many of the elements in the green factor. The strengths of laser scanning generated point clouds are related to the quality of geometry [
66]. In previous studies, GeoSLAM ZEB Revo RT has been noted to have lower quality in RGB-colored point clouds [
71], which is seen in the results as weaknesses in terms of appearance. To conclude, accuracy of measuring local and small-scale UGI can be improved when utilizing terrestrial laser scanners and UAV data from lower flight altitudes.
4.3. Prospects for the Point Cloud-Based Evaluation of the Local Existing Green Factor
Finally, we applied the test results to estimate the capability of point cloud-based evaluation in the future for existing green infrastructure through the green factor. The tentative estimations are presented in
Appendix B. According to the results, we argue that elements with clear geometric form have a good potential to be assessed with the support of point cloud data [
72]. The underground (non-visible) and surface-like elements, such as pavements, are likely to be applied only together with additional information sources. However, yards are individually structured natural environments, which might pose challenges for semi-automated assessments [
73]. For future use, it is important to notice that in some cases, point cloud data sets can offer even more detailed and comprehensive information on the elements than is now defined in the green factor tool. The green factor tool that was used as a reference tool in this study defines the quantity of elements mostly in square meters or pieces. This is logical, as the actual green factor tool is intended to be used in the planning phase. However, for the assessment of the existing green factor, the tool could be developed to include the qualities of the existing elements in vertical strata and in volume [
42]. In such case, point cloud-based evaluation of green effectiveness can enable possibilities for geometrically comprehensive assessment of UGI, including the vertical dimension.
4.4. Remarks on the Study Design and Future Research
The chosen perspective plays a major role in differences between aerial and terrestrial data capture. Terrestrial sensors are usually utilized to capture features located on, or near, the ground surface while UAV footage tends to be used for bird’s eye purposes, such as for capturing tall elements like large trees [
73]. Another aspect bound to the chosen perspective is distance from the sensor to the subject. Laser scanners are designed to operate in a certain range window that needs to be accounted for. Generally, in surveys of built environments, UAVs are applied to capture an overview of the area and terrestrial methods for the close-range targets. However, both methods can be at least theoretically used for both close and high range purposes. With terrestrial methods, it is easier to cover the area under the canopy, but it is also possible to fly the UAV under the canopy [
74]. This is not yet a very typical way to advance UAV-based surveying, and in our study, we chose distinct methods that advocate the differences in their strengths and demonstrate how these methods complement each other. To conclude, for monitoring elements of differing sizes, both terrestrial and aerial perspectives are beneficial.
Even though comparing the time consumption of the different methods was not an objective in our study, it is worth noting that in this study, it took five hours to gather the terrestrial laser scanning data, while the Tarot T960 survey mission took 12 min. However, ZEB Revo RT offered relatively fast data capture by covering the test areas in 30 min. Finally, the manually operated DJI Phantom 4 Pro+ flights took 75 min combined. It should be noted that the DJI Phantom Pro+ could have been flown higher like the Tarot T960 to cover the area quicker but with lower resolution. This is an important aspect to consider in operative surveying; higher resolution data capture generally takes more time but might be purposeful in some cases. Aerial methods can be scaled easily, and as we have shown, flight distance had a relatively large impact on the results [
75]. On the other hand, in terrestrial methods, scaling is more limited because of the perspective induced by occlusion [
76]. The final aspect to consider is the amount of detail needed for the given task as the sensor should be chosen accordingly. It might not be cost-efficient to gather high-resolution data if lower resolutions can provide the information needed. Thus, for careful method design based on the individual characteristics of the targeted yard or similar environment, possible prior field inquiries are advised.
In our study, we analyzed the green elements manually from the point clouds. In the future, the possibility to use machine learning to classify the distinct green elements, even species, is of great interest. The fully automated analysis of point clouds has been studiedin remote sensing and computer vision research for numerous years [
77]. Both deep learning and machine learning techniques [
78] have been tested and deployed in point cloud data analysis, leading to promising results in urban point cloud classification via algorithms, such as random forest [
79] and presence and background learning [
80], and also via deep-learning architectures, such as SPGraph [
81]. Tree attributes, such as canopy and stem surveying-based quantitative methods, have already been widely studied for forestry e.g., [
35,
36,
37,
82,
83]. For green factor-like evaluations, questions around quality as well as the variety of objects and species arise. In addition to the green effectiveness evaluations, there are also other opportunities for the use of point cloud-based information in the management and planning of local UGI, including private and semi-private entities such as yards [
14,
15,
16,
17,
18]. One of the possibilities is to manipulate point cloud-based models to represent future landscape scenarios’ design and planning [
28].
The literature on point cloud-based assessment of urban single green elements, apart from trees, is still limited [
42,
43,
44]. Therefore, the criteria for the qualities of the point clouds, as well as the respective methods, should be further studied in terms of UGI assessment. In this study we utilized geometry and appearance with a distinction between details and volume/amount. As we broaden the monitoring of UGI to the detailed vertical strata, also the criteria and targets of the environmental assessment tools need to be adjusted and further discussed. Originally, the green factor is a tool intended for evaluating 2D plans, which does not yet open all the possibilities that the three-dimensional approach offers to the management of UGI. Consequently, as stated in recent research [
42,
43,
44], in addition to technical development, a shift in thinking is required. In the sustainable planning of UGI, there are still many possibilities that the vertical aspect of local geospatial information has to offer but have still not yet been utilized up to their full potential. Based on the results of this study, a point cloud-based green factor calculation is a promising approach that could be reinforced with machine- and deep-learning techniques in future studies.
5. Conclusions
Detailed evaluation of local UGI is a potential tool in maintaining sustainable urban environments under the era of consolidating cities. With remote sensing methods, prior research is oriented on large-scale estimation of UGI. Studying the environment to a high level of detail with photogrammetry and laser scanning is a well-established research practice, however, apart from trees, it is currently less applied in estimations, such as the green factor, including single urban green elements. Terrestrial laser scanning, mobile laser scanning, and UAV photogrammetry were applied for 3D-mapping a yard environment in high detail. The resulting point clouds were compared in their ability to convey information of urban green elements, both concerning their geometry and appearance. While there were differences in how successful the distinct sensor methods were in presenting different green elements, the green elements were also not equally well-captured in the data. This was seen especially with the surface-like elements, and with the elements located under the canopy or on the ground within natural vegetation. Thus, while point clouds appear to be a potential tool in future estimations of the existing green factor of a single area, the individual characteristics of the study site may play a great role in how successful the monitoring of green elements will be in quality. Therefore, we suggest that the implementation of point cloud-based methods should be designed according to the desired level of detail, to the division of tall and small-scale elements, and to the number of green elements located under the canopy. Additionally, further development of the green factor or similar tools would be needed to better allow the evaluations of the green effectiveness of the existing local UGI, as the green factor is now mainly applied as a regulative tool in planning.


 ,
, 