Article

3D Point Cloud Data in Conveying Information for Local Green Factor Assessment

1
Department of Built Environment, Aalto University, 02150 Espoo, Finland
2
Finnish Geospatial Research Institute FGI, 02430 Kirkkonummi, Finland
*
Author to whom correspondence should be addressed.
ISPRS Int. J. Geo-Inf. 2021, 10(11), 762; https://doi.org/10.3390/ijgi10110762
Submission received: 1 September 2021 / Revised: 29 October 2021 / Accepted: 6 November 2021 / Published: 11 November 2021

Abstract

:
The importance of ensuring the adequacy of urban ecosystem services and green infrastructure has been widely highlighted in multidisciplinary research. Meanwhile, the consolidation of cities has been a dominant trend in urban development and has led to the development and implementation of the green factor tool in cities such as Berlin, Melbourne, and Helsinki. In this study, elements of the green factor tool were monitored with laser-scanned and photogrammetrically derived point cloud datasets encompassing a yard in Espoo, Finland. The results show that with the support of 3D point clouds, it is possible to support the monitoring of the local green infrastructure, including elements of smaller size in green areas and yards. However, point clouds generated by distinct means have differing abilities in conveying information on green elements, and canopy covers, for example, might hinder these abilities. Additionally, some green factor elements are more promising for 3D measurement-based monitoring than others, such as those with clear geometrical form. The results encourage the involvement of 3D measuring technologies for monitoring local urban green infrastructure (UGI), also of small scale.

1. Introduction

Ensuring the adequacy and quality of urban ecosystem services and green infrastructure has been widely highlighted in the urban land use and planning literature in recent years. In an urban setting, ecosystem services distinguish between nature’s functions in production, regulation, support and cultural services, and also recognize nature’s intrinsic function [1]. Like ecosystem services, urban green infrastructure (UGI) has become a central concept in land-use planning and policy [2]. It refers to, or is managed for, both natural and artificial elements of nature that are designed to provide ecosystem services [3]. UGI covers for example parks, public green space, allotments, green corridors, street trees, urban forests, roof and vertical greening, and private yards [4].
Urbanization and densification of housing are global phenomena [5]. Apart from the structural change, urban living seems to be a matter of dwelling preferences, too. At the same time, observation of and movement in nature have been shown to play a part in housing desires and proven to enhance human well-being and health [6,7,8], which the global circumstances under COVID-19 continue to underline [9,10,11]. This poses a challenge for the densification of cities and puts pressure on preserving and promoting the natural environment as much as possible in densely populated areas. Thus, recent studies on urban greening have pointed out the environmental justice and importance of small-scale solutions, as they enable access to nature in cities more widely than large-scale and more concentrated urban green projects, while most likely being easier to implement [12,13].
Yards have, until recently, played a minor role in the scope of UGI assessments, even if their importance is similar to other urban green areas [14,15]. Their proportion in the urban morphology is usually not insignificant, either; according to the survey of Loram et al. [16], the urban area covered by domestic yards ranged from 21.8% to 26.8% in six studied cities in the UK. According to Cameron et al. [4], there are significant differences in both the form and management of yards which radically influence their benefits; that is, their quality affects their impact on ecosystem services, such as carbon sequestration and storage potential [15]. According to Clark et al. [17], in many cities, private trees dominate tree canopy cover. As densification often means fewer private trees, it might lead to diminishing urban tree canopy cover. By acknowledging the role of private land and yards, the discussion on UGI expands into the private realm [18].
Awareness on the importance of local UGI and the requirement for its comprehensive planning has led to the implementation of the green factor (i.e., green area ratio, green space factor) tool in cities such as Berlin in 1997 [19], Helsinki in 2014 [20], and Melbourne in 2020 [18]. The purpose of the green factor is usually to ensure the sufficient amount of total green [21], as well as quality in the planning of a new district [22] by generating a numeric value for the planned and remaining green elements of the area. In the case of Helsinki’s green factor, for example, each element is given a multiplier, which is then used to calculate the value of the plan. This way, it is possible to compare distinct plans and to assess how the sustainability goals and targets are achieved. The green factor is still less dealt with in research, and only few practical application experiences are described in the literature [20,21]. However, in Helsinki, for example, the recent political debate has pointed out the necessity to extend the use of the green factor tool to urban infill projects, instead of limiting its use to new area development [23]. This puts pressure on developing the tool further, and on evaluating its possibilities to assess the already existing vegetation, instead of using it only as a regulative tool in the planning phase.
Three-dimensional point clouds generated with laser scanning and photogrammetry allow monitoring of physical properties and visually detectable elements of the environment. 3D point clouds are applied in natural resource management and forestry [24,25,26], disaster management [27,28], landscape monitoring and planning [29,30] as well as in the monitoring of individual urban buildings and urban scenery [31], urban trees [32,33], and streetscapes [34,35]. However, especially in 3D city modeling, the emphasis has traditionally been on buildings, rather than on small-scale natural environments, yards, and their elements. The applications on forestry research have been widely studied from both structural [36,37,38] and individual tree points of view [39,40,41,42,43], including forest inventory and change prediction [44,45,46]. Studies in forestry have also specified levels of detail for a single tree model [47]; however, methods in the field mainly concentrate on tree attributes. According to Casalegno et al. [48], Alavipanah et al. [49], and Feltynowski et al. [50], until recent years, the use of laser scanning and photogrammetry-aided methods have been implemented in surprisingly few applications in UGI assessments, even if its 2D-based applications, such as satellite data and mapping, are diverse.
The existing point cloud-based applications for UGI include, for example, quantitative metrics to estimate its overall volume and to demonstrate the spatial and volumetric heterogeneity of it. Casalegno et al. [48] demonstrated a voxel (volumetric pixels)-based assessment of UGI from waveform airborne lidar, including three different structures: grass, shrubs, and trees. The study resulted in differing outcomes with the evaluations based on other remote sensing data. A similar result has been achieved with the so-called green view index (GVI), a method usually utilizing panoramic photographs to assess the greenery of urban views enabling the local vertical assessment of the views. Larkin and Hystad [51] noted that the green views did not always correlate with the satellite-based normalized difference vegetation index (NDVI). Hence, UGI research could benefit from digital vertical (3D) data to supplement the hegemonic role of horizontal (2D) data.
Our aim is to develop 3D point cloud-based assessment of local UGI. We assess how well the green elements central to green factor assessment are visible and detectable in 3D point cloud data, focusing on the local scale. The idea is therefore not to include the existing criteria of the green factor in the study set, as it is, in many ways, bound to the planning phase, as well as to the two-dimensional information used in the planning documents. Instead, the idea is to point out aspects and possibilities that could be useful in the future’s 3D measuring-assisted assessment of local green infrastructure. Hence, our approach advocates the use of digital 3D data for built and existing local green elements in contrast to the typical approach in which the green factor tool is used mainly for planning and as 2D information.
More specifically, our objective is to explore the distinct point cloud data sets’ ability to convey information on green elements, especially when comparing them qualitatively in terms of geometry and appearance, and further with details and completeness of various green elements. Finally, the results are discussed in terms of the development of 3D point cloud-based assessments for local UGI.

2. Materials and Methods

2.1. Study Site, Measurements, and Data Sets

The study field encompasses the yard of Träskända, an 1890s manor located in southern Finland (60.2370° N, 24.7090° E), 18 km from the Helsinki city center. Currently owned by the city of Espoo, the Träskända manor and its yard are part of a nature reserve and park [52]. The diversity of its green elements makes the manor yard a practical study field for monitoring the use of point clouds for the purposes of the green factor, since many of the green factor elements can be found in the well-managed park area.
Detection of the reference elements was tested with four distinct point cloud data sets collected during August and September 2020. The devices utilized were (1) GeoSLAM ZEB Revo RT (mobile laser scanning), (2) Leica RTC360 (terrestrial laser scanning), (3) Tarot T960 (unmanned aerial vehicle (UAV) photogrammetry from 61 m), and (4) DJI Phantom 4 Pro+ (UAV photogrammetry from 32 m). All the datasets were georeferenced and presented in an ETRS-TM35FIN (EPSG:3067) coordinate system.
Reference data were gathered during two field inspections in August 2020. Photographs taken with an iPhone 6, and notes were utilized as reference material and in study designs. These were also used for including and excluding elements from the analysis (see Section 2.2). The characteristics of the point cloud data sets were explored visually, acknowledging the special characteristics of the study field, that is, acknowledging the elements that were located only under the canopy.

2.1.1. Tarot T960

The Tarot T960 hexacopter is an unmanned aircraft system (UAS). In its basic configuration, the UAV is equipped with a 3-axis gimbal stabilized Sony 36.3-megapixel A7R digital single-lens mirrorless (DSLM) camera fitted with a Zeiss Loxia 21 mm f/2.8 lens, resulting in a field of view (FoV) of 91° [53]. The drone system was configured for a lightweight survey mission with half-capacity battery, the simulated hover flight time being 19 min.
The flight was planned with Mission Planner (version 1.3.68 build 1.3.7105.26478) as a cross-grid oblique imaging survey, and the flight path length was 2771 m. The survey flight altitude was 61 m according to Agisoft Metashape Professional (version 1.6.5), and the ground sample distance (GSD) was 12 mm/px. The take-off and landing were operated manually, while the rest of the flight was controlled by the flight control unit (FCU). The survey was conducted as a single flight with a 12 min flight time. The resulting 354 images were processed with Agisoft Metashape Professional to form a georeferenced point cloud with a control point root mean square error (RMSE) of 12 mm. Georeferencing was done using five ground survey global navigation satellite system (GNSS) control points. The survey area was 3.45 hectares. Figure 1 shows the Tarot T960 survey flight plan and the resulting flight path. The planned path is shown in yellow, while the red path illustrates the realized flight path.

2.1.2. DJI Phantom 4 Pro+

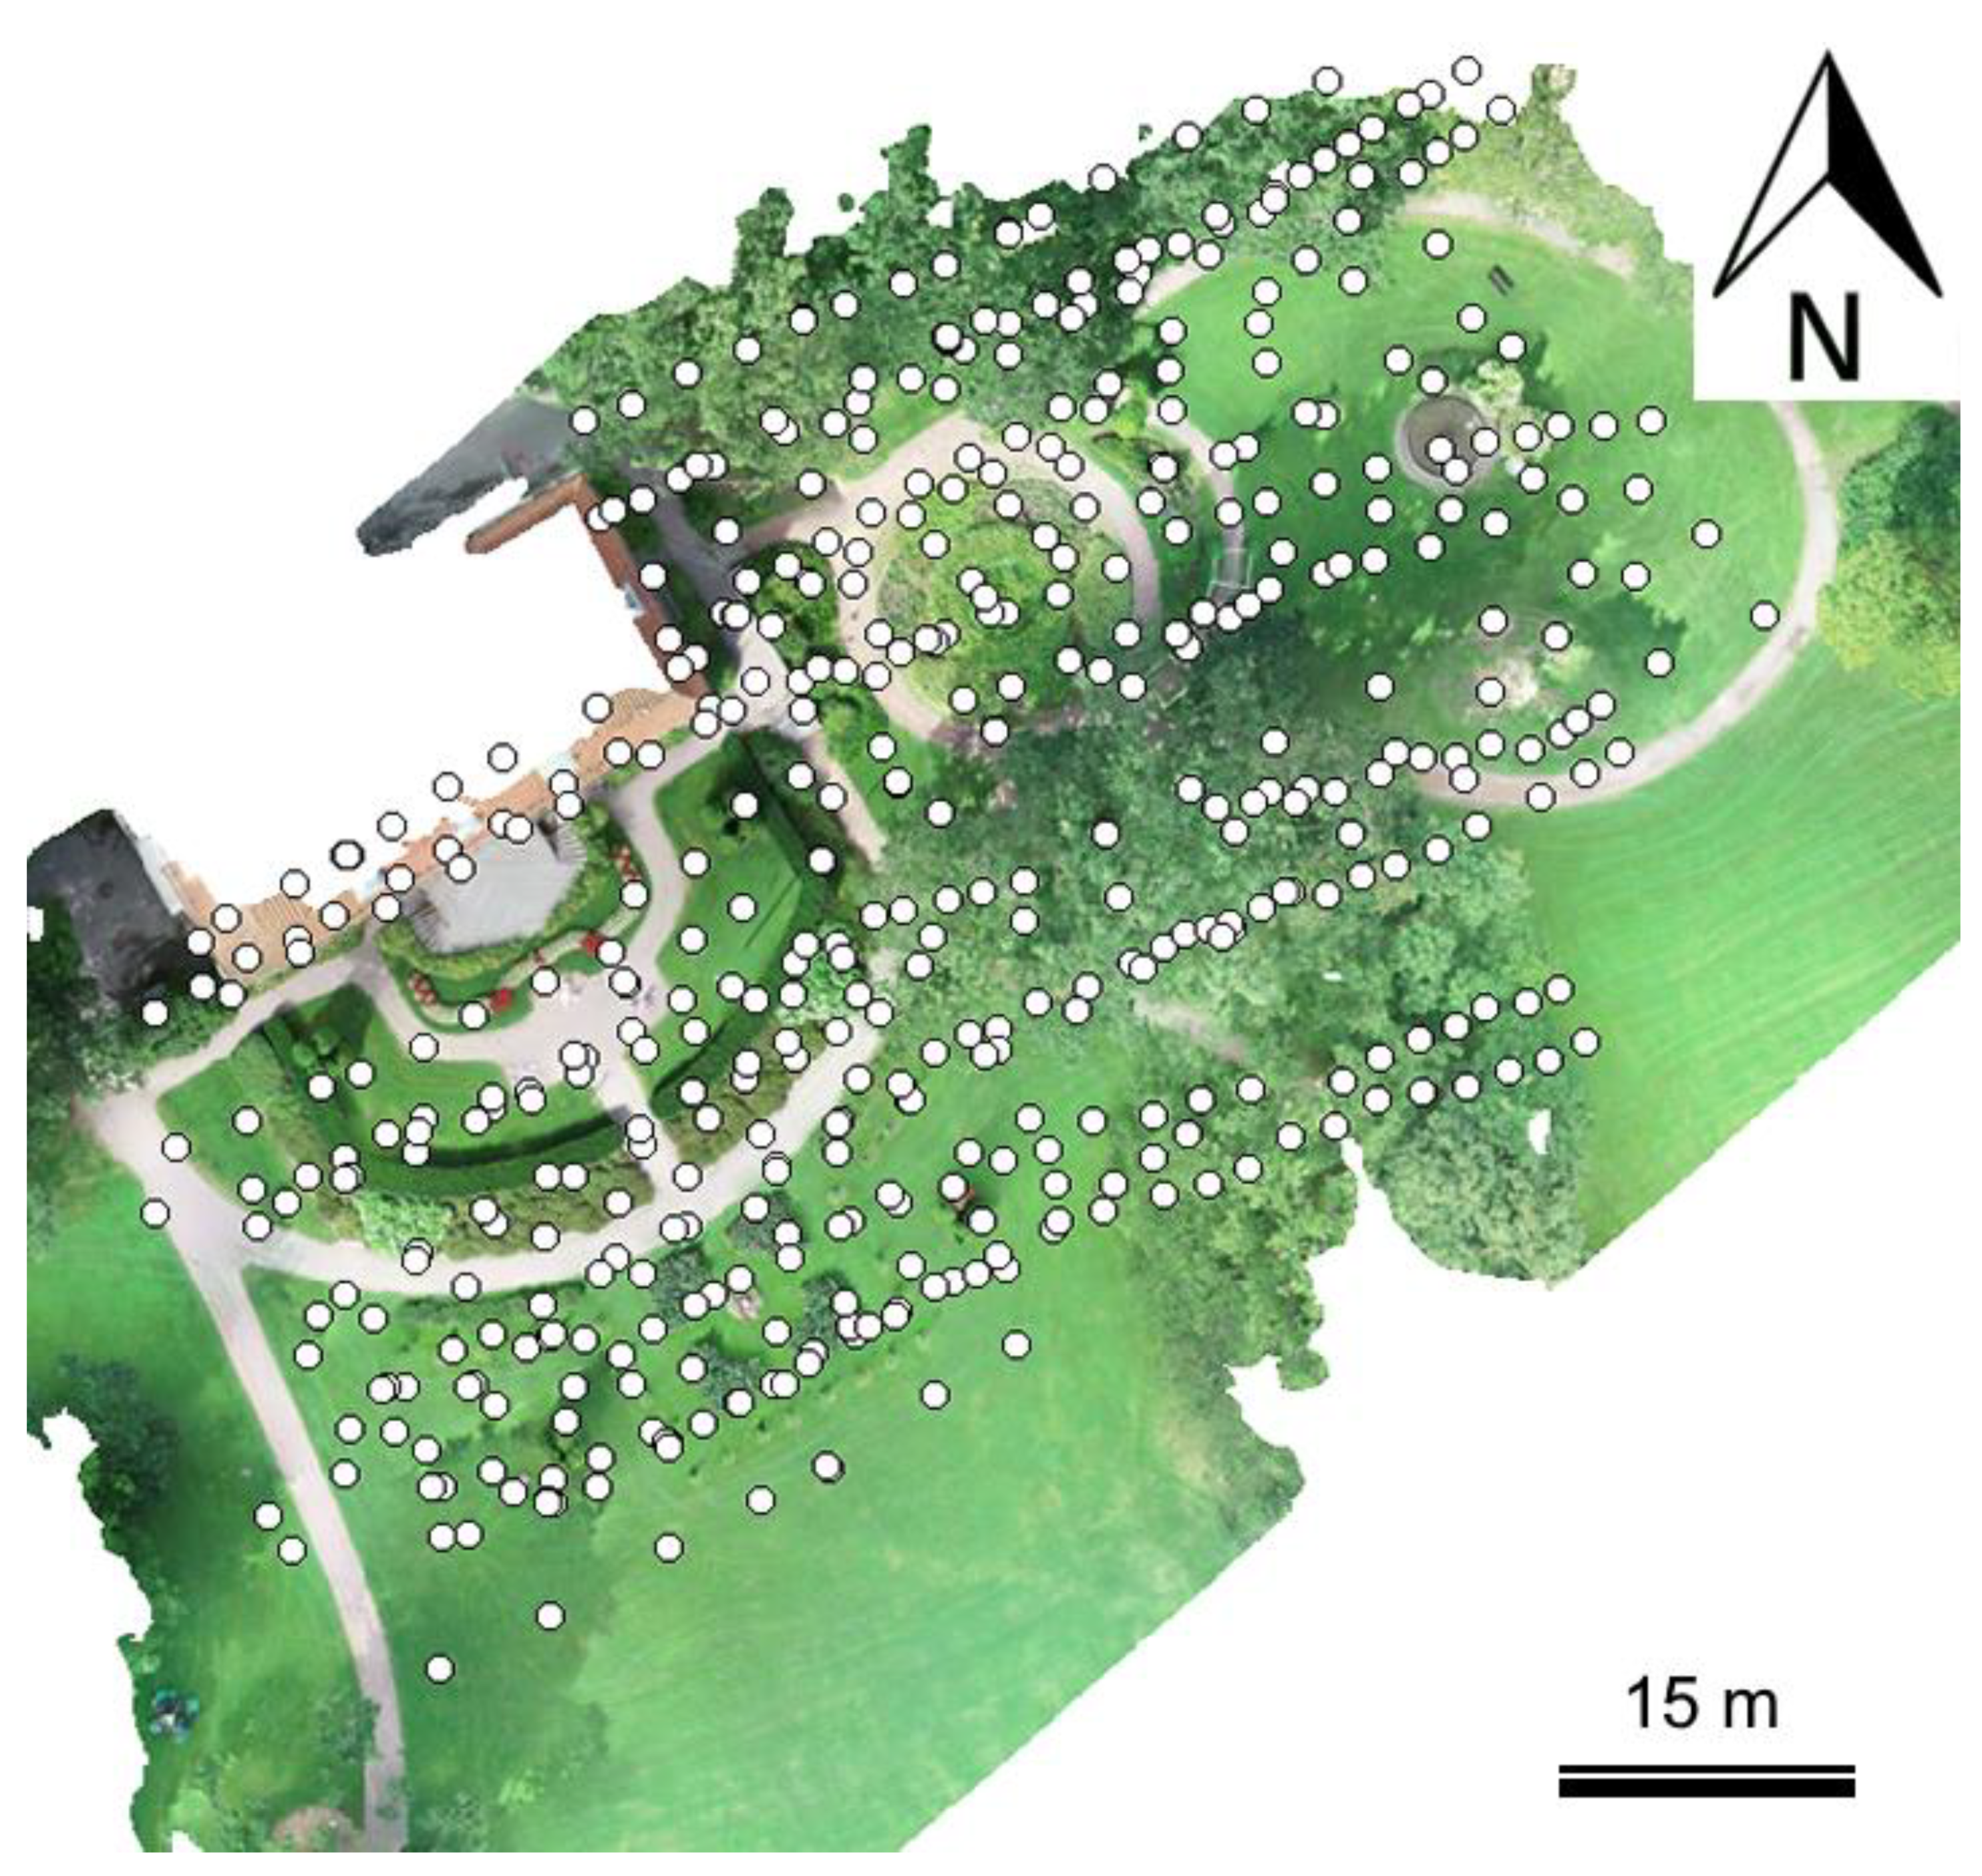
DJI Phantom 4 Pro+ is an entry-level professional quadcopter equipped with a 3-axis gimbal-stabilized 20-megapixel FC6310 camera. The camera is equipped with a fixed 8.8 mm lens, resulting in a FoV of 84° [54]. The drone system was flown in a standard configuration with a hover time of approximately 30 min. The flight was conducted in three manually operated parts with a total flight time of 61 min (75 min including take-offs, landings, and changing the battery). The first two flights were done using oblique imaging, while the third flight was done using nadir images. The survey flight altitude was 32 m according to Agisoft Metashape Professional version 1.6.5, and the GSD was 7.8 mm/px. The resulting 503 images were processed in Agisoft Metashape Professional to form a georeferenced point cloud with a control point RMSE of 18 mm. Georeferencing was done using five ground survey GNSS control points. The survey area was 0.94 hectares. Figure 2 shows the DJI Phantom 4 Pro+ orthophoto with camera stations illustrated in white. Data are combined from three manual survey flights.

2.1.3. Leica RTC360

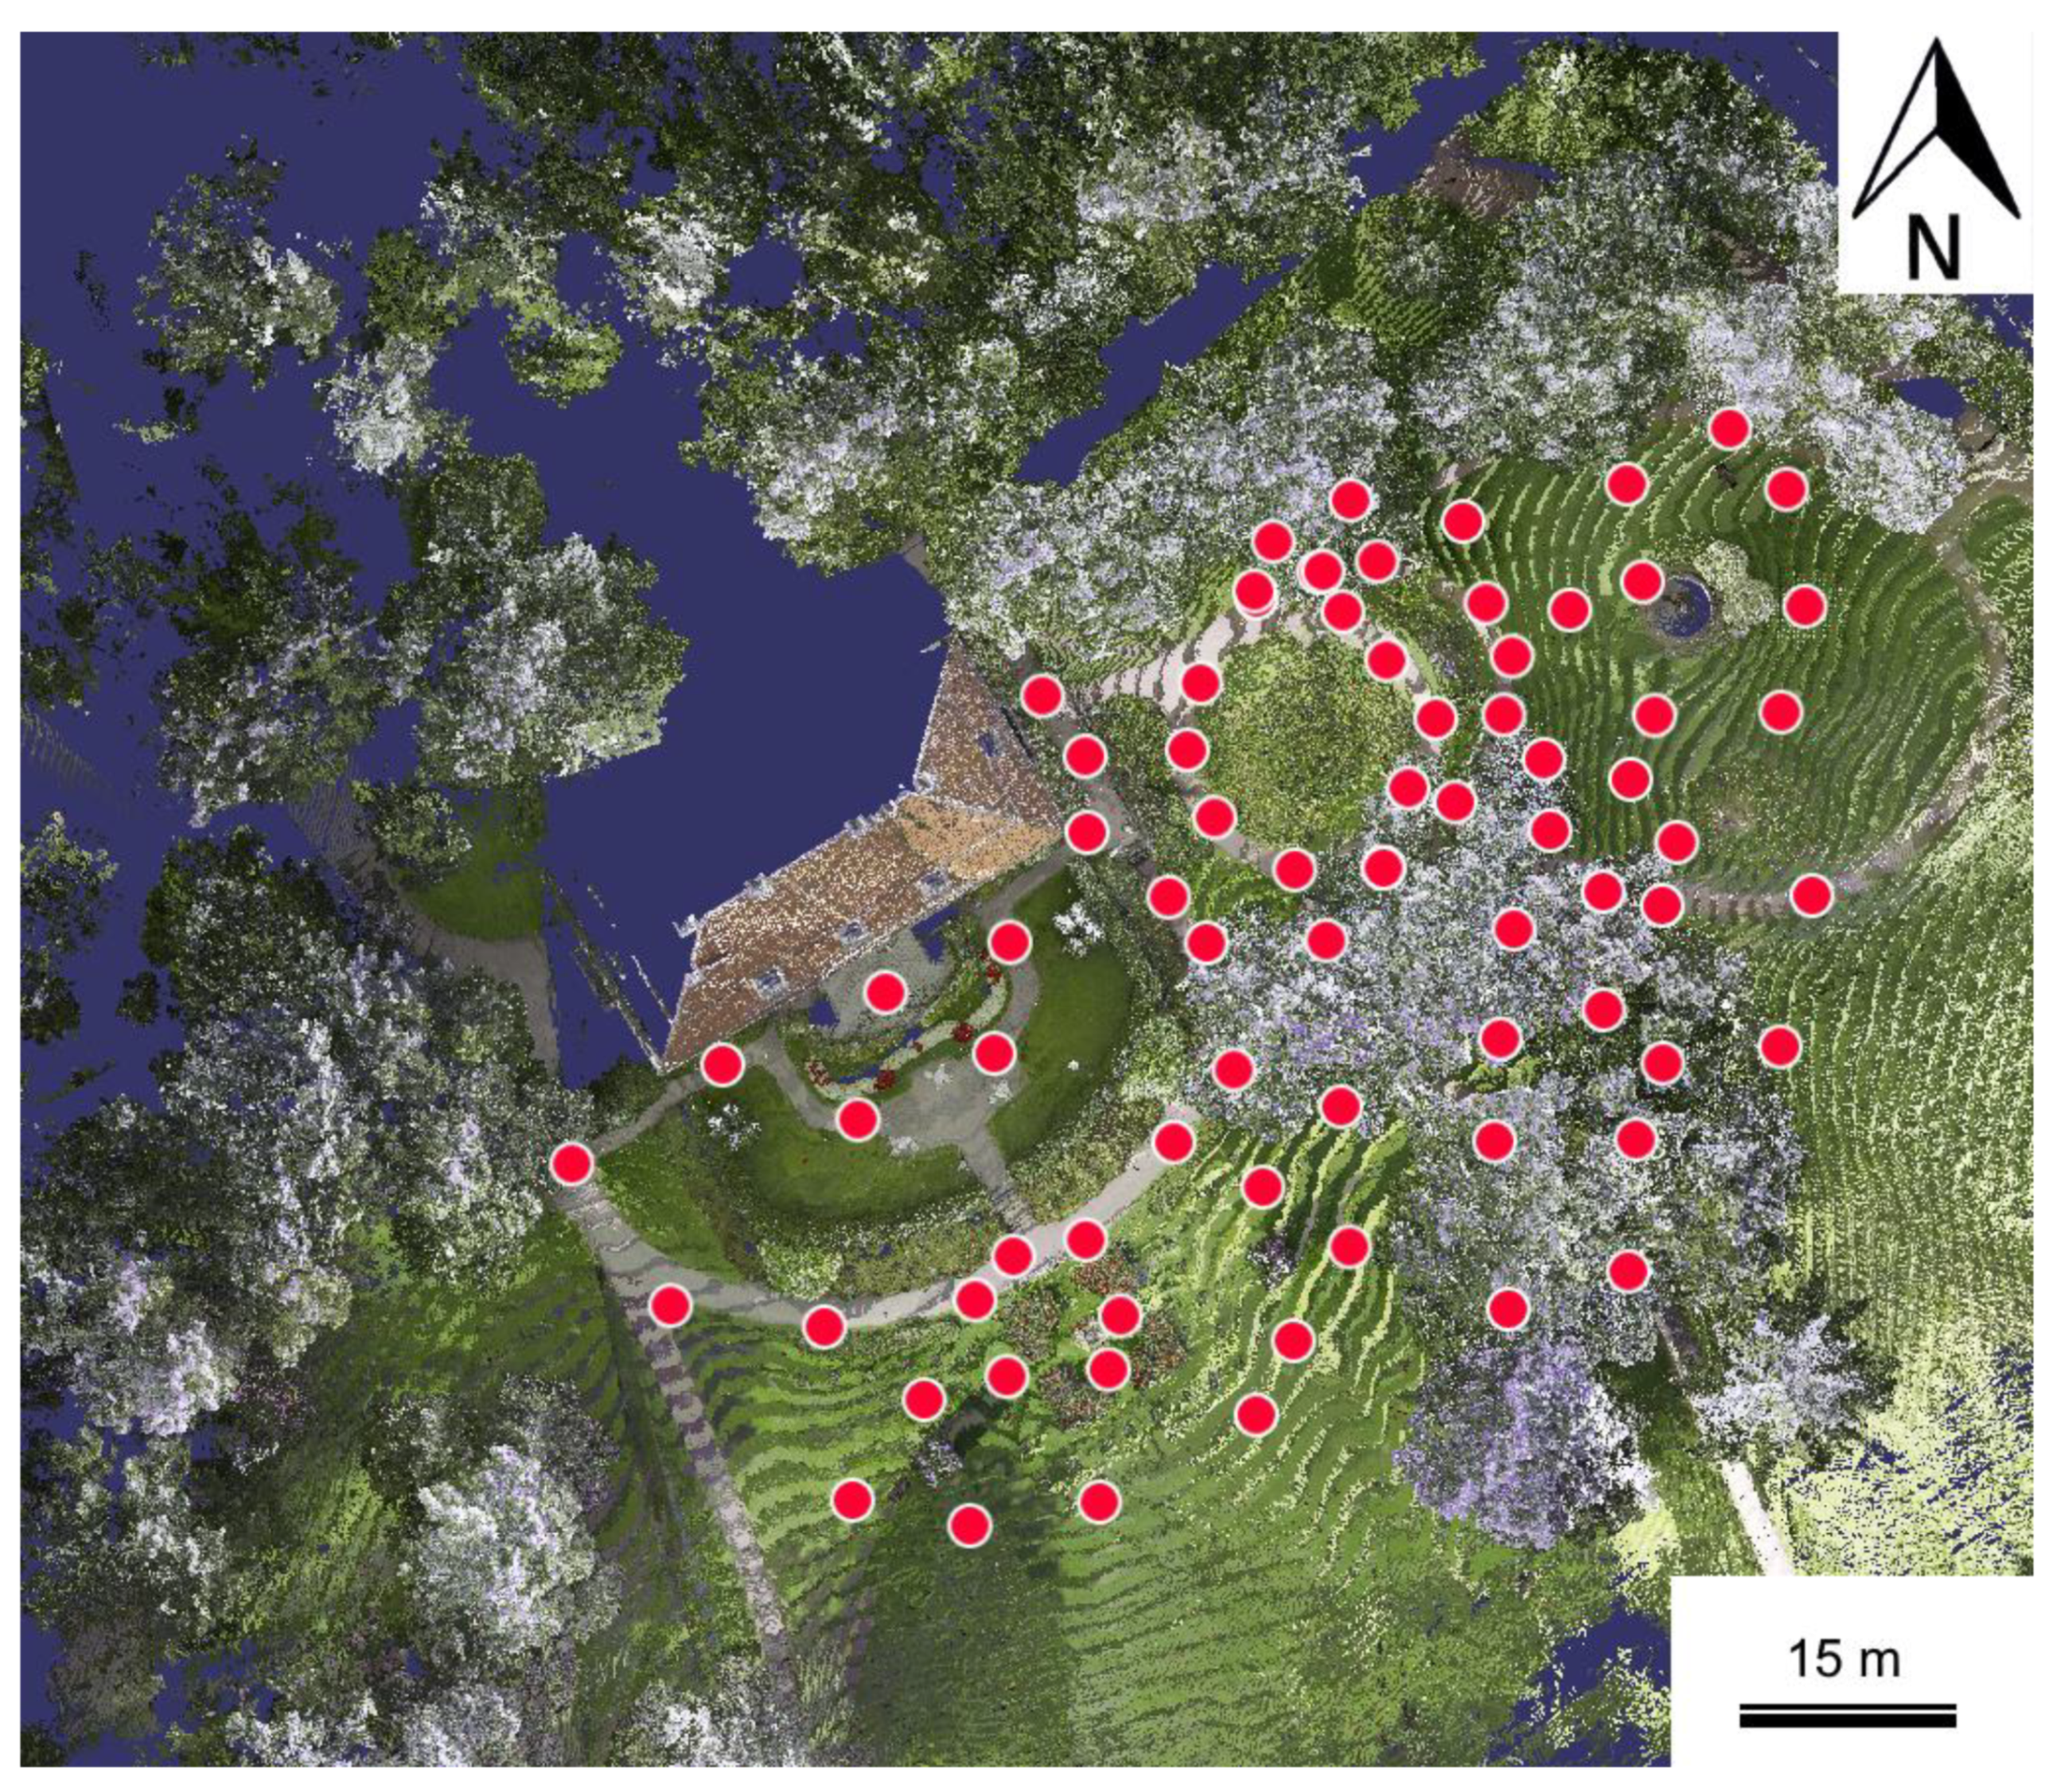
Leica RTC360 is a time-of-flight-based terrestrial laser scanner. It has a FoV of 360° × 300° and a range accuracy of 1.0 mm + 10 ppm. The maximum scanning range of the sensor is 130 m, and the data acquisition rate is 2,000,000 points/s. Additionally, the scanner has three body-mounted, high dynamic range (HDR) cameras with a resolution of 4000 × 3000 px for colorization of the point cloud and a visual inertial system for real-time registration purposes. The FoV of the camera system matches the one of the scanner [55]. The test site was measured with two RTC360 laser scanners simultaneously, totaling 77 scans during a 5 h period. A scanning resolution of 6 mm at a 10 m distance was used with the “double scan” option enabled to reduce the level of noise in the measurements. The scans were processed, registered, and georeferenced with Leica Cyclone Register 360 (version 2020.1.0 build R17509) software, resulting in an absolute mean error of 12 mm. Figure 3 shows the Leica RTC360 point cloud with the scanner stations visualized in red.

2.1.4. GeoSLAM ZEB Revo RT

GeoSLAM ZEB Revo RT is a hand-held mobile laser scanner that uses simultaneous localization and mapping (SLAM) for locating itself in the environment in real-time. The ZEB Revo RT uses a Hokuyo UTM-30LX laser sensor, which rotates continuously around the front pointing axis. The FoV of the sensor is 360° × 270° [56]. The relative accuracy of the scanner is 1–3 cm, the maximum range is 30 m, and the data acquisition rate is 43,200 points/s [57]. The colorization of the point cloud is executed with an integrated camera that has a FoV of 120° × 90° [58].
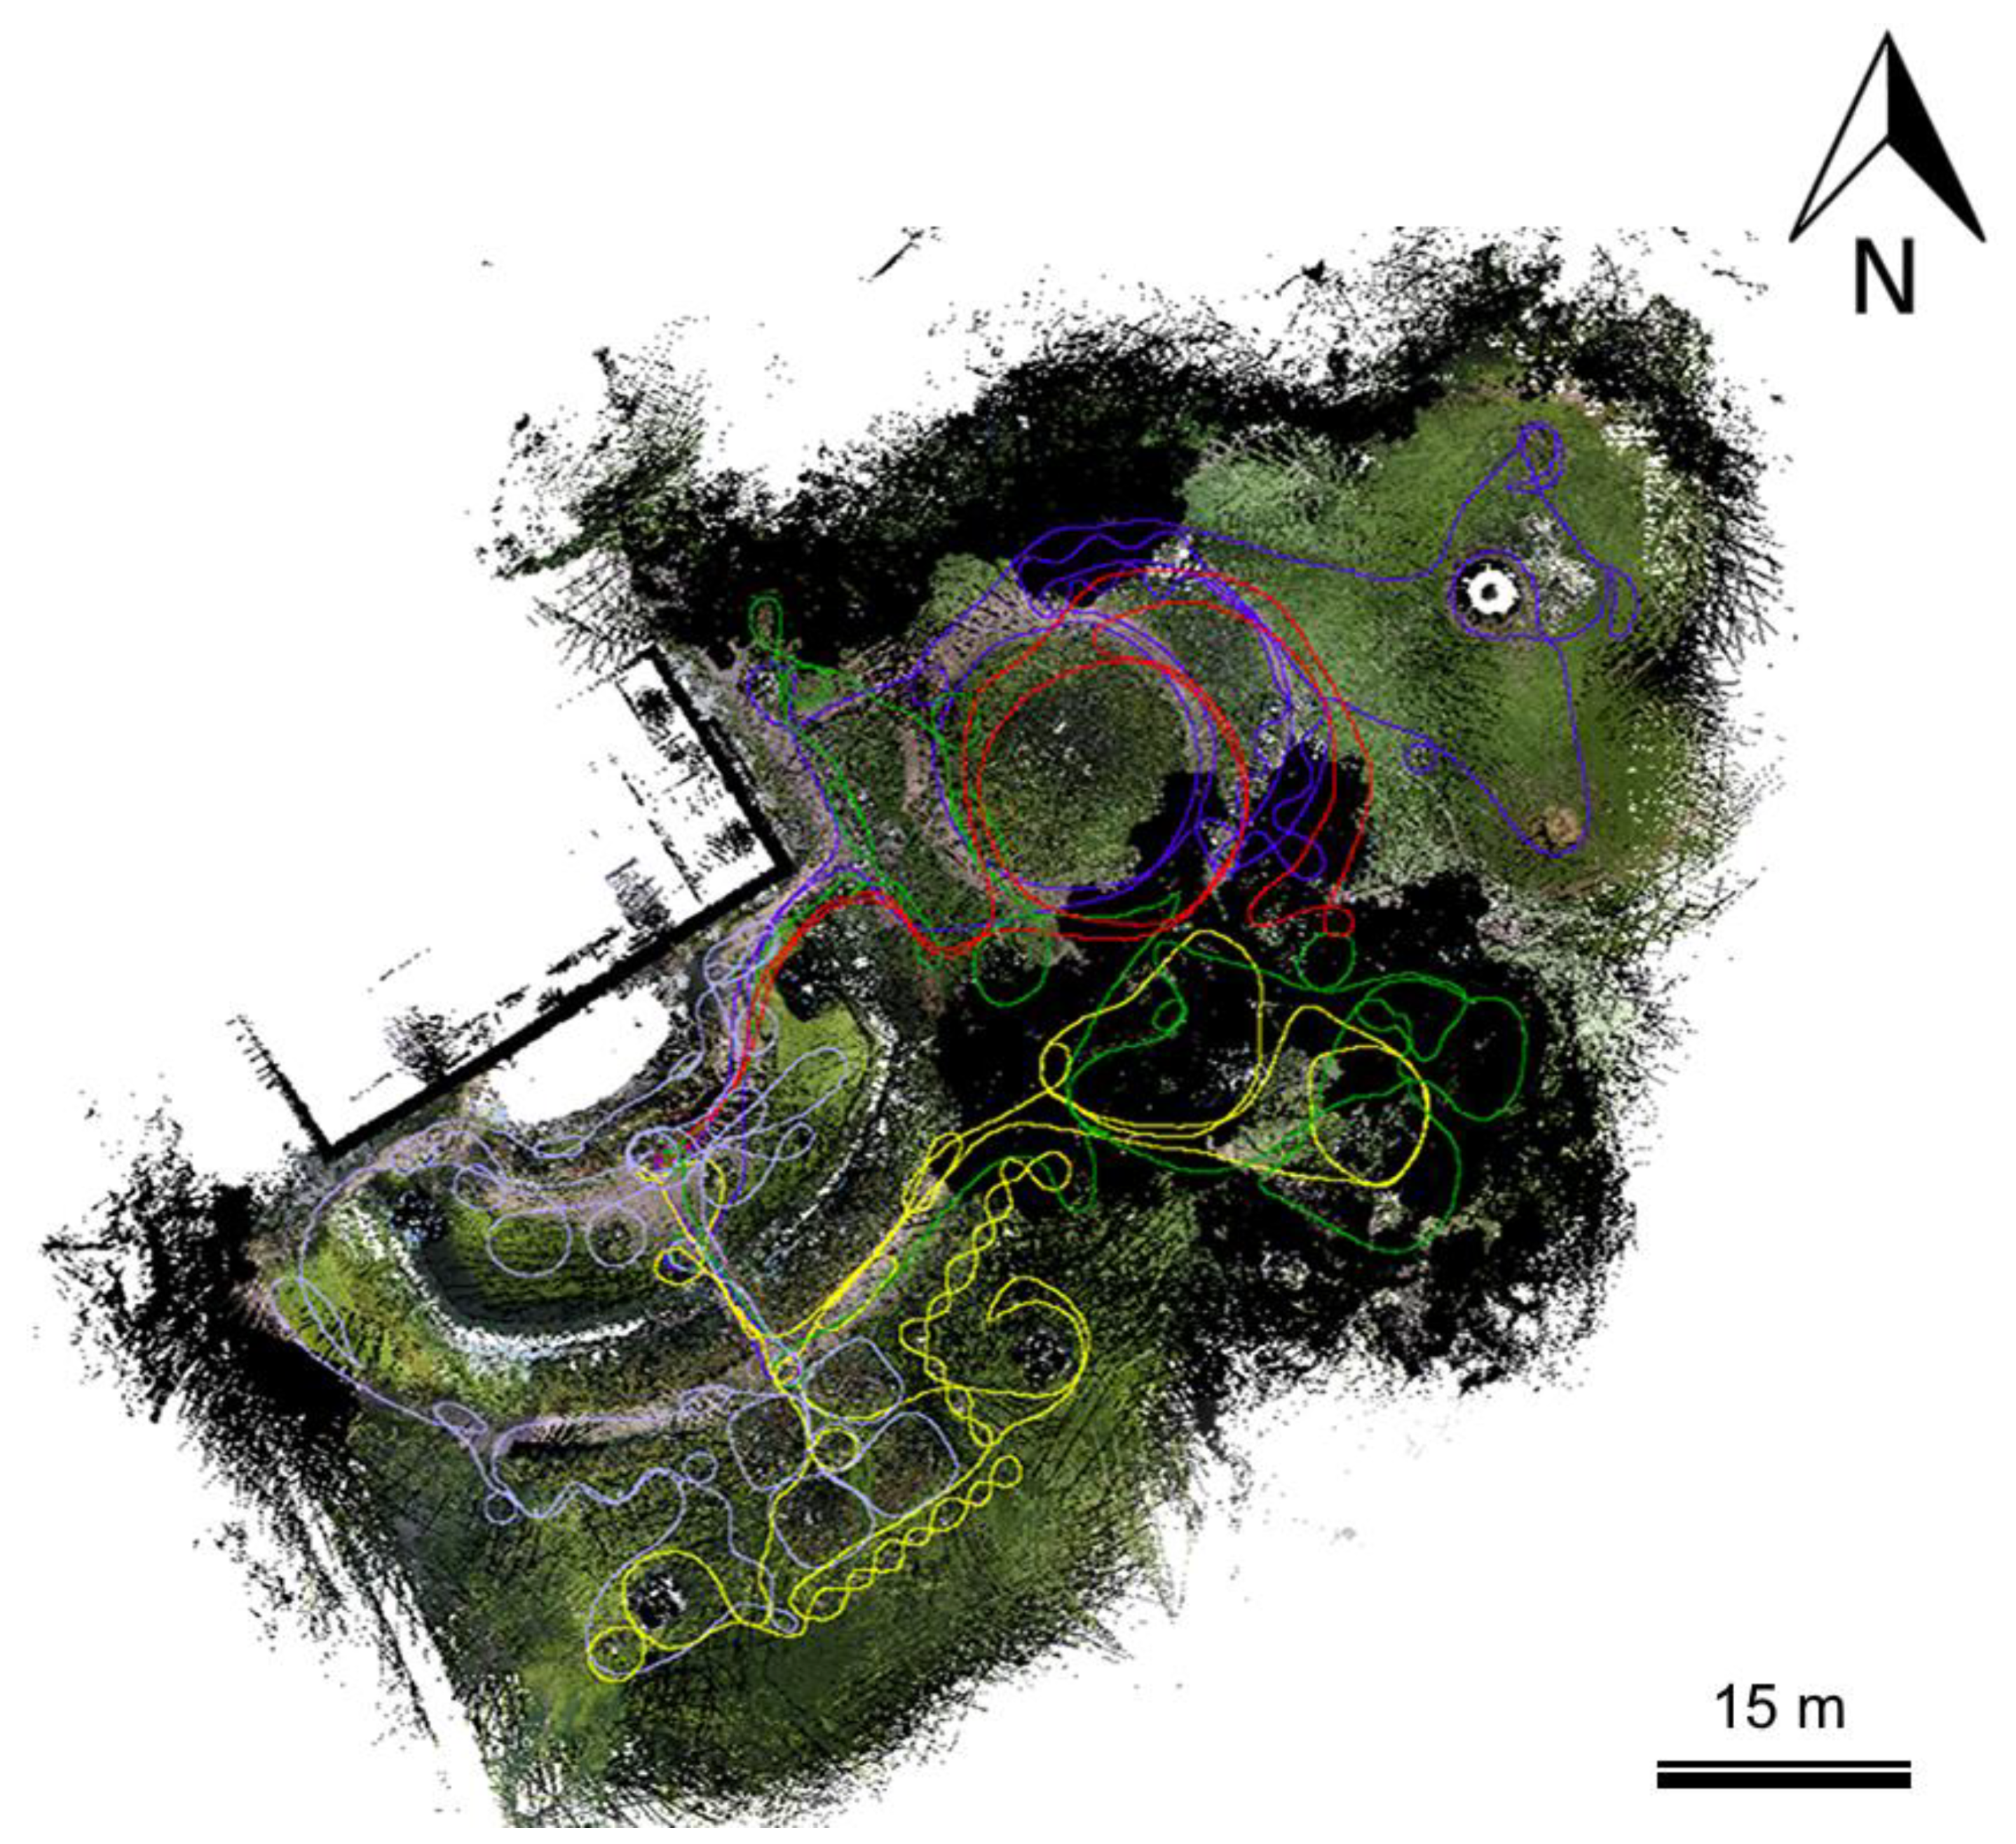
The study field was measured with five independent measurements in 30 min (Figure 4). These were processed in GeoSLAM Hub (version 6.1) with default settings and colorized with the video of an integrated camera. The separate measurements were merged first in GeoSLAM Hub without colors with the merge tool. After merging, the colorized point clouds were registered based on GeoSLAM Hub registration in Cloud Compare with an average error of 1.28 cm. Then, the point cloud was matched by each test site independently to the same coordinate system as the Tarot T960 point cloud with iterative closest point (ICP) calculation in Cloud Compare version 2.11.3 (Anoia) Stereo [Windows 64-bit].

2.2. Green Factor Elements

The inspected green factor elements were derived from the concept of the Finnish green factor [21], also applied later in international cooperation [59]. The green factor concept demonstrates the complexity of urban natural environments, as it includes a listing of green elements which contribute to and are essential for the quality of the UGI. We selected the suitable parts of the green element listing presented by the iWater project [60] (iWater project. Green Factor tool. Available online: https://www.integratedstormwater.eu/sites/www.integratedstormwater.eu/files/final_outputs/green_factor_tool_protected.xlsm, accessed on 1 September 2021). We started by dividing the green elements into visible and non-visible (or intangible) elements. Subsequently, we included the elements of which above-ground visibility makes it theoretically possible for them to be detected via point clouds. The elements that require both the information from above, as well as underground characteristics (e.g., soil) to be identified in a proper manner, were also excluded (i.e., some of the stormwater management solutions). Further, according to the observations during the field visits and photographs taken in August 2020, the elements that were not found in the study area were excluded from the element list. Thus, the visually detectable elements existing in the study area were included in the analysis. We also needed to do some additional adaption in the green element listing, as in the original green factor tool, preserved vegetation and soil, as well as planted/new vegetation are distinguished. As we did not assess the elements in plans but as already existing vegetation, we merged these two classes in the final analysis. The included green elements are described in Table 1, and the excluded elements in Appendix A.

2.3. Study Design

In this study, we assessed how well the elements central to green factor assessment were visible and detectable via 3D point cloud data. We combined the concept of the green factor and means of 3D measuring, namely, photogrammetry and laser scanning. In our approach, we examined monitoring the existing local green infrastructure with semi-automated digital means, focusing on the green elements that are not usually included in urban assessment with 3D point clouds, but which could benefit the green factor assessment.
Based on a qualitative inspection, the point clouds of different sensing methods were compared in terms of their ability to convey information on the green elements and their characteristics. In 3D visualization and modeling studies, along the geometric representativeness, appearance has long been recognized as an important variable for qualification of a 3D visualization [61,62,63]. Appearance is non-geometric information that is defined here as the visual comprehensiveness and informativeness that is bound to the interplay of the colors and surface of the object. Since it was possible that an element had an exact geometry but non-informative coloring, or vice versa, the geometry and appearance of the element were distinguished. Appearance is represented by the RGB color information captured from the surface of the objects in the scene by camera sensors.
In addition, we found it essential to evaluate the capability of the point cloud data to convey information both on the quality and details, as well as on the volume and/or amount of green elements. For this, we analyzed green elements by rating their (1) details (i.e., especially green elements’ characteristics and distinctiveness) and (2) completeness (i.e., especially green elements’ volume and/or amount). As with the geometry and appearance, the details and completeness were distinguished; elements such as flowers of a shrub may have been well-identifiable from the point cloud, but the size of the shrub was still difficult to determine, or vice versa.
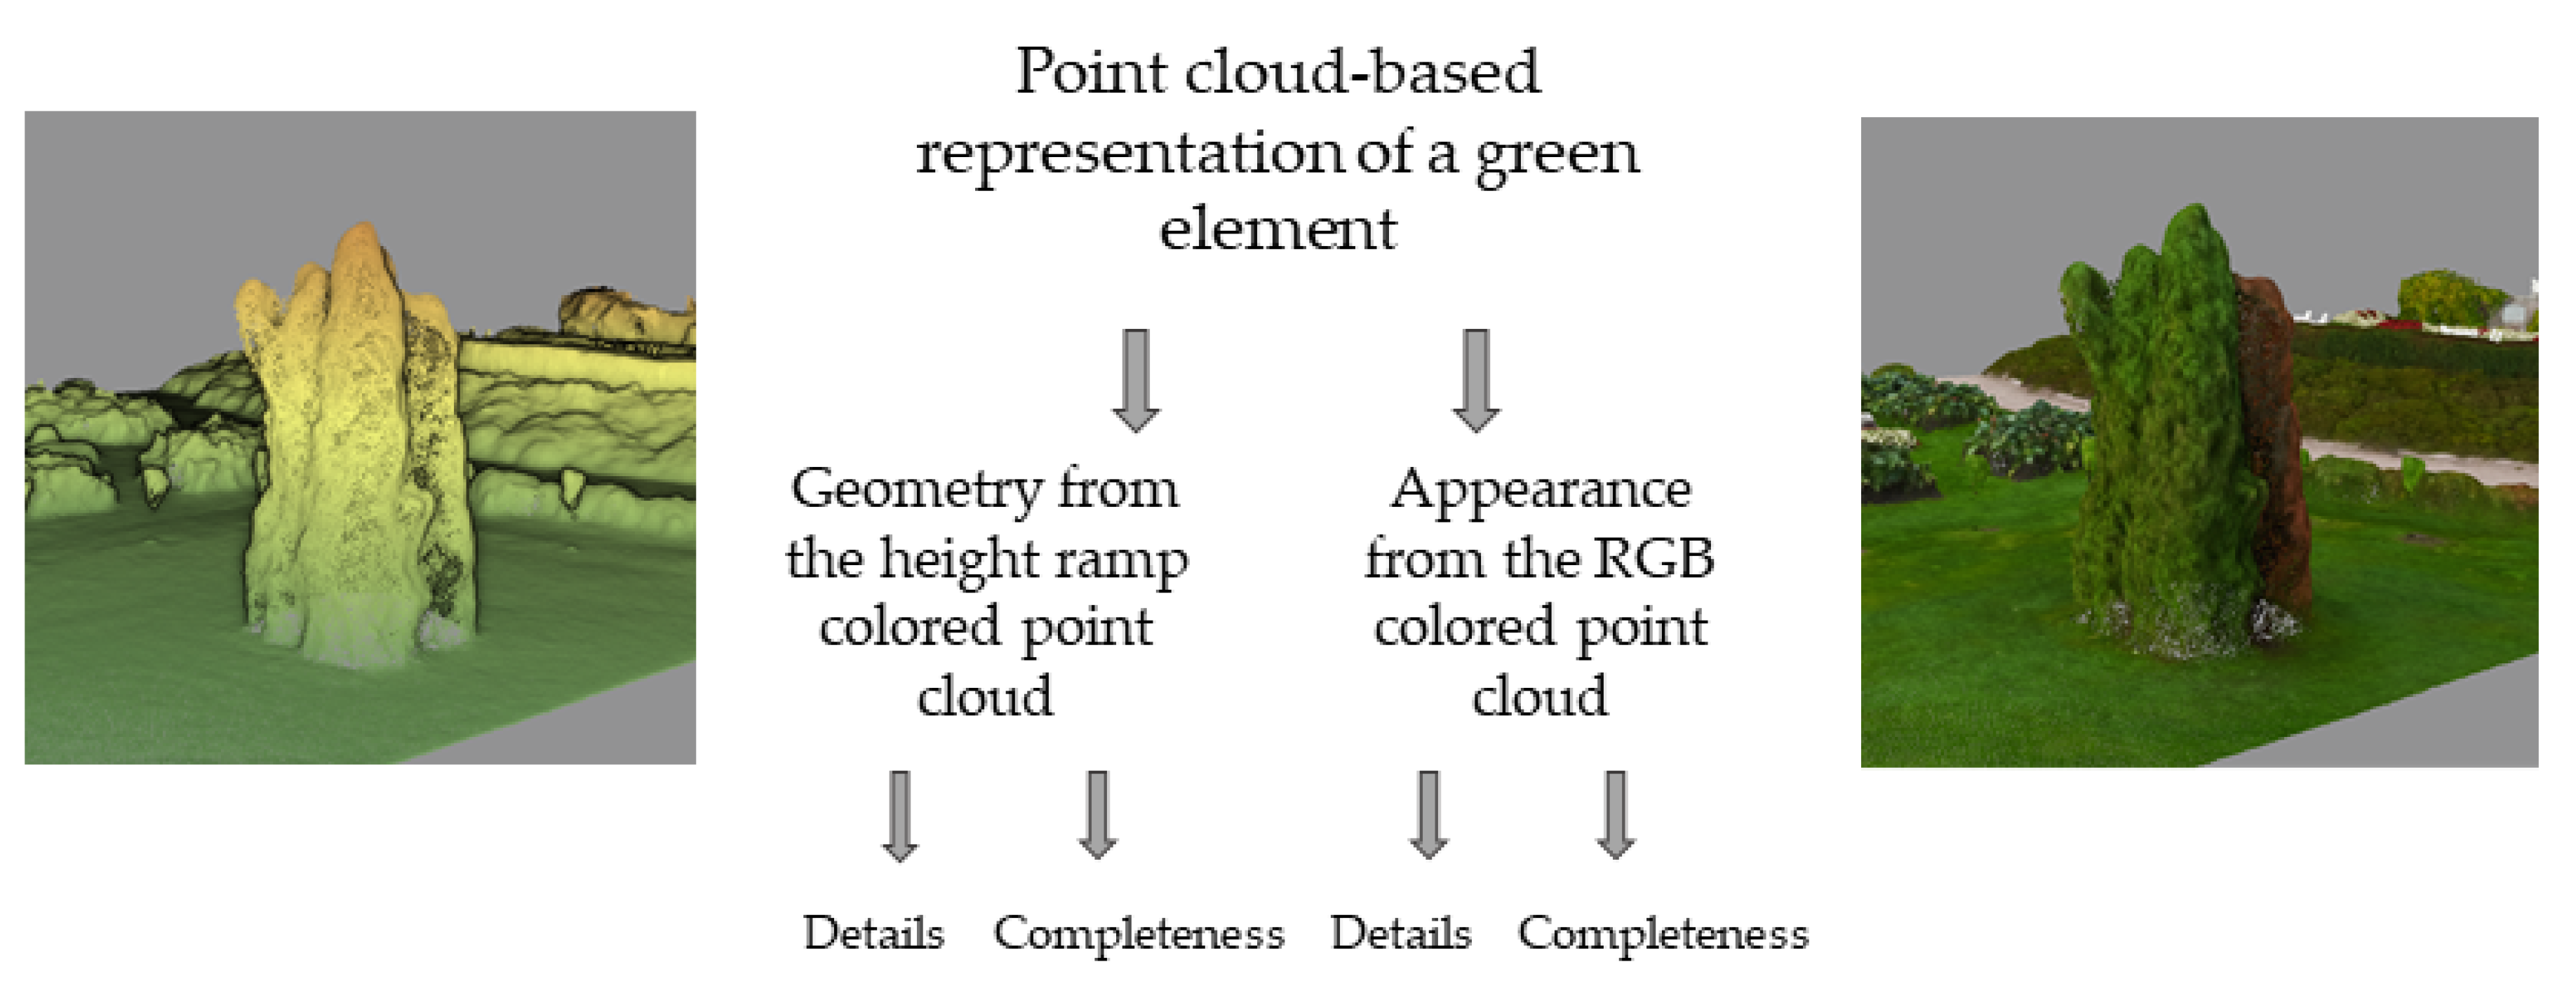
We analyzed the quality of geometry by rating each data set according to the height ramp colored point cloud. This way, the geometric differences between the point clouds could be highlighted. In turn, we analyzed the appearance by rating each data set according to their RGB colored point clouds (i.e., the RGB colors retrieved from the photographs generated with the respective measuring system). To conclude, we ended up with four categories (Figure 5) that scored according to a four-point (0–3) grading table (Table 2). By identifying these parameters, the study seeks to broaden the possibilities of 3D-based assessment of UGI.
The point clouds were visualized and compared with Cloud Compare [64] (CloudCompare. 3D point cloud and mesh processing software. 2021. Available online: http://www.cloudcompare.org/, accessed on 1 September 2021). To enhance perception of depth in assessing the point cloud data, the height ramp colored point cloud was visualized with an EDL (shader) filter, which is a real-time non-photorealistic shading filter technique that enhances very small features on blank clouds [65]. The point clouds were visualized with a fixed point size 2.

3. Results

The quality of the parameters, that is, details in the context of appearance and of geometry, and completeness in the context of appearance and geometry, were tested for all the included green elements with all the point cloud data sets. The results of the ratings are given in Table 3 for parameters on geometry and Table 4 for parameters on appearance. The results are further explained in the text.
The visual comparisons for the green elements are presented in Figure 6, Figure 7, Figure 8, Figure 9, Figure 10, Figure 11, Figure 12, Figure 13 and Figure 14. In all the figures, the point clouds are denoted as the following: (a) Tarot T960 for geometry, (b) DJI Phantom 4 Pro+ for geometry, (c) Leica RTC360 for geometry, (d) GeoSLAM ZEB Revo RT for geometry, (e) Tarot T960 for appearance, (f) DJI Phantom 4 Pro+ for appearance, (g) Leica RTC360 for appearance, and (h) GeoSLAM ZEB Revo RT for appearance.
Trees of different sizes were generally well-visible in all the point clouds (Figure 6, Figure 7 and Figure 8); however, the appearance of trees was of somewhat poor quality in the RGB colored point cloud generated by GeoSLAM ZEB Revo RT. For the very small tree, the point cloud generated with Tarot T960 could not provide a complete form (as the trunk was missing) which eventually also affected the appearance.
The location of the investigated green elements affected the results; the elements located under the tree canopy were generally less visible in the data than elements located in the open area, as shown in Figure 8, Figure 10 and Figure 11.
Apart from the location in the study field (under the canopy vs. open area), the form of the element affected the results; sand surfaces and lawns were given lower scores than elements with a more geometric form. For those elements, laser scanning-based solutions could more likely provide a well-presented geometry; however, the results show the strengths in appearance of the UAV-based solutions in conveying information on distinct visual details in elements, such as perennials (Figure 12 and Figure 13).
As shown for blooming shrubs (Figure 14), the laser scanning-based data were more likely to cover the geometry of the element as a whole. However, for the appearance, the RGB visualization of the colors was not as informative with GeoSLAM ZEB Revo RT (Figure 14d,h). RGB visualization would be essential in defining the blooming element of the shrub.

4. Discussion

By implementing a case test study in Espoo, Finland, our study aim was to support the monitoring of existing UGI on a local scale. We tested the suitability of distinct 3D point cloud data by exploring the detectability of visible green elements. In the following, we conclude the most interesting results with all the tested green elements.
In the case of large trees, the appearance of the top canopy was somewhat lower in quality in the laser scanning-derived point cloud data due to the perspective of the terrestrial sensors (Figure 6). The small trees were captured almost equally with all the tested sensing methods; however, the appearance rating was slightly lower in the laser scanning -derived point cloud data (Figure 7). In the case of very small trees, the higher flight altitude reduced Tarot T960’s capacity to capture minor geometries of the elements, leaving the trunks of the trees missing (Figure 8). The large shrub was located under a large tree canopy in the test area, which negatively affected both the appearance and geometry of the element in the UAV-based point cloud data sets. However, the appearance of the large shrub was also generally low in the laser scanning-derived point cloud data sets, while its geometry was generally good in them (Figure 9). The results with natural vegetation (Figure 10) and dead wood (Figure 11) were similar to the large shrub due to a similar location under a large tree canopy, even if the elements itself were of different size and geometry.
The tested pavements, including grass stones and sand surfaces (Figure 12), were not detectable in terms of geometry in any of the point cloud data, and thus were rated with the lowest possible scores. However, from the appearance point of view and due to the RGB-coloring, these elements were varyingly detectable. The geometry of the lawn showed slightly better results in all the point cloud data sets (Figure 12). Geometry of the perennials, perennial wines (Figure 12), and plants with impressive blooming (Figure 13) resulted in moderate to good ratings in the photogrammetrically derived point clouds, and good ratings in the laser scanning-derived point clouds. For these elements, the appearance was somewhat better with the photogrammetrically derived point clouds, except for the plants with impressive blooming, for which Leica RTC360 generated equally good appearance ratings. The UAV-based point clouds had issues with the flowering shrub’s geometry (Figure 14). Further, the flowering shrub was the only green element which showed the best appearance with a laser scanning-derived point cloud data set; however, the differences in the results were only small.

4.1. Suitability of Point Cloud-Based Information for the Purposes of Monitoring Local Green Elements

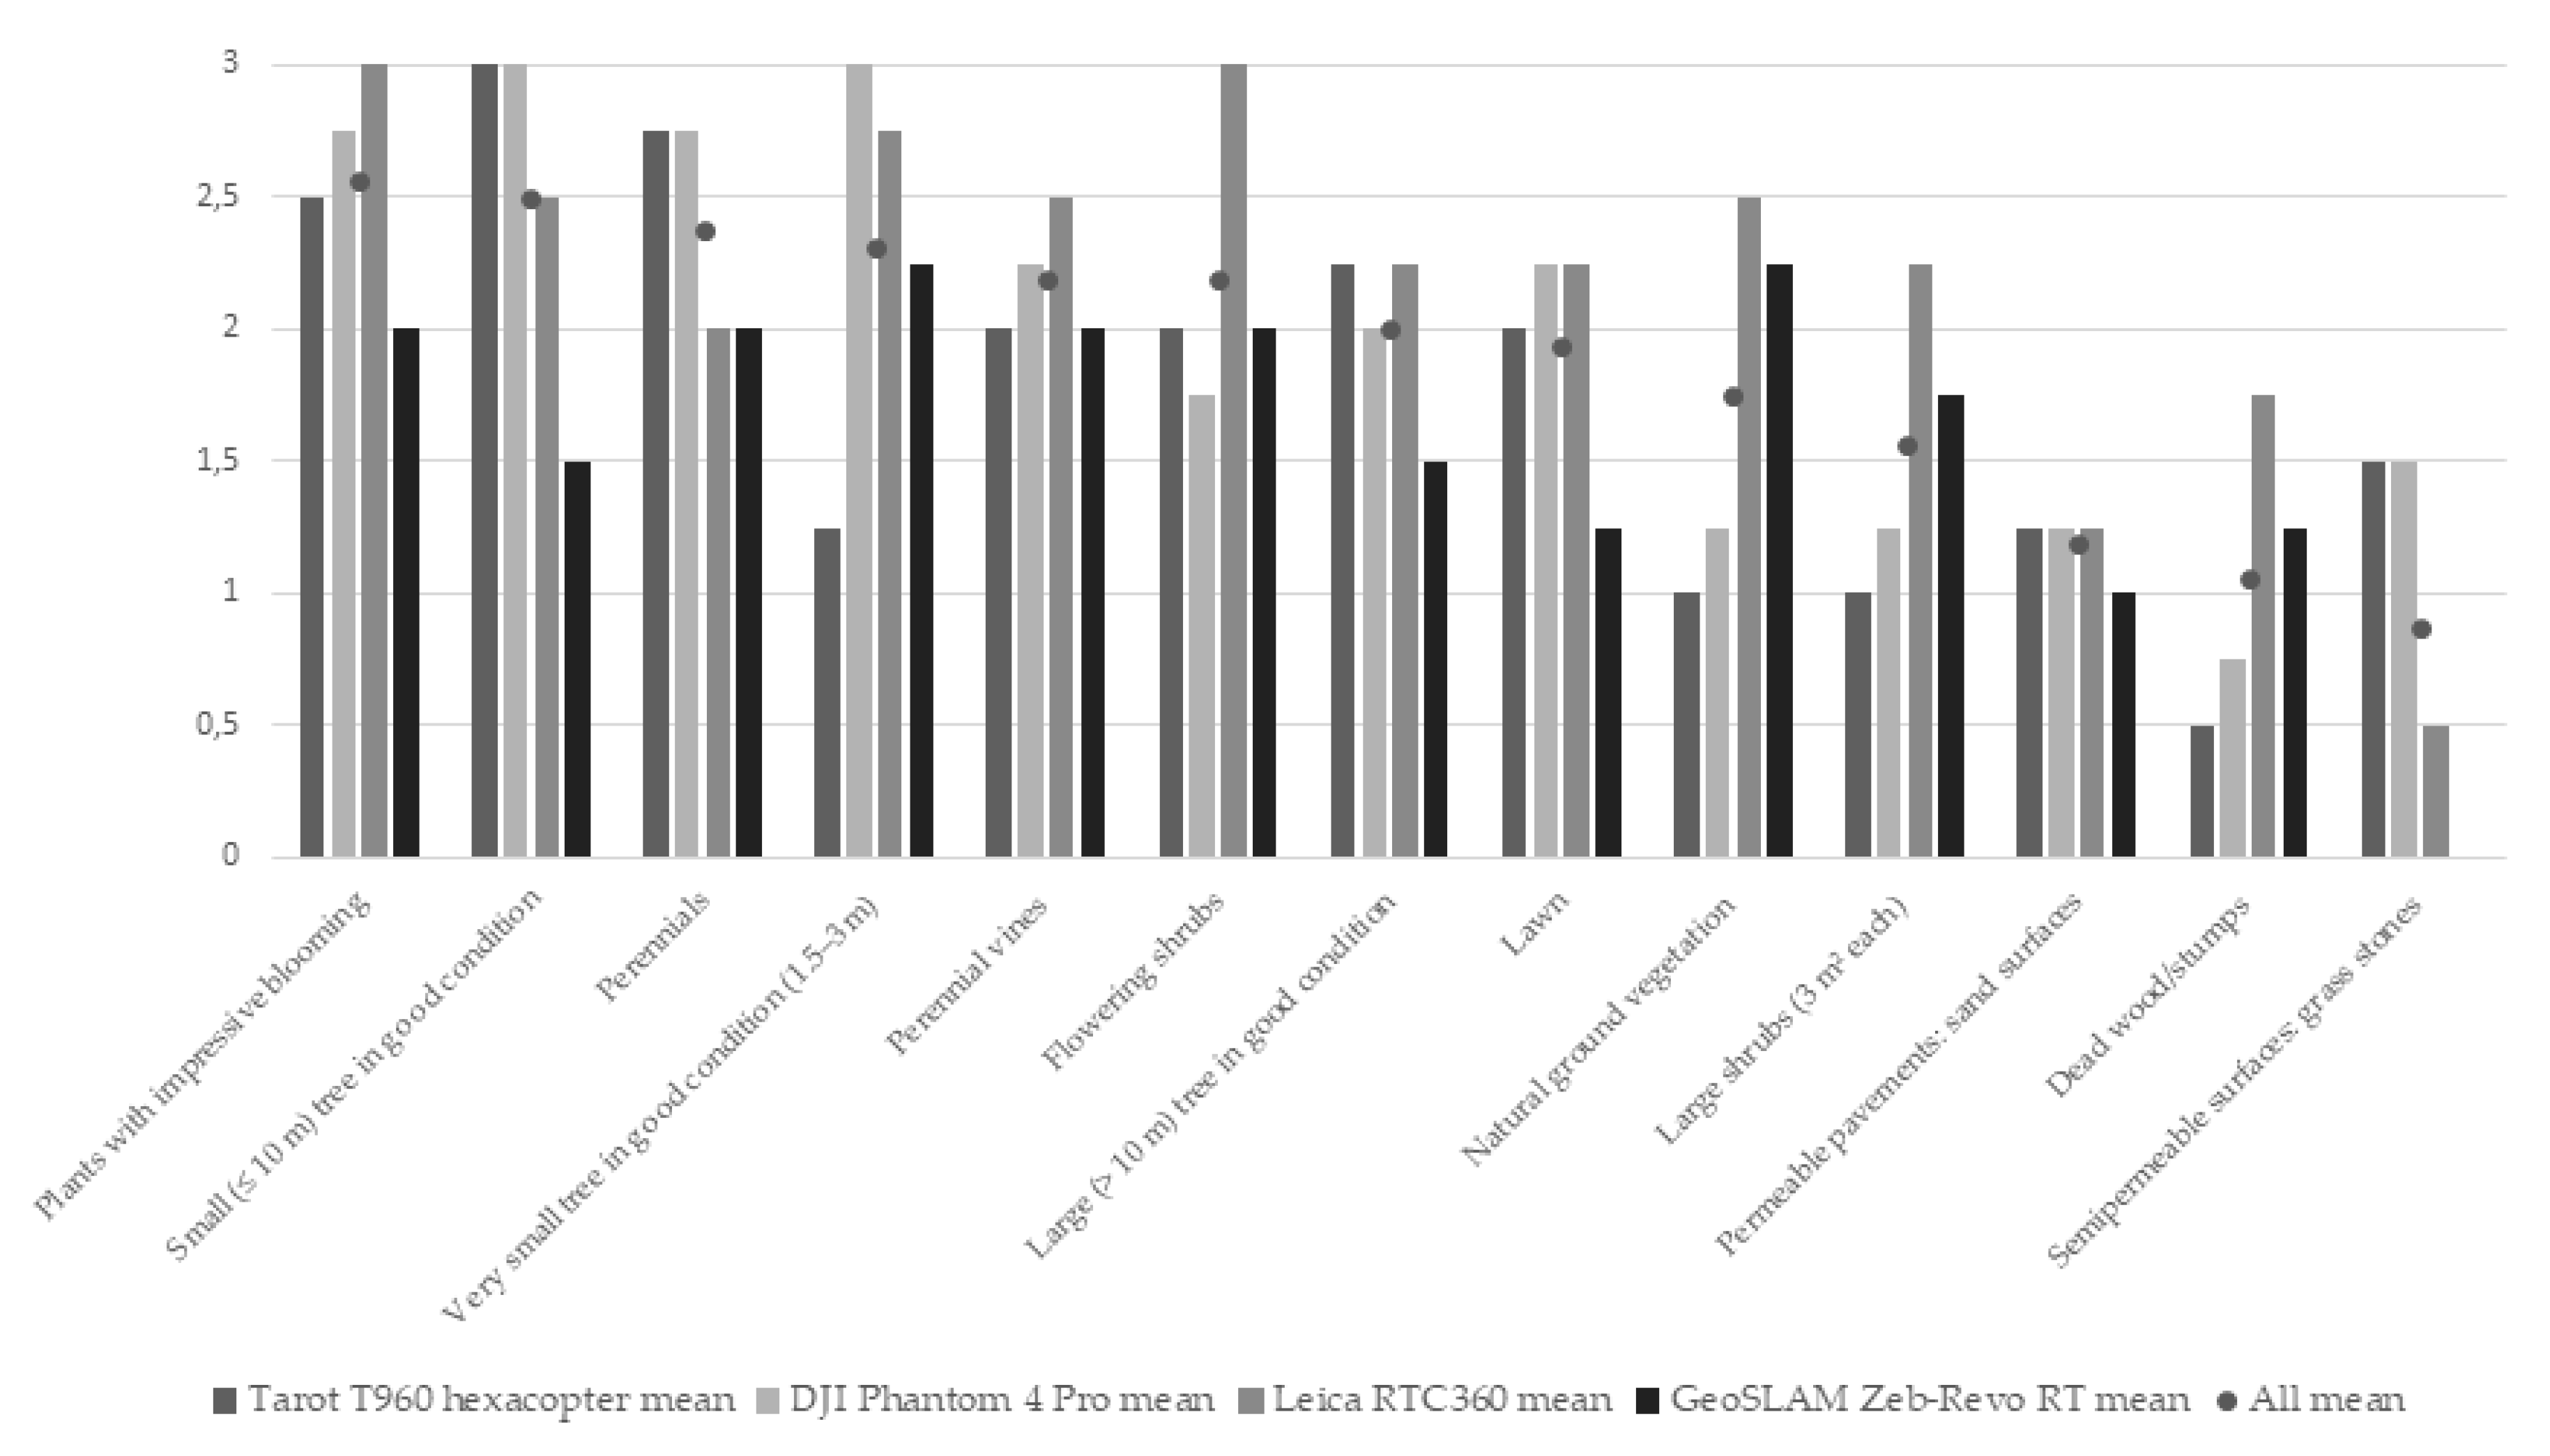
The results show that the point clouds originating from different systems have differing abilities in conveying information on green elements. When looking at the mean results, there are clear differences in how well the point clouds were able to convey information. In some cases, there were quite remarkable differences even within single elements as shown in the results with natural ground vegetations, semipermeable surfaces, and perennials (Figure 15).
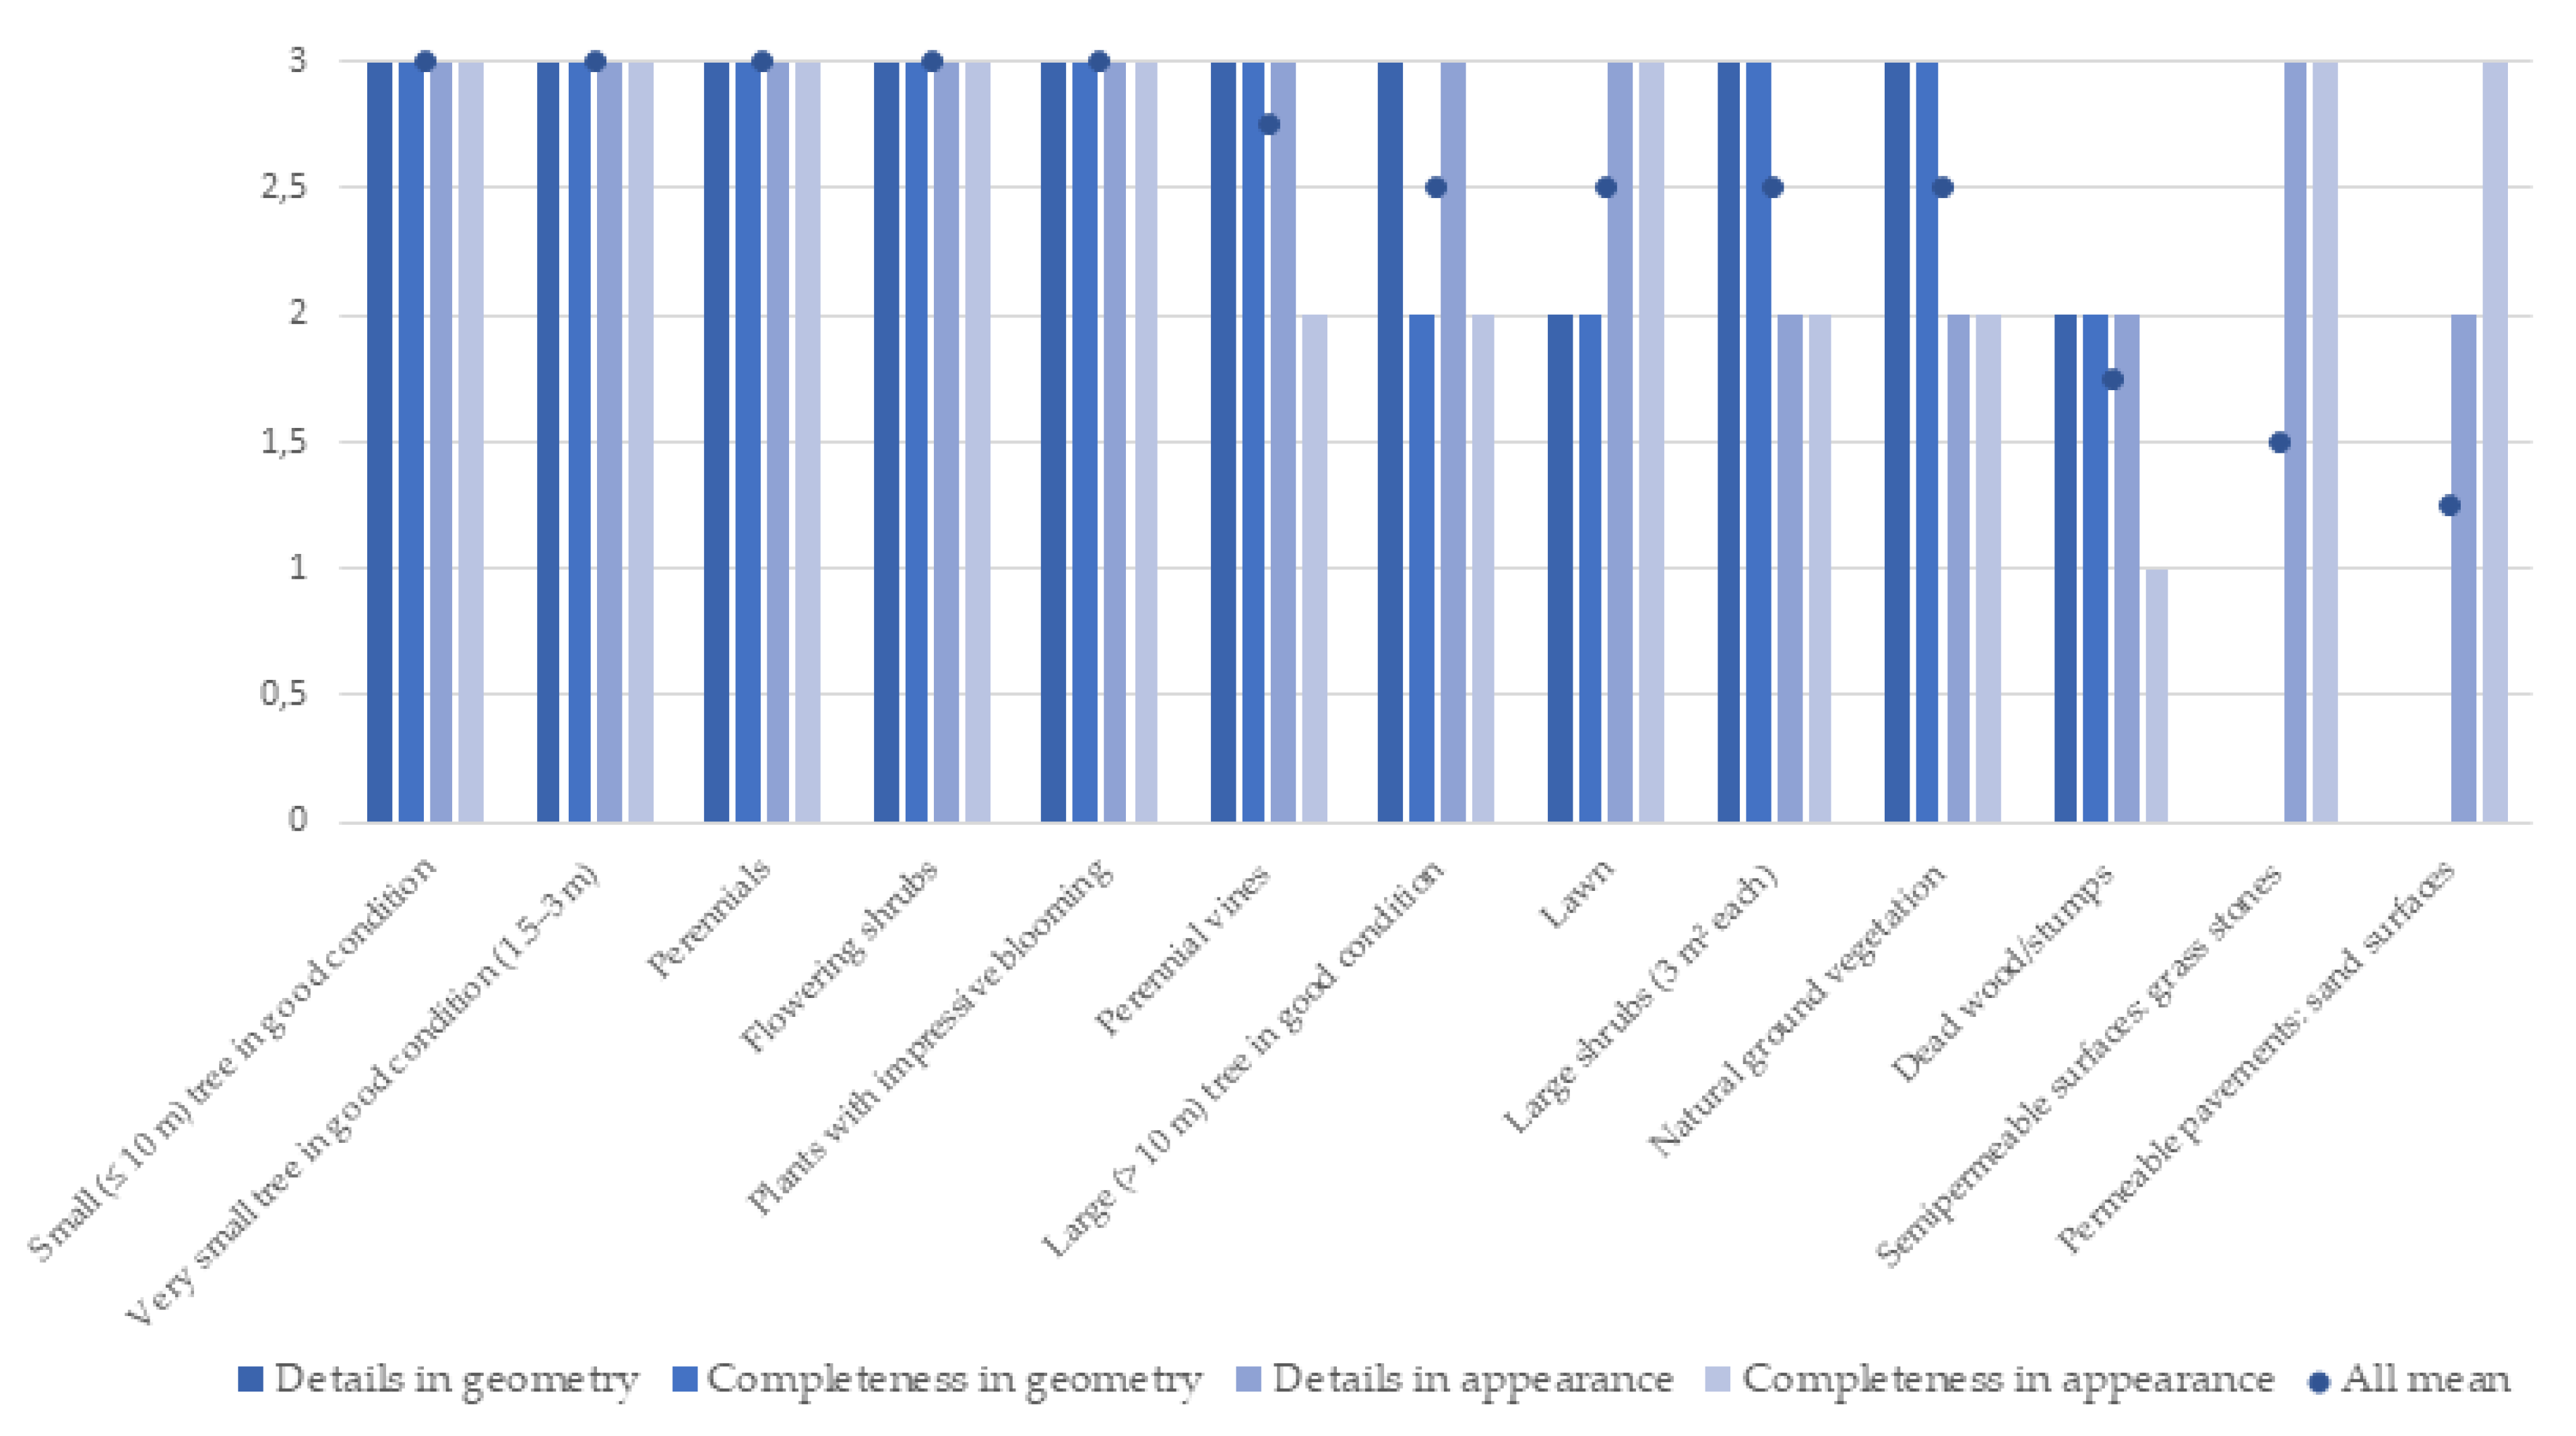
To highlight the best observed ability of the point clouds to convey information on green elements, the top results received with any of the point cloud data sets are shown in Figure 16. For this, it was enough that the green element quality parameter received the top score of 3 with at least one of the point cloud data sets. We can conclude that the differences between the green elements were relatively low when looking at the best performing results from any sensor system. Five of the thirteen green elements could be assessed with the point clouds as they were evaluated to have a good ability to convey information on them (full scores). Five elements received less than a full score, but at least 2–5 points in the mean, indicating that point clouds have a moderate ability to convey information on them. Surface-like elements that have similar textures to one other, that is, grass stones and sand surfaces, as well as dead wood located within the natural ground vegetation and under the canopy, were given less than 2 points in the mean, meaning that point clouds have only a low ability to convey information on them.

4.2. Differences of Data Acquisition Methods

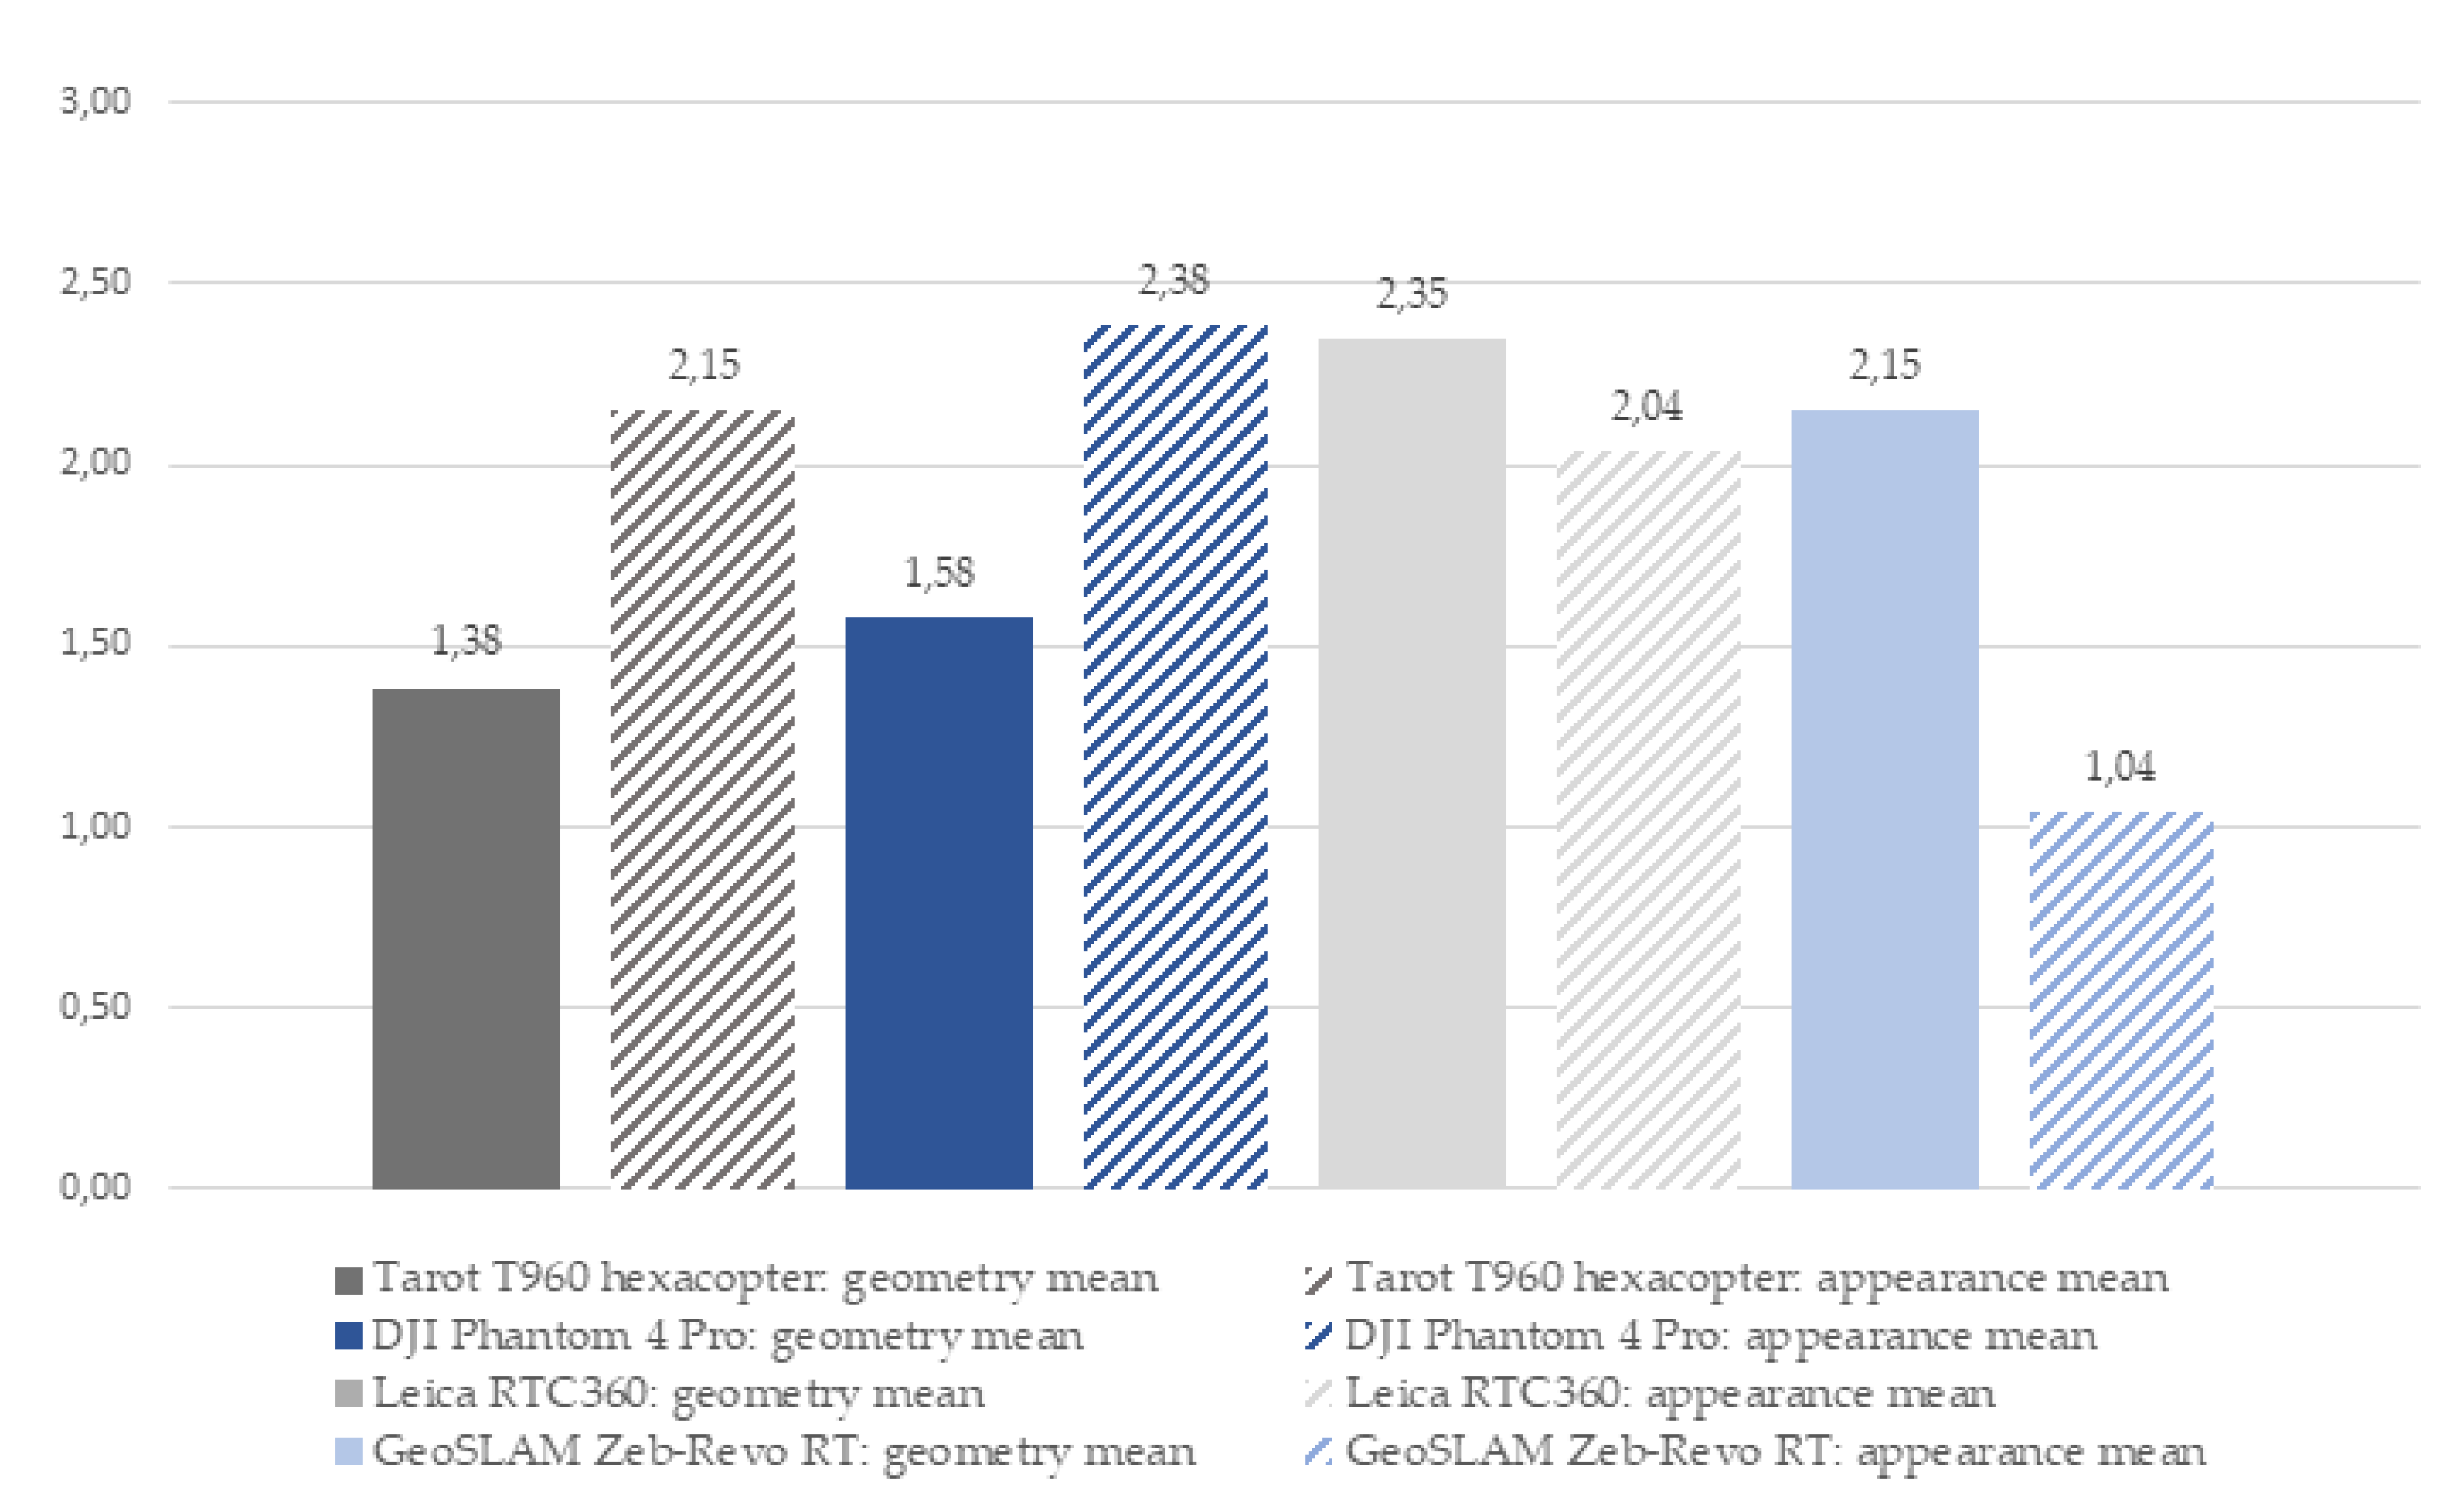
The results with point cloud data sets were compared in terms of conveying information on geometry and appearance (Figure 17). According to the results, differences are not only found between UAV photogrammetry and laser scanning-based solutions, but also between UAV photogrammetry methods, as shown in the results with very small trees, and between laser scanning methods, as shown in the results with flowering shrubs and lawns. For geometry, Leica RTC360 generated the best mean results, and for appearance, DJI Phantom 4 Pro+ generated the best mean results. The differences in the latter are explained by the generally low performance of GeoSLAM ZEB Revo RT in qualities considering appearance.
DJI Phantom 4 Pro+ generated more detailed results when compared to Tarot T960. This difference in accuracy is explained by the flight altitude, as the GSD of DJI Phantom 4 Pro+ was 7.8 mm/px, and of Tarot T960 12 mm/px. Similarly, Leica RTC360 generally resulted in more detailed and comprehensive point clouds than GeoSLAM ZEB Revo RT. This was expected, as terrestrial laser scanning has been shown to enable high-quality point clouds with high accuracy (0.1–5 mm) and precision (0.6–4 mm), and a high level of detail [66]. Prior studies show that the accuracy of SLAM techniques are at the 1–3 cm level [67,68,69,70]. The strengths of UAV photogrammetry-derived point clouds are related to appearance parameters, while lower flight altitude seems to generally generate better results when many of the targets are small-scale elements, like many of the elements in the green factor. The strengths of laser scanning generated point clouds are related to the quality of geometry [66]. In previous studies, GeoSLAM ZEB Revo RT has been noted to have lower quality in RGB-colored point clouds [71], which is seen in the results as weaknesses in terms of appearance. To conclude, accuracy of measuring local and small-scale UGI can be improved when utilizing terrestrial laser scanners and UAV data from lower flight altitudes.

4.3. Prospects for the Point Cloud-Based Evaluation of the Local Existing Green Factor

Finally, we applied the test results to estimate the capability of point cloud-based evaluation in the future for existing green infrastructure through the green factor. The tentative estimations are presented in Appendix B. According to the results, we argue that elements with clear geometric form have a good potential to be assessed with the support of point cloud data [72]. The underground (non-visible) and surface-like elements, such as pavements, are likely to be applied only together with additional information sources. However, yards are individually structured natural environments, which might pose challenges for semi-automated assessments [73]. For future use, it is important to notice that in some cases, point cloud data sets can offer even more detailed and comprehensive information on the elements than is now defined in the green factor tool. The green factor tool that was used as a reference tool in this study defines the quantity of elements mostly in square meters or pieces. This is logical, as the actual green factor tool is intended to be used in the planning phase. However, for the assessment of the existing green factor, the tool could be developed to include the qualities of the existing elements in vertical strata and in volume [42]. In such case, point cloud-based evaluation of green effectiveness can enable possibilities for geometrically comprehensive assessment of UGI, including the vertical dimension.

4.4. Remarks on the Study Design and Future Research

The chosen perspective plays a major role in differences between aerial and terrestrial data capture. Terrestrial sensors are usually utilized to capture features located on, or near, the ground surface while UAV footage tends to be used for bird’s eye purposes, such as for capturing tall elements like large trees [73]. Another aspect bound to the chosen perspective is distance from the sensor to the subject. Laser scanners are designed to operate in a certain range window that needs to be accounted for. Generally, in surveys of built environments, UAVs are applied to capture an overview of the area and terrestrial methods for the close-range targets. However, both methods can be at least theoretically used for both close and high range purposes. With terrestrial methods, it is easier to cover the area under the canopy, but it is also possible to fly the UAV under the canopy [74]. This is not yet a very typical way to advance UAV-based surveying, and in our study, we chose distinct methods that advocate the differences in their strengths and demonstrate how these methods complement each other. To conclude, for monitoring elements of differing sizes, both terrestrial and aerial perspectives are beneficial.
Even though comparing the time consumption of the different methods was not an objective in our study, it is worth noting that in this study, it took five hours to gather the terrestrial laser scanning data, while the Tarot T960 survey mission took 12 min. However, ZEB Revo RT offered relatively fast data capture by covering the test areas in 30 min. Finally, the manually operated DJI Phantom 4 Pro+ flights took 75 min combined. It should be noted that the DJI Phantom Pro+ could have been flown higher like the Tarot T960 to cover the area quicker but with lower resolution. This is an important aspect to consider in operative surveying; higher resolution data capture generally takes more time but might be purposeful in some cases. Aerial methods can be scaled easily, and as we have shown, flight distance had a relatively large impact on the results [75]. On the other hand, in terrestrial methods, scaling is more limited because of the perspective induced by occlusion [76]. The final aspect to consider is the amount of detail needed for the given task as the sensor should be chosen accordingly. It might not be cost-efficient to gather high-resolution data if lower resolutions can provide the information needed. Thus, for careful method design based on the individual characteristics of the targeted yard or similar environment, possible prior field inquiries are advised.
In our study, we analyzed the green elements manually from the point clouds. In the future, the possibility to use machine learning to classify the distinct green elements, even species, is of great interest. The fully automated analysis of point clouds has been studiedin remote sensing and computer vision research for numerous years [77]. Both deep learning and machine learning techniques [78] have been tested and deployed in point cloud data analysis, leading to promising results in urban point cloud classification via algorithms, such as random forest [79] and presence and background learning [80], and also via deep-learning architectures, such as SPGraph [81]. Tree attributes, such as canopy and stem surveying-based quantitative methods, have already been widely studied for forestry e.g., [35,36,37,82,83]. For green factor-like evaluations, questions around quality as well as the variety of objects and species arise. In addition to the green effectiveness evaluations, there are also other opportunities for the use of point cloud-based information in the management and planning of local UGI, including private and semi-private entities such as yards [14,15,16,17,18]. One of the possibilities is to manipulate point cloud-based models to represent future landscape scenarios’ design and planning [28].
The literature on point cloud-based assessment of urban single green elements, apart from trees, is still limited [42,43,44]. Therefore, the criteria for the qualities of the point clouds, as well as the respective methods, should be further studied in terms of UGI assessment. In this study we utilized geometry and appearance with a distinction between details and volume/amount. As we broaden the monitoring of UGI to the detailed vertical strata, also the criteria and targets of the environmental assessment tools need to be adjusted and further discussed. Originally, the green factor is a tool intended for evaluating 2D plans, which does not yet open all the possibilities that the three-dimensional approach offers to the management of UGI. Consequently, as stated in recent research [42,43,44], in addition to technical development, a shift in thinking is required. In the sustainable planning of UGI, there are still many possibilities that the vertical aspect of local geospatial information has to offer but have still not yet been utilized up to their full potential. Based on the results of this study, a point cloud-based green factor calculation is a promising approach that could be reinforced with machine- and deep-learning techniques in future studies.

5. Conclusions

Detailed evaluation of local UGI is a potential tool in maintaining sustainable urban environments under the era of consolidating cities. With remote sensing methods, prior research is oriented on large-scale estimation of UGI. Studying the environment to a high level of detail with photogrammetry and laser scanning is a well-established research practice, however, apart from trees, it is currently less applied in estimations, such as the green factor, including single urban green elements. Terrestrial laser scanning, mobile laser scanning, and UAV photogrammetry were applied for 3D-mapping a yard environment in high detail. The resulting point clouds were compared in their ability to convey information of urban green elements, both concerning their geometry and appearance. While there were differences in how successful the distinct sensor methods were in presenting different green elements, the green elements were also not equally well-captured in the data. This was seen especially with the surface-like elements, and with the elements located under the canopy or on the ground within natural vegetation. Thus, while point clouds appear to be a potential tool in future estimations of the existing green factor of a single area, the individual characteristics of the study site may play a great role in how successful the monitoring of green elements will be in quality. Therefore, we suggest that the implementation of point cloud-based methods should be designed according to the desired level of detail, to the division of tall and small-scale elements, and to the number of green elements located under the canopy. Additionally, further development of the green factor or similar tools would be needed to better allow the evaluations of the green effectiveness of the existing local UGI, as the green factor is now mainly applied as a regulative tool in planning.

Author Contributions

Conceptualization, Kaisa Jaalama, Hannu Hyyppä, Matti Vaaja and Juho-Pekka Virtanen; methodology, Kaisa Jaalama, Heikki Kauhanen, Juho-Pekka Virtanen, Arttu Julin and Aino Keitaanniemi; validation, Heikki Kauhanen, Toni Rantanen, Aino Keitaanniemi and Kaisa Jaalama; formal analysis, Kaisa Jaalama and Heikki Kauhanen; investigation, Kaisa Jaalama, Heikki Kauhanen, Toni Rantanen, Aino Keitaanniemi and Matias Ingman; resources, Heikki Kauhanen and Marika Ahlavuo; data curation, Heikki Kauhanen and Toni Rantanen; writing—original draft preparation, Kaisa Jaalama; writing—review and editing, Heikki Kauhanen, Aino Keitaanniemi, Toni Rantanen, Arttu Julin, Juho-Pekka Virtanen, Hannu Hyyppä, Marika Ahlavuo and Matias Ingman; visualization, Kaisa Jaalama and Heikki Kauhanen; supervision, Hannu Hyyppä; project administration, Kaisa Jaalama; funding acquisition, Hannu Hyyppä, Matti Vaaja and Kaisa Jaalama. All authors have read and agreed to the published version of the manuscript.

Funding

This research was funded by ACADEMY OF FINLAND, grant numbers 337656, 293389, 314312, 323783, and 326246, Aalto Doctoral Programme in Engineering, European Social Fund, grant number S21997, Helsinki-Uusimaa Regional Council, grant number UKKE029, and Helsinki Innovation Fund.

Conflicts of Interest

The authors declare no conflict of interest.

Appendix A

Table A1. Excluded green factor elements.
Element GroupElement Description
Stormwater management solutionsRain garden (biofiltration area) with a broad range of layered
Infiltration pit (underground)
Retention or detention basin or swale covered with vegetation or aggregates (permeable soil)
Retention or detention pit, tank or cistern (underground, notice units: volume!)
Biofiltration basin or swale
Bonus elements Capturing stormwater from impermeable surfaces for use in irrigation or directing it in a controlled manner to permeable vegetated areas
Directing stormwater from impermeable surfaces to constructed water features, such as ponds and streams, with flowing water
Preserved vegetation and soilPreserved natural meadow or natural ground vegetation
Preserved natural bare rock area (at least partially bare rock surface, not many trees)
Planted/new vegetationMeadow or dry meadow
Cultivation plots
Green wall, vertical area
PavementsImpermeable surface
Stormwater management solutionsIntensive green roof/roof garden, depth of substrate 20–100 cm
Semi-intensive green roof, depth of substrate 15–30 cm
Extensive green roof, depth of substrate 6–8 cm
Pond, wetland or water meadow with natural vegetation (permanent water surface at least part of the year; at other times the ground remains moist)
Bonus elementsFruit trees or berry bushes suitable for cultivation (10 m2 each)
Boxes for urban farming/cultivation
Permeable surface designated for play or sports (e.g., sand- or gravel-covered playgrounds, sports turf)
Communal rooftop gardens or balconies with at least 10% of the total area covered by vegetation

Appendix B

Table A2. Tentative estimation based on the study results; possibility to utilize point clouds in green factor-based assessment of existing vegetation.
Element Group (in the Original Green Factor)Element Description (in the Original Green Factor)Unit (in the Original Green Factor)Potential to Utilize Point Clouds as Part of the Existing Green Factor Assessment (Tentative Estimation)
Preserved vegetation and soilPreserved large (fully grown > 10 m) tree in good condition, at least 3 m (25 m2 each)pcsYes
Preserved small (fully grown ≤ 10 m) tree in good condition, at least 3 m (15 m2 each)pcsYes
Preserved tree in good condition (1.5–3 m) or a large shrub (3 m2 each)pcsYes
Preserved natural meadow or natural ground vegetationm2Yes
Preserved natural bare rock area (at least partially bare rock surface, not many trees)m2Yes
Planted/new vegetationLarge tree species, fully grown > 10 m (25 m2 each)pcsYes
Small tree species, fully grown ≤ 10 m (15 m2 each)pcsYes
Large shrubs (3 m2 each)pcsYes
Other shrubs m2Yes
Perennialsm2Yes
Meadow or dry meadowm2No, or only as supportive source
Cultivation plots m2Needs verification
Lawnm2Yes
Perennial vines (2 m2 each)pcsYes
Green wall, vertical aream2Yes
PavementsSemipermeable pavements (e.g., grass stones, stone ash)m2No, or only as supportive source
Permeable pavements (e.g., gravel and sand surfaces)m2No, or only as supportive source
Impermeable surfacem2No, or only as supportive source
Stormwater management solutionsRain garden (biofiltration area) with a broad range of layered vegetationm2No, or only as supportive source
Intensive green roof/roof garden, depth of substrate 20–100 cmm2Needs verification
Semi-intensive green roof, depth of substrate 15–30 cm m2Needs verification
Extensive green roof, depth of substrate 6–8 cmm2Needs verification
Infiltration basin or swale covered with vegetation or aggregates (no permanent pool of water, permeable soil)m2No, or only as supportive source
Infiltration pit (underground)m2No, or only as supportive source
Pond, wetland or water meadow with natural vegetation (permanent water surface at least part of the year; at other times the ground remains moist)m2Needs verification
Retention or detention basin or swale covered with vegetation or aggregates (permeable soil)m2No, or only as supportive source
Retention or detention pit, tank or cistern (underground, notice units: volume!)m3No, or only as supportive source
Biofiltration basin or swalem2No, or only as supportive source
Bonus elements, max score 1 per category Capturing stormwater from impermeable surfaces for use in irrigation or directing it in a controlled manner to permeable vegetated areasm2No, or only as supportive source
Directing stormwater from impermeable surfaces to constructed water features, such as ponds and streams, with flowing waterm2No, or only as supportive source
Shading large tree (25 m2 each) on the south or southwest side of the building (especially deciduous trees) pcsYes
Shading small tree (15 m2 each) on the south or southwest side of the building (especially deciduous trees) pcsYes
Fruit trees or berry bushes suitable for cultivation (10 m2 each) pcsNo, or only as supportive source
A selection of native species—at least 5 species/100 m2m2Needs verification
Tree species native to Helsinki and flowering trees and shrubs—at least 3 species/100 m2m2Needs verification
Butterfly meadows or plants with pleasant scent or impressive bloomingm2Needs verification
Boxes for urban farming/cultivationm2Needs verification
Permeable surface designated for play or sports (e.g., sand- or gravel-covered playgrounds, sports turf)m2No, or only as supportive source
Communal rooftop gardens or balconies with at least 10% of the total area covered by vegetationm2Yes
Structures supporting natural and/or animal living conditions such as preserved dead wood/stumps or birdboxes (5 m2 each)pcsNeeds verification

References

  1. World Health Organization. Ecosystems and Human Well-Being: Health Synthesis: A Report of the Millennium Ecosystem Assessment; World Health Organization: Geneva, Switzerland, 2007. [Google Scholar]
  2. European Commission. Communication from the Commission to the European Parliament, the Council, the European Economic and Social Committee and the Committee of the Regions. In Green Infrastructure (GI)—Enhancing Europe’s Natural Capital; COM (2013) 249 Final; European Commission: Brussels, Belgium, 2013. [Google Scholar]
  3. Faehnle, M.E. ViherKARA. Kaupunkiseutujen vihreän infrastruktuurin käsitteitä. In Suomen Ympäristökeskuksen Raportteja 39/2013; Suomen ympäristökeskus: Helsinki, Finland, 2013. [Google Scholar]
  4. Cameron, R.W.; Blanuša, T.; Taylor, J.E.; Salisbury, A.; Halstead, A.J.; Henricot, B.; Thompson, K. The domestic garden–Its contribution to urban green infrastructure. Urban For. Urban Green. 2012, 11, 129–137. [Google Scholar] [CrossRef]
  5. Organisation for Economic Co-operation and Development. Compact City Policies: A Comparative Assessment; OECD: Pairs, France, 2012. [Google Scholar]
  6. Tsunetsugu, Y.; Lee, J.; Park, B.J.; Tyrväinen, L.; Kagawa, T.; Miyazaki, Y. Physiological and psychological effects of viewing urban forest landscapes assessed by multiple measurements. Landsc. Urban Plan. 2013, 113, 90–93. [Google Scholar] [CrossRef]
  7. Grahn, P.; Stigsdotter, U.K. The relation between perceived sensory dimensions of urban green space and stress restoration. Landsc. Urban Plan. 2012, 94, 264–275. [Google Scholar] [CrossRef]
  8. Tyrväinen, L.; Mäkinen, K.; Schipperijn, J. Tools for mapping social values of urban woodlands and other green areas. Landsc. Urban Plan. 2007, 79, 5–19. [Google Scholar] [CrossRef]
  9. Venter, Z.S.; Barton, D.N.; Gundersen, V.; Figari, H.; Nowell, M. Urban nature in a time of crisis: Recreational use of green space increases during the COVID-19 outbreak in Oslo, Norway. Environ. Res. Lett. 2020, 15, 104075. [Google Scholar] [CrossRef]
  10. Jackson, S.B.; Stevenson, K.T.; Larson, L.R.; Peterson, M.N.; Seekamp, E. Outdoor activity participation improves adolescents’ mental health and well-being during the COVID-19 pandemic. Int. J. Environ. Res. Public Health 2021, 18, 2506. [Google Scholar] [CrossRef]
  11. Fagerholm, N.; Eilola, S.; Arki, V. Outdoor recreation and nature’s contribution to well-being in a pandemic situation-Case Turku, Finland. Urban For. Urban Green. 2021, 64, 127257. [Google Scholar] [CrossRef]
  12. Wolch, J.R.; Byrne, J.; Newell, J.P. Urban green space, public health, and environmental justice: The challenge of making cities ‘just green enough’. Landsc. Urban Plan. 2014, 125, 234–244. [Google Scholar] [CrossRef] [Green Version]
  13. Rigolon, A.; Németh, J. “We’re not in the business of housing:” Environmental gentrification and the non-profitization of green infrastructure projects. Cities 2018, 81, 71–80. [Google Scholar] [CrossRef]
  14. Ojala, A.; Niemelä, J.; Yli-Pelkonen, V. Impacts of residential infilling on private gardens in the Helsinki Metropolitan Area. In Green Landscapes in the European City, 1750–2010; Clark, P., Niemi, M., Nolin, C., Eds.; Routledge Studies in Modern European History; Routledge: London, UK; New York, NY, USA, 2017; pp. 71–86. [Google Scholar]
  15. Ariluoma, M.; Ottelin, J.; Hautamäki, R.; Tuhkanen, E.M.; Mänttäri, M. Carbon sequestration and storage potential of urban green in residential yards: A case study from Helsinki. Urban For. Urban Green. 2021, 57, 126939. [Google Scholar] [CrossRef]
  16. Loram, A.; Tratalos, J.; Warren, P.H.; Gaston, K.J. Urban domestic gardens (X): The extent & structure of the resource in five major cities. Landsc. Ecol. 2007, 22, 601–615. [Google Scholar]
  17. Clark, C.; Ordóñez, C.; Livesley, S.J. Private tree removal, public loss: Valuing and enforcing existing tree protection mechanisms is the key to retaining urban trees on private land. Landsc. Urban Plan. 2020, 203, 103899. [Google Scholar] [CrossRef]
  18. Bush, J.; Ashley, G.; Foster, B.; Hall, G. Integrating Green Infrastructure into Urban Planning: Developing Melbourne’s Green Factor Tool. Urban Plan. 2021, 6, 20–31. [Google Scholar] [CrossRef]
  19. Keeley, M. The Green Area Ratio: An urban site sustainability metric. J. Environ. Plan. Manag. 2011, 54, 937–958. [Google Scholar] [CrossRef]
  20. Juhola, S. Planning for a green city: The Green Factor tool. Urban For. Urban Green. 2018, 34, 254–258. [Google Scholar] [CrossRef]
  21. Stenning, E. An Assessment of the Seattle Green Factor: Increasing and Improving the Quality of Urban Green Infrastructure. Master’s Thesis, University of Washington, Seattle, WA, USA, 2008. [Google Scholar]
  22. Inkiläinen, E.; Tiihonen, T.; Eitsi, E. Viherkerroinmenetelmän kehittäminen Helsingin kaupungille. In Helsingin Kaupungin Ympäristökeskuksen Julkaisuja 8/2014; Helsingin kaupungin ympäristökeskus: Helsinki, Finland, 2014. [Google Scholar]
  23. Helsinki City Council. Viherkertoimen Käyttö Viihtyvyyden, Sopeutumisen Ja Luonnon Monimuotoisuuden Edistämiseksi; Helsinki City Council: Helsinki, Finland, 2020. [Google Scholar]
  24. Yu, X.; Hyyppä, J.; Karjalainen, M.; Nurminen, K.; Karila, K.; Vastaranta, M.; Kankare, V.; Kaartinen, H.; Holopainen, M.; Honkavaara, E.; et al. Comparison of laser and stereo optical, SAR and InSAR point clouds from air-and space-borne sources in the retrieval of forest inventory attributes. Remote Sens. 2015, 7, 15933–15954. [Google Scholar] [CrossRef] [Green Version]
  25. Puliti, S.; Gobakken, T.; Ørka, H.O.; Næsset, E. Assessing 3D point clouds from aerial photographs for species-specific forest inventories. Scand. J. For. Res. 2017, 32, 68–79. [Google Scholar] [CrossRef]
  26. White, J.C.; Stepper, C.; Tompalski, P.; Coops, N.C.; Wulder, M.A. Comparing ALS and image-based point cloud metrics and modelled forest inventory attributes in a complex coastal forest environment. Forests 2015, 6, 3704–3732. [Google Scholar] [CrossRef]
  27. Al-Rawabdeh, A.; He, F.; Moussa, A.; El-Sheimy, N.; Habib, A. Using an unmanned aerial vehicle-based digital imaging system to derive a 3D point cloud for landslide scarp recognition. Remote Sens. 2016, 8, 95. [Google Scholar] [CrossRef] [Green Version]
  28. Yonglin, S.; Lixin, W.; Zhi, W. Identification of inclined buildings from aerial lidar data for disaster management. In Proceedings of the 2010 18th International Conference on Geoinformatics, Beijing, China, 18–20 June 2010; pp. 1–5. [Google Scholar]
  29. Chen, Z.; Xu, B.; Devereux, B. Urban landscape pattern analysis based on 3D landscape models. Appl. Geogr. 2014, 55, 82–91. [Google Scholar] [CrossRef]
  30. Urech, P.R.; Dissegna, M.A.; Girot, C.; Grêt-Regamey, A. Point cloud modeling as a bridge between landscape design and planning. Landsc. Urban Plan. 2020, 203, 103903. [Google Scholar] [CrossRef]
  31. Vosselman, G. Point cloud segmentation for urban scene classification. Int. Arch. Photogramm. Remote Sens. Spat. Inf. Sci. 2013, 1, 257–262. [Google Scholar] [CrossRef] [Green Version]
  32. Safaie, A.H.; Rastiveis, H.; Shams, A.; Sarasua, W.A.; Li, J. Automated street tree inventory using mobile LiDAR point clouds based on Hough transform and active contours. ISPRS J. Photogramm. Remote Sens. 2021, 174, 19–34. [Google Scholar] [CrossRef]
  33. Weinmann, M.; Weinmann, M.; Mallet, C.; Brédif, M. A classification-segmentation framework for the detection of individual trees in dense MMS point cloud data acquired in urban areas. Remote Sens. 2017, 9, 277. [Google Scholar] [CrossRef] [Green Version]
  34. Cabo, C.; Ordoñez, C.; García-Cortés, S.; Martínez, J. An algorithm for automatic detection of pole-like street furniture objects from Mobile Laser Scanner point clouds. ISPRS J. Photogramm. Remote Sens. 2014, 87, 47–56. [Google Scholar] [CrossRef]
  35. Lin, X.; Yang, B.; Wang, F.; Li, J.; Wang, X. Dense 3D surface reconstruction of large-scale streetscape from vehicle-borne imagery and LiDAR. Int. J. Digit. Earth 2021, 14, 619–639. [Google Scholar] [CrossRef]
  36. Neuville, R.; Bates, J.S.; Jonard, F. Estimating forest structure from UAV-mounted LiDAR point cloud using machine learning. Remote Sens. 2021, 13, 352. [Google Scholar] [CrossRef]
  37. Bottalico, F.; Chirici, G.; Giannini, R.; Mele, S.; Mura, M.; Puxeddu, M.; McRoberts, R.E.; Valbuena, R.; Travaglini, D. Modeling Mediterranean forest structure using airborne laser scanning data. Int. J. Appl. Earth Obs. Geoinf. 2017, 57, 145–153. [Google Scholar] [CrossRef]
  38. Wallace, L.; Hillman, S.; Reinke, K.; Hally, B. Non-destructive estimation of above-ground surface and near-surface biomass using 3D terrestrial remote sensing techniques. Methods Ecol. Evol. 2017, 8, 1607–1616. [Google Scholar] [CrossRef] [Green Version]
  39. Carr, J.C.; Slyder, J.B. Individual tree segmentation from a leaf-off photogrammetric point cloud. Int. J. Remote Sens. 2018, 39, 5195–5210. [Google Scholar] [CrossRef]
  40. Kaartinen, H.; Hyyppä, J.; Yu, X.; Vastaranta, M.; Hyyppä, H.; Kukko, A.; Holopainen, M.; Heipke, C.; Hirschmugl, M.; Morsdorf, F.; et al. An international comparison of individual tree detection and extraction using airborne laser scanning. Remote Sens. 2012, 4, 950–974. [Google Scholar] [CrossRef] [Green Version]
  41. Nevalainen, O.; Honkavaara, E.; Tuominen, S.; Viljanen, N.; Hakala, T.; Yu, X.; Hyyppä, J.; Saari, H.; Pölönen, I.; Imai, N.N.; et al. Individual tree detection and classification with UAV-based photogrammetric point clouds and hyperspectral imaging. Remote Sens. 2017, 9, 185. [Google Scholar] [CrossRef] [Green Version]
  42. Saarinen, N.; Calders, K.; Kankare, V.; Yrttimaa, T.; Junttila, S.; Luoma, V.; Huuskonen, S.; Hynynen, J.; Verbeeck, H. Understanding 3D structural complexity of individual Scots pine trees with different management history. Ecol. Evol. 2021, 11, 2561–2572. [Google Scholar] [CrossRef]
  43. Zhang, C.; Zhou, Y.; Qiu, F. Individual tree segmentation from LiDAR point clouds for urban forest inventory. Remote Sens. 2015, 7, 7892–7913. [Google Scholar] [CrossRef] [Green Version]
  44. Yu, X.; Hyyppä, J.; Kaartinen, H.; Maltamo, M. Automatic detection of harvested trees and determination of forest growth using airborne laser scanning. Remote Sens. Environ. 2004, 90, 451–462. [Google Scholar] [CrossRef]
  45. Hyyppä, J.; Xiaowei, Y.; Rönnholm, P.; Kaartinen, H.; Hyyppä, H. Factors affecting object-oriented forest growth estimates obtained using laser scanning. Photogramm. J. Finl. 2003, 18, 16–31. [Google Scholar]
  46. Tompalski, P.; Coops, N.C.; White, J.C.; Goodbody, T.R.; Hennigar, C.R.; Wulder, M.A.; Socha, J.; Woods, M.E. Estimating Changes in Forest Attributes and Enhancing Growth Projections: A Review of Existing Approaches and Future Directions Using Airborne 3D Point Cloud Data. Curr. For. Rep. 2021, 7, 1–24. [Google Scholar]
  47. Liang, X.; Kankare, V.; Hyyppä, J.; Wang, Y.; Kukko, A.; Haggrén, H.; Yu, X.; Kaartinen, H.; Jaakkola, A.; Guan, F.; et al. Terrestrial laser scanning in forest inventories. ISPRS J. Photogramm. Remote Sens. 2016, 115, 63–77. [Google Scholar] [CrossRef]
  48. Casalegno, S.; Anderson, K.; Cox, D.T.; Hancock, S.; Gaston, K.J. Ecological connectivity in the three-dimensional urban green volume using waveform airborne lidar. Sci. Rep. 2017, 7, 45571. [Google Scholar]
  49. Alavipanah, S.; Haase, D.; Lakes, T.; Qureshi, S. Integrating the third dimension into the concept of urban ecosystem services: A review. Ecol. Indic. 2017, 72, 374–398. [Google Scholar] [CrossRef]
  50. Feltynowski, M.; Kronenberg, J.; Bergier, T.; Kabisch, N.; Łaszkiewicz, E.; Strohbach, M.W. Challenges of urban green space management in the face of using inadequate data. Urban For. Urban Green. 2018, 31, 56–66. [Google Scholar] [CrossRef]
  51. Larkin, A.; Hystad, P. Evaluating street view exposure measures of visible green space for health research. J. Expo. Sci. Environ. Epidemiol. 2019, 29, 447–456. [Google Scholar] [CrossRef] [PubMed]
  52. City of Espoo. Träskändan Kartanopuiston Hoito-Ja Käyttösuunnitelma 2018–2028; City of Espoo: Espoo, Finland, 2017. [Google Scholar]
  53. Kauhanen, H.; Rönnholm, P.; Vaaja, M.; Hyyppä, H. Designing and building a cost-efficient survey drone. Int. Arch. Photogramm. Remote Sens. Spat. Inf. Sci. 2020, 43, 165–172. [Google Scholar] [CrossRef]
  54. DJI. Phantom 4 Pro. 2021. Available online: https://www.dji.com/fi/phantom-4-pro (accessed on 1 September 2021).
  55. Leica. Leica RTC360 3D Laser Scanner. 2021. Available online: https://leica-geosystems.com/products/laser-scanners/scanners/leica-rtc360 (accessed on 1 September 2021).
  56. GeoSLAM. Zeb Revo RT Capture with Confidence. 2021. Available online: https://mzt1b2rcaay128n901d0fifo-wpengine.netdna-ssl.com/wp-content/uploads/2020/08/ZEB-Revo-RT-product-card-1.pdf (accessed on 1 September 2021).
  57. GeoSLAM. Zeb-Revo RT User’s Manual. 2018. Available online: https://geoslam.com/wp-content/uploads/2021/02/ZEB-REVO-RT-User-Guide-V1-0-3.pdf (accessed on 1 September 2021).
  58. GeoSLAM. Zeb-CAM User Guide. Available online: https://download.geoslam.com/docs/zeb-cam/ZEB-CAM%20User%20Guide%20V1-0-1.pdf (accessed on 1 September 2021).
  59. iWater Project. About iWater Project. Available online: https://www.integratedstormwater.eu/about (accessed on 1 September 2021).
  60. iWater Project. Green Factor Tool. Available online: https://www.integratedstormwater.eu/sites/www.integratedstormwater.eu/files/final_outputs/green_factor_tool_protected.xlsm (accessed on 1 September 2021).
  61. Saran, S.; Oberai, K.; Wate, P.; Konde, A.; Dutta, A.; Kumar, K.; Kumar, A.S. Utilities of virtual 3D city models based on CityGml: Various use cases. J. Indian Soc. Remote Sens. 2018, 46, 957–972. [Google Scholar] [CrossRef]
  62. Julin, A.; Kurkela, M.; Rantanen, T.; Virtanen, J.P.; Maksimainen, M.; Kukko, A.; Kaartinen, H.; Vaaja, M.T.; Hyyppä, J.; Hyyppä, H. Evaluating the quality of TLS point cloud colorization. Remote Sens. 2020, 12, 2748. [Google Scholar] [CrossRef]
  63. Richard, A. From Point Clouds to High-Fidelity Models-Advanced Methods for Image-Based 3D Reconstruction. Doctoral Dissertation, ETH Zurich, Zurich, Switzerland, 2021. [Google Scholar]
  64. CloudCompare. 3D Point Cloud and Mesh Processing Software. 2021. Available online: http://www.cloudcompare.org/ (accessed on 1 September 2021).
  65. CloudCompare. CloudCompare Wiki. 2016. Available online: https://www.cloudcompare.org/doc/wiki/index.php?title=Main_Page (accessed on 1 September 2021).
  66. Kersten, T.P.; Mechelke, K.; Lindstaedt, M.; Sternberg, H. Methods for geometric accuracy investigations of terrestrial laser scanning systems. Photogramm. Fernerkund. Geoinf. 2009, 4, 301–315. [Google Scholar] [CrossRef] [PubMed]
  67. Tucci, G.; Visintini, D.; Bonora, V.; Parisi, E.I. Examination of Indoor Mobile Mapping Systems in a Diversified Internal/External Test Field. Appl. Sci. 2018, 8, 401. [Google Scholar] [CrossRef] [Green Version]
  68. Sirmaceka, B.; Shena, Y.; Lindenbergha, R.; Zlatanovab, S.; Diakiteb, A. Comparison of ZEB1 and Leica C10 indoor laser scanning point clouds. ISPRS Ann. Photogramm. Remote Sens. Spat. Inf. Sci. 2016, 3, 143–149. [Google Scholar] [CrossRef] [Green Version]
  69. Chiabrando, F.; Della Coletta, C.; Sammartano, G.; Spanò, A.; Spreafico, A. “Torino 1911” project: A Contribution of a SLAM-based Survey to Extensive 3D Heritage Modelling. Int. Arch. Photogramm. Remote Sens. Spat. Inf. Sci. 2018, 42, 225–234. [Google Scholar] [CrossRef] [Green Version]
  70. Filippo, A.; Sánchez-Aparicio, L.J.; Barba, S.; Martín-Jiménez, J.A.; Mora, R.; González Aguilera, D. Use of a wearable mobile laser system in seamless indoor 3d mapping of a complex historical site. Remote Sens. 2018, 10, 1897. [Google Scholar] [CrossRef] [Green Version]
  71. Frangez, V.; Kramis, B.; Hübscher, F.; Baumann, A. Comparison of Three Innovative Technologies for 3D-Acquisition, Modelling, and Visualization of an Underground Mine. In FIG Congress 2018 Online Proceedings 2018; International Federation of Surveyors (FIG): Paris, France, 2018; p. 9502. [Google Scholar]
  72. Pomerleau, F.; Liu, M.; Colas, F.; Siegwart, R. Challenging data sets for point cloud registration algorithms. Int. J. Robot. Res. 2012, 31, 1705–1711. [Google Scholar] [CrossRef] [Green Version]
  73. Nex, F.; Remondino, F. UAV for 3D mapping applications: A review. Appl. Geomat. 2014, 6, 1–15. [Google Scholar] [CrossRef]
  74. Hyyppä, E.; Hyyppä, J.; Hakala, T.; Kukko, A.; Wulder, M.A.; White, J.C.; Pyörälä, J.; Yu, X.; Wang, Y.; Virtanen, J.P.; et al. Under-canopy UAV laser scanning for accurate forest field measurements. ISPRS J. Photogramm. Remote Sens. 2020, 164, 41–60. [Google Scholar] [CrossRef]
  75. Morgenthal, G.; Hallermann, N. Quality assessment of unmanned aerial vehicle (UAV) based visual inspection of structures. Adv. Struct. Eng. 2014, 17, 289–302. [Google Scholar] [CrossRef]
  76. Li, L.; Mu, X.; Soma, M.; Wan, P.; Qi, J.; Hu, R.; Zhang, W.; Tong, Y.; Yan, G. An Iterative-Mode Scan Design of Terrestrial Laser Scanning in Forests for Minimizing Occlusion Effects. IEEE Trans. Geosci. Remote Sens. 2020, 59, 3547–3566. [Google Scholar] [CrossRef]
  77. Weinmann, M.; Schmidt, A.; Mallet, C.; Hinz, S.; Rottensteiner, F.; Jutzi, B. Contextual classification of point cloud data by exploiting individual 3D neigbourhoods. ISPRS Ann. Photogramm. Remote Sens. Spat. Inf. Sci. 2015, 2, 271–278. [Google Scholar] [CrossRef] [Green Version]
  78. Özdemir, E.; Remondino, F.; Golkar, A. Aerial point cloud classification with deep learning and machine learning algorithms. Int. Arch. Photogramm. Remote Sens. Spat. Inf. Sci. 2019, 42, 843–849. [Google Scholar] [CrossRef] [Green Version]
  79. Park, Y.; Guldmann, J.M. Creating 3D city models with building footprints and LIDAR point cloud classification: A machine learning approach. Comput. Environ. Urban Syst. 2019, 75, 76–89. [Google Scholar] [CrossRef]
  80. Ao, Z.; Su, Y.; Li, W.; Guo, Q.; Zhang, J. One-class classification of airborne LiDAR data in urban areas using a presence and background learning algorithm. Remote Sens. 2017, 9, 1001. [Google Scholar] [CrossRef] [Green Version]
  81. Lowphansirikul, C.; Kim, K.S.; Vinayaraj, P.; Tuarob, S. 3D Semantic segmentation of large-scale point-clouds in urban areas using deep learning. In Proceedings of the 2019 11th International Conference on Knowledge and Smart Technology (KST), Phuket, Thailand, 23–26 January 2019; pp. 238–243. [Google Scholar]
  82. Wang, K.; Zhou, J.; Zhang, W.; Zhang, B. Mobile LiDAR Scanning System Combined with Canopy Morphology Extracting Methods for Tree Crown Parameters Evaluation in Orchards. Sensors 2021, 21, 339. [Google Scholar] [CrossRef]
  83. Luoma, V.; Yrttimaa, T.; Kankare, V.; Saarinen, N.; Pyörälä, J.; Kukko, A.; Kaartinen, H.; Hyyppä, J.; Holopainen, M.; Vastaranta, M. Revealing changes in the stem form and volume allocation in diverse boreal forests using two-date terrestrial laser scanning. Forests 2021, 12, 835. [Google Scholar] [CrossRef]
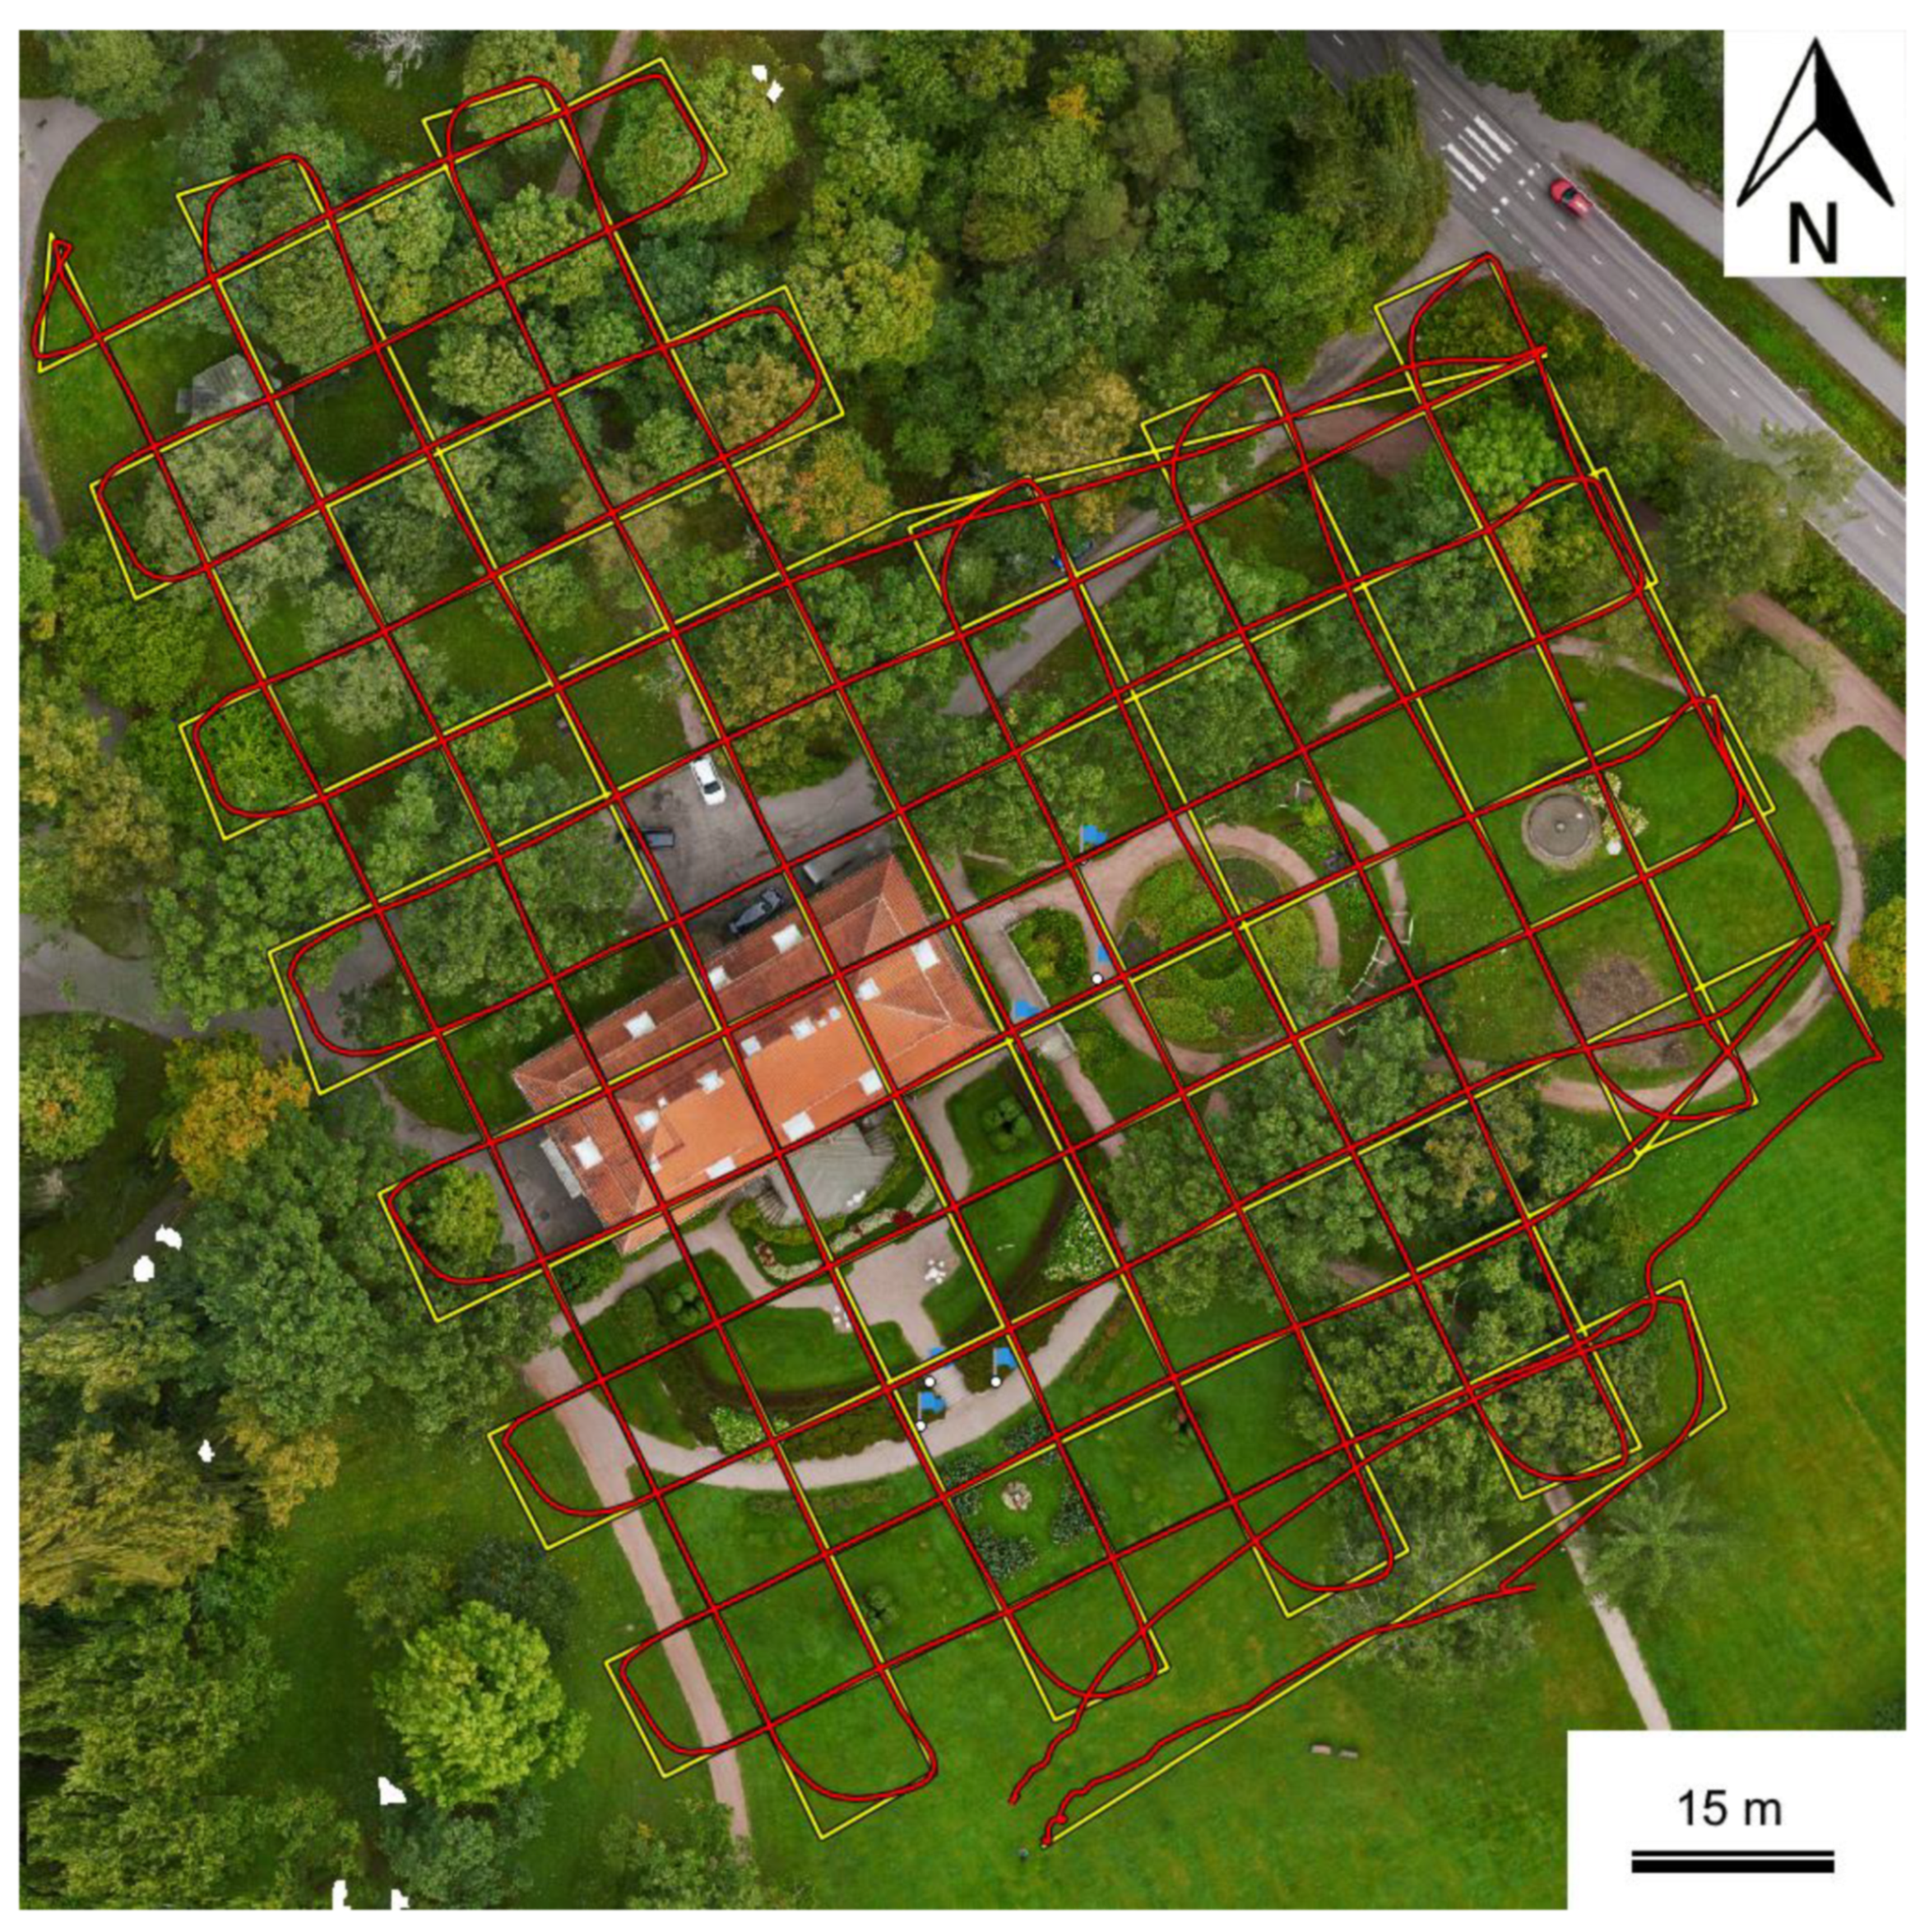
Figure 1. Tarot T960 survey mission. Flight plan is illustrated in yellow, and the actual flight path in red.
Ijgi 10 00762 g001
Figure 2. DJI Phantom 4 Pro+ survey flights. Camera stations are illustrated in white.
Ijgi 10 00762 g002
Figure 3. Leica RTC360 scanning positions.
Ijgi 10 00762 g003
Figure 4. GeoSLAM ZEB Revo RT point cloud with independent measurement trajectories which are colored individually as blue, red, yellow, green, and purple. The point cloud is colored with the data of the integrated camera system, and the black points are laser scanning points that do not have any color value from camera data.
Ijgi 10 00762 g004
Figure 5. Parameters for the comparative analysis. The parameters of geometry were tested with height ramp colored point clouds and the parameters of appearance with RGB colored point clouds.
Ijgi 10 00762 g005
Figure 6. Comparisons of point clouds for large trees. In the top row, the point clouds are colored with the height ramp, and in the bottom row with RGB colorization.
Ijgi 10 00762 g006
Figure 7. Comparisons of point clouds for small trees. In the top row, the point clouds are colored with the height ramp, and in the bottom row with RGB colorization.
Ijgi 10 00762 g007
Figure 8. Comparisons of point clouds for very small trees. In the top row, the point clouds are colored with the height ramp and in the bottom row with RGB colorization.
Ijgi 10 00762 g008
Figure 9. Comparison of point clouds for a large shrub. In the top row, the point clouds are colored with the height ramp, and in the bottom row with RGB colorization.
Ijgi 10 00762 g009
Figure 10. Comparison of point clouds for natural ground vegetation. In the top row, the point clouds are colored with the height ramp, and in the bottom row with RGB colorization.
Ijgi 10 00762 g010
Figure 11. Comparison of point clouds for dead wood/stumps. In the top row, the point clouds are colored with the height ramp, and in the bottom row with RGB colorization.
Ijgi 10 00762 g011
Figure 12. Comparisons of point clouds for perennials, lawns, perennial vines, and semipermeable surfaces: grass stones, and permeable pavements: sand surfaces. In the top row, the point clouds are colored with the height ramp, and in the bottom row with RGB colorization.
Ijgi 10 00762 g012
Figure 13. Comparisons of point clouds for plants with impressive blooming. In the top row, the point clouds are colored with the height ramp, and in the bottom row with RGB colorization.
Ijgi 10 00762 g013
Figure 14. Comparison of point clouds for a blooming shrub. In the top row, the point clouds are colored with the height ramp, and in the bottom row with RGB colorization.
Ijgi 10 00762 g014
Figure 15. The mean results of all the point cloud data sets to convey information on green elements, 3 being the top score (good ability to convey information) and 0 (no ability to convey information) being the lowest score.
Ijgi 10 00762 g015
Figure 16. The best-performing results of all of the point cloud data sets to convey information on green elements, 3 being the top score (good ability to convey information) and 0 (no ability to convey information) being the lowest score.
Ijgi 10 00762 g016
Figure 17. The mean results of all the point cloud data sets with geometry and appearance.
Ijgi 10 00762 g017
Table 1. Tested green factor elements according to, and adapted from, the Helsinki green factor tool.
Element Description Location in the Test Area
Large (>10 m) tree in good condition, at least 3 m In cluster, open area
Small (≤10 m) tree in good condition, at least 3 mIn cluster, open area
Tree in good condition (1.5–3 m) In cluster, open area
Natural ground vegetationUnder the canopy
Large shrubs (3 m2 each)Under the canopy
Flowering shrubsOpen area
PerennialsOpen area
LawnOpen area
Perennial vines Mostly open area
Semipermeable pavements: grass stonesOpen area
Permeable pavements: gravel and sand surfacesOpen area
Plants with impressive bloomingOpen area
Dead wood/stumps Under the canopy
Table 2. The criteria for the ability of the point cloud data to convey information on the tested parameters.
Ability to Convey InformationRatingDescription
No ability0The geometry of the element, or visual information, such as the color of the element, is missing or not detectable in the data. Data allows no evaluation of the element
Low ability1Traces of the element’s form, or minimal visual information, are detectable. Other sources are needed to monitor the element.
Moderate ability2The limits of the element are somewhat detectable, or visual information exists but is at least partly incomplete. Data allows moderate but no proper evaluation of the element.
Good ability3The limits of the elements are mostly clear, or visual information is mostly comprehensive. Data allows the monitoring of the element.
Table 3. The point cloud data sets’ ability to convey information on the green elements’ geometry, with 3 denoting good ability, 2 denoting moderate ability, 1 denoting low ability, and 0 denoting no ability to convey information on the given parameter.
Geometry: Point Cloud Data Sets’ Ability to Convey Information
Tarot T960DJI Phantom 4 Pro+Leica RTC360GeoSLAM ZEB Revo RT
Details Completeness DetailsCompleteness Details Completeness DetailsCompleteness
Large (>10 m) tree in good condition 122223222
Small (≤10 m) tree in good condition 133333322
Very small tree in good condition (1.5–3 m) 1 12333333
Perennials 123233333
Lawn 1 12222212
Perennial vines 1 22223333
Semipermeable surfaces: grass stones 1 00000000
Permeable pavements: sand surfaces 100000000
Flowering shrubs 112123333
Plants with impressive blooming 122233333
Large shrubs (3 m2 each) 2 11113332
Natural ground vegetation 2 11113333
Dead wood/stumps 2 00002222
1 Located in An Open Area; 2 Located under the Canopy.
Table 4. The point cloud data sets’ ability to convey information on the green elements’ appearance, with 3 denoting good ability, 2 denoting moderate ability, 1 denoting low ability, and 0 denoting no ability to convey information on the given parameter.
Appearance: Point Cloud Data Sets’ Ability to Convey Information
Tarot T960DJI Phantom 4 Pro+Leica RTC360GeoSLAM ZEB Revo RT
Details Completeness DetailsCompleteness Details CompletenessDetailsCompleteness
Large (>10 m) tree in good condition 132222211
Small (≤10 m) tree in good condition 133332211
Very small tree in good condition (1.5–3 m) 1 11332312
Perennials 133331111
Lawn 1 32322311
Perennial vines 1 22322211
Semipermeable surfaces: grass stones 1 33331100
Permeable pavements: sand surfaces 123232322
Flowering shrubs 132223311
Plants with impressive blooming 133333311
Large shrubs (3 m2 each) 2 11211211
Natural ground vegetation 2 11212212
Dead wood/stumps 2 11212110
1 Located in An Open Area; 2 Located under the Canopy.
Publisher’s Note: MDPI stays neutral with regard to jurisdictional claims in published maps and institutional affiliations.