Abstract
(1) Background: Hurricane events are expected to increase as a consequence of climate change, increasing their intensity and severity. Destructive hurricane activities pose the greatest threat to coastal communities along the U.S. Gulf of Mexico and Atlantic Coasts in the conterminous United States. This study investigated the historical extent of hurricane-related damage, identifying the most at-risk areas of hurricanes using geospatial big data. As a supplement to analysis, this study further examined the overall population trend within the hurricane at-risk zones. (2) Methods: The Sea, Lake, and Overland Surges from Hurricanes (SLOSH) model and the HURRECON model were used to estimate the geographical extent of the storm surge inundation and wind damage of historical hurricanes from 1950 to 2018. The modeled results from every hurricane were then aggregated to a single unified spatial surface to examine the generalized hurricane patterns across the affected coastal counties. Based on this singular spatial boundary coupled with demographic datasets, zonal analysis was applied to explore the historical population at risk. (3) Results: A total of 775 counties were found to comprise the “hurricane-prone coastal counties” that have experienced at least one instance of hurricane damage over the study period. The overall demographic trends within the hurricane-prone coastal counties revealed that the coastal populations are growing at a faster pace than the national average, and this growth puts more people at greater risk of hurricane hazards. (4) Conclusions: This study is the first comprehensive investigation of hurricane vulnerability encompassing the Atlantic and Gulf Coasts stretching from Texas to Maine over a long span of time. The findings from this study can serve as a basis for understanding the exposure of at-risk populations to hurricane-related damage within the coastal counties at a national scale.
1. Introduction
Hurricanes are extreme meteorological events that are likely to be affected by climate change, of which global warming and sea level rise are two foreseeable changes that could impact the consequences of hurricane disasters. The frequency and/or intensity of hurricanes are projected to increase in the coming decades, producing high-speed winds and heavy precipitation [1,2,3,4,5]. Hurricanes have historically proven to be some of the most devastating and costliest natural disasters in the Gulf of Mexico and Atlantic coast regions of the United States, having the highest average event cost (USD 21.5 billion per event), and causing the highest number of fatalities (6593) and the largest economic losses (USD 945.9 billion total of all natural disasters between 1980 and 2020) [6,7,8]. The primary causes of the massive damage and loss of life are storm surge flooding and high-speed winds. In particular, drownings from storm surges are responsible for most hurricane-related casualties and injuries [9,10,11,12].
U.S. coastal populations are already experiencing the risk of hazards such as hurricanes, storm surges, sea level rise, and coastal erosion. The fast-growing coastal population and demographic shifts along the coastal regions are playing a major role in substantially aggravating the consequences of hurricanes [2,13,14,15]. Approximately 123.3 million people, which amounts to 39% of the total U.S. population, resided in hurricane-prone coastal areas in 2010, increasing to 127 million people in 2016. The population was expected to grow to 134 million (i.e., an 8% increase) from 2010 to 2020 in coastal zones. Coastal populations are projected to increase up to 144 million people (i.e., 20% increase) by 2025 within 100 km of the coastal areas in the United States, thereby continuously increasing coastal populations’ vulnerability to natural hazards [16,17].
Increasingly destructive hurricane activities pose a threat to these coastal communities along the U.S. Gulf of Mexico and Atlantic coasts. Rapid coastal population growth puts more people in harm’s way, and rising property values by accelerating urbanization and intensive development have placed more environment-related stresses on coastal areas. The burgeoning coastal settlement and coastal-dependent economic activities (e.g., shipping, tourism, fisheries, and petroleum industry) are attracting more people to move to the hurricane coasts [13,14]. Specifically, the Gulf of Mexico regions have seen an 8.5% increase in population employed in construction industries and a 10.8% increase in employment in maintenance occupations, which is higher than the national rate [18]. Overdevelopment due to the high demand for second homes and coastal real estate has increased the risk and exposure of people and infrastructure to hurricane-related damage more than ever before [2,13,19,20,21].
Estimating exposure to hurricane risk is a fundamental step in comprehending the geophysical vulnerability of coastal populations [22]. Most research investigating hurricane hazards has been largely based on various hydrodynamic models such as the Sea, Lake, and Overland Surges from Hurricanes (SLOSH), H*Wind (hurricane wind analysis system), or Simulating WAves Nearshore (SWAN) coupled with ADvanced CIRCulation (ADCIRC) models. Each of these models requires a unique set of parameters using different wind model equations and have their strengths and weaknesses [11,23,24,25,26]. The majority of the existing literature applies these models in the field of coastal engineering and atmospheric research. Recently, an R package called “stormwindmodel” simplified the complicated modeling procedure for Atlantic Basin tropical storms, allowing researchers to facilitate rapid application for hurricane exposure assessment [27,28].
To date, numerous studies have assessed hurricane vulnerability on a case-by-case basis, focusing on the most devastating hurricane events that have caused enormous societal losses. Such case-specific studies do not necessarily show the long-term effects of hurricane risks in coastal regions and provide a limited picture in assessing the comprehensive vulnerability to hurricane hazards over time. This brings into question the spatial patterns of cumulative hurricane-related damage (particularly storm surge and wind-induced damage) based on past and recent hurricane events and their consequential effect on coastal population growth in hurricane-prone areas in the United States. The definition of “hurricane-prone region” has been restricted to flooding hazards in the current literature, which impedes the implementation of comprehensive hurricane vulnerability assessment using demographic datasets. One longitudinal study by Logan and Xu (2015) modeled hurricane-related hazards to capture spatial patterns of actual hurricane exposures that occurred from 1950 to 2005 [29]. Despite the importance of long-term research in hurricane vulnerability, there remains a paucity of longitudinal studies that systematically examine long-term trends of populations at increased risk of hurricane damage.
The objective of this study is therefore to estimate the geographic distribution of hurricane-related damage that has occurred in the United States throughout its history by modeling storm surge and wind damage. Specifically, this research is designed to answer the following research questions: (1) What are the spatial extent and intensity of storm surge inundation and wind damage caused by hurricanes along the Gulf and Atlantic coasts in the United States from 1950 onwards? (2) What regions have been particularly hard hit by hurricanes in the U.S. coastal counties over the past decades since 1950? (3) How has the overall population changed within the U.S. hurricane coastal counties over time? The increased risk of hurricane hazards has the potential to impact populations and residential infrastructure within at-risk areas, making it essential to identify the areas with greater hurricane exposure. Hurricanes can negatively affect individuals and local communities through economic losses and infrastructure damage, among other ways. However, this study limits the scope to estimate the potential biophysical vulnerability of hurricanes through the estimation of historical hurricane damage at the national level. The social and economic consequences of hurricane damage on society are broadly defined, and thus consideration of these various sectors lies beyond the scope of this study.
The remainder of this paper has been divided into four sections. Section 2 provides a brief overview of the study area, datasets, and methods adopted in the analysis. The coastal areas impacted by storm surge inundation and wind damage are presented at the national level in Section 3. In addition, this section also shows the total populations that have been exposed to hurricane-related damage during the study period. Section 4 presents the conclusions, significance, and limitations of this research that can be further investigated in the future.
2. Materials and Methods
2.1. Modeling Large-Scale and Long-Term Historical Hurricanes
Vulnerability science has been extensively applied to a wide variety of academic fields such as ecology, public health, sustainable science, environmental justice, and disaster risk management [30]. The question is what exposes people and places to greater harm from environmental hazards? Within risk, hazard, and disaster scholarship, vulnerability science has long encompassed three different but intersecting domains: physical/natural systems (e.g., exposure, intensity, frequency of occurrence), human systems including social systems and built environment (e.g., socio-demographic characteristics of at-risk populations, the degree of urbanization), and local spatial characteristics of places (e.g., location-specific conditions such as proximity to hazardous areas) [31,32]
With the abundance and increasing accessibility of georeferenced big data, vulnerability and environmental sciences are evolving to incorporate new methodologies to handle increasingly complex datasets that describe the complexity of human–environment interactions and the dynamic characteristics of natural hazards [33]. This era of big data has led to advances in vulnerability research in estimating, predicting, and visualizing potential risk or vulnerability to natural hazards using large volumes of data and a variety of data-driven computing approaches [34,35,36,37]. Big data can be defined in a variety of ways depending on the disciplines and subjects being studied. However, there are three components that can be considered the fundamentals of big data termed the “three Vs”: (1) volume—the quantity of data that are collected, stored, and processed; (2) velocity—how fast the data are collected and processed; and (3) variety—the types/sources of data [38,39,40]. This study aimed to highlight the usefulness of the longest track records of the Atlantic hurricane public database in tandem with multiple geospatial data and hurricane modeling techniques in order to identify the most vulnerable areas to hurricanes in a spatially explicit manner.
There has been limited analysis of longitudinal hurricane-related damage in geographic scholarship that applies a variety of geospatial datasets and hurricane modeling techniques. Identifying the spatial extent of historical hurricane damage is crucial to examine the evolving physical and social vulnerability within the at-risk zone. For the purpose of comprehensive vulnerability assessment, this study provides a synoptic view of hurricane vulnerability in the United States on a large geographic scale using storm surge and wind damage modeling for a long period of time (1950–2018) at the national level. The current study does not incorporate inland flooding due to heavy rainfall, since this study relies on the accumulated hurricane events, not a single hurricane event.
Since historical geospatial data of hurricane impacts are seldom available, it is necessary to reconstruct to what extent past and recent hurricanes have affected coastal regions. Figure 1 shows the trajectories of all hurricanes and tropical storms that reached the U.S. East Coast, Florida, and Gulf Coast area during the study period. The hurricane-affected areas are nationwide, and states bordering the Gulf of Mexico and Atlantic Ocean have borne the brunt of the catastrophic hurricane damage [13]. To reflect the full areal extent of the U.S. hurricane coasts, this study includes all hurricanes that made landfall along the Gulf and Atlantic Coasts up until 2018, encompassing a total of 22 states and the District of Columbia. This extensive hurricane modeling is in line with the three Vs of geospatial big data analytics.
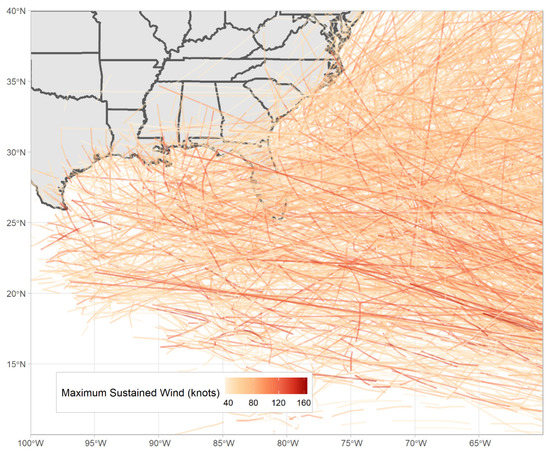
Figure 1.
Historical hurricane and tropical storm tracks along the U.S. Gulf and Atlantic Coasts from 1950 to 2018.
The major data source of this hurricane-related damage modeling is the public Hurricane Database (known as the revised Atlantic hurricane database, HURDAT2). The HURDAT2 is the second-generation hurricane database maintained and updated annually by the U.S. National Oceanic and Atmospheric Administration (NOAA) at the National Hurricane Center (NHC). This dataset can be obtained from the NHC Data Archive (https://www.nhc.noaa.gov/data/, accessed on 1 October 2021), and it contains the best-estimated track records of all historical hurricanes, tropical storms, and subtropical storms of the Atlantic Basin, including the Gulf of Mexico and Caribbean Sea, since 1851 [41,42]. The HURDAT database provides a sufficient temporal resolution with position estimates for every synoptic time (0000, 0600, 1200, and 1800 UTC), and this allows researchers to capture the progress of each storm. Figure 2 presents the synoptic points of all hurricanes and tropical storms in the North Atlantic from 1851 to 2018. Each storm can be identified by its name and identifier number with its six-hourly information on date, time, position that geocodes the center of the storm (latitude and longitude), intensity (i.e., maximum sustained wind in knots), central pressure, and size [41,42,43]. These parameters are used to compute the storm surge heights and wind damage resulting from hurricanes by considering hurricane gust factors.
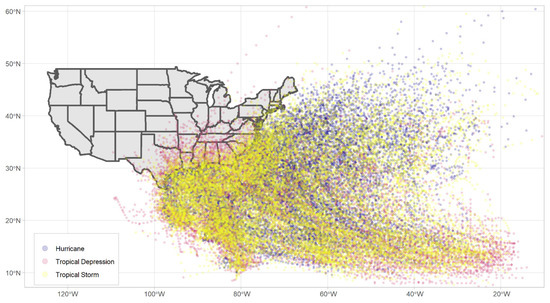
Figure 2.
Synoptic data points of historical hurricanes (1851–2018) of the United States.
Oceanographic and atmospheric conditions also come into play in modeling the water surface caused by hurricanes and storms [44]. Topographic data or digital elevation models (DEM) are crucial in determining storm surge inundation because the shape of the terrain is highly related to how water flows and drains along and off a surface. The primary dataset used in this study was the U.S. Geological Survey (USGS) National Elevation Dataset (NED), which includes seamless elevation data covering the conterminous United States at different spatial resolutions [45]. In this study, the 1/3 arc-second (approximately 10 m) DEM dataset was selected for coastal inundation mapping and can be acquired from the USGS National Map Viewer.
Astronomical tidal information is also required to generate a water surface as an input value in storm surge modeling. The geographic location of tide level stations can be found at the NOAA Tides and Currents website. The SLOSH display program was then used to retrieve the initial water level (i.e., astronomical tide) for each hurricane at the nearby tide gauge station referring to the hurricane path observed 18 h before nearest approach (or landfall) in most storm situations. It is noteworthy to mention that the SLOSH model adopts National Geodetic Vertical Datum of 1929 (NGVD 29) as its vertical datum, meaning it is imperative to transform tidewater level to NGVD for consistent and reliable modeling results [29,46,47]. The description of the main attributes and software information employed in this study is summarized in Table 1.

Table 1.
Geospatial data and software used in this study for hurricane modeling.
2.2. Methods
The majority of damage and loss of life are associated with storm surges and high winds in the wake of hurricanes, and impacts have been unevenly distributed across the U.S. during the past several decades. This study intended to determine the geographic extent of storm surges and wind damage over an extended period of time from 1950 to 2018 to identify the comprehensive locational vulnerability to hurricane impacts. Figure 3 represents the methodological procedures used to obtain an estimate of the overall hurricane-related damage.

Figure 3.
Flowchart for comprehensive hurricane-related damage modeling.
2.2.1. Estimation of Storm Surge Inundation
In an attempt to overcome data scarcity in historical GIS hurricane data, this study adopted a hydrodynamic model, called the Sea, Lake, and Overland Surges from Hurricanes (SLOSH) model, in obtaining the spatial extent and intensity of storm surges. The SLOSH model was used to simulate the storm surges induced by each track over the study period. The SLOSH model is currently being used by the NHC for real-time forecasting of potential hurricane storm surges across the entire seaboard of the United States [10,11,46]. A major advantage of the SLOSH model is its ability to reproduce historical hurricane storm surges based on the HURDAT2 dataset [23,46,48].
The SLOSH model is a two-dimensional numerical coastal model that computes the maximum water heights considering the dynamic flow of water over land and water based on pre-determined grid cells referred to as a basin. Currently, there are 32 basins covering the entirety of the U.S. Atlantic and Gulf of Mexico Coasts, Hawaii, Puerto Rico, Virgin Islands, and the Bahamas (Figure 4). All hurricanes and tropical storms that made landfall along the coastal regions can be modeled with the operational SLOSH basins. If a hurricane impacted a larger extent of the area, multiple basins were considered in the modeling procedure. Depending on the region, the basins have different shapes (mostly polar or hyperbolic/elliptical) composed of thousands of grid cells, and these are one of the primary inputs of the meteorological parameters that must be entered in the modeling process [49]. The closer to the primary area of interest such as a bay or a region immediately adjacent to the coastline, the finer the resolution of the grid cells. Meanwhile, the spatial resolution of the grid cells is coarser in the deep open oceans due to a low significance in simulation. The basins integrate geographical characteristics of the particular area along the coasts that influence storm surges such as topography, shoreline structure, levees, bathymetry of ocean areas, and continental shelves [23,50]. The accuracy of the estimated surge height is known to be within ± 20% of the observed water heights. The model uncertainties can be attributed to several components such as the basin’s spatial resolution, vertical accuracy of terrain data/high water marks, and the meteorological/geophysical parameters resulting from the complexity of hurricane and astronomical tides [10,44,51].
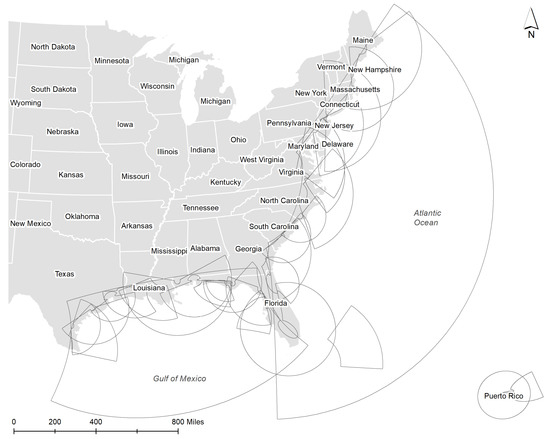
Figure 4.
The spatial extent of operational basins (or grids) in the SLOSH model.
The left side of Figure 3 depicts the overall procedure of storm surge simulation. Modeling storm surges requires the following meteorological parameters as input parameters to generate the wind field that drives the storm surge inundation: storm track positions (i.e., latitude and longitude at 6-h intervals), intensity (i.e., storm central pressure at 6-h intervals), radius of maximum wind (RMW, i.e., size—the distance between the center of a storm and the location where the strongest wind is generated, at 6-h intervals), forward speed, and landfall time [46,52]. The stm.file consists of 13 time points of these input parameters for model operation to describe an hourly progression of the hurricane before and after landfall. Considering these input parameters coupled with a selected basin, the SLOSH model can determine the flow of storm surges across the surface and then estimate the maximum envelope of water in each basin grid during a storm’s life cycle.
The outputs of the SLOSH model consist of three files: (1) the *.rex file is a time-lapsed animation file that contains the simulated water levels at every grid cell over the duration of the storm; (2) the *trt.file is an expansion of the stm.file providing hourly values, resulting in 100 h of input data; and (3) the *.env.file provides the envelope of high water levels. The .rex file can be converted to a shapefile for additional geoprocessing. The SLOSH model does not include the wave components (i.e., astronomical tides or wind-driven wave heights) and antecedent precipitation on top of the surge, and thus the astronomical tides can be added to the model results [10,29,53,54,55]. As a result, the SLOSH model generates time-dependent storm surge water levels at every grid cell at a specific interval of time at each basin. As an example, Figure 5 and Figure 6 show a simulated storm surge height during Hurricane Harvey (2017) based on the SLOSH simulation. The resulting individual storm surge output was compared with the existing SLOSH model from NOAA. The interpolated raster for each hurricane can be further analyzed to generate the final layer that represents the extent of inundation and the flood depth by adding the astronomical tides.
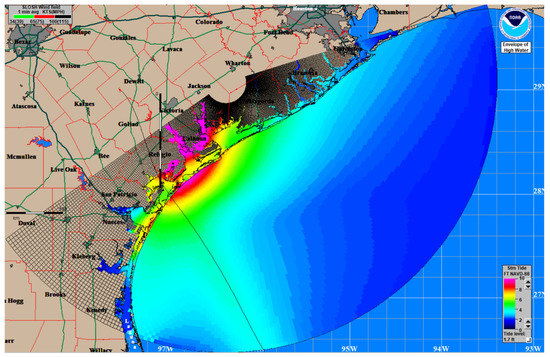
Figure 5.
Hurricane Harvey (2018) storm surge heights simulated by the SLOSH model in the Matagorda Bay (ps2) basin.

Figure 6.
Interpolated storm surge inundation (before conducting additional geoprocessing operations) from Hurricane Harvey (2017).
Spatial analysis can be conducted to derive the inundation extent and the depth of a storm surge using the simulated water height from the SLOSH model and DEM data. The maximum surge water height generated from the SLOSH model can be converted to a GIS file format to create centroids of SLOSH basin outputs and then interpolate water level heights using the natural neighbor method. It is important to note that each dataset refers to a different vertical datum: the SLOSH model output references the National Geodetic Vertical Datum of 1929 (NGVD29); the initial tidewater level refers to mean lower low water (MLLW); the elevation data are based on the North American Vertical Datum of 1988 (NAVD88). All elevations are based on different vertical datums and cannot be directly used to compute storm surge heights. Therefore, it is required to maintain a consistent vertical datum between the estimated storm surge inundation height and the terrain elevation data using a transformation to derive the depth of a storm surge accurately. In this study, Corpscon, Version 6.0 was utilized to conduct vertical conversions between the NGVD 29 and the NAVD 88. To process large amounts of GIS datasets and vector- and raster-based analysis, this study employed batch processing using ArcGIS and R in conjunction.
2.2.2. Estimation of Wind Damage
Strong hurricane winds often cause severe structural damage to infrastructure, residential structures, and commercial structures [21]. This study adopted a meteorological model, HURRECON (Hurricane Reconstruction), which is based on published empirical studies of hurricanes in the New England, Puerto Rico, and Gulf Coasts [29,56,57], in order to reconstruct the intensity of wind damage by each hurricane. The HURRECON model was developed to estimate the basic structure of a storm’s surface wind conditions such as sustained wind velocity, peak gust velocity, and wind direction of movement over a specified surface cover type (water and land). It has been widely applied to study the impact of hurricane wind disturbance on forestry landscapes [56,57,58] and hurricane wind damage assessment [29,59].
As described on the right side of Figure 3, the HURRECON model also uses the meteorological parameters of a storm (i.e., storm track and wind speed) from the HURDAT2 database as input data. The individual hurricane position data (*.pos file, a tab-delimited text file) should contain year, month, day, hour, minute, latitude/longitude, and maximum sustained wind in meters per second (m/s). The model also requires a rectangular geographic file (i.e., 16-bit IDRISI raster file format) to distinguish the land cover type (water or land) in estimating the surface wind speed and direction. The raster grid should be equally divided per cell to produce a more accurate modeling result. The parametric equations are well documented in the literature [29,56,57,60]. The HURRECON model can be implemented in a series of separate programs. First, the HTRK program can be run to create a track file of interpolated input parameters. Next, the HURRECN program can be utilized to estimate wind velocity and direction for a given geographic location. The output from the HURRECON program can then be operated to convert the outputs to Fujita scale damage (Figure 7).
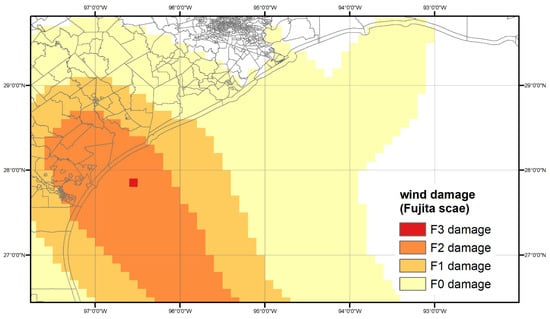
Figure 7.
Simulated wind damage by Hurricane Harvey (2017) using the HURRECON model.
In this model, the predicted wind damage is adjusted for hurricane wind field estimation and then classified into the modified Fujita scale classes (no damage, F0, F1, F2, F3)—originally proposed by Fujita [61] to characterize the wind intensity and damage by tornadoes—by correlating the maximum quarter-mile wind speed with wind damage intensity [56,57,60,61]. The original F-scale (Fujita scale) was devised to assess and categorize actual wind damage by its intensity and area on a wind speed scale, ranging from F0 (light damage in gale-force wind) to F5 (incredible damage). It has been utilized by the U.S. National Weather Service for tornadoes and hurricanes since the 1970s. The F-scale has been recently updated with the improved scale, called the Enhanced Fujita (EF) scale, based on a rating of tornadoes but not applicable to hurricane intensity [62,63]. In response to this, Boose, Foster, and Fluet [60] developed a modified F-scale rating tailored to hurricane damage levels. This modified F-scale was used in this study as opposed to the Saffir–Simpson scale in order to adhere to the model specifications of the HURRECON model.
The modified F-scale was extended to reveal widespread exterior structural damage by hurricane-force wind to buildings, (e.g., damaged roof shingles, broken windows or chimneys, and destruction of buildings), vehicles/infrastructure (e.g., unrooted traffic lights or utility poles, destroyed roads and rails), and the natural environment (e.g., blown down trees). It is ranked on an ordinal scale (F0, F1, F2, and F3) based on sustained wind speed and its corresponding post-hurricane damage level: F0 = 18–25 m/s (minor damage to buildings/trees), F1 = 26–35 m/s (houses unroofed or damaged, and single or isolated groups of trees blown down), F2 = 36–47 m/s(houses unroofed or destroyed and extensive tree blowdowns), and F3 = 48–62 m/s (houses blown down or destroyed, most trees down, and heavy automobiles lifted or overturned). The F-scale is beneficial for broad applications and can be universally applied across regions, since it does not rely on construction practices in a particular area in the United States, such as the International Building Code (IBC) or International Residential Code (IRC) [64].
The HURRECON model can generate the prediction of wind damage for an individual site as a table or for the entire area of interest as an IDRISI raster format (16-bit), which is compatible with TerrSet Geospatial Monitoring and Modeling software (formerly IDRISI). It is required to convert the raster outputs to 32-bit raster images using resampling techniques to be displayed in ArcGIS software. The predicted wind damage by Hurricane Harvey is shown in Figure 7 as an example. The original HURRECON model was written in Pascal language coupled with IDRISI. The model has recently been updated in both the R (HurreconR) and Python (HurreconPython) packages for operating system compatibility, and these packages are available in public repositories of GitHub (https://github.com/hurrecon-model/HurreconR, accessed on 1 October 2021).
The HURRECON model is subject to certain limitations. First, it does not consider non-meteorological factors that could affect wind damage at the local level such as construction materials of residential/commercial buildings, building code changes, and topographic effects. Hence, the results from the model cannot be interpolated to the local level or small geographical areas (e.g., census tracts or Census Block Groups) [29]. Second, the estimated wind model does not take into account the antecedent precipitation, lacking the capacity to model the impact of inland flooding. Given the unit of analysis being studied for wind damage assessment, the model outputs still produce reasonable estimation in spite of its limitations.
3. Results
3.1. Cumulative Hurricane Risk
The modeled results from every hurricane were aggregated to a single unified spatial surface, reflecting the long-term hurricane impacts across the entire coastal areas for decades. The resultant unified geographic extent of all hurricane-related damage is based on 190 hurricanes and tropical storms during the study period from 1950 to 2018, serving as a baseline to examine at-risk populations to hurricane-related damage along the coastal counties in the following section.
Figure 8 represents the coastal regions that have been exposed to the impact of one foot or higher of storm surge since 1950. The result is consistent with the NOAA/National Weather Service/National Hurricane Center Storm Surge Unit’s storm surge inundation map [45]. Storm surge damage is highly localized along coastal areas. Overall, a stretch of the Gulf Coast from South Texas to the Florida Panhandle has borne the brunt of storm surge damage over time. Southeastern Louisiana (especially the Lower Mississippi River Delta region), Alabama, Mississippi, and the northwestern Panhandle of Florida have been hard hit by the most intensive storm surges more than twenty-one times, with the maximum frequency of thirty-nine for the past several decades. Western Louisiana, Southwestern Florida, and West Central Florida have also experienced frequent exposure to storm surge impacts. In the southeastern coastal regions, the Charleston area in South Carolina, the Outer Banks, and the coastal counties near Brunswick, New Hanover, Pender, and Onslow Counties have been affected by storm surges at least eleven times. In contrast, the Mid-Atlantic region has been relatively less affected by storm surge inundation. In particular, the Chesapeake Bay area—especially the southeastern shore of Virginia (Hampton Roads region) and the southern tip of the Delmarva Peninsula—has been flooded by storm surges at least ten times. It is not unusual to observe fairly frequent storm surge inundation in the Eastern Long Island regions (Nassau and Suffolk Counties) and southwestern Connecticut. New England regions have also been subject to coastal inundation for decades. These regions are increasingly becoming more susceptible to hurricane strikes due to climate change and sea level rise [13,65,66].

Figure 8.
Modeled frequency of storm surge inundation of one foot or higher based on hurricanes: (A) The Northeast region; (B) The Southeast region; and (C) The Gulf Coast region.
The HURRECON-modeled results were compiled to show a more complete picture of wind damage for the entirety of the coastal regions on the Fujita scale since 1950 (Figure 9). As hurricanes make landfall along the coast, wind speeds rapidly weaken due to the higher frictional effects of land surfaces and a lack of moisture and latent heat energy from the ocean [67]. Occasionally, hurricanes can travel hundreds of miles deep into the interior counties after landfall, intensifying their power. Hence, the areas affected by hurricane winds are not just limited to the immediate vicinity of coastal regions but also areas further inland.
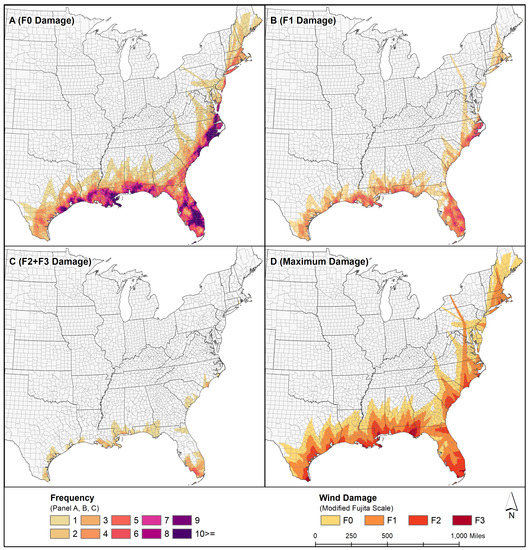
Figure 9.
Modeled wind damage frequency and intensity from 1950 to 2018: (A) the spatial extent of F0 wind damage (minor damage to buildings/trees); (B) F1 wind damage (houses damaged, and single or isolated groups of trees blown down); (C) F2 wind damage (houses unroofed or destroyed and extensive tree blowdowns) and F3 wind damage (houses blown down or destroyed, most trees down, and heavy automobiles lifted or overturned); (D) cumulative hurricane wind damage.
Panel A in Figure 9 shows the spatial extent of hurricane risk in which a total of 764 counties have experienced F0 wind damage (the loss of leaves and branches) over time, stretching from Southeast Texas to the far stretches of Maine. The counties within 100 miles of the coastline have been exposed to F0 wind strengths more than five times. Panel B reveals the areal extent of F1 damage (scattered blowdowns), and 455 counties have been exposed to F1-strength wind forces. As can be seen from Panel C, the areas exposed to F2 or F3 (extensive blowdowns) wind strengths are concentrated along the coastal regions of North Carolina, South Florida, and the Gulf of Mexico. As expected, F0- and F1-intensity winds traveled further inland compared to F2- and F3-scale winds that are more localized along the coastline (Panel D).
The areal extent of hurricane-driven storm surge is geographically concentrated along the coastal shoreline counties, whereas hurricane winds tend to affect the inland areas to a larger extent, penetrating deep into the inland areas of the United States. This is more apparent in northeastern states. A previous study showed that hurricanes that move north along the Atlantic Coast tend to have greater forward speed than hurricanes making landfall along the southern states due to the interaction of northern air masses, leading to greater inland penetration and, consequentially, higher damage impacts [68]. In comparison with the wind speed map defined by the American Society of Civil Engineers (ASCE) and the previous study by Logan and Xu [29] for the Gulf Coast region, this generalized damage boundary from storm surge and hurricane-force wind damage demonstrates similar findings, providing validation to the SLOSH and HURRECON modeling performed in this study.
3.2. At-Risk Populations in the Hurrican-Prone Coastal Counties
Based on the modeling of hurricane-related damage, this study defines “hurricane-prone coastal counties” as counties that are exposed to one form of hurricane damage, as shown in Figure 10. The modeled outputs of all hurricanes were aggregated into a singular geographic area to represent long-term historic cumulative damage over the past six decades. Combining the spatial extent of hurricane-damaged areas of F0, F1, F2, and F3 winds (Figure 10A) and storm surges (Figure 10B), the spatial coverage of this study area consists of 775 counties over 22 states (Figure 10C). The list of coastal counties defined in this study is set out in Appendix A. The areal extent defined in this study through hurricane modeling is similar to the coastal counties defined by Ache et al. [69] and Marsooli et al. [70], validating the result. However, the modeled output presents a more detailed profile of the affected counties, encompassing inland counties exposed to historical hurricane wind penetrations. This was used to describe the at-risk coastal populations susceptible to hurricane hazards in the United States.
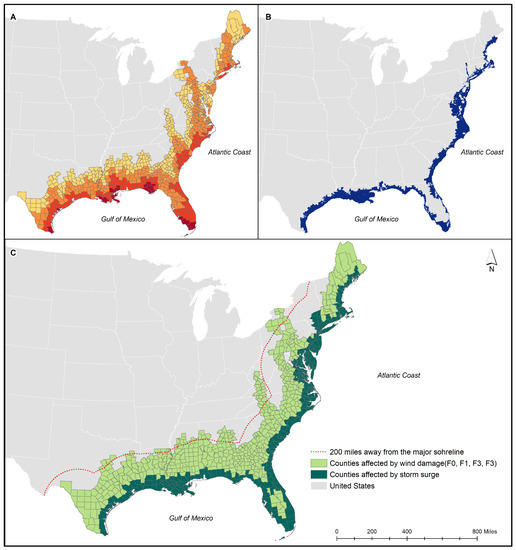
Figure 10.
(A) The coastal counties affected by wind damage according to the Fujita scale (F0, F1, F2, and F3); (B) the coastal counties affected by storm surges; (C) the 775 hurricane-prone coastal counties defined in this study.
The aggregated geographic extent of all hurricane-related damage shows a generalized and standardized pattern, with no seasonal or random variation across time and space [29]. The affected coastal counties in the Gulf Coast cover the majority of counties that are affected by hurricanes, up to approximately 200 miles from coastal shorelines. Meanwhile, the affected coastal counties of the Atlantic Coast are located up to 400 miles from the coast, reaching further inland than the Gulf Coast. The hurricane-prone coastal counties are geographically restricted to the Gulf of Mexico coastline and the eastern Atlantic Coast of the United States (i.e., the North Atlantic Basin region), excluding the Pacific Coast and the Great Lakes region, providing a baseline for describing the human settlement of the hurricane-impacted coastal shorelines [16,69,71].
To supplement this analysis, this study further examined how many people have been living in residential areas in the U.S. hurricane coastal counties from 1970 to 2018 using the U.S. Decennial Census (1950, 1960) and the U.S. County Intercensal Datasets (1970–2018) in conjunction with the national land use/land cover data. To determine the number of people within each hurricane-affected zone, this study first calculated the percentage of developed/residential areas in each county/census tract that have been affected by wind damage and storm surges (i.e., damage fraction hereafter) by applying zonal analysis operations. The product of the damage fraction of storm surge and wind damage with the total population counts produced the number of at-risk populations exposed to cumulative hurricane damage over the decades. This filtered areal weighting interpolation approach was adopted to disaggregate total populations to a target area—in this case, hurricane-affected zones—on the basis of the areal extent of storm surge damage and wind damage (measured by the Fujita scale—F0, F1, F2, and F3) [72,73,74].
The coastal counties are more overcrowded than the nation as a whole, and they are expected to grow in the future [16]. The total number of people living in coastal areas was 73 million in 1970, growing by a total of 100 million people between 1970 and 2000 (Figure 11). Although the population growth rate consistently declined after 2000, along with the national trend, there was a 63% increase in the coastal population from 1970 to 2018, exceeding 119 million in 2018. The population density of coastal counties is substantially greater than that of inland counties [16,75]. Coastal populations are facing multiple threats such as climate change and coastal hazards, exposing 36.5% of the U.S. total population to increasingly vulnerable situations (Figure 12). Along with rapid population growth and an economic construction boom, the coastal populations have been racially diversified, thereby further exacerbating their social vulnerability to hurricane hazards in the coastal counties over time [13,76].
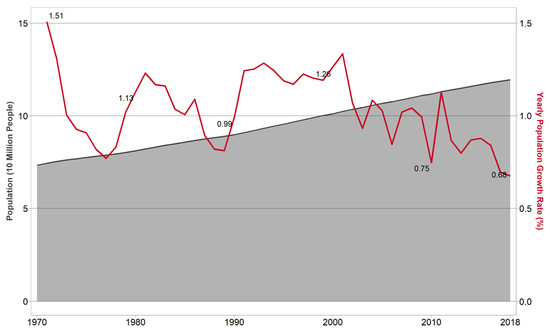
Figure 11.
The population trend of the coastal counties and growth rate (1970–2018).

Figure 12.
The percentage of the total U.S. population living in residential areas in the hurricane-prone coastal counties (1970–2018).
Figure 13 presents how many people have been exposed to hurricane-related damage in absolute terms. It is apparent that the total population has continuously increased within each hurricane-affected area from 1950 to 2018. Wind damage is separated into different categories based on intensity (i.e., F0, F1, F2, and F3). While some of this growth might be due to the national trend, there is a higher exponential growth trend in F0 and F1 areas than the national trend. Approximately 165 million people are affected by some degree of wind damage during the study period.
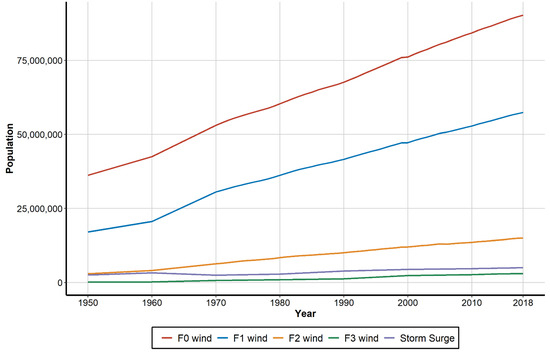
Figure 13.
Total population exposed to hurricane-related damage in residential areas in the hurricane-prone coastal counties by different hurricane damage categories (1950–2018).
Generally, as hurricanes make landfall along the coast, wind speeds rapidly weaken due to the higher frictional effects of land surfaces and a lack of moisture and latent heat energy from the ocean [67]. However, tropical storms and hurricanes can travel hundreds of miles deep into interior counties after landfall, and the remnants of hurricanes may occasionally intensify or maintain their power for an extended period of time, possibly due to various physical processes and storm dynamics [77]. For instance, as seen from Hurricane Sandy, when a low-pressure storm system encounters the polar jet stream in the mid-latitudes, strong temperature gradients occur, and this may re-intensify its strength after making landfall. This process is known as “baroclinic enhancement”. In addition, land surface characteristics (e.g., soil water content, vegetation types, land use, land cover) can play a major role in maintaining a tropical cyclone’s intensity over land. Wet ground or soil with abundant moisture after precipitation events can be a latent source, providing enough heat energy to the storm (i.e., brown ocean effect) [78,79]. Therefore, the affected areas are not just limited to the immediate vicinity of coastal regions but also extend hundreds of miles from the immediate coastal shorelines (Figure 10).
In contrast, storm surge damage and F3 wind are highly localized along coastal areas, as shown in Figure 10. From the data in Figure 13, we can see that 5 million people resided in the residential areas that are affected by storm surge damage, and 3 million people resided in high-intensity wind (F3 scale) areas, as of 2018. To summarize, the overall demographic trends within hurricane-impacted areas reveal that the coastal populations are faster growing than the national average, and this growth puts more people at greater risk of hurricane hazards. This poses a challenge to policymakers as they need to understand a more complex population in order to make more informed decisions in mitigating coastal vulnerability to hurricane hazards.
4. Discussion
Hurricanes pose the greatest natural risk of damage to the United States’ hurricane coasts and society [13]. Physical or locational vulnerability can be assessed based on the impacts, magnitude, and frequency of natural hazards, and geographical proximity to the source of natural hazards [22,29,80]. Hurricanes tend to occur at certain geographical locations, and the general patterns of occurrence are less likely to change in the future. Therefore, estimating and representing the cumulative hurricane patterns can offer a useful means to assess current and future hurricane risk. Due to the scarcity of data regarding historical hurricane-impacted areas, this study sought to determine the spatial extent and intensity of hurricane wind and storm surge damage of all hurricanes that made landfall along America’s hurricane coasts from 1950 to 2018 [13]. Both the spatial extent and intensity of all hurricanes were estimated by utilizing geospatial big data datasets. The extensive results of the hurricane modeling were aggregated into a single surface, representing the longitudinal risk of hurricanes. As a result, 775 counties were found to comprise the hurricane at-risk zones that have experienced at least one instance of hurricane damage over the last six decades. Historical hurricanes that have affected the Gulf and Atlantic coastal areas revealed that storm surge damage in these areas extends up to approximately 41,000 km2, and the largest extent of wind damage (F0) extends to approximately 1,300,000 km2, in the conterminous United States.
This project is the first comprehensive investigation of hurricane vulnerability encompassing the Atlantic and Gulf Coasts stretching from Texas to Maine. The current study proposed the geographical extent of 775 hurricane-prone coastal counties that border the Gulf of Mexico and the eastern Atlantic Coast of the United States, excluding the Pacific Coast (Appendix A). By integrating the past and recent hurricane damage over long periods of time, the results delineate the zones at a high risk of hurricanes more accurately than arbitrarily defining the study areas. This delineation can be used as a tool in assessing coastal population vulnerability by federal agencies and researchers. For instance, the spatially explicit hurricane-prone regions can assist policymakers in developing targeted interventions for the national flood insurance program and coastal wind pool insurance. The estimation of hurricane wind was based on the same parameters used in a previous empirical study that modeled historical hurricanes along the Gulf Coast [29]. Different parameters may result in more accurate estimations for storms that made landfall on the Atlantic Coast.
The population density of coastal counties is denser than the nation as a whole, and the populations in these counties are expected to grow in the future. Along with rapid population growth and an economic construction boom, the coastal populations have been racially diversified, thereby further exacerbating the potential social impact of hurricane hazards in the coastal counties [13,16,76]. Thus, based on the geographic extent of hurricane at-risk zones and land use data, this study performed zonal analysis to further examine how many coastal populations are exposed to the hurricane damage categories—storm surge damage and F0/F1/F2/F3 wind damage—within the residential areas. The findings from this study provide a fundamental basis for understanding the exposure of at-risk populations to hurricane-related damage within the coastal counties at a national scale. The resulting output of the hurricane-prone coastal counties also opens the potential to further examine the specific demographic characteristics of the at-risk populations, allowing for a further assessment of social vulnerability in these areas.
To provide a complete picture of place-based and population vulnerability within the hurricane at-risk areas, future studies should take into account more detailed demographic variables such as race/ethnicity, age groups, and income level. Exploring the demographic changes within the hurricane at-risk areas was purely descriptive; it was not possible to determine a causal relationship between long-term hurricane damage and population change. This study did not evaluate the hurricane-forced internal or intra-regional residential displacement, either temporarily or permanently, associated with post-disaster recovery processes and community resilience to these hurricane hazards. The spatial patterns of hurricane-induced residential mobility and its mechanism remain to be elucidated for further investigation. Future studies need to examine the links between the impacts of hurricane-related damage on local population change based on empirical statistical analysis and mixed method approaches more closely.
Funding
This research received no external funding.
Data Availability Statement
The data used in the present study are publicly available on the website of the U.S. National Oceanic and Atmospheric Administration (NOAA) National Hurricane Center (NHC), https://www.nhc.noaa.gov/data/, accessed on 1 October 2021. The HURRECON model for estimating hurricane wind speed, direction, and damage is available at the Environmental Data Initiative (EDI) Data Portal (https://doi.org/10.6073/pasta/0878074e6c87ec8b43cb56601ff00472, accessed on 16 September 2021).
Acknowledgments
This research was supported by the School Research Committee and School of Geography, Politics and Sociology at Newcastle University for publication. The author would like to thank to anonymous reviewers for their insightful comments and suggestions on the first version of this paper. The author also would like to express her gratitude to the Department of Geography at the University of Wisconsin-Milwaukee for their encouragement and support at the earlier stages of this project. The author has read and agreed to the published version of the manuscript.
Conflicts of Interest
The author declares no conflict of interest.
Appendix A. Hurricane-Prone Coastal Counties (n = 775) along the U.S. Atlantic and Gulf Coasts Defined in this Study
| FIPS | Geography | FIPS | Geography |
| 01001 | Autauga County, Alabama | 01123 | Tallapoosa County, Alabama |
| 01003 | Baldwin County, Alabama | 01125 | Tuscaloosa County, Alabama |
| 01005 | Barbour County, Alabama | 01127 | Walker County, Alabama |
| 01007 | Bibb County, Alabama | 01129 | Washington County, Alabama |
| 01011 | Bullock County, Alabama | 01131 | Wilcox County, Alabama |
| 01013 | Butler County, Alabama | 09001 | Fairfield County, Connecticut |
| 01015 | Calhoun County, Alabama | 09003 | Hartford County, Connecticut |
| 01017 | Chambers County, Alabama | 09005 | Litchfield County, Connecticut |
| 01019 | Cherokee County, Alabama | 09007 | Middlesex County, Connecticut |
| 01021 | Chilton County, Alabama | 09009 | New Haven County, Connecticut |
| 01023 | Choctaw County, Alabama | 09011 | New London County, Connecticut |
| 01025 | Clarke County, Alabama | 09013 | Tolland County, Connecticut |
| 01027 | Clay County, Alabama | 09015 | Windham County, Connecticut |
| 01029 | Cleburne County, Alabama | 10001 | Kent County, Delaware |
| 01031 | Coffee County, Alabama | 10003 | New Castle County, Delaware |
| 01035 | Conecuh County, Alabama | 10005 | Sussex County, Delaware |
| 01037 | Coosa County, Alabama | 11001 | District of Columbia, District of Columbia |
| 01039 | Covington County, Alabama | 12001 | Alachua County, Florida |
| 01041 | Crenshaw County, Alabama | 12003 | Baker County, Florida |
| 01045 | Dale County, Alabama | 12005 | Bay County, Florida |
| 01047 | Dallas County, Alabama | 12007 | Bradford County, Florida |
| 01051 | Elmore County, Alabama | 12009 | Brevard County, Florida |
| 01053 | Escambia County, Alabama | 12011 | Broward County, Florida |
| 01055 | Etowah County, Alabama | 12013 | Calhoun County, Florida |
| 01057 | Fayette County, Alabama | 12015 | Charlotte County, Florida |
| 01061 | Geneva County, Alabama | 12017 | Citrus County, Florida |
| 01063 | Greene County, Alabama | 12019 | Clay County, Florida |
| 01065 | Hale County, Alabama | 12021 | Collier County, Florida |
| 01067 | Henry County, Alabama | 12023 | Columbia County, Florida |
| 01069 | Houston County, Alabama | 12027 | DeSoto County, Florida |
| 01075 | Lamar County, Alabama | 12029 | Dixie County, Florida |
| 01081 | Lee County, Alabama | 12031 | Duval County, Florida |
| 01085 | Lowndes County, Alabama | 12033 | Escambia County, Florida |
| 01087 | Macon County, Alabama | 12035 | Flagler County, Florida |
| 01091 | Marengo County, Alabama | 12037 | Franklin County, Florida |
| 01093 | Marion County, Alabama | 12039 | Gadsden County, Florida |
| 01097 | Mobile County, Alabama | 12041 | Gilchrist County, Florida |
| 01099 | Monroe County, Alabama | 12043 | Glades County, Florida |
| 01101 | Montgomery County, Alabama | 12045 | Gulf County, Florida |
| 01105 | Perry County, Alabama | 12047 | Hamilton County, Florida |
| 01107 | Pickens County, Alabama | 12049 | Hardee County, Florida |
| 01109 | Pike County, Alabama | 12051 | Hendry County, Florida |
| 01111 | Randolph County, Alabama | 12053 | Hernando County, Florida |
| 01113 | Russell County, Alabama | 12055 | Highlands County, Florida |
| 01119 | Sumter County, Alabama | 12057 | Hillsborough County, Florida |
| 01121 | Talladega County, Alabama | 12059 | Holmes County, Florida |
| 12061 | Indian River County, Florida | 13031 | Bulloch County, Georgia |
| 12063 | Jackson County, Florida | 13033 | Burke County, Georgia |
| 12065 | Jefferson County, Florida | 13037 | Calhoun County, Georgia |
| 12067 | Lafayette County, Florida | 13039 | Camden County, Georgia |
| 12069 | Lake County, Florida | 13043 | Candler County, Georgia |
| 12071 | Lee County, Florida | 13045 | Carroll County, Georgia |
| 12073 | Leon County, Florida | 13049 | Charlton County, Georgia |
| 12075 | Levy County, Florida | 13051 | Chatham County, Georgia |
| 12077 | Liberty County, Florida | 13053 | Chattahoochee County, Georgia |
| 12079 | Madison County, Florida | 13061 | Clay County, Georgia |
| 12081 | Manatee County, Florida | 13065 | Clinch County, Georgia |
| 12083 | Marion County, Florida | 13069 | Coffee County, Georgia |
| 12085 | Martin County, Florida | 13071 | Colquitt County, Georgia |
| 12086 | Miami-Dade County, Florida | 13073 | Columbia County, Georgia |
| 12087 | Monroe County, Florida | 13075 | Cook County, Georgia |
| 12089 | Nassau County, Florida | 13077 | Coweta County, Georgia |
| 12091 | Okaloosa County, Florida | 13079 | Crawford County, Georgia |
| 12093 | Okeechobee County, Florida | 13081 | Crisp County, Georgia |
| 12095 | Orange County, Florida | 13087 | Decatur County, Georgia |
| 12097 | Osceola County, Florida | 13091 | Dodge County, Georgia |
| 12099 | Palm Beach County, Florida | 13093 | Dooly County, Georgia |
| 12101 | Pasco County, Florida | 13095 | Dougherty County, Georgia |
| 12103 | Pinellas County, Florida | 13097 | Douglas County, Georgia |
| 12105 | Polk County, Florida | 13099 | Early County, Georgia |
| 12107 | Putnam County, Florida | 13101 | Echols County, Georgia |
| 12109 | St. Johns County, Florida | 13103 | Effingham County, Georgia |
| 12111 | St. Lucie County, Florida | 13107 | Emanuel County, Georgia |
| 12115 | Sarasota County, Florida | 13109 | Evans County, Georgia |
| 12117 | Seminole County, Florida | 13125 | Glascock County, Georgia |
| 12119 | Sumter County, Florida | 13127 | Glynn County, Georgia |
| 12121 | Suwannee County, Florida | 13131 | Grady County, Georgia |
| 12123 | Taylor County, Florida | 13143 | Haralson County, Georgia |
| 12125 | Union County, Florida | 13145 | Harris County, Georgia |
| 12127 | Volusia County, Florida | 13149 | Heard County, Georgia |
| 12129 | Wakulla County, Florida | 13153 | Houston County, Georgia |
| 12131 | Walton County, Florida | 13155 | Irwin County, Georgia |
| 12133 | Washington County, Florida | 13161 | Jeff Davis County, Georgia |
| 13001 | Appling County, Georgia | 13163 | Jefferson County, Georgia |
| 13003 | Atkinson County, Georgia | 13165 | Jenkins County, Georgia |
| 13005 | Bacon County, Georgia | 13167 | Johnson County, Georgia |
| 13007 | Baker County, Georgia | 13173 | Lanier County, Georgia |
| 13017 | Ben Hill County, Georgia | 13175 | Laurens County, Georgia |
| 13019 | Berrien County, Georgia | 13177 | Lee County, Georgia |
| 13021 | Bibb County, Georgia | 13179 | Liberty County, Georgia |
| 13023 | Bleckley County, Georgia | 13183 | Long County, Georgia |
| 13025 | Brantley County, Georgia | 13185 | Lowndes County, Georgia |
| 13027 | Brooks County, Georgia | 13189 | McDuffie County, Georgia |
| 13029 | Bryan County, Georgia | 13191 | McIntosh County, Georgia |
| 13193 | Macon County, Georgia | 22023 | Cameron Parish, Louisiana |
| 13197 | Marion County, Georgia | 22025 | Catahoula Parish, Louisiana |
| 13201 | Miller County, Georgia | 22029 | Concordia Parish, Louisiana |
| 13205 | Mitchell County, Georgia | 22031 | De Soto Parish, Louisiana |
| 13209 | Montgomery County, Georgia | 22033 | East Baton Rouge Parish, Louisiana |
| 13215 | Muscogee County, Georgia | 22035 | East Carroll Parish, Louisiana |
| 13223 | Paulding County, Georgia | 22037 | East Feliciana Parish, Louisiana |
| 13225 | Peach County, Georgia | 22039 | Evangeline Parish, Louisiana |
| 13229 | Pierce County, Georgia | 22041 | Franklin Parish, Louisiana |
| 13233 | Polk County, Georgia | 22043 | Grant Parish, Louisiana |
| 13235 | Pulaski County, Georgia | 22045 | Iberia Parish, Louisiana |
| 13239 | Quitman County, Georgia | 22047 | Iberville Parish, Louisiana |
| 13243 | Randolph County, Georgia | 22049 | Jackson Parish, Louisiana |
| 13245 | Richmond County, Georgia | 22051 | Jefferson Parish, Louisiana |
| 13249 | Schley County, Georgia | 22053 | Jefferson Davis Parish, Louisiana |
| 13251 | Screven County, Georgia | 22055 | Lafayette Parish, Louisiana |
| 13253 | Seminole County, Georgia | 22057 | Lafourche Parish, Louisiana |
| 13259 | Stewart County, Georgia | 22059 | La Salle Parish, Louisiana |
| 13261 | Sumter County, Georgia | 22063 | Livingston Parish, Louisiana |
| 13267 | Tattnall County, Georgia | 22065 | Madison Parish, Louisiana |
| 13269 | Taylor County, Georgia | 22067 | Morehouse Parish, Louisiana |
| 13271 | Telfair County, Georgia | 22069 | Natchitoches Parish, Louisiana |
| 13273 | Terrell County, Georgia | 22071 | Orleans Parish, Louisiana |
| 13275 | Thomas County, Georgia | 22073 | Ouachita Parish, Louisiana |
| 13277 | Tift County, Georgia | 22075 | Plaquemines Parish, Louisiana |
| 13279 | Toombs County, Georgia | 22077 | Pointe Coupee Parish, Louisiana |
| 13283 | Treutlen County, Georgia | 22079 | Rapides Parish, Louisiana |
| 13285 | Troup County, Georgia | 22081 | Red River Parish, Louisiana |
| 13287 | Turner County, Georgia | 22083 | Richland Parish, Louisiana |
| 13289 | Twiggs County, Georgia | 22085 | Sabine Parish, Louisiana |
| 13299 | Ware County, Georgia | 22087 | St. Bernard Parish, Louisiana |
| 13301 | Warren County, Georgia | 22089 | St. Charles Parish, Louisiana |
| 13303 | Washington County, Georgia | 22091 | St. Helena Parish, Louisiana |
| 13305 | Wayne County, Georgia | 22093 | St. James Parish, Louisiana |
| 13307 | Webster County, Georgia | 22095 | St. John the Baptist Parish, Louisiana |
| 13309 | Wheeler County, Georgia | 22097 | St. Landry Parish, Louisiana |
| 13315 | Wilcox County, Georgia | 22099 | St. Martin Parish, Louisiana |
| 13319 | Wilkinson County, Georgia | 22101 | St. Mary Parish, Louisiana |
| 13321 | Worth County, Georgia | 22103 | St. Tammany Parish, Louisiana |
| 22001 | Acadia Parish, Louisiana | 22105 | Tangipahoa Parish, Louisiana |
| 22003 | Allen Parish, Louisiana | 22107 | Tensas Parish, Louisiana |
| 22005 | Ascension Parish, Louisiana | 22109 | Terrebonne Parish, Louisiana |
| 22007 | Assumption Parish, Louisiana | 22111 | Union Parish, Louisiana |
| 22009 | Avoyelles Parish, Louisiana | 22113 | Vermilion Parish, Louisiana |
| 22011 | Beauregard Parish, Louisiana | 22115 | Vernon Parish, Louisiana |
| 22013 | Bienville Parish, Louisiana | 22117 | Washington Parish, Louisiana |
| 22019 | Calcasieu Parish, Louisiana | 22121 | West Baton Rouge Parish, Louisiana |
| 22021 | Caldwell Parish, Louisiana | 22123 | West Carroll Parish, Louisiana |
| 22125 | West Feliciana Parish, Louisiana | 25017 | Middlesex County, Massachusetts |
| 22127 | Winn Parish, Louisiana | 25019 | Nantucket County, Massachusetts |
| 23001 | Androscoggin County, Maine | 25021 | Norfolk County, Massachusetts |
| 23003 | Aroostook County, Maine | 25023 | Plymouth County, Massachusetts |
| 23005 | Cumberland County, Maine | 25025 | Suffolk County, Massachusetts |
| 23007 | Franklin County, Maine | 25027 | Worcester County, Massachusetts |
| 23009 | Hancock County, Maine | 28001 | Adams County, Mississippi |
| 23011 | Kennebec County, Maine | 28005 | Amite County, Mississippi |
| 23013 | Knox County, Maine | 28007 | Attala County, Mississippi |
| 23015 | Lincoln County, Maine | 28015 | Carroll County, Mississippi |
| 23017 | Oxford County, Maine | 28019 | Choctaw County, Mississippi |
| 23019 | Penobscot County, Maine | 28021 | Claiborne County, Mississippi |
| 23021 | Piscataquis County, Maine | 28023 | Clarke County, Mississippi |
| 23023 | Sagadahoc County, Maine | 28025 | Clay County, Mississippi |
| 23025 | Somerset County, Maine | 28029 | Copiah County, Mississippi |
| 23027 | Waldo County, Maine | 28031 | Covington County, Mississippi |
| 23029 | Washington County, Maine | 28035 | Forrest County, Mississippi |
| 23031 | York County, Maine | 28037 | Franklin County, Mississippi |
| 24001 | Allegany County, Maryland | 28039 | George County, Mississippi |
| 24003 | Anne Arundel County, Maryland | 28041 | Greene County, Mississippi |
| 24005 | Baltimore County, Maryland | 28043 | Grenada County, Mississippi |
| 24009 | Calvert County, Maryland | 28045 | Hancock County, Mississippi |
| 24011 | Caroline County, Maryland | 28047 | Harrison County, Mississippi |
| 24013 | Carroll County, Maryland | 28049 | Hinds County, Mississippi |
| 24015 | Cecil County, Maryland | 28051 | Holmes County, Mississippi |
| 24017 | Charles County, Maryland | 28053 | Humphreys County, Mississippi |
| 24019 | Dorchester County, Maryland | 28059 | Jackson County, Mississippi |
| 24021 | Frederick County, Maryland | 28061 | Jasper County, Mississippi |
| 24023 | Garrett County, Maryland | 28063 | Jefferson County, Mississippi |
| 24025 | Harford County, Maryland | 28065 | Jefferson Davis County, Mississippi |
| 24027 | Howard County, Maryland | 28067 | Jones County, Mississippi |
| 24029 | Kent County, Maryland | 28069 | Kemper County, Mississippi |
| 24031 | Montgomery County, Maryland | 28073 | Lamar County, Mississippi |
| 24033 | Prince George's County, Maryland | 28075 | Lauderdale County, Mississippi |
| 24035 | Queen Anne's County, Maryland | 28077 | Lawrence County, Mississippi |
| 24037 | St. Mary's County, Maryland | 28079 | Leake County, Mississippi |
| 24039 | Somerset County, Maryland | 28083 | Leflore County, Mississippi |
| 24041 | Talbot County, Maryland | 28085 | Lincoln County, Mississippi |
| 24045 | Wicomico County, Maryland | 28087 | Lowndes County, Mississippi |
| 24047 | Worcester County, Maryland | 28089 | Madison County, Mississippi |
| 25001 | Barnstable County, Massachusetts | 28091 | Marion County, Mississippi |
| 25003 | Berkshire County, Massachusetts | 28097 | Montgomery County, Mississippi |
| 25005 | Bristol County, Massachusetts | 28099 | Neshoba County, Mississippi |
| 25007 | Dukes County, Massachusetts | 28101 | Newton County, Mississippi |
| 25009 | Essex County, Massachusetts | 28103 | Noxubee County, Mississippi |
| 25011 | Franklin County, Massachusetts | 28105 | Oktibbeha County, Mississippi |
| 25013 | Hampden County, Massachusetts | 28109 | Pearl River County, Mississippi |
| 25015 | Hampshire County, Massachusetts | 28111 | Perry County, Mississippi |
| 28113 | Pike County, Mississippi | 36039 | Greene County, New York |
| 28121 | Rankin County, Mississippi | 36047 | Kings County, New York |
| 28123 | Scott County, Mississippi | 36051 | Livingston County, New York |
| 28127 | Simpson County, Mississippi | 36055 | Monroe County, New York |
| 28129 | Smith County, Mississippi | 36059 | Nassau County, New York |
| 28131 | Stone County, Mississippi | 36061 | New York County, New York |
| 28147 | Walthall County, Mississippi | 36071 | Orange County, New York |
| 28149 | Warren County, Mississippi | 36073 | Orleans County, New York |
| 28153 | Wayne County, Mississippi | 36079 | Putnam County, New York |
| 28157 | Wilkinson County, Mississippi | 36081 | Queens County, New York |
| 28159 | Winston County, Mississippi | 36085 | Richmond County, New York |
| 28161 | Yalobusha County, Mississippi | 36087 | Rockland County, New York |
| 28163 | Yazoo County, Mississippi | 36101 | Steuben County, New York |
| 33001 | Belknap County, New Hampshire | 36103 | Suffolk County, New York |
| 33003 | Carroll County, New Hampshire | 36111 | Ulster County, New York |
| 33005 | Cheshire County, New Hampshire | 36119 | Westchester County, New York |
| 33007 | Coos County, New Hampshire | 37003 | Alexander County, North Carolina |
| 33009 | Grafton County, New Hampshire | 37005 | Alleghany County, North Carolina |
| 33011 | Hillsborough County, New Hampshire | 37007 | Anson County, North Carolina |
| 33013 | Merrimack County, New Hampshire | 37009 | Ashe County, North Carolina |
| 33015 | Rockingham County, New Hampshire | 37013 | Beaufort County, North Carolina |
| 33017 | Strafford County, New Hampshire | 37015 | Bertie County, North Carolina |
| 33019 | Sullivan County, New Hampshire | 37017 | Bladen County, North Carolina |
| 34001 | Atlantic County, New Jersey | 37019 | Brunswick County, North Carolina |
| 34003 | Bergen County, New Jersey | 37023 | Burke County, North Carolina |
| 34005 | Burlington County, New Jersey | 37025 | Cabarrus County, North Carolina |
| 34007 | Camden County, New Jersey | 37027 | Caldwell County, North Carolina |
| 34009 | Cape May County, New Jersey | 37029 | Camden County, North Carolina |
| 34011 | Cumberland County, New Jersey | 37031 | Carteret County, North Carolina |
| 34013 | Essex County, New Jersey | 37035 | Catawba County, North Carolina |
| 34015 | Gloucester County, New Jersey | 37037 | Chatham County, North Carolina |
| 34017 | Hudson County, New Jersey | 37041 | Chowan County, North Carolina |
| 34019 | Hunterdon County, New Jersey | 37045 | Cleveland County, North Carolina |
| 34021 | Mercer County, New Jersey | 37047 | Columbus County, North Carolina |
| 34023 | Middlesex County, New Jersey | 37049 | Craven County, North Carolina |
| 34025 | Monmouth County, New Jersey | 37051 | Cumberland County, North Carolina |
| 34029 | Ocean County, New Jersey | 37053 | Currituck County, North Carolina |
| 34031 | Passaic County, New Jersey | 37055 | Dare County, North Carolina |
| 34033 | Salem County, New Jersey | 37061 | Duplin County, North Carolina |
| 34035 | Somerset County, New Jersey | 37063 | Durham County, North Carolina |
| 34039 | Union County, New Jersey | 37065 | Edgecombe County, North Carolina |
| 36003 | Allegany County, New York | 37069 | Franklin County, North Carolina |
| 36005 | Bronx County, New York | 37071 | Gaston County, North Carolina |
| 36009 | Cattaraugus County, New York | 37073 | Gates County, North Carolina |
| 36013 | Chautauqua County, New York | 37077 | Granville County, North Carolina |
| 36021 | Columbia County, New York | 37079 | Greene County, North Carolina |
| 36027 | Dutchess County, New York | 37083 | Halifax County, North Carolina |
| 36037 | Genesee County, New York | 37085 | Harnett County, North Carolina |
| 37091 | Hertford County, North Carolina | 42035 | Clinton County, Pennsylvania |
| 37093 | Hoke County, North Carolina | 42041 | Cumberland County, Pennsylvania |
| 37095 | Hyde County, North Carolina | 42043 | Dauphin County, Pennsylvania |
| 37097 | Iredell County, North Carolina | 42045 | Delaware County, Pennsylvania |
| 37101 | Johnston County, North Carolina | 42047 | Elk County, Pennsylvania |
| 37103 | Jones County, North Carolina | 42051 | Fayette County, Pennsylvania |
| 37105 | Lee County, North Carolina | 42055 | Franklin County, Pennsylvania |
| 37107 | Lenoir County, North Carolina | 42057 | Fulton County, Pennsylvania |
| 37109 | Lincoln County, North Carolina | 42061 | Huntingdon County, Pennsylvania |
| 37117 | Martin County, North Carolina | 42067 | Juniata County, Pennsylvania |
| 37119 | Mecklenburg County, North Carolina | 42071 | Lancaster County, Pennsylvania |
| 37125 | Moore County, North Carolina | 42075 | Lebanon County, Pennsylvania |
| 37127 | Nash County, North Carolina | 42081 | Lycoming County, Pennsylvania |
| 37129 | New Hanover County, North Carolina | 42083 | McKean County, Pennsylvania |
| 37131 | Northampton County, North Carolina | 42087 | Mifflin County, Pennsylvania |
| 37133 | Onslow County, North Carolina | 42091 | Montgomery County, Pennsylvania |
| 37135 | Orange County, North Carolina | 42097 | Northumberland County, Pennsylvania |
| 37137 | Pamlico County, North Carolina | 42099 | Perry County, Pennsylvania |
| 37139 | Pasquotank County, North Carolina | 42101 | Philadelphia County, Pennsylvania |
| 37141 | Pender County, North Carolina | 42109 | Snyder County, Pennsylvania |
| 37143 | Perquimans County, North Carolina | 42111 | Somerset County, Pennsylvania |
| 37145 | Person County, North Carolina | 42117 | Tioga County, Pennsylvania |
| 37147 | Pitt County, North Carolina | 42119 | Union County, Pennsylvania |
| 37153 | Richmond County, North Carolina | 42123 | Warren County, Pennsylvania |
| 37155 | Robeson County, North Carolina | 42133 | York County, Pennsylvania |
| 37159 | Rowan County, North Carolina | 44001 | Bristol County, Rhode Island |
| 37163 | Sampson County, North Carolina | 44003 | Kent County, Rhode Island |
| 37165 | Scotland County, North Carolina | 44005 | Newport County, Rhode Island |
| 37167 | Stanly County, North Carolina | 44007 | Providence County, Rhode Island |
| 37177 | Tyrrell County, North Carolina | 44009 | Washington County, Rhode Island |
| 37179 | Union County, North Carolina | 45003 | Aiken County, South Carolina |
| 37181 | Vance County, North Carolina | 45005 | Allendale County, South Carolina |
| 37183 | Wake County, North Carolina | 45009 | Bamberg County, South Carolina |
| 37185 | Warren County, North Carolina | 45011 | Barnwell County, South Carolina |
| 37187 | Washington County, North Carolina | 45013 | Beaufort County, South Carolina |
| 37189 | Watauga County, North Carolina | 45015 | Berkeley County, South Carolina |
| 37191 | Wayne County, North Carolina | 45017 | Calhoun County, South Carolina |
| 37193 | Wilkes County, North Carolina | 45019 | Charleston County, South Carolina |
| 37195 | Wilson County, North Carolina | 45021 | Cherokee County, South Carolina |
| 42001 | Adams County, Pennsylvania | 45023 | Chester County, South Carolina |
| 42009 | Bedford County, Pennsylvania | 45025 | Chesterfield County, South Carolina |
| 42011 | Berks County, Pennsylvania | 45027 | Clarendon County, South Carolina |
| 42013 | Blair County, Pennsylvania | 45029 | Colleton County, South Carolina |
| 42017 | Bucks County, Pennsylvania | 45031 | Darlington County, South Carolina |
| 42021 | Cambria County, Pennsylvania | 45033 | Dillon County, South Carolina |
| 42023 | Cameron County, Pennsylvania | 45035 | Dorchester County, South Carolina |
| 42027 | Centre County, Pennsylvania | 45037 | Edgefield County, South Carolina |
| 42029 | Chester County, Pennsylvania | 45039 | Fairfield County, South Carolina |
| 45041 | Florence County, South Carolina | 48163 | Frio County, Texas |
| 45043 | Georgetown County, South Carolina | 48167 | Galveston County, Texas |
| 45049 | Hampton County, South Carolina | 48175 | Goliad County, Texas |
| 45051 | Horry County, South Carolina | 48177 | Gonzales County, Texas |
| 45053 | Jasper County, South Carolina | 48183 | Gregg County, Texas |
| 45055 | Kershaw County, South Carolina | 48185 | Grimes County, Texas |
| 45057 | Lancaster County, South Carolina | 48187 | Guadalupe County, Texas |
| 45061 | Lee County, South Carolina | 48199 | Hardin County, Texas |
| 45063 | Lexington County, South Carolina | 48201 | Harris County, Texas |
| 45067 | Marion County, South Carolina | 48209 | Hays County, Texas |
| 45069 | Marlboro County, South Carolina | 48215 | Hidalgo County, Texas |
| 45071 | Newberry County, South Carolina | 48217 | Hill County, Texas |
| 45075 | Orangeburg County, South Carolina | 48225 | Houston County, Texas |
| 45079 | Richland County, South Carolina | 48239 | Jackson County, Texas |
| 45081 | Saluda County, South Carolina | 48241 | Jasper County, Texas |
| 45085 | Sumter County, South Carolina | 48245 | Jefferson County, Texas |
| 45089 | Williamsburg County, South Carolina | 48247 | Jim Hogg County, Texas |
| 45091 | York County, South Carolina | 48249 | Jim Wells County, Texas |
| 47091 | Johnson County, Tennessee | 48255 | Karnes County, Texas |
| 48001 | Anderson County, Texas | 48261 | Kenedy County, Texas |
| 48005 | Angelina County, Texas | 48271 | Kinney County, Texas |
| 48007 | Aransas County, Texas | 48273 | Kleberg County, Texas |
| 48013 | Atascosa County, Texas | 48283 | La Salle County, Texas |
| 48015 | Austin County, Texas | 48285 | Lavaca County, Texas |
| 48021 | Bastrop County, Texas | 48287 | Lee County, Texas |
| 48025 | Bee County, Texas | 48289 | Leon County, Texas |
| 48027 | Bell County, Texas | 48291 | Liberty County, Texas |
| 48029 | Bexar County, Texas | 48297 | Live Oak County, Texas |
| 48035 | Bosque County, Texas | 48309 | McLennan County, Texas |
| 48039 | Brazoria County, Texas | 48311 | McMullen County, Texas |
| 48041 | Brazos County, Texas | 48313 | Madison County, Texas |
| 48047 | Brooks County, Texas | 48321 | Matagorda County, Texas |
| 48051 | Burleson County, Texas | 48323 | Maverick County, Texas |
| 48055 | Caldwell County, Texas | 48325 | Medina County, Texas |
| 48057 | Calhoun County, Texas | 48331 | Milam County, Texas |
| 48061 | Cameron County, Texas | 48339 | Montgomery County, Texas |
| 48071 | Chambers County, Texas | 48347 | Nacogdoches County, Texas |
| 48073 | Cherokee County, Texas | 48351 | Newton County, Texas |
| 48089 | Colorado County, Texas | 48355 | Nueces County, Texas |
| 48091 | Comal County, Texas | 48361 | Orange County, Texas |
| 48099 | Coryell County, Texas | 48373 | Polk County, Texas |
| 48123 | DeWitt County, Texas | 48391 | Refugio County, Texas |
| 48127 | Dimmit County, Texas | 48395 | Robertson County, Texas |
| 48131 | Duval County, Texas | 48401 | Rusk County, Texas |
| 48139 | Ellis County, Texas | 48403 | Sabine County, Texas |
| 48145 | Falls County, Texas | 48405 | San Augustine County, Texas |
| 48149 | Fayette County, Texas | 48407 | San Jacinto County, Texas |
| 48157 | Fort Bend County, Texas | 48409 | San Patricio County, Texas |
| 48419 | Shelby County, Texas | 51093 | Isle of Wight County, Virginia |
| 48423 | Smith County, Texas | 51095 | James City County, Virginia |
| 48427 | Starr County, Texas | 51097 | King and Queen County, Virginia |
| 48453 | Travis County, Texas | 51099 | King George County, Virginia |
| 48455 | Trinity County, Texas | 51101 | King William County, Virginia |
| 48457 | Tyler County, Texas | 51103 | Lancaster County, Virginia |
| 48459 | Upshur County, Texas | 51107 | Loudoun County, Virginia |
| 48463 | Uvalde County, Texas | 51109 | Louisa County, Virginia |
| 48465 | Val Verde County, Texas | 51111 | Lunenburg County, Virginia |
| 48469 | Victoria County, Texas | 51113 | Madison County, Virginia |
| 48471 | Walker County, Texas | 51115 | Mathews County, Virginia |
| 48473 | Waller County, Texas | 51117 | Mecklenburg County, Virginia |
| 48477 | Washington County, Texas | 51119 | Middlesex County, Virginia |
| 48479 | Webb County, Texas | 51125 | Nelson County, Virginia |
| 48481 | Wharton County, Texas | 51127 | New Kent County, Virginia |
| 48489 | Willacy County, Texas | 51131 | Northampton County, Virginia |
| 48491 | Williamson County, Texas | 51133 | Northumberland County, Virginia |
| 48493 | Wilson County, Texas | 51135 | Nottoway County, Virginia |
| 48505 | Zapata County, Texas | 51137 | Orange County, Virginia |
| 48507 | Zavala County, Texas | 51139 | Page County, Virginia |
| 50025 | Windham County, Vermont | 51145 | Powhatan County, Virginia |
| 50027 | Windsor County, Vermont | 51147 | Prince Edward County, Virginia |
| 51001 | Accomack County, Virginia | 51149 | Prince George County, Virginia |
| 51003 | Albemarle County, Virginia | 51153 | Manassas city, Virginia |
| 51007 | Amelia County, Virginia | 51153 | Manassas Park city, Virginia |
| 51011 | Appomattox County, Virginia | 51153 | Prince William County, Virginia |
| 51013 | Arlington County, Virginia | 51157 | Rappahannock County, Virginia |
| 51021 | Bland County, Virginia | 51159 | Richmond County, Virginia |
| 51025 | Brunswick County, Virginia | 51165 | Rockingham County, Virginia |
| 51029 | Buckingham County, Virginia | 51171 | Shenandoah County, Virginia |
| 51033 | Caroline County, Virginia | 51173 | Smyth County, Virginia |
| 51036 | Charles City County, Virginia | 51175 | Southampton County, Virginia |
| 51037 | Charlotte County, Virginia | 51177 | Spotsylvania County, Virginia |
| 51041 | Chesterfield County, Virginia | 51179 | Stafford County, Virginia |
| 51047 | Culpeper County, Virginia | 51181 | Surry County, Virginia |
| 51049 | Cumberland County, Virginia | 51183 | Sussex County, Virginia |
| 51053 | Dinwiddie County, Virginia | 51185 | Tazewell County, Virginia |
| 51057 | Essex County, Virginia | 51191 | Washington County, Virginia |
| 51059 | Fairfax County, Virginia | 51193 | Westmoreland County, Virginia |
| 51065 | Fluvanna County, Virginia | 51197 | Wythe County, Virginia |
| 51073 | Gloucester County, Virginia | 51199 | York County, Virginia |
| 51075 | Goochland County, Virginia | 51550 | Chesapeake city, Virginia |
| 51077 | Grayson County, Virginia | 51650 | Hampton city, Virginia |
| 51079 | Greene County, Virginia | 51683 | Manassas city, Virginia |
| 51081 | Greensville County, Virginia | 51685 | Manassas Park city, Virginia |
| 51083 | Halifax County, Virginia | 51700 | Newport News city, Virginia |
| 51085 | Hanover County, Virginia | 51730 | Petersburg city, Virginia |
| 51087 | Henrico County, Virginia | 51760 | Richmond city, Virginia |
| 51800 | Suffolk city, Virginia | 54039 | Kanawha County, West Virginia |
| 51810 | Virginia Beach city, Virginia | 54047 | McDowell County, West Virginia |
| 54005 | Boone County, West Virginia | 54055 | Mercer County, West Virginia |
| 54023 | Grant County, West Virginia | 54057 | Mineral County, West Virginia |
| 54027 | Hampshire County, West Virginia | 54081 | Raleigh County, West Virginia |
| 54031 | Hardy County, West Virginia | 54109 | Wyoming County, West Virginia |
References
- Arkema, K.K.; Guannel, G.; Verutes, G.; Wood, S.A.; Guerry, A.; Ruckelshaus, M.; Kareiva, P.; Lacayo, M.; Silver, J.M. Coastal habitats shield people and property from sea-level rise and storms. Nat. Clim. Chang. 2013, 3, 913–918. [Google Scholar] [CrossRef]
- Changnon, S.A.; Pielke, R.A., Jr.; Changnon, D.; Sylves, R.T.; Pulwarty, R. Human factors explain the increased losses from weather and climate extremes. Bull. Am. Meteorol. Soc. 2000, 81, 437–442. [Google Scholar] [CrossRef] [Green Version]
- Emanuel, K. Global warming effects on US hurricane damage. Weather Clim. Soc. 2011, 3, 261–268. [Google Scholar] [CrossRef]
- National Academies of Sciences, Engineering and Medicine. Attribution of Extreme Weather Events in the Context of Climate Change; National Academies Press: Washington, DC, USA, 2016. [Google Scholar]
- Rahmstorf, S. Rising hazard of storm-surge flooding. Proc. Natl. Acad. Sci. USA 2017, 114, 11806–11808. [Google Scholar] [CrossRef] [Green Version]
- Diaz, H.F.; Pulwarty, R.S. Hurricanes: Climate and Socioeconomic Impacts; Springer: Berlin/Heidelberg, Germany, 2012. [Google Scholar]
- NOAA Office for Coastal Management. Fast Facts—Hurricane Coasts. Available online: https://coast.noaa.gov/states/fast-facts/hurricane-costs.html (accessed on 16 September 2021).
- Weinkle, J.; Landsea, C.; Collins, D.; Musulin, R.; Crompton, R.P.; Klotzbach, P.J.; Pielke, R. Normalized hurricane damage in the continental United States 1900–2017. Nat. Sustain. 2018, 1, 808–813. [Google Scholar] [CrossRef]
- Dolan, R.; Davis, R.E. Coastal storm hazards. J. Coast. Res. 1994, 103–114. [Google Scholar]
- Glahn, B.; Taylor, A.; Kurkowski, N.; Shaffer, W.A. The role of the SLOSH model in National Weather Service storm surge forecasting. Natl. Weather Dig. 2009, 33, 3–14. [Google Scholar]
- Lin, N.; Emanuel, K.A.; Smith, J.A.; Vanmarcke, E. Risk assessment of hurricane storm surge for New York City. J. Geophys. Res. Atmos. 2010, 115. [Google Scholar] [CrossRef] [Green Version]
- Lin, N.; Emanuel, K.; Oppenheimer, M.; Vanmarcke, E. Physically based assessment of hurricane surge threat under climate change. Nat. Clim. Chang. 2012, 2, 462–467. [Google Scholar] [CrossRef] [Green Version]
- Cutter, S.L.; Johnson, L.A.; Finch, C.; Berry, M. The US hurricane coasts: Increasingly vulnerable? Environ. Sci. Policy Sustain. Dev. 2007, 49, 8–21. [Google Scholar] [CrossRef]
- Lam, N.-N.; Arenas, H.; Li, Z.; Liu, K.-B. An estimate of population impacted by climate change along the US coast. J. Coast. Res. 2009, 1522–1526. Available online: https://www.jstor.org/stable/25738044 (accessed on 1 September 2021).
- Donner, W.; Rodríguez, H. Population composition, migration and inequality: The influence of demographic changes on disaster risk and vulnerability. Soc. Forces 2008, 87, 1089–1114. [Google Scholar] [CrossRef]
- Crossett, K.A.; Brent; Pacheco, P.; Haber, K. National Coastal Population Report: Population Trends from 1970 to 2020; NOAA Office for Coastal Management: Silver Spring, MD, USA, 2013. [Google Scholar]
- Maul, G.A.; Duedall, I.W. Demography of Coastal Populations. In Encyclopedia of Coastal Science; Finkl, C.W., Makowski, C., Eds.; Springer: Cham, Switzerland, 2019; pp. 692–700. [Google Scholar]
- Cohen, D.T. About 60.2M Live in Areas Most Vulnerable to Hurricanes. Available online: https://www.census.gov/library/stories/2019/07/millions-of-americans-live-coastline-regions.html (accessed on 16 September 2021).
- Pielke, R.A. Vulnerability to hurricanes along the US Atlantic and Gulf coasts: Considerations of the use of long-term forecasts. In Hurricanes; Springer: Berlin/Heidelberg, Germany, 1997; pp. 147–184. [Google Scholar]
- Pompe, J.; Haluska, J. Estimating the Vulnerability of US Coastal Areas to Hurricane Damage. In Recent Hurricane Research-Climate, Dynamics and Societal Impacts; Lupo, A., Ed.; IntechOpen: London, UK, 2011; pp. 407–418. [Google Scholar]
- Smith, K. Environmental Hazards: Assessing Risk and Reducing Disaster, 6th ed.; Routledge: New York, NY, USA, 2013. [Google Scholar]
- Cutter, S.L. American Hazardscapes: The Regionalization of Hazards and Disasters; Joseph Henry Press: Washington, DC, USA, 2001. [Google Scholar]
- Forbes, C.; Rhome, J.; Mattocks, C.; Taylor, A. Predicting the storm surge threat of Hurricane Sandy with the National Weather Service SLOSH model. J. Mar. Sci. Eng. 2014, 2, 437–476. [Google Scholar] [CrossRef] [Green Version]
- Dietrich, J.; Dawson, C.; Proft, J.; Howard, M.; Wells, G.; Fleming, J.; Luettich, R.; Westerink, J.; Cobell, Z.; Vitse, M. Real-time forecasting and visualization of hurricane waves and storm surge using SWAN+ ADCIRC and FigureGen. In Computational Challenges in the Geosciences; Springer: Berlin/Heidelberg, Germany, 2013; pp. 49–70. [Google Scholar]
- Dietrich, J.; Zijlema, M.; Westerink, J.; Holthuijsen, L.; Dawson, C.; Luettich, R., Jr.; Jensen, R.; Smith, J.; Stelling, G.; Stone, G. Modeling hurricane waves and storm surge using integrally-coupled, scalable computations. Coast. Eng. 2011, 58, 45–65. [Google Scholar] [CrossRef]
- Powell, M.D.; Murillo, S.; Dodge, P.; Uhlhorn, E.; Gamache, J.; Cardone, V.; Cox, A.; Otero, S.; Carrasco, N.; Annane, B. Reconstruction of Hurricane Katrina’s wind fields for storm surge and wave hindcasting. Ocean Eng. 2010, 37, 26–36. [Google Scholar] [CrossRef]
- Anderson, G.; Schumacher, A.; Guikema, S.; Quiring, S.; Ferreri, J.; Staid, A.; Guo, M.; Ming, L.; Zhu, L. Stormwindmodel: Model Tropical Cyclone Wind Speeds.(R Package Version 0.1.4) 2020. Available online: http://cran.nexr.com/web/packages/stormwindmodel/index.html (accessed on 1 October 2021).
- Anderson, G.B.; Ferreri, J.; Al-Hamdan, M.; Crosson, W.; Schumacher, A.; Guikema, S.; Quiring, S.; Eddelbuettel, D.; Yan, M.; Peng, R.D. Assessing United States county-level exposure for research on tropical cyclones and human health. Environ. Health Perspect. 2020, 128, 107009. [Google Scholar] [CrossRef]
- Logan, J.R.; Xu, Z. Vulnerability to hurricane damage on the US Gulf Coast since 1950. Geogr. Rev. 2015, 105, 133–155. [Google Scholar] [CrossRef]
- Füssel, H.-M. Vulnerability: A generally applicable conceptual framework for climate change research. Glob. Environ. Chang. 2007, 17, 155–167. [Google Scholar] [CrossRef]
- Cutter, S.L. The vulnerability of science and the science of vulnerability. Ann. Assoc. Am. Geogr. 2003, 93, 1–12. [Google Scholar] [CrossRef]
- Cutter, S.L. Social science perspectives on hazards and vulnerability science. In Geophysical Hazards: Minimizing Risk, Maximizing Awareness; Beer, T., Ed.; Springer: Dordrecht, The Netherlands, 2009; pp. 17–30. [Google Scholar]
- Chi, H.; Pitter, S.; Li, N.; Tian, H. Big data solutions to interpreting complex systems in the environment. In Guide to Big Data Applications; Springer: Berlin/Heidelberg, Germany, 2018; pp. 107–124. [Google Scholar]
- Abarca-Alvarez, F.J.; Reinoso-Bellido, R.; Campos-Sánchez, F.S. Decision model for predicting social vulnerability using artificial intelligence. ISPRS Int. J. Geo-Inf. 2019, 8, 575. [Google Scholar] [CrossRef] [Green Version]
- Martín, Y.; Li, Z.; Cutter, S.L. Leveraging Twitter to gauge evacuation compliance: Spatiotemporal analysis of Hurricane Matthew. PLoS ONE 2017, 12, e0181701. [Google Scholar] [CrossRef] [Green Version]
- Yang, C.; Clarke, K.; Shekhar, S.; Tao, C.V. Big Spatiotemporal Data Analytics: A research and innovation frontier. Int. J. Geogr. Inf. Sci. 2020, 1075–1088. [Google Scholar] [CrossRef] [Green Version]
- Yu, M.; Yang, C.; Li, Y. Big data in natural disaster management: A review. Geosciences 2018, 8, 165. [Google Scholar] [CrossRef] [Green Version]
- Hashem, I.A.T.; Yaqoob, I.; Anuar, N.B.; Mokhtar, S.; Gani, A.; Khan, S.U. The rise of “big data” on cloud computing: Review and open research issues. Inf. Syst. 2015, 47, 98–115. [Google Scholar] [CrossRef]
- Miller, H.J.; Goodchild, M.F. Data-driven geography. GeoJournal 2015, 80, 449–461. [Google Scholar] [CrossRef]
- Reynard, D. Five classes of geospatial data and the barriers to using them. Geogr. Compass 2018, 12, e12364. [Google Scholar] [CrossRef] [Green Version]
- Jarvinen, B.R.; Neumann, C.J.; Davis, M.A. A Tropical Cyclone Data Tape for the North Atlantic Basin, 1886–1983: Contents, Limitations, and Uses; National Hurricane Center: Miami, FL, USA, 1984. [Google Scholar]
- Landsea, C.W.; Franklin, J.L. Atlantic hurricane database uncertainty and presentation of a new database format. Mon. Weather Rev. 2013, 141, 3576–3592. [Google Scholar] [CrossRef]
- Landsea, C.W.; Franklin, J.L.; Beven, J.L. The revised Atlantic hurricane database (HURDAT2); National Hurricane Center: Miami, FL, USA, 2015. [Google Scholar]
- Allen, T.R.; Sanchagrin, S.; McLeod, G. Geovisualization for storm surge risk communication. In Proceedings of the Special Joint Symposium of ISPRS Technical Commission IV & AutoCaro in Conjunction with ASPRS/CaGIS 2010 Fall Specialty Conference, Orlando, FL, USA, 15–19 November 2010; pp. 15–19. [Google Scholar]
- Zachry, B.C.; Booth, W.J.; Rhome, J.R.; Sharon, T.M. A national view of storm surge risk and inundation. Weather Clim. Soc. 2015, 7, 109–117. [Google Scholar] [CrossRef]
- Jelesnianski, C.P.; Chen, J.; Shaffer, W.A. SLOSH: Sea, Lake, and Overland Surges from Hurricanes; NOAA Technical Report NWS 48; National Oceanic and Atmospheric Administration, U.S. Department of Commerce: Silver Spring, MD, USA, 1992. [Google Scholar]
- Luther, M.E.; Merz, C.R.; Scudder, J.; Baig, S.R.; Pralgo, J.L.; Thompson, D.; Gill, S.; Hovis, G. Water level observations for storm surge. Mar. Technol. Soc. J. 2007, 41, 35–43. [Google Scholar] [CrossRef]
- Yang, K.; Paramygin, V.A.; Sheng, Y.P. A rapid forecasting and mapping system of storm surge and coastal flooding. Weather Forecast. 2020, 35, 1663–1681. [Google Scholar] [CrossRef] [Green Version]
- Conver, A.; Sepanik, J.; Louangsaysongkham, B.; Miller, S. Sea, Lake, and Overland Surges from Hurricanes (SLOSH) Basin Development Handbook v2.0; NOAA/NWS/Meteorological Development Laboratory: Silver Springs, MD, USA, 2008. [Google Scholar]
- Allen, T.R.; Sanchagrin, S.; McLeod, G. Visualization for hurricane storm surge risk awareness and emergency communication. In Approaches to Disaster Management—Examining the Implications of Hazards, Emergencies and Disasters; Tiefenbacher, J.P., Ed.; IntechOpen: London, UK, 2013. [Google Scholar]
- Mayo, T.; Lin, N.J.A. The effect of the surface wind field representation in the operational storm surge model of the National Hurricane Center. Atmosphere 2019, 10, 193. [Google Scholar] [CrossRef] [Green Version]
- Mercado, A. On the use of NOAA‘’s storm surge model, SLOSH, in managing coastal hazards—The experience in Puerto Rico. Nat. Hazards 1994, 10, 235–246. [Google Scholar] [CrossRef]
- Frazier, T.G.; Wood, N.; Yarnal, B.; Bauer, D.H. Influence of potential sea level rise on societal vulnerability to hurricane storm-surge hazards, Sarasota County, Florida. Appl. Geogr. 2010, 30, 490–505. [Google Scholar] [CrossRef]
- Houston, S.H.; Shaffer, W.A.; Powell, M.D.; Chen, J. Comparisons of HRD and SLOSH surface wind fields in hurricanes: Implications for storm surge modeling. Weather Forecast. 1999, 14, 671–686. [Google Scholar] [CrossRef] [Green Version]
- Maloney, M.C.; Preston, B.L. A geospatial dataset for US hurricane storm surge and sea-level rise vulnerability: Development and case study applications. Clim. Risk Manag. 2014, 2, 26–41. [Google Scholar] [CrossRef] [Green Version]
- Boose, E.R.; Chamberlin, K.E.; Foster, D.R. Landscape and regional impacts of hurricanes in New England. Ecol. Monogr. 2001, 71, 27–48. [Google Scholar] [CrossRef]
- Boose, E.R.; Serrano, M.I.; Foster, D.R. Landscape and regional impacts of hurricanes in Puerto Rico. Ecol. Monogr. 2004, 74, 335–352. [Google Scholar] [CrossRef]
- Busby, P.E.; Canham, C.D.; Motzkin, G.; Foster, D.R. Forest response to chronic hurricane disturbance in coastal New England. J. Veg. Sci. 2009, 20, 487–497. [Google Scholar] [CrossRef]
- Batke, S.P.; Jocque, M.; Kelly, D.L. Modelling hurricane exposure and wind speed on a mesoclimate scale: A case study from Cusuco NP, Honduras. PLoS ONE 2014, 9, e91306. [Google Scholar] [CrossRef]
- Boose, E.R.; Foster, D.R.; Fluet, M. Hurricane impacts to tropical and temperate forest landscapes. Ecol. Monogr. 1994, 64, 369–400. [Google Scholar] [CrossRef]
- Fujita, T.T. Proposed Characterization of Tornadoes and Hurricanes by Area and Intensity; University of Chicago: Chicago, IL, USA, 1971. [Google Scholar]
- Womble, J.A.; Smith, D.A.; Mehta, K.C.; McDonald, J.R. The enhanced Fujita Scale: For use beyond tornadoes? In Proceedings of the Fifth Forensic Engineering: Pathology of the Built Environment, Washington, DC, USA, 11–14 November 2009; pp. 699–708. [Google Scholar]
- Potter, S. Fine-Tuning Fujita: After 35 years, a new scale for rating tornadoes takes effect. Weatherwise 2007, 60, 64–71. [Google Scholar] [CrossRef]
- Doswell III, C.A.; Brooks, H.E.; Dotzek, N. On the implementation of the enhanced Fujita scale in the USA. Atmos. Res. 2009, 93, 554–563. [Google Scholar] [CrossRef] [Green Version]
- Boon, J.D. Evidence of sea level acceleration at US and Canadian tide stations, Atlantic Coast, North America. J. Coast. Res. 2012, 28, 1437–1445. [Google Scholar] [CrossRef] [Green Version]
- Sallenger, A.H.; Doran, K.S.; Howd, P.A. Hotspot of accelerated sea-level rise on the Atlantic coast of North America. Nat. Clim. Chang. 2012, 2, 884–888. [Google Scholar] [CrossRef]
- Smith, R.K.; Montgomery, M.T. Understanding hurricanes. Weather 2016, 71, 219–223. [Google Scholar] [CrossRef]
- Coch, N.K. Hurricane hazards along the northeastern Atlantic coast of the United States. J. Coast. Res. 1994, 12, 115–147. [Google Scholar]
- Ache, B.W.; Crossett, K.M.; Pacheco, P.A.; Adkins, J.E.; Wiley, P.C. “The coast” is complicated: A model to consistently describe the nation’s coastal population. Estuaries Coasts 2015, 38, 151–155. [Google Scholar] [CrossRef]
- Marsooli, R.; Lin, N.; Emanuel, K.; Feng, K. Climate change exacerbates hurricane flood hazards along US Atlantic and Gulf Coasts in spatially varying patterns. Nat. Commun. 2019, 10, 3785. [Google Scholar] [CrossRef] [Green Version]
- Strobl, E. The economic growth impact of hurricanes: Evidence from US coastal counties. Rev. Econ. Stat. 2011, 93, 575–589. [Google Scholar] [CrossRef]
- Maantay, J.A.; Maroko, A.R.; Herrmann, C. Mapping population distribution in the urban environment: The cadastral-based expert dasymetric system (CEDS). Cartogr. Geogr. Inf. Sci. 2007, 34, 77–102. [Google Scholar] [CrossRef]
- Messager, M.L.; Ettinger, A.K.; Murphy-Williams, M.; Levin, P.S. Fine-scale assessment of inequities in inland flood vulnerability. Appl. Geogr. 2021, 133, 102492. [Google Scholar] [CrossRef]
- Hallisey, E.; Tai, E.; Berens, A.; Wilt, G.; Peipins, L.; Lewis, B.; Graham, S.; Flanagan, B.; Lunsford, N.B. Transforming geographic scale: A comparison of combined population and areal weighting to other interpolation methods. Int. J. Health Geogr. 2017, 16, 1–16. [Google Scholar] [CrossRef] [Green Version]
- Crowell, M.; Coulton, K.; Johnson, C.; Westcott, J.; Bellomo, D.; Edelman, S.; Hirsch, E. An estimate of the US population living in 100-year coastal flood hazard areas. J. Coast. Res. 2010, 26, 201–211. [Google Scholar] [CrossRef]
- Cohen, D.T. 60 Million Live in the Path of Hurricanes. Available online: https://www.census.gov/library/stories/2018/08/coastal-county-population-rises.html (accessed on 16 September 2021).
- Andersen, T.K.; Shepherd, J.M. A global spatiotemporal analysis of inland tropical cyclone maintenance or intensification. Int. J. Climatol. 2014, 34, 391–402. [Google Scholar] [CrossRef]
- Yoo, J.; Santanello, J.A.; Shepherd, M.; Kumar, S.; Lawston, P.; Thomas, A.M. Quantification of the Land Surface and Brown Ocean Influence on Tropical Cyclone Intensification over Land. J. Hydrometeorol. 2020, 21, 1171–1192. [Google Scholar] [CrossRef]
- Galarneau, T.J.; Davis, C.A.; Shapiro, M.A. Intensification of Hurricane Sandy (2012) through extratropical warm core seclusion. Mon. Weather Rev. 2013, 141, 4296–4321. [Google Scholar] [CrossRef]
- Cutter, S.L. Vulnerability to environmental hazards. Prog. Hum. Heography 1996, 20, 529–539. [Google Scholar] [CrossRef]


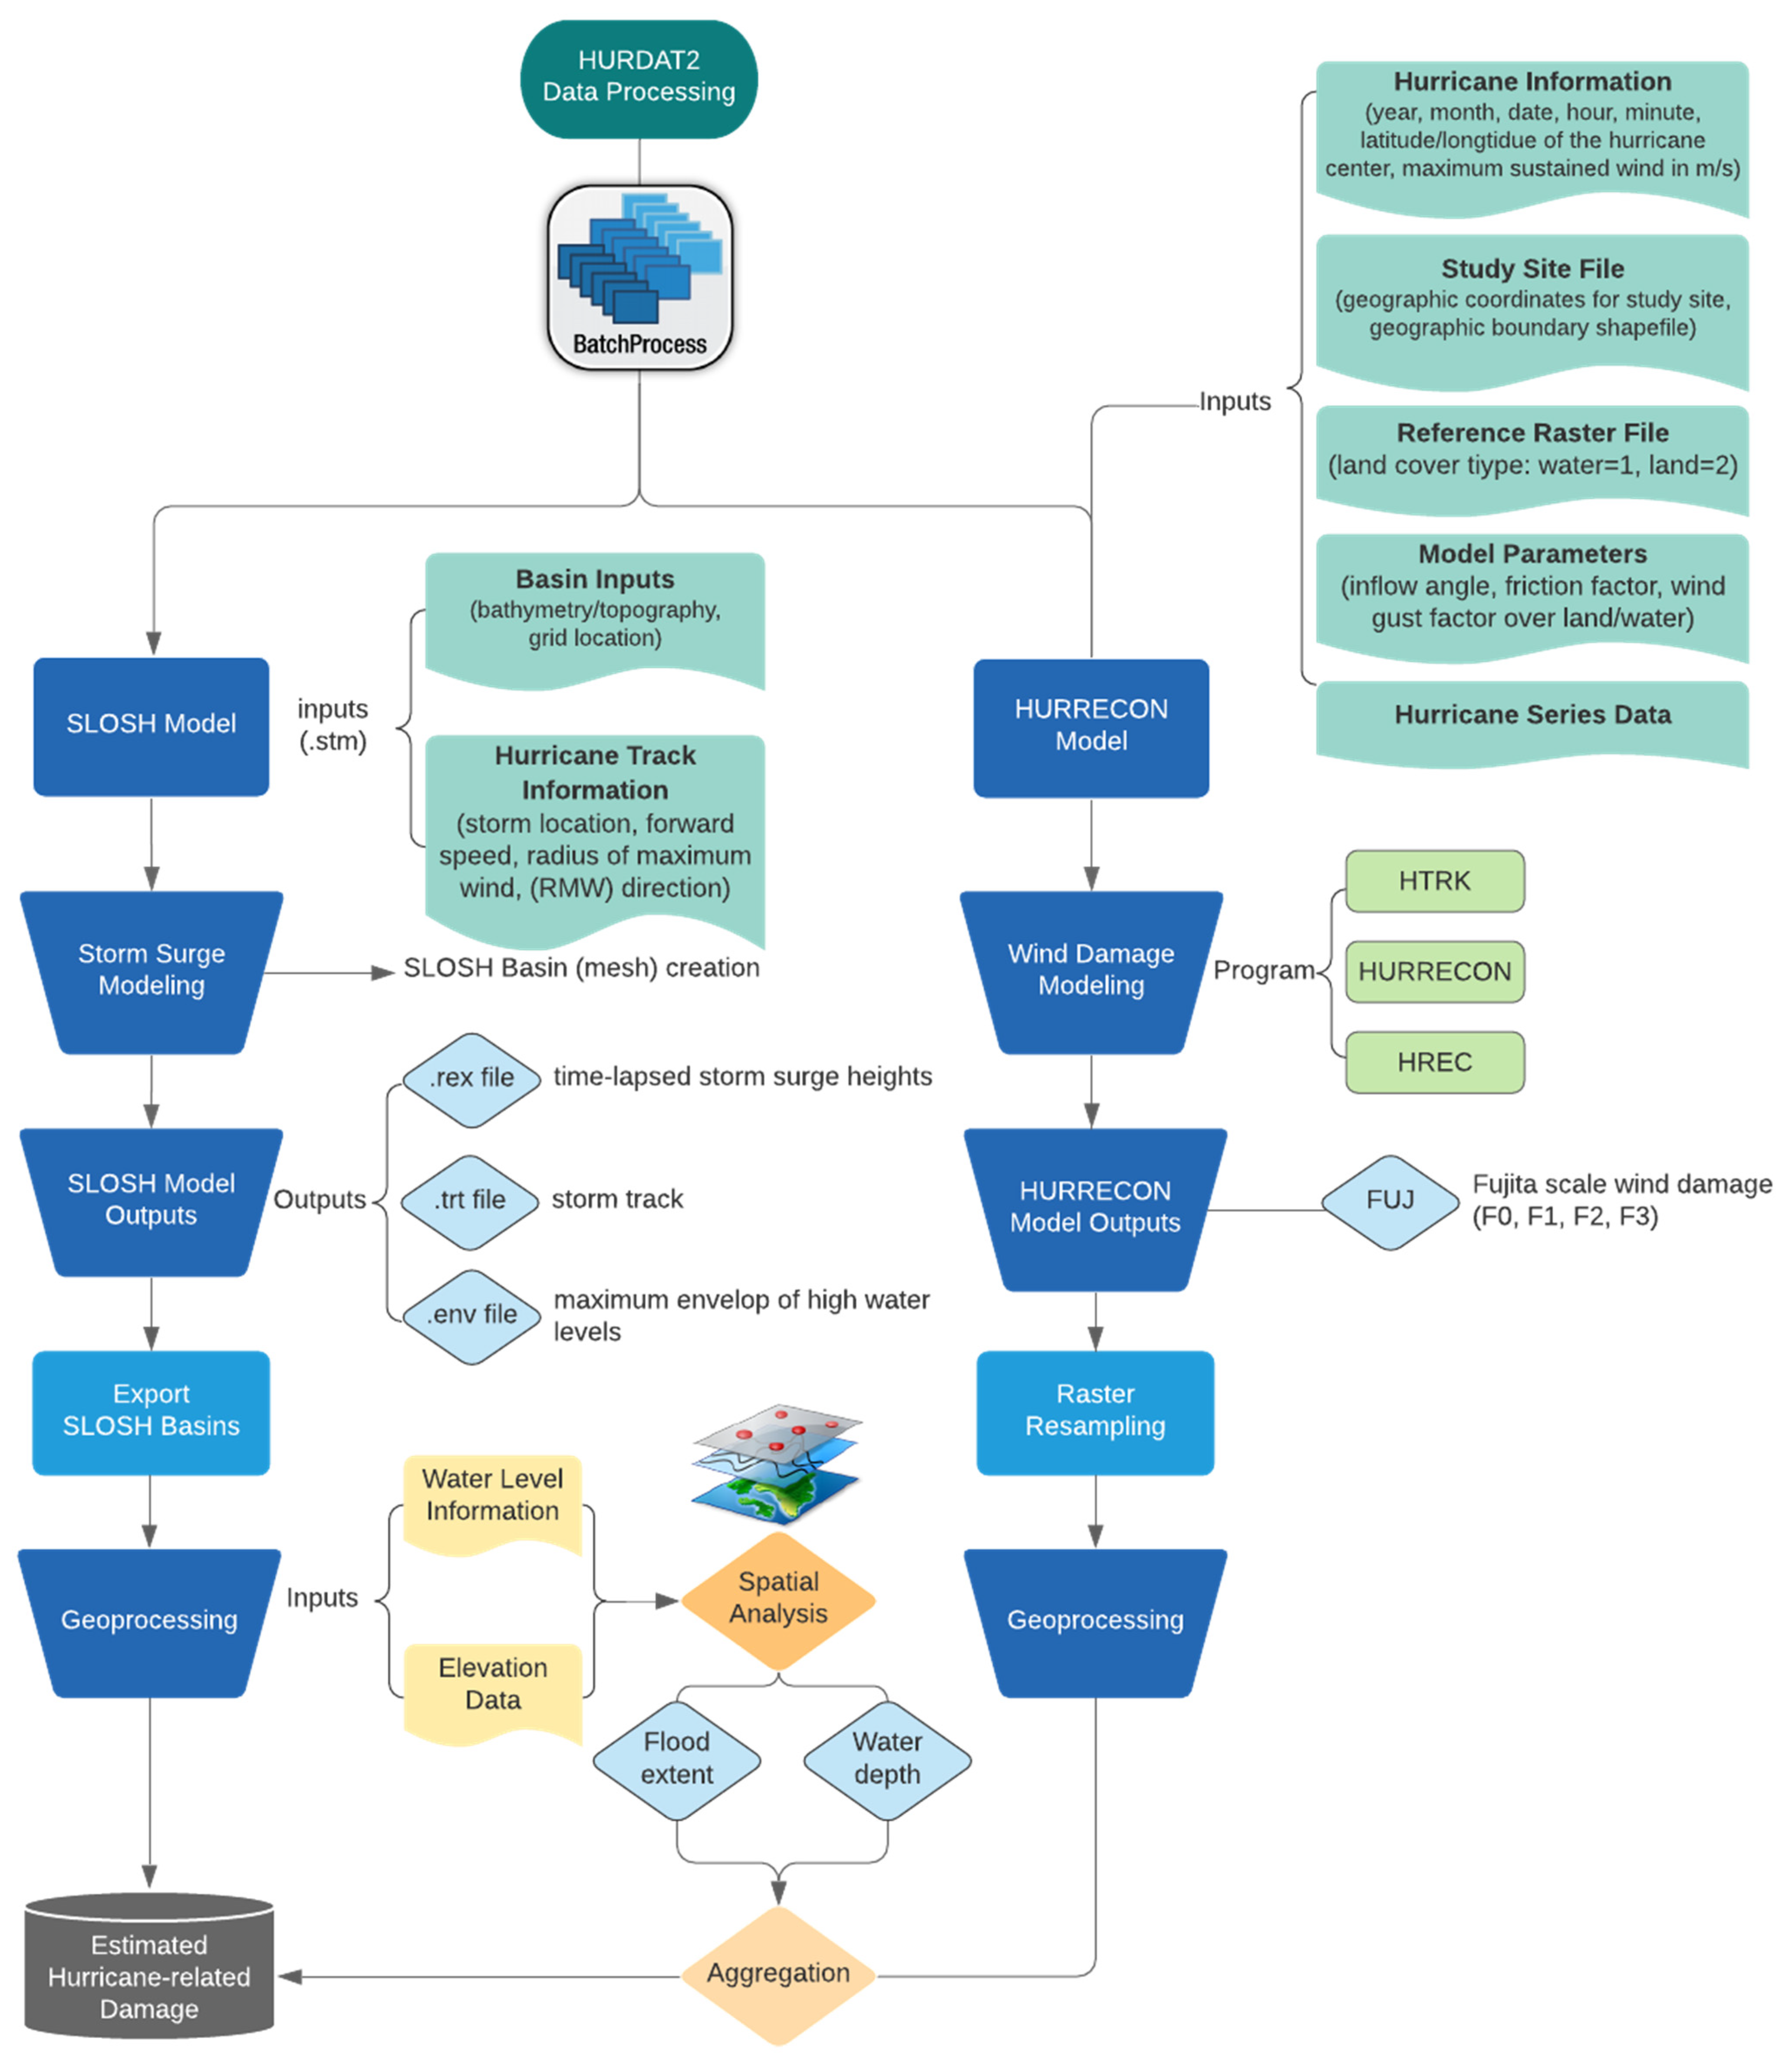


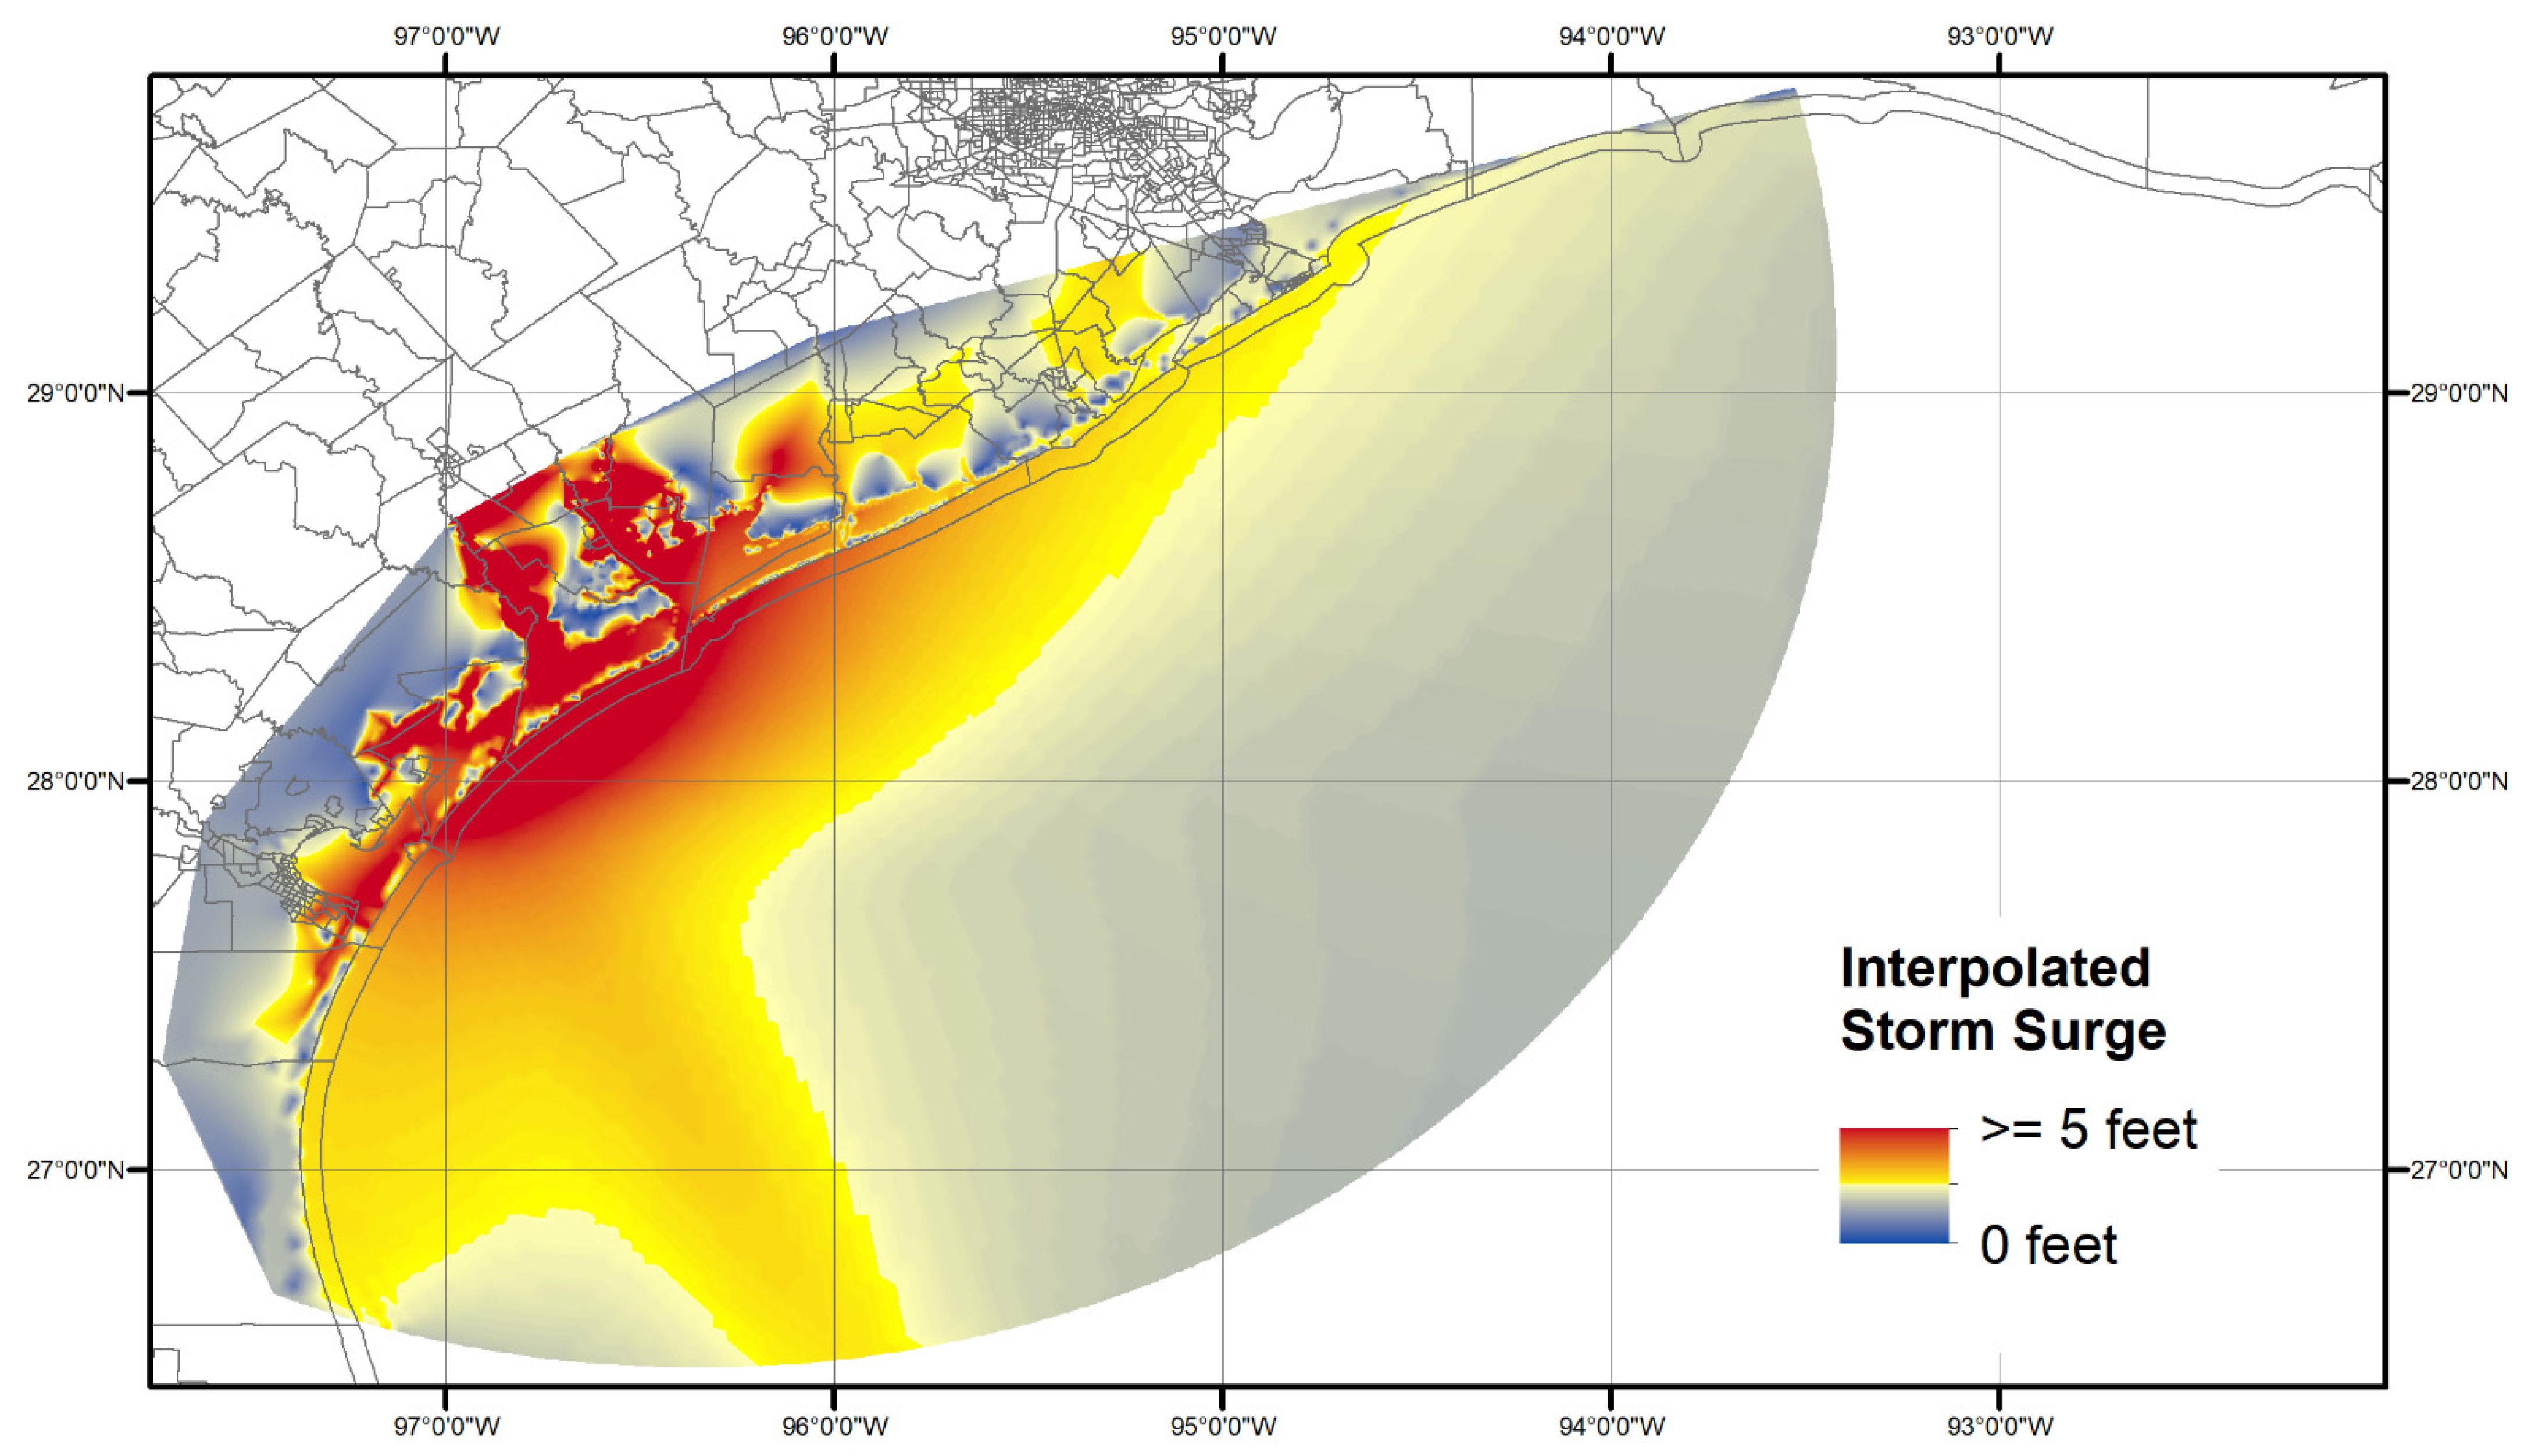
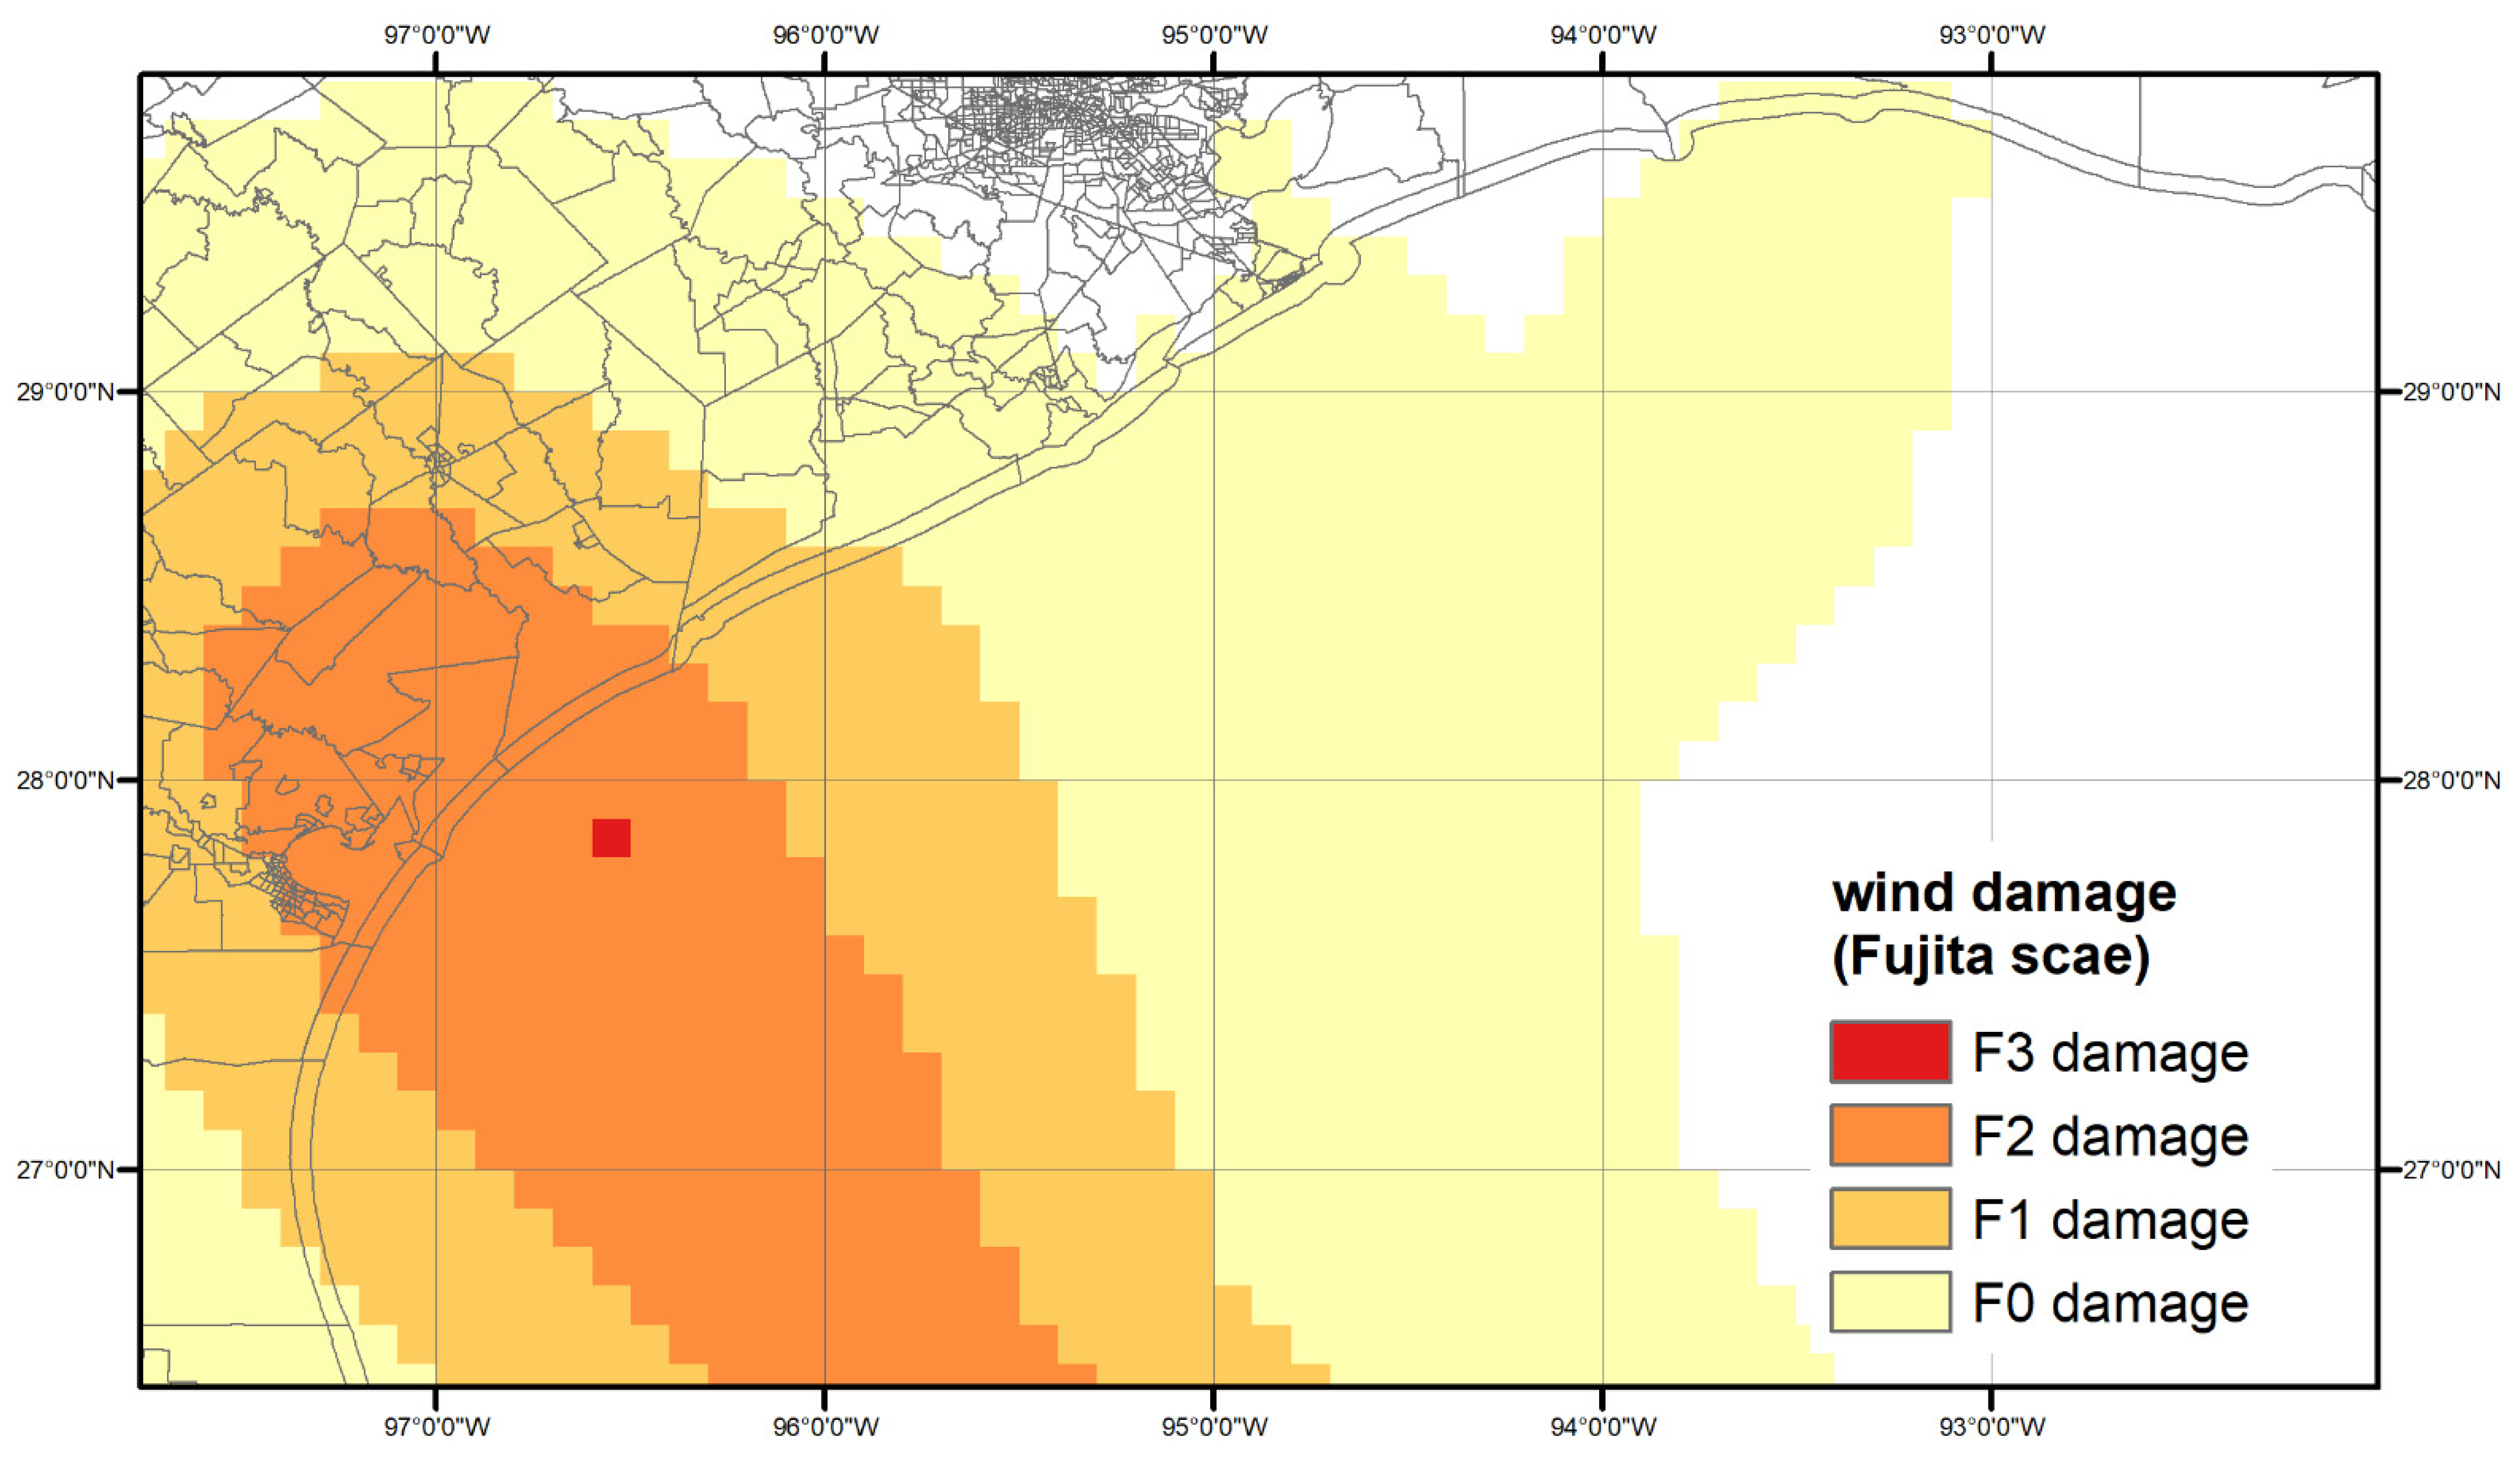
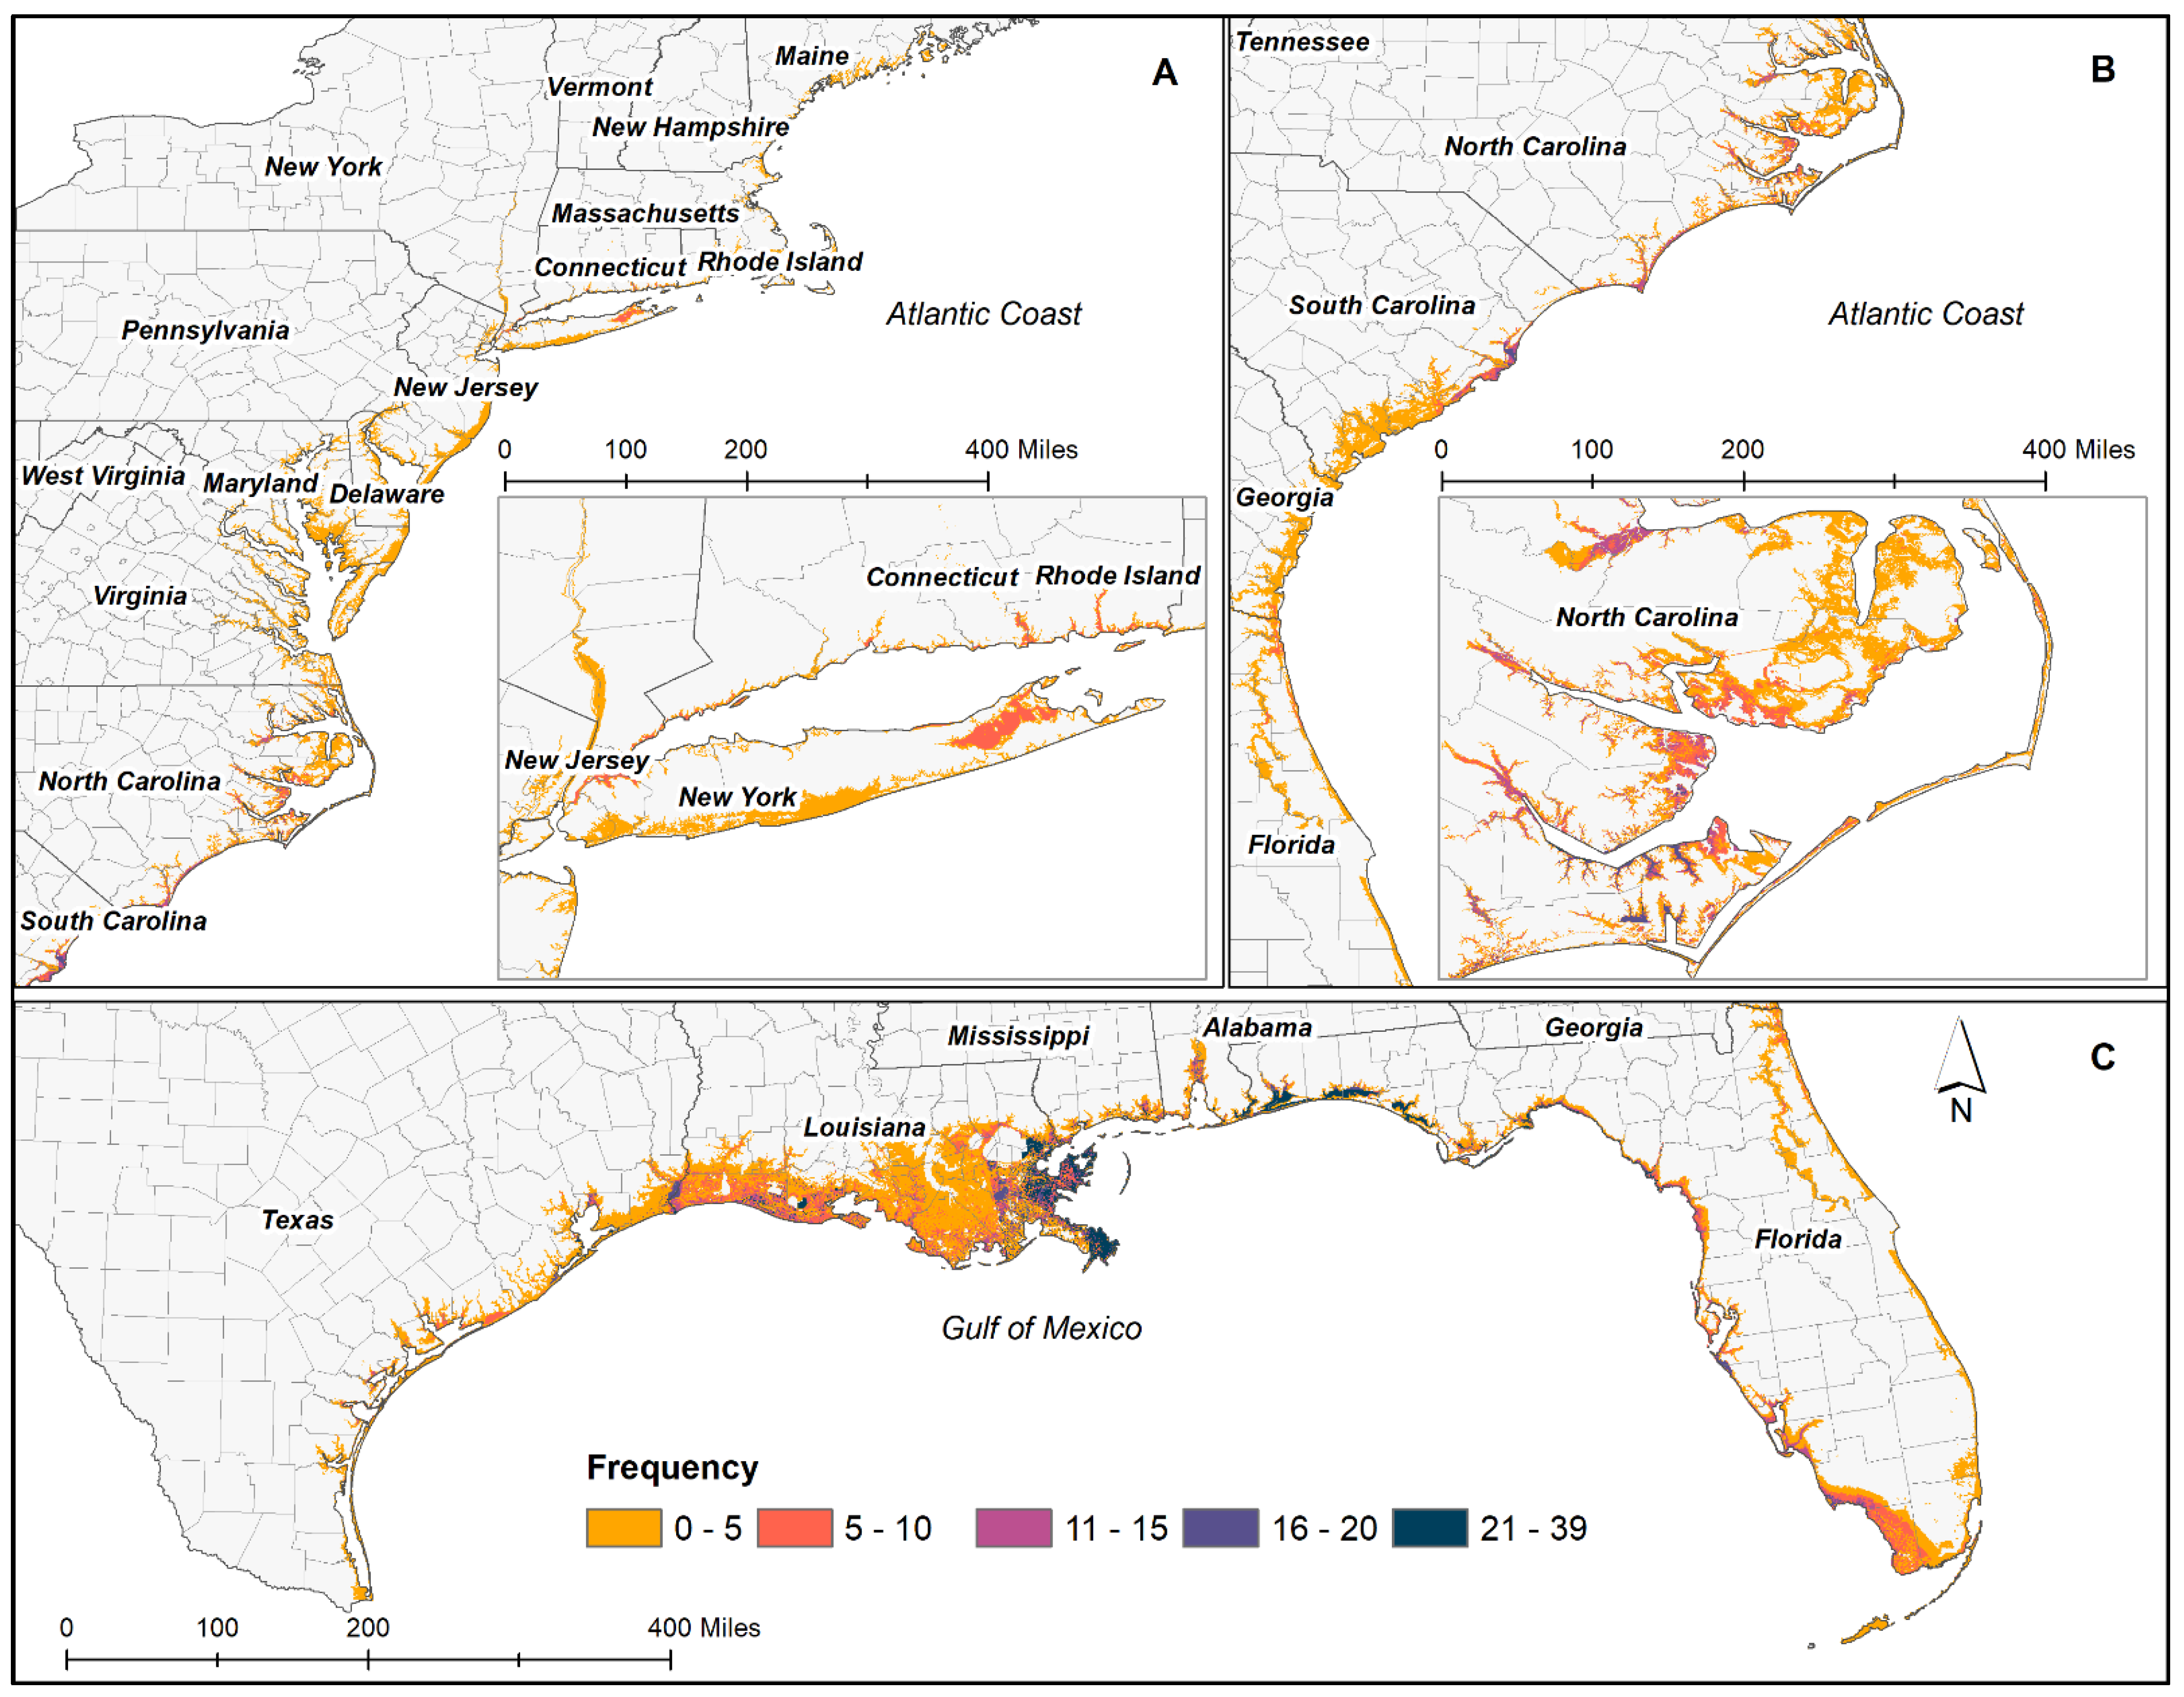
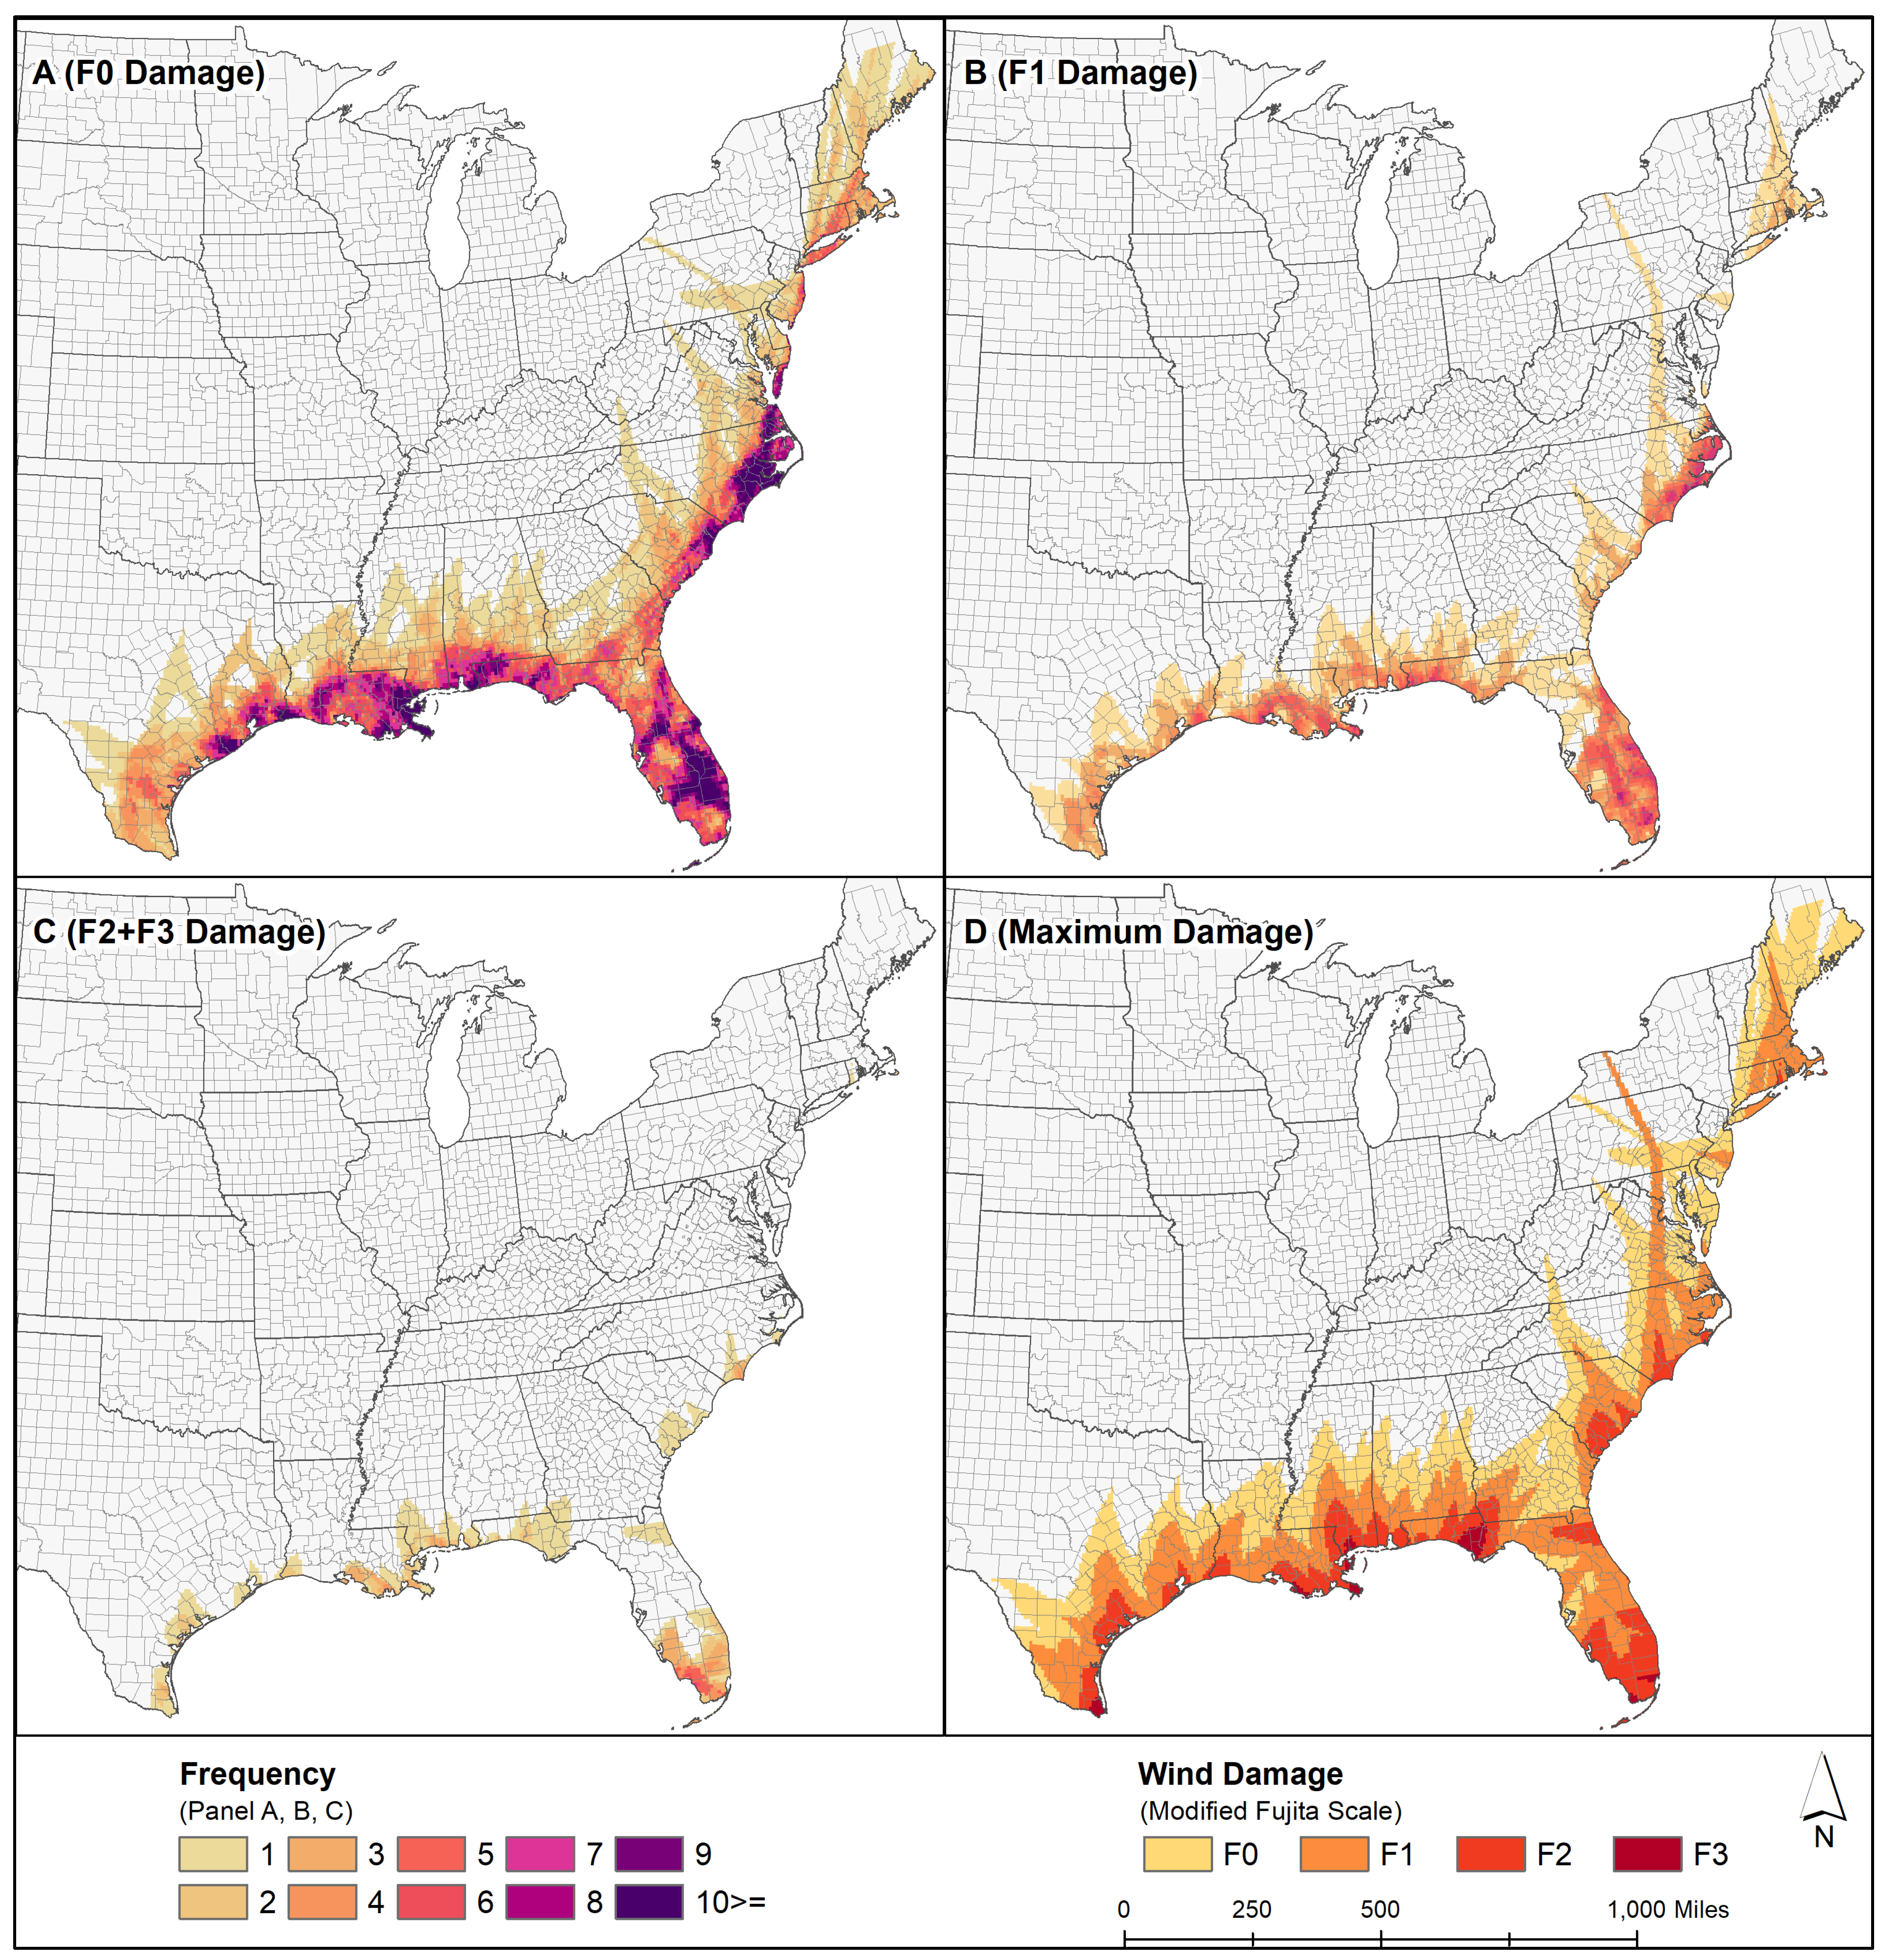
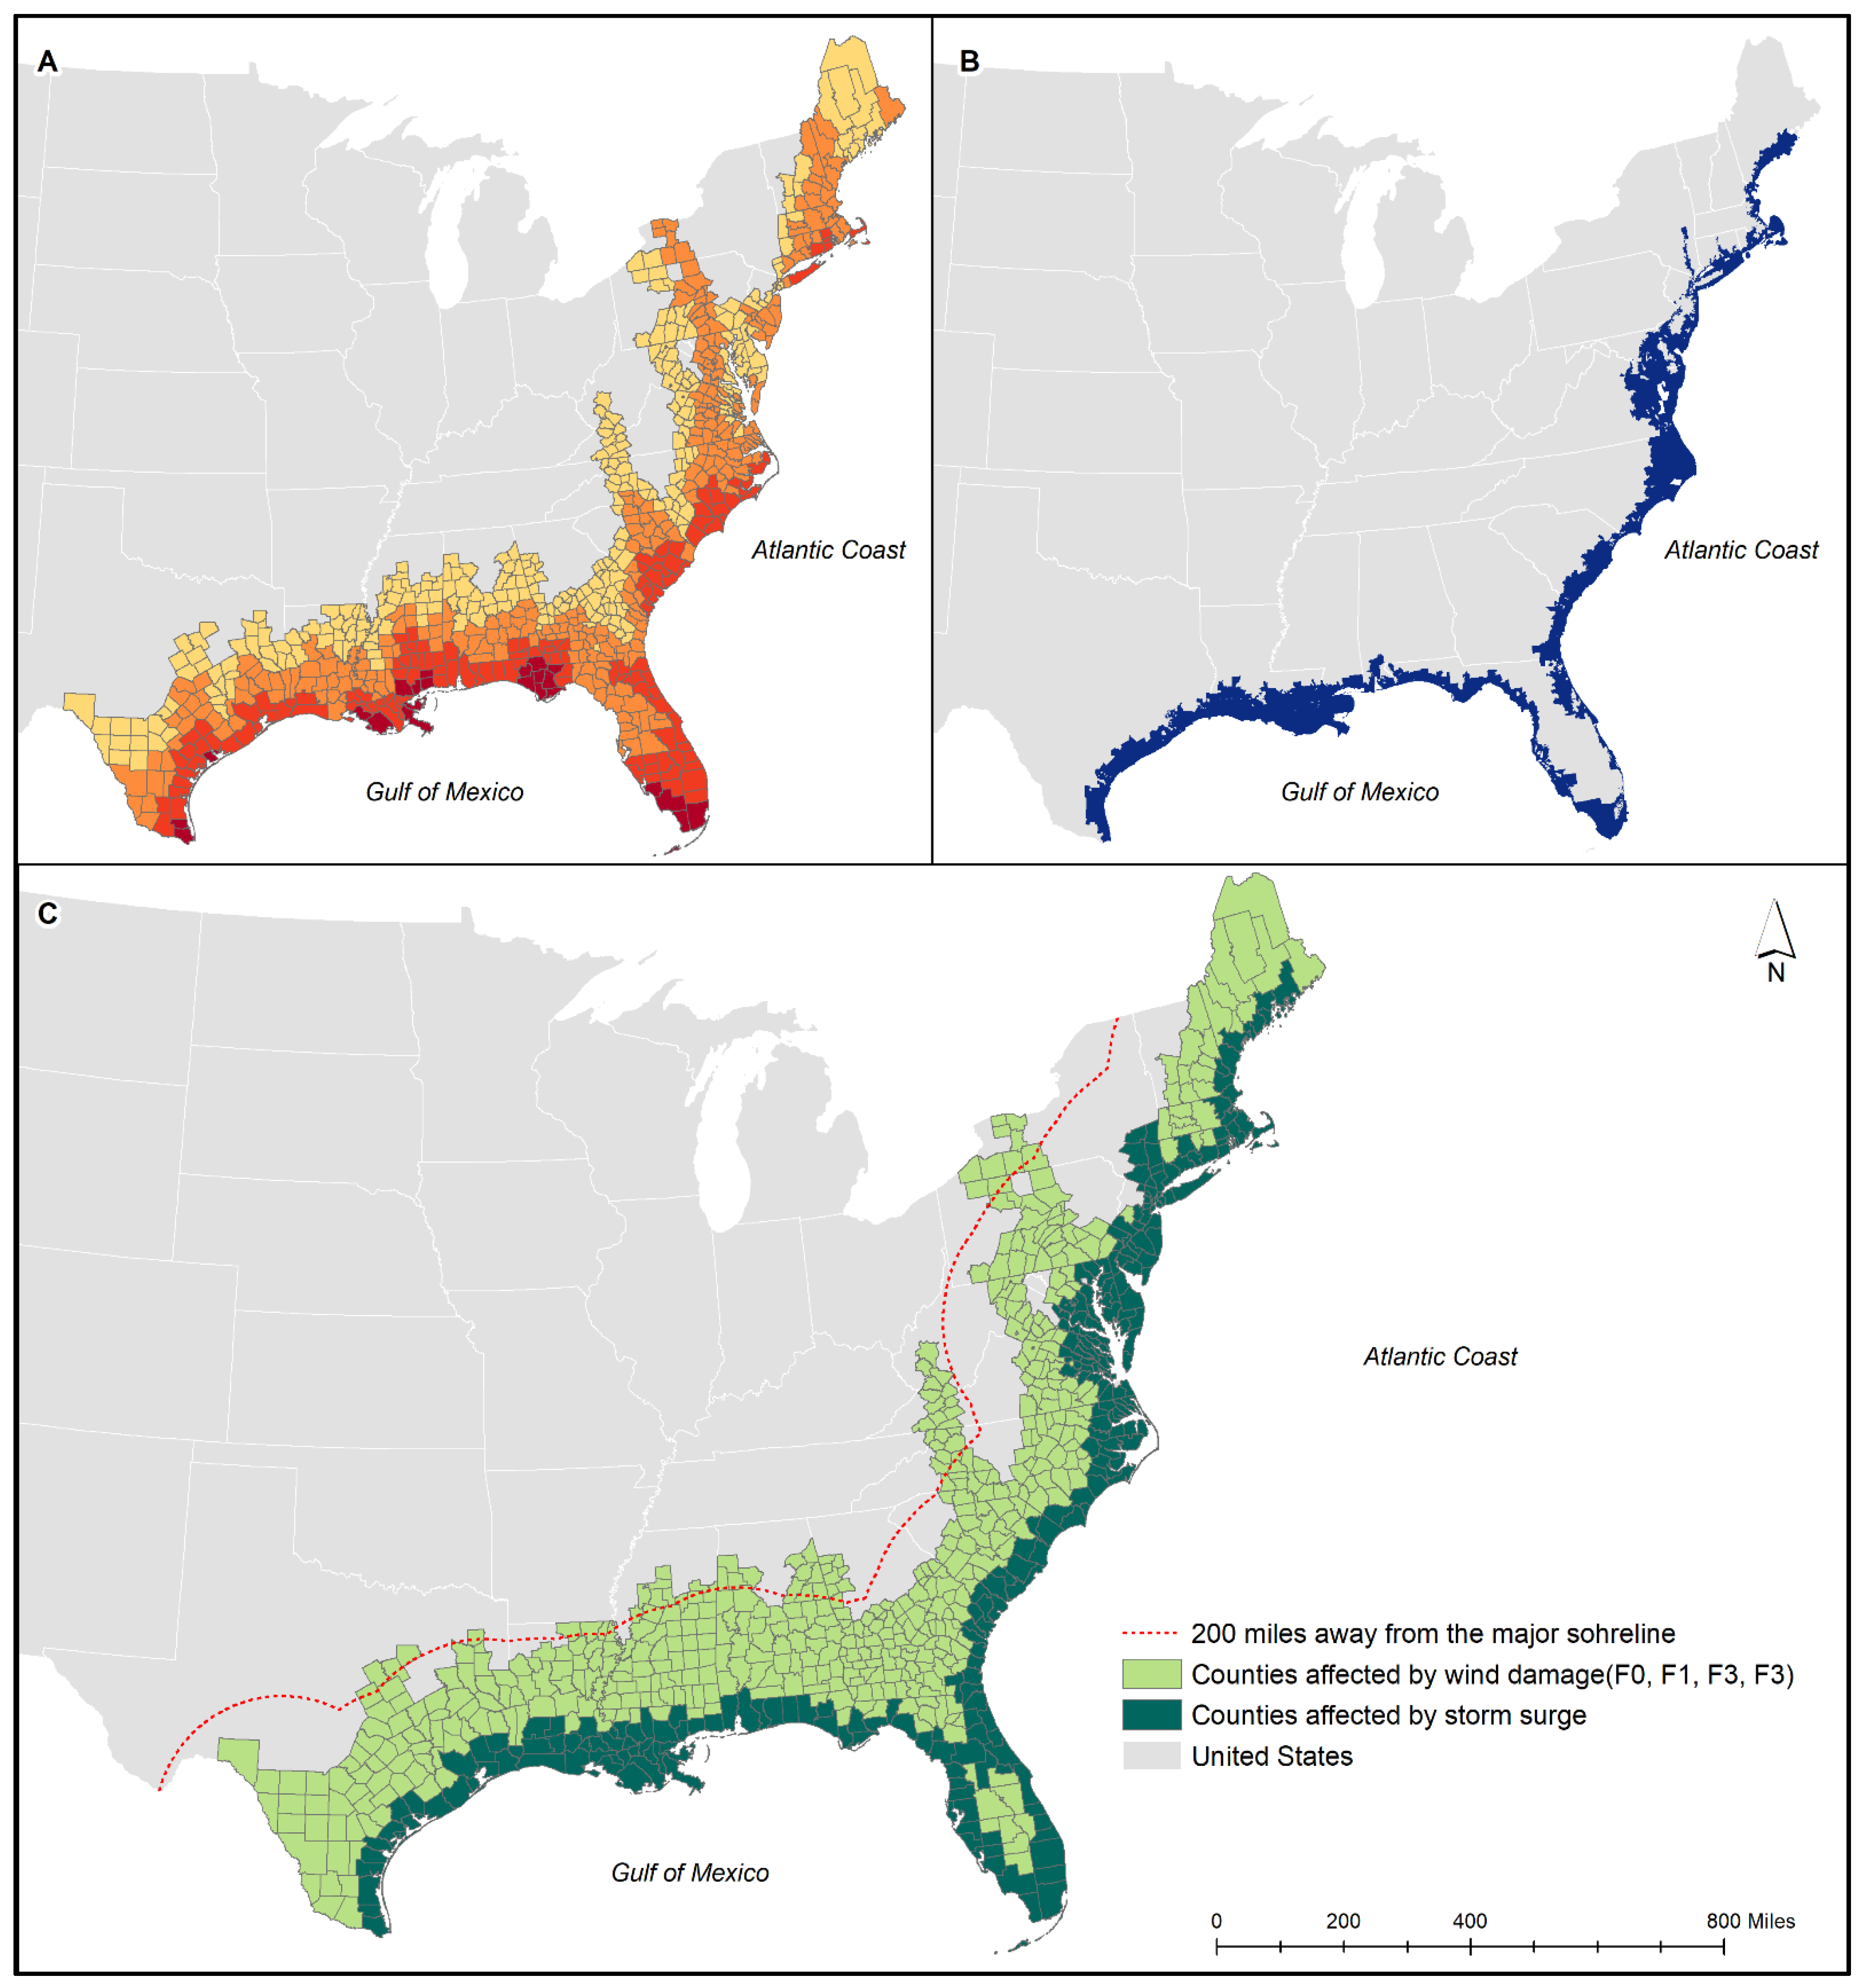
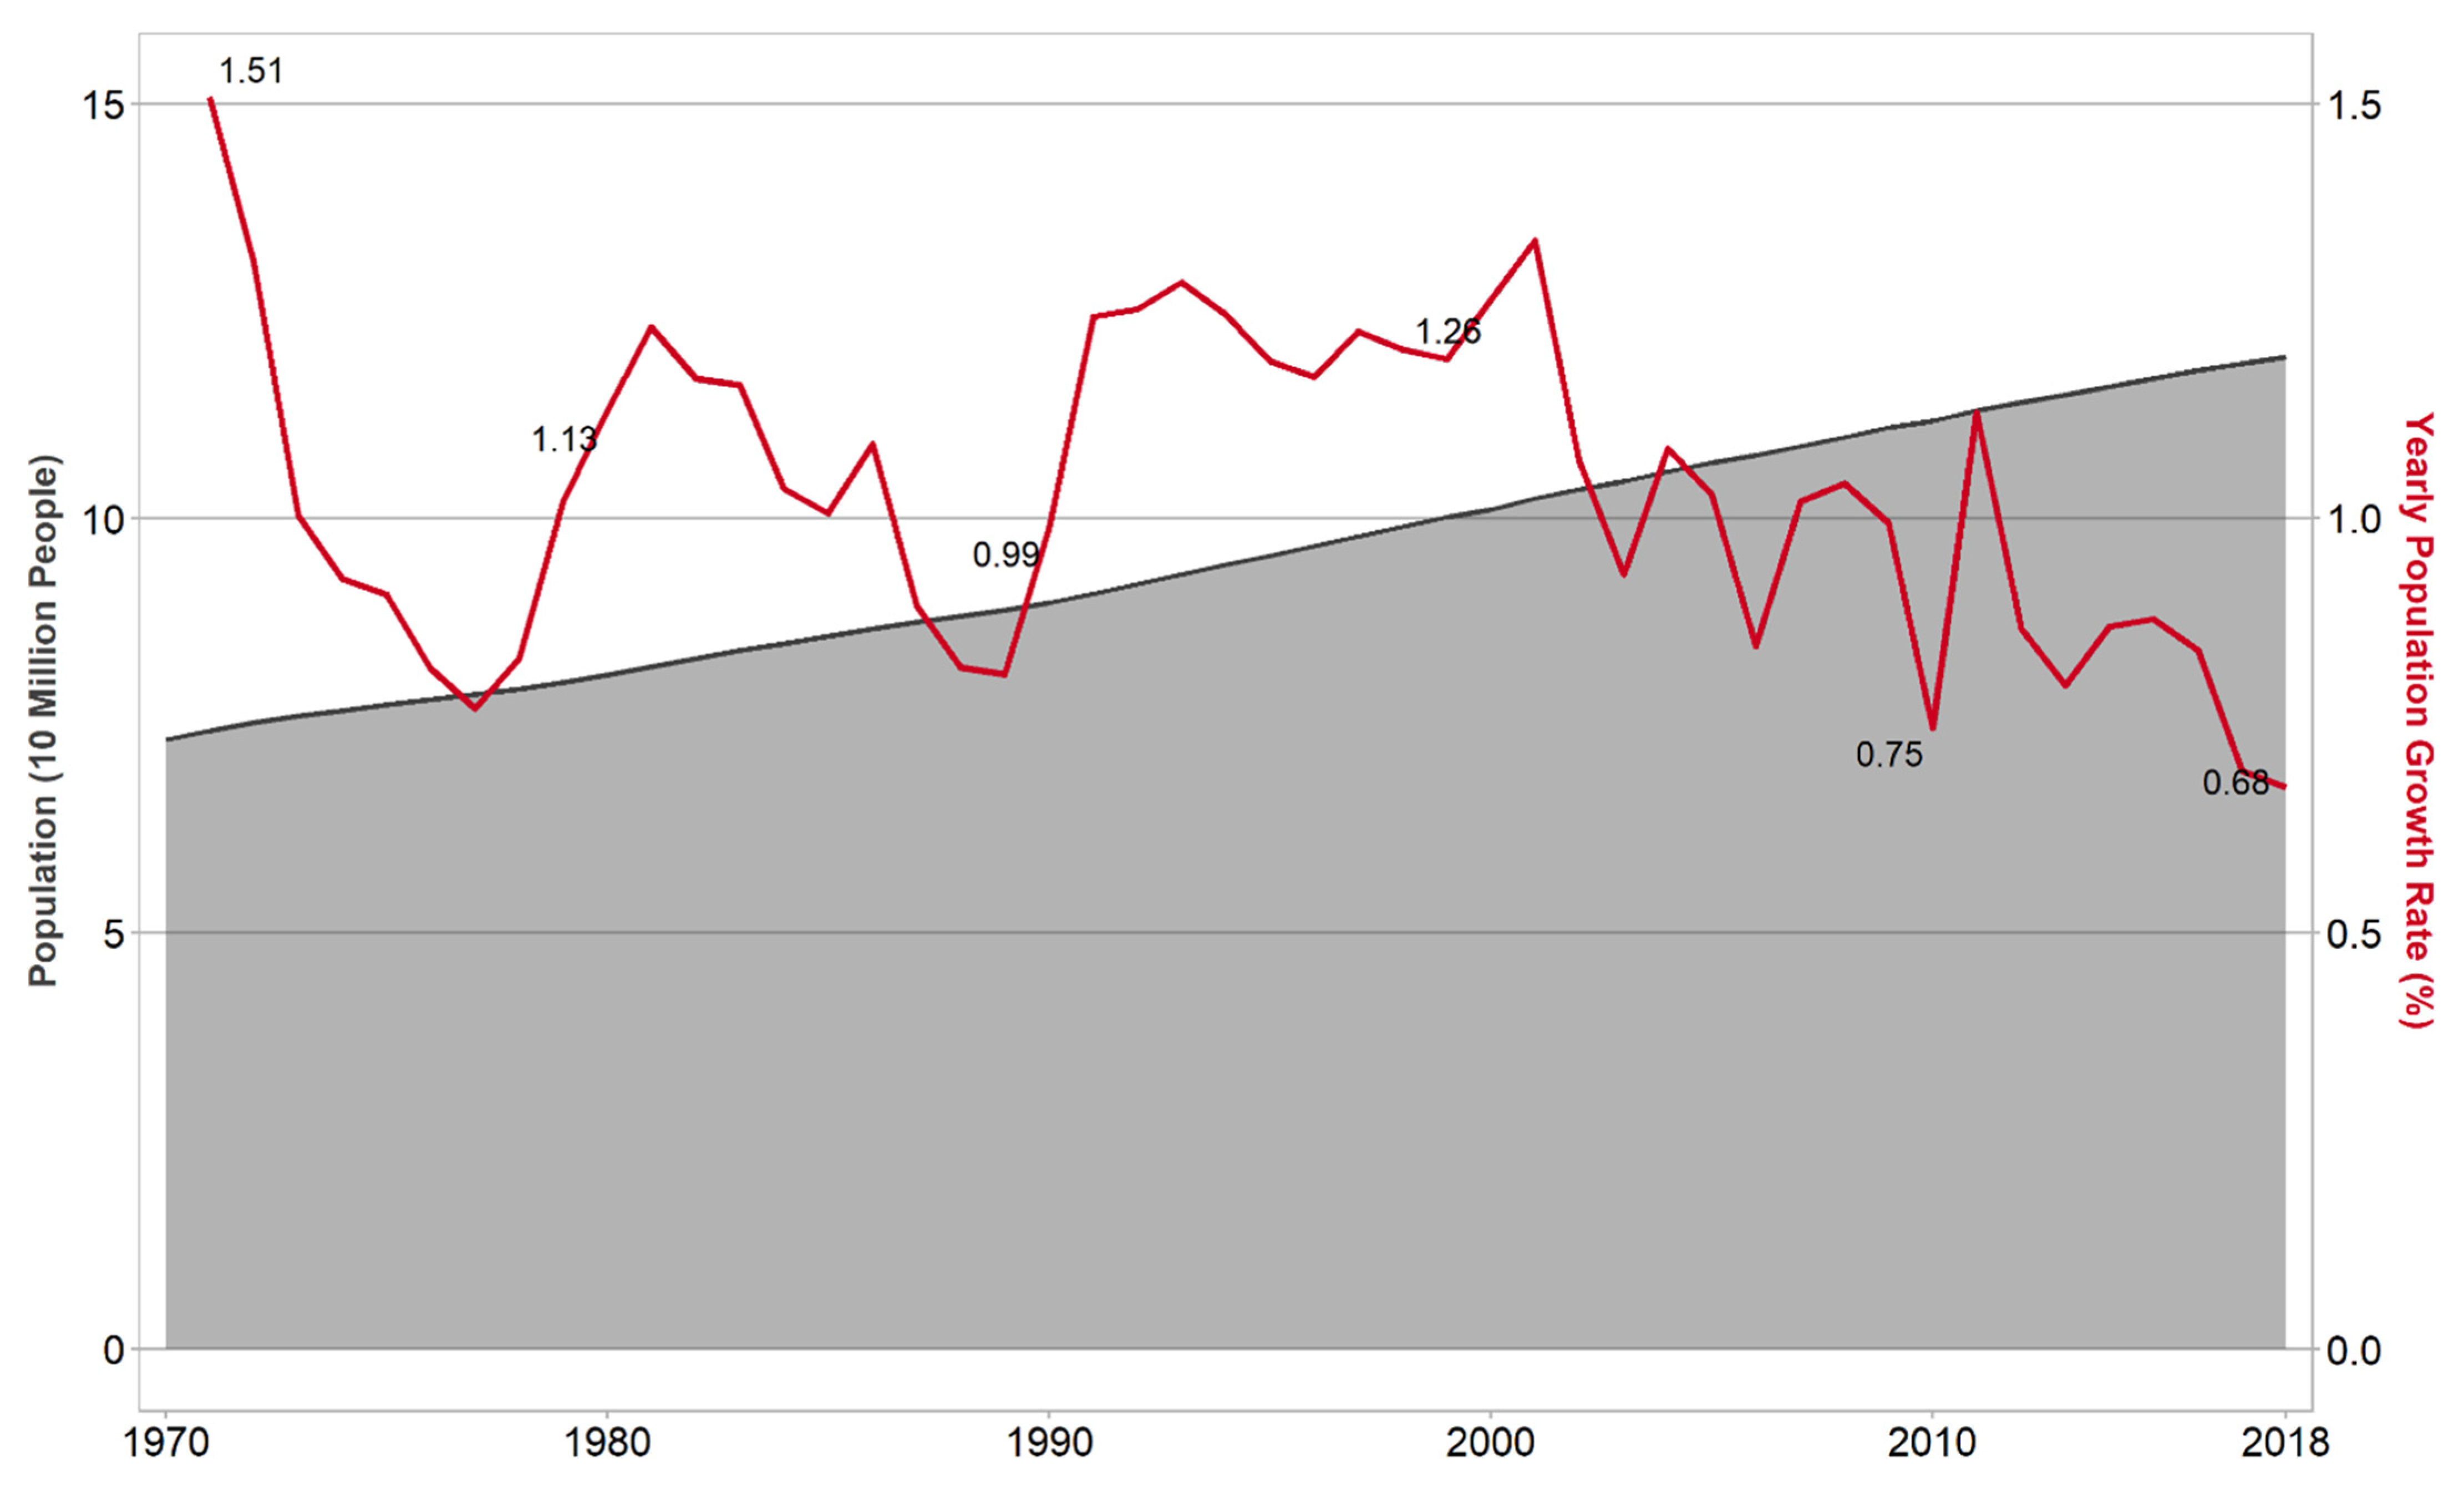
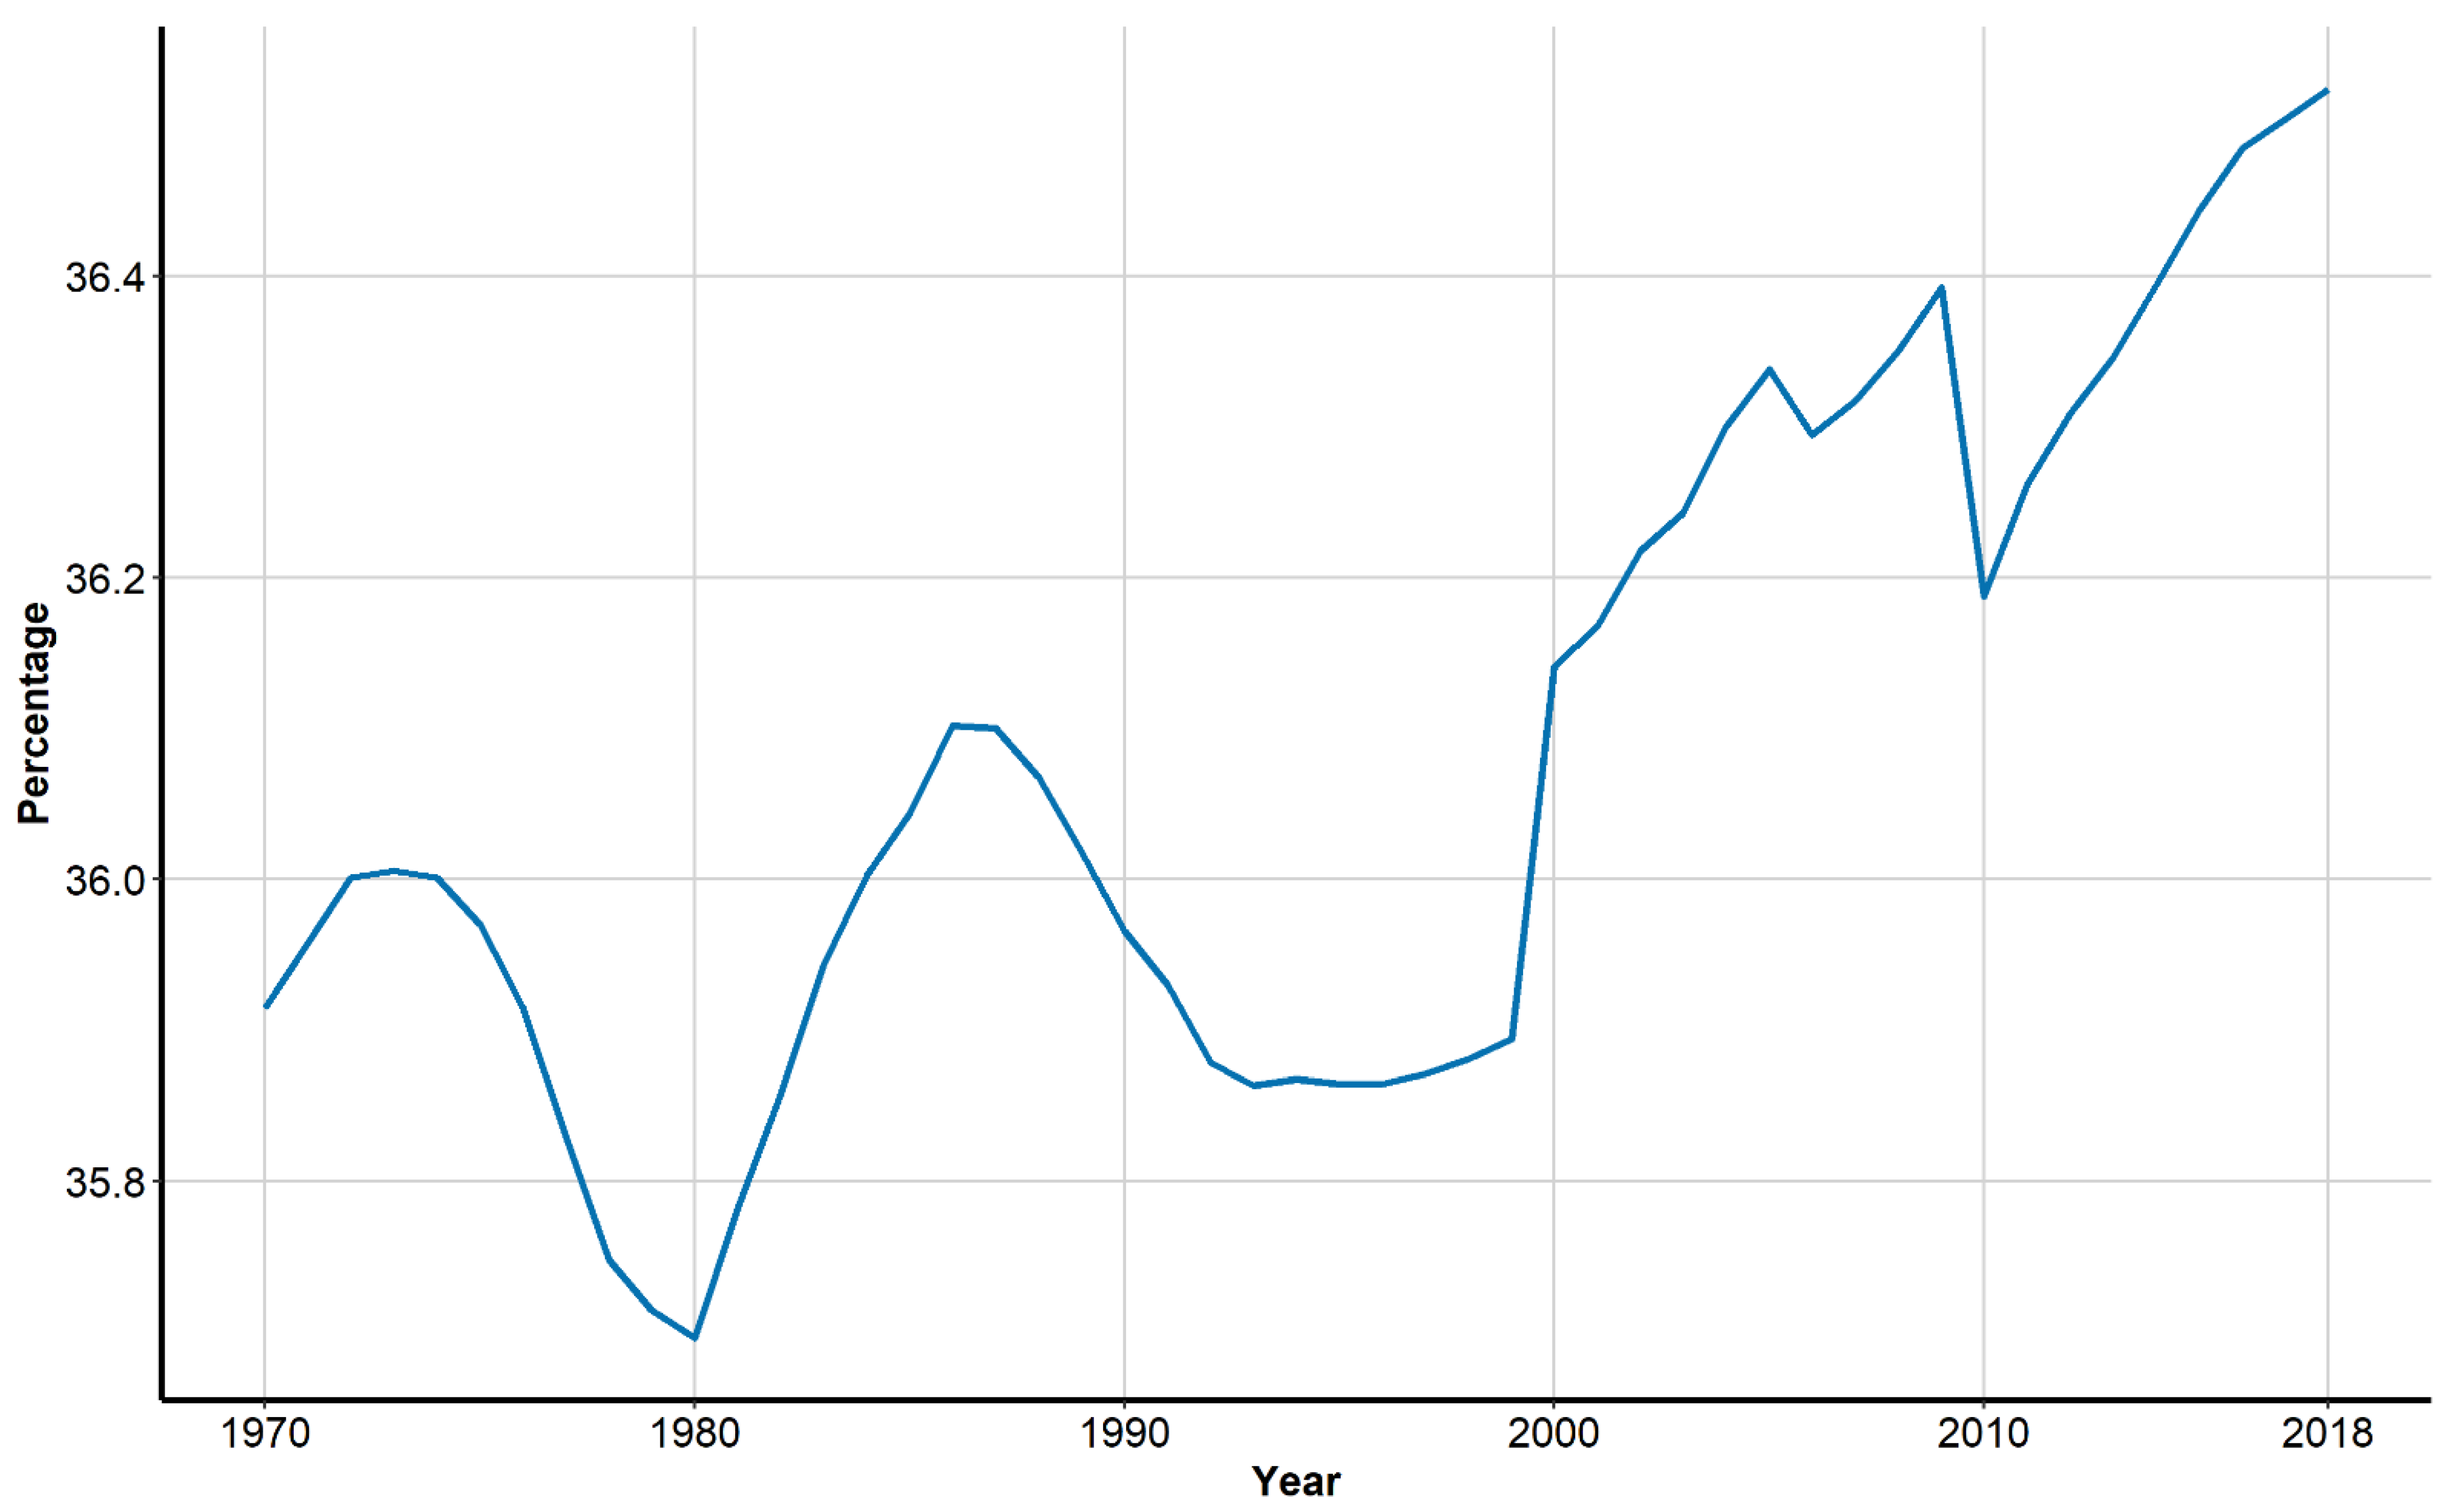
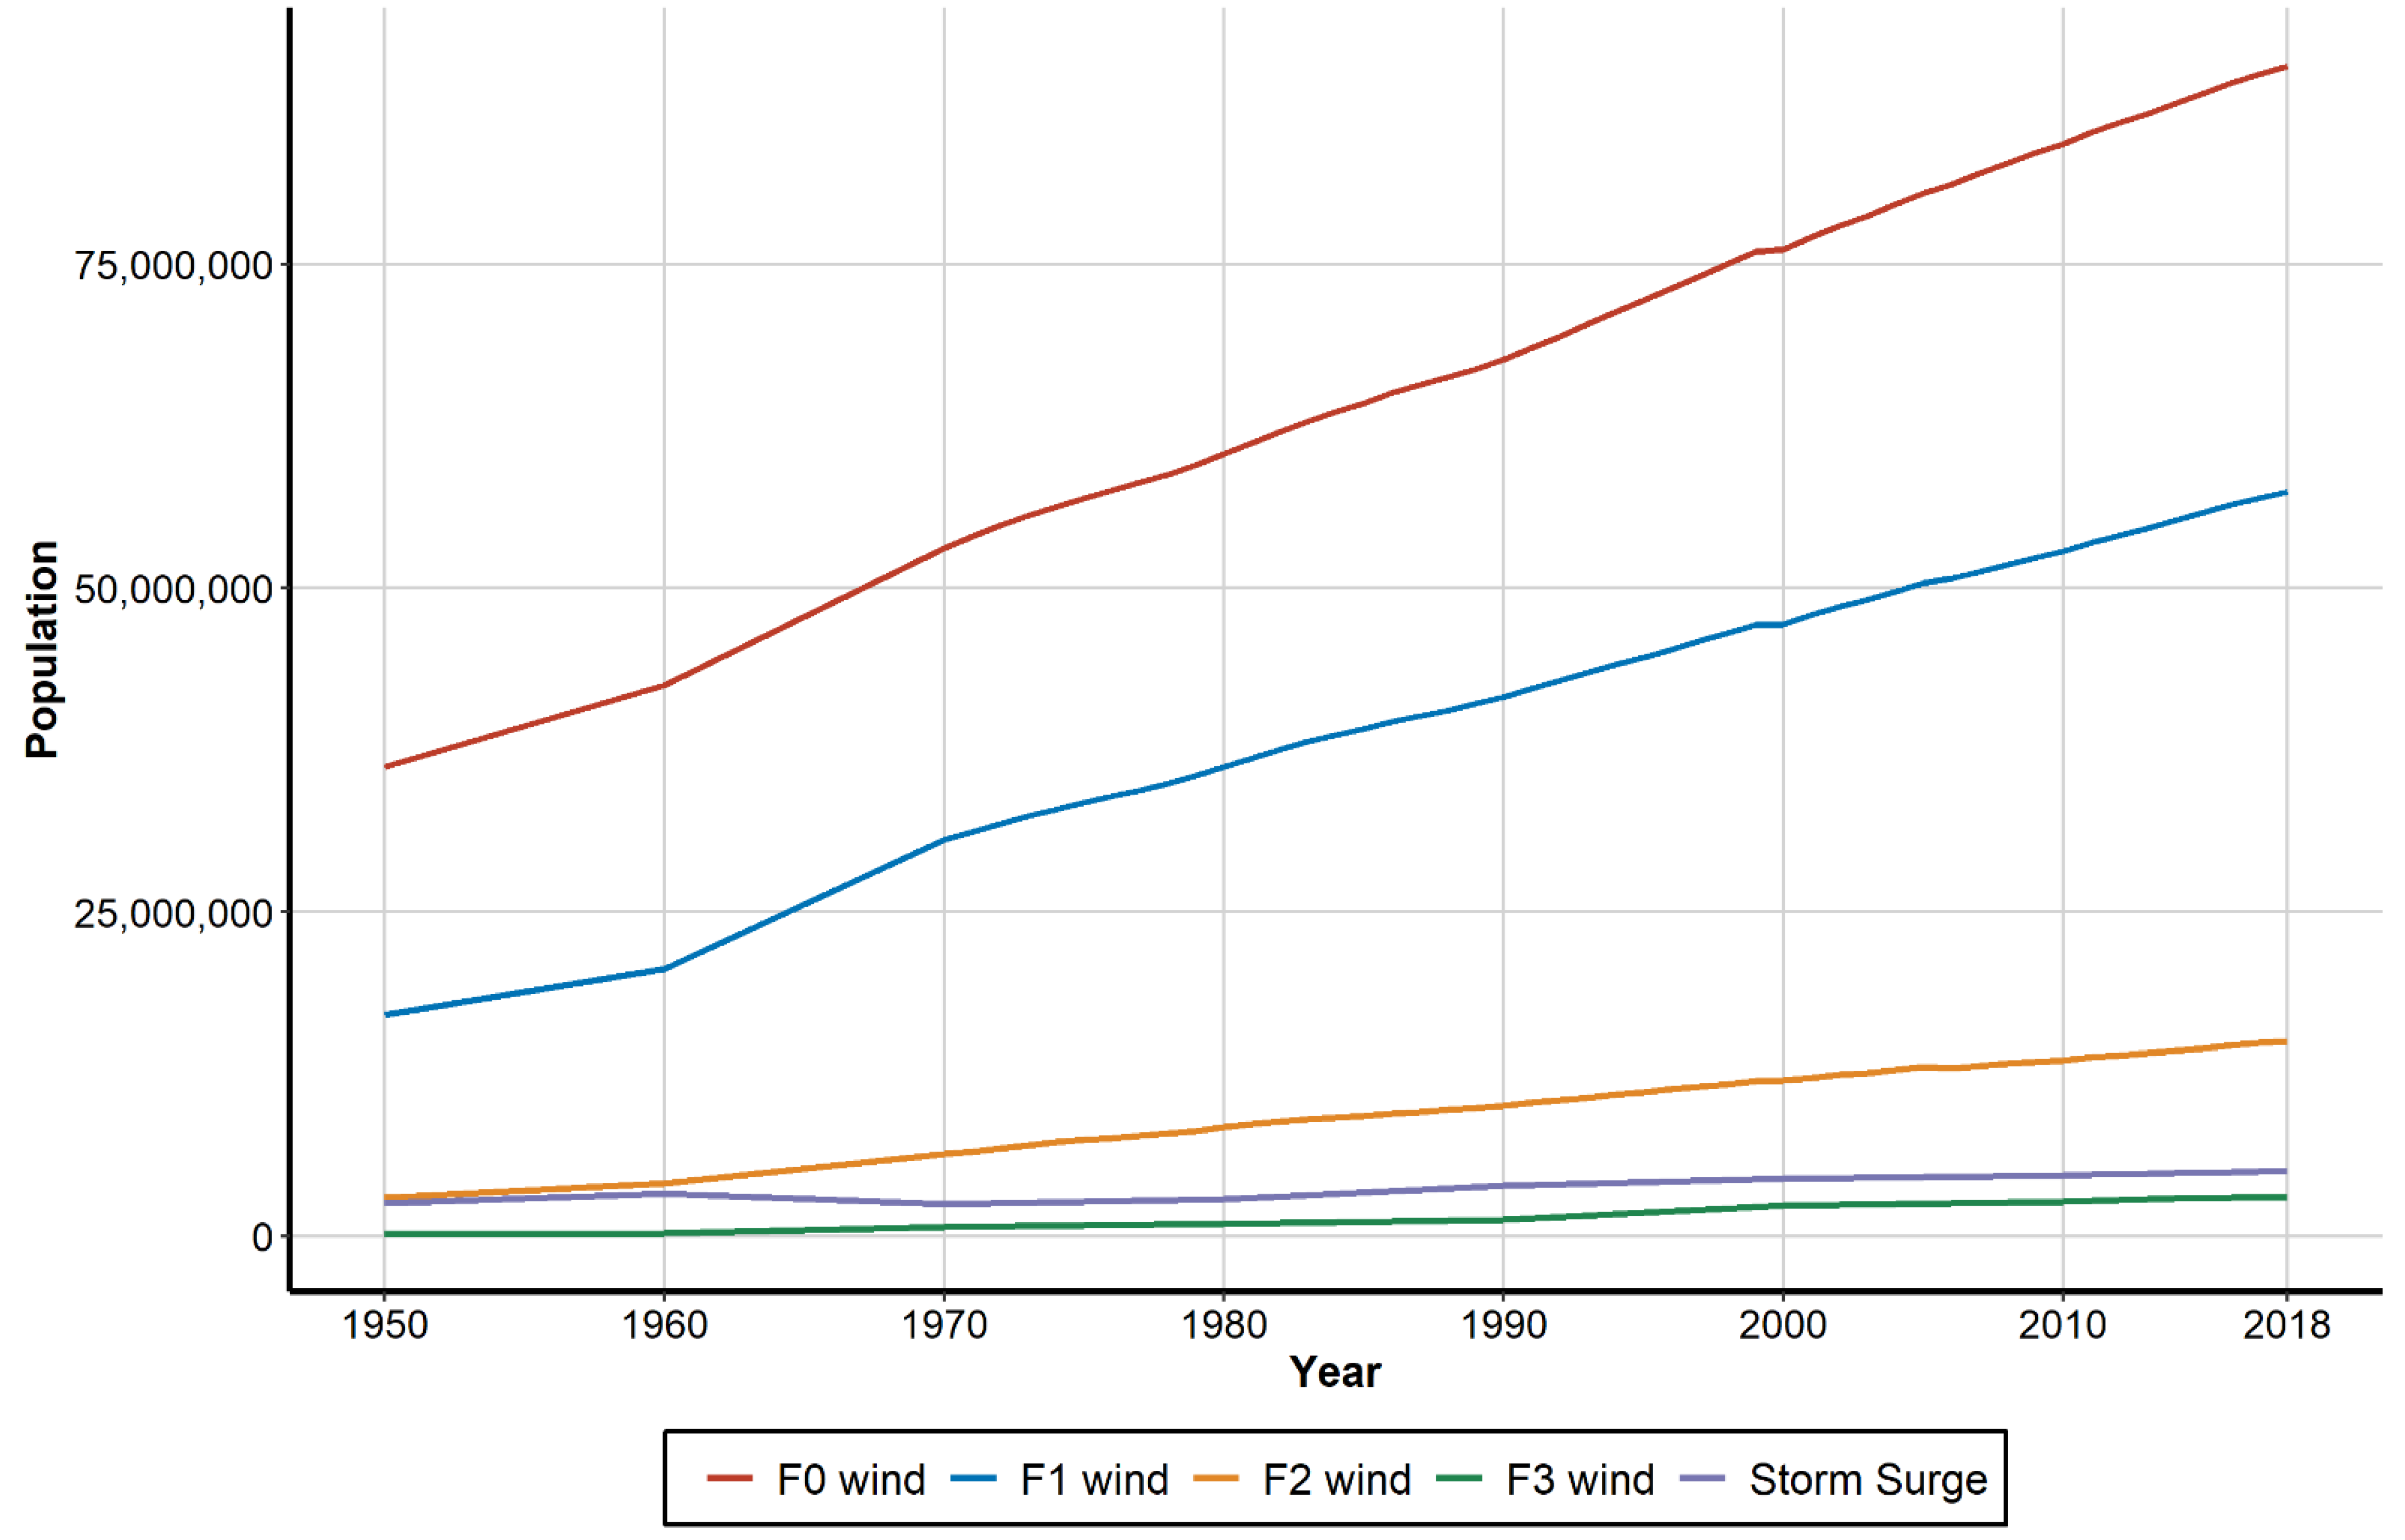
Publisher’s Note: MDPI stays neutral with regard to jurisdictional claims in published maps and institutional affiliations. |
© 2021 by the author. Licensee MDPI, Basel, Switzerland. This article is an open access article distributed under the terms and conditions of the Creative Commons Attribution (CC BY) license (https://creativecommons.org/licenses/by/4.0/).