Abstract
As a driving force for regional development, innovation holds an increasing position in regional competitiveness, and a reasonable and coordinated innovation network structure can promote high-quality regional development. Utilizing the modified gravity model and social network analysis method, an innovation network composed of 27 cities in the Yangtze River Delta urban agglomeration from 2010 to 2021 was studied. The following conclusions were founded: (1) The innovation development level in the Yangtze River Delta urban agglomeration was constantly improving, and the innovation development level generally showed a spatial pattern of high in the southeast and low in the northwest. (2) The intensity and density of innovation network correlations in urban agglomerations were increasing, and the centrality of network nodes had an obvious hierarchical characteristic. The innovation network had a significant core–periphery spatial structure, with core cities that had higher centrality, such as Shanghai, Nanjing, and Hangzhou, playing the role of “intermediaries” and “bridges”, while cities with lower centrality, such as Anhui and cities in northern Jiangsu, generally played the role of “periphery actors” in the network. (3) The spatial correlation network of innovation of the Yangtze River Delta urban agglomeration could be divided into four blocks, namely, main benefit, broker, two-way spillover, and net spillover, and the spillover effect among them had obvious gradient characteristics of hierarchy.
1. Introduction
Alongside the advancement of the knowledge economy and the deepening of the globalization of innovation, knowledge and innovation correlations at different spatial scales have become important issues in regional economic development [1,2], and innovation is progressively turning into a critical factor in regional and urban economic growth [3]. The 19th Party Congress’s report emphasizes the need to put innovation at the heart of development and clearly proposes the implementation of a strategy of innovation-driven development. Within the framework of the dual strategies of regional integration and innovation-driven development, strengthening regional innovation correlations and synergistic development has become an important way to address the imbalance in regional development and enhance regional innovation capabilities. In particular, the transformation of “local space” into “mobile space” [4] and the evolution of innovation spatial patterns from hierarchical to networked have led to changes in regional innovation functions and innovation patterns, resulting in the limited explanatory power of traditional central place theory for regional innovation based on the scale grade perspective. Therefore, exploring the spatial correlation of innovation among different cities and building a reasonable and effective innovation network pattern have become the focus of innovation research in the knowledge economy [5,6]. It is necessary to conduct a new survey from the perspective of networks, as the urban innovation network formed on this basis will play a vital role in promoting the high-quality construction of cities.
The research on innovation correlation can be traced back to Marshall’s industrial park theory of the late 19th century, a theory that emphasizes the external economic and knowledge-sharing effects of industrial agglomeration [7]. Advocates of “new regionalism”, valuing local knowledge networks in regional innovation systems, emphasize the network advantages of rootedness and geographic proximity [8,9,10,11]. After entering the 21st century, the space of flows, a space that eliminates the role of geographical adjacency through the flow of factors and thus achieves time sharing, has become the new predominant type of spatial structure [12,13,14,15]. Innovation networks are formed at multiple spatial scales and involve spatiotemporal sharing between cities at multiple levels [16,17], with polycentric city regions characterized by the three dimensions of form, function, and governance becoming a significant form of regional spatial organization in the new era. Bathelt considered that the advantage of local innovation came from the integration and transformation of tacit and explicit knowledge at different spatial scales, thus building a “global pipeline–local buzz” model of knowledge flows [18]. Subsequent studies of world city networks, in accordance with the principle of flow space, have broken the bonds of realistic distance. Based on the element flow of various correlations, studies on the exploration of a world city system reveal the multilevel implicit integration between cities in various fields, such as economy and innovation [19,20,21]. Moreover, these studies focus on the research of “urban thirdness”, which explores the innovation pattern between cities [22], the evolution path of innovation networks [23], the spatial scale and mechanism of knowledge spillover [24], and the relationship between network structure and urban innovation performance [25,26]. In addition, Actor–Network Theory (ANT) and Assemblage Theory conceive of cities as urban assemblages—heterogeneous associations of human and non-human elements that turn cities into processual, emergent entities [27]. Competition and cooperation are fundamental features of social and ecological processes at all scales of analysis, from neighborhood dynamics to networks of global city-regions [28]. Urban innovation networks are the process of constructing, developing, and updating heterogeneous actor networks. Differentiated innovation connections form different urban innovation patterns. Rather than an underlying structure or a structural context, space thus appears as a relational effect. And this makes it necessary to change the focus from the space of the city to the multiple urban assemblages in which urban topologies are made and remade [29,30].
Intercity innovation correlations are an important manifestation of innovation activities, thus referring to the relations between cities due to the exchange of innovation factors, the synergy of innovation activities, etc. [31]. Scholars in China have produced fruitful research results on innovative cities, mainly concentrating on the agglomeration and diffusion of innovation factors among cities [32], the spatial pattern of innovation networks at multiple scales [33], the geographical proximity of innovation networks [34,35], the evolutionary dynamics of innovation networks [36], the mechanism for the development of innovation networks [37], the organizational model of networks [38,39], and the empirical research on innovation networks from three perspectives: enterprises [40], industries (clusters) [41], and regions (cities) [42,43]. Regarding particular research approaches, the assessment system is primarily designed from the viewpoints of innovation components and innovation functions, and the multi-indicator comprehensive evaluation method combined with mathematical models such as factor analysis, entropy method, and regression analysis is used for comprehensive measurement and evaluation. Social network analysis [44], spatial econometric models [45], two-mode network models [46], and exponential random graph models [47] are the most commonly used methods to study the evolution and spatial structure of innovation networks. In general, scientifically identifying the importance and characteristic attributes of urban innovation networks and then analyzing the structure and correlation of innovation networks are important elements of urban innovation network research.
In summary, the current research has fully discussed the concept of urban innovation, the assessment of urban innovation levels, and the spatial correlations of regional collaborative innovation, but there are still some shortcomings. First, most studies on urban innovation levels and spatial network characteristics have focused on the analysis of the current situation, and thus, research on the dynamic evolution process needs to be deepened. Second, the measurement of the urban innovation network is mostly achieved using a single-indicator approach, hence lacking a comprehensive dimension and being unable to measure regional innovation quality from a macro perspective. Finally, most studies focus on temporal changes in the centrality of cities (points) and lack basic assessments of the changes in the strength of relationships between cities (lines), so it is impossible to accurately identify the trend of correlation of urban innovation and changes in the network status of city nodes. Considering the prominent function, important position, and demonstration effect of the Yangtze River Delta urban agglomeration in China’s innovation network, this study takes the Yangtze River Delta urban agglomeration as the research object and focuses on the innovation development level of the urban agglomeration and its network structure evolution characteristics based on the viewpoint of complex networks; furthermore, this study adopts a comprehensive evaluation of multiple indicators, a modified gravity model, and a social network analysis method to measure the spatial–temporal evolution of the innovation development level of the urban agglomeration of the Yangtze River Delta from 2010 to 2021. The findings can enrich the research content of innovation geography at the theoretical level, contribute to a deeper understanding of the evolutionary laws of urban innovation development and innovation networks, and provide a decision-making basis for the high-quality development of collaborative innovation in the Yangtze River Delta urban agglomeration.
2. Materials and Methods
2.1. Research Area and Data Source
The Yangtze River Delta urban agglomeration, situated in the eastern coastal region of China, is one of the most active, open, and innovative regions in China. It is crucial to the Yangtze River Economic Belt and the Belt and Road Initiative’s construction. On the basis of the Yangtze River Delta Urban Agglomeration Development Plan (2016–2020) issued by the State Department of China, the study area covers 27 prefecture-level cities, including core areas of Jiangsu Province, Zhejiang Province, Anhui Province, and Shanghai Municipality, with a land area of 225,000 km2 (Figure 1). The seventh national census shows that the total resident population of the Yangtze River Delta urban agglomeration reached 235 million by the end of 2020, with a population density of 656 persons/km2, and this density is 4.5 times the national average. Research data were mainly from the 2011–2022 China Urban Statistical Yearbook, China Regional Economic Statistical Yearbook, and provincial and municipal statistical yearbooks. Traffic data (highways, national roads, provincial roads, county roads, township roads, and other roads) were derived from the Open Street Map website (http://www.openstreetmap.org/, accessed on 16 December 2022), and after topology checking, road network datasets with reasonable topological connectivity relationships were constructed.
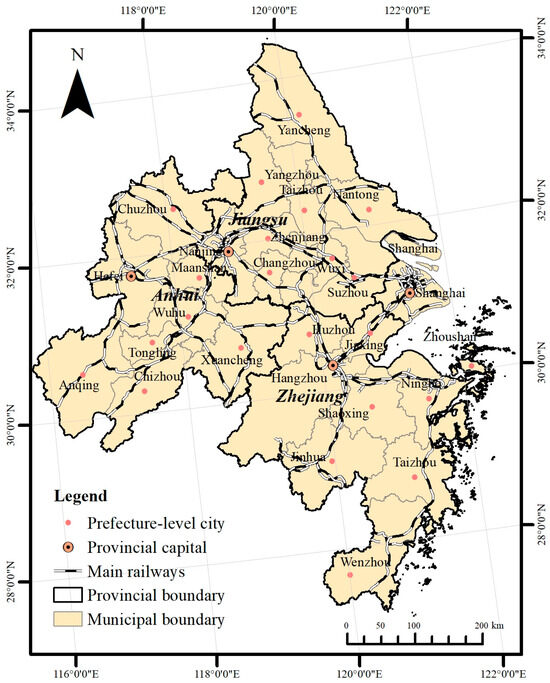
Figure 1.
Location of the research area.
2.2. Indicator System Construction
The theory of urban innovation systems considers that knowledge creation is positively correlated with R&D investment, human capital, and education level. Intercity innovation diffusion relies on transportation networks, communication networks, and the internet to realize the flow of business, capital, and information [48,49]. In the internet age, indicators such as the number of internet users, computers per capita, and broadband usage have become effective indicators for evaluating the flow of information and knowledge among regions [50]. Drawing on the research achievements of the China Science and Technology Development Strategy Research Group [51] and urban geographers such as Lv Lachang and Fang Chuanglin [52,53], this study identified the key factors affecting the innovation level and optimized the indicator system of the urban innovation development level. According to the principle of combining scientificity, operability, prospective, and feasibility, 24 indices were selected to construct the evaluation index system of the urban innovation development level from three criteria: knowledge innovation capacity, technological innovation capacity, and innovation basis (Table 1).

Table 1.
Evaluation index system of urban innovation development level.
2.3. Research Methods
2.3.1. Comprehensive Evaluation Method
The entropy approach was used to determine an indicator’s weight in the index system based on the amount of available information provided by each indicator [54]. The “entropy weight” theory is an objective weighting method, and the weight of each indicator can be calculated according to its variation degree, which avoids the influence of human subjectivity on the results and makes up for the limits of inter-correlations between indicators to some extent. Then, 27 prefecture-level cities’ level of innovative development in the Yangtze River Delta urban agglomeration from 2000 to 2021 was estimated. The value of the innovative development level was calculated as follows:
where is the comprehensive score of the innovative development level of city , is the standardized value for the -th innovation indicator for city , is the entropy value of index , and is the weight of index . The higher the numerical value of , the better the city’s level of innovation.
2.3.2. Modified Gravity Model
The gravitational model system has a generalized fractal property, which means that the scale of urban innovation has a certain similarity to entities in real life. The innovation correlations between cities can be defined by the scale of urban innovation and spatial distance [55]. So, the gravity model is an important tool for assessing factor flows and innovation correlations between cities. Most of the current studies have used the gravity model to study intercity innovation correlations [56]. In this paper, the traditional gravitational model is modified, and the modified gravitational model is as follows:
where is the strength of innovation correlations between city and city ; and are the innovation levels of city and city , respectively; and is the network distance between two cities calculated using the OD cost matrix. Traditional studies usually use as the gravitational constant but do not consider the development gap between two cities. Considering the bidirectional and asymmetric nature of innovation correlations between cities, is chosen as the modified empirical constant for this paper, and its calculation formula is .
2.3.3. Social Network Analysis
Social network analysis is an interdisciplinary analytical method for studying the overall characteristics and individual characteristics of spatial correlation networks. The Yangtze River Delta urban agglomeration’s structural properties of innovation networks were evaluated by using social network analysis, including the overall network structure, individual network structure, core–periphery structure, and modular analysis. The network indices and their symbolization are shown in Table 2.
Table 2.
Network indices and symbolization.
3. Results
3.1. Spatial Characteristics of Innovation Development Level
According to the index system, Formula (1) was applied to measure the innovation development level of 27 cities in the Yangtze River Delta urban agglomeration from 2010 to 2021, and ArcGIS 10.2 was used for spatial visualization (Figure 2). The innovation development level generally showed a spatial pattern of high in the southeast and low in the northwest. The specific results were as follows: (1) From 2010 to 2021, the urban innovation development level continuously improved. In 2010, Hangzhou City had the highest score for urban innovation development level (0.63), while Chizhou City had the lowest score (0.03). In 2021, Shanghai became the city with the highest score, increasing to 0.92, while the score of Chizhou City, the lowest, also increased to 0.031. In terms of the grade of innovation level, in 2010, there were 5 cities with high or relatively high innovation level grades and 19 cities with low or relatively low innovation level grades. In 2021, eight cities were identified as having high or relatively high levels of innovation, and the number of cities with low or relatively low grades of innovation level decreased to 12. (2) In the urban agglomeration of the Yangtze River Delta, the difference between the innovation development levels of various cities has widened year by year from 2010 to 2021. In 2010, the highest score of Hangzhou was 21 times that of Chizhou City, which had the lowest score, while in 2021, the innovation development level of Shanghai, with the highest score, was 30 times that of Chizhou City, with the lowest score. The disparity in innovation development level of different cities was obvious. (3) The level of urban innovation development was positively correlated with the city’s administrative level. The scores of innovation development level of the three subprovincial cities, Shanghai, Hangzhou, and Nanjing, were in a leading position in 2010 to 2021, and the total score of the three cities accounts for 52.8% of the total of the urban agglomeration, indicating that the capacity for allocation of the three cities for various innovation factors and innovation resources was much higher than that of other cities in the province.
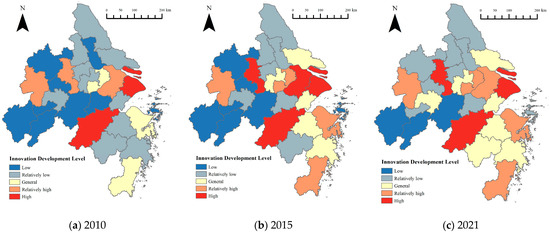
Figure 2.
Spatiotemporal evolution of urban innovation development level.
3.2. Network Structure Characteristics of the Innovation Development Level
3.2.1. Characteristics of Innovation Network Correlation
The Yangtze River Delta urban agglomeration’s innovation correlations from 2010 to 2021 were evaluated by utilizing the modified gravity model, and ArcGIS 10.2 was used for spatial visualization (Figure 3). The scope of the primary and secondary networks of innovation correlations had gradually expanded, with less change in the third, fourth, and fifth networks from 2010 to 2021. Specifically, the correlation strength of the innovation network varied significantly, and the correlation axes of high-level innovation correlations increased significantly from 2010 to 2021. In 2010, the strongest innovation correlations were between Shanghai, Hangzhou, and Wuxi City, forming two secondary innovation correlation axes of Shanghai–Hangzhou and Shanghai–Wuxi. In 2015, the number of secondary innovation correlation axes increased to six, and five new secondary innovation correlation axes were added, namely Suzhou–Jiaxing, Nanjing–Changzhou, Nanjing–Wuhu, and Nanjing–Maanshan. In 2021, both the level and number of innovation correlation axes were greatly increased; the innovation correlation axes of Shanghai–Jiaxing, Shanghai–Suzhou, and Suzhou–Wuxi were upgraded to primary, the number of secondary innovation correlation axes increased to seven, and the number of tertiary innovation correlation axes in the central region of the Yangtze River Delta urban agglomeration increased significantly. The innovation correlation axes of Shanghai–Hangzhou, Shanghai–Hangzhou, and Nanjing–Shanghai formed a triangle. Shanghai, Nanjing Hangzhou, and other economically developed coastal cities, had more subjects participating in innovation cooperation, and the innovation correlations among innovation subjects were relatively close, forming an innovation network that was conducive to the flow and spillover of local knowledge. Nanjing had a close connection with some cities in Anhui Province, and this was mainly caused by geographical proximity. In general, the Yangtze River Delta urban agglomeration basically formed a network structure with Shanghai, Hangzhou, Nanjing, and Suzhou as the core, radiating to the surrounding cities, and the network correlation was gradually increasing. In 2010, 2015, and 2022, the innovation network density was 0.257, 0.262, and 0.265, and the average cluster coefficient was 0.361, 0.383, and 0.391, respectively, indicating that the innovation cooperation and correlation between cities were continuously strengthened and clustered, and the phenomenon of a “local area network” appeared within the network.
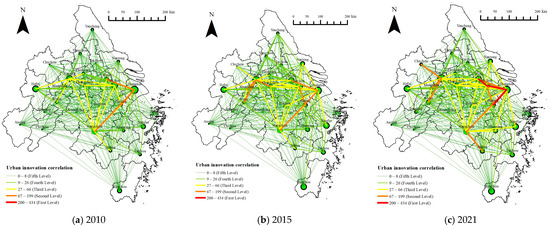
Figure 3.
Spatial correlation network of innovation.
3.2.2. Centrality Analysis
Pursuant to the result of innovation correlation among cities in 2010, 2015, and 2021, a three-year network dichotomous matrix was built. The degree centrality and betweenness centrality of each city in 2010, 2015, and 2021 were computed using Ucinet. According to the inverse distance weight method in ArcGIS, spatial interpolation analysis was conducted. Based on this, distribution maps of degree centrality (Figure 4) and betweenness centrality (Figure 5) from 2010 to 2021 were obtained.
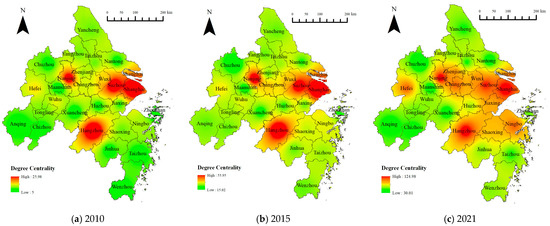
Figure 4.
Degree centrality of spatial correlation network of innovation.
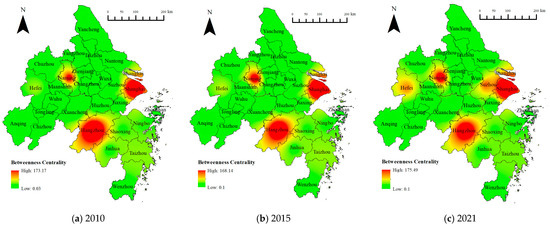
Figure 5.
Betweenness centrality of spatial correlation network of innovation.
- (1)
- Degree centrality
As shown in Figure 4, from 2010 to 2021, the average degree centrality of prefecture-level cities increased from 10.89 to 64.07, and the number of network nodes exceeding the average changed from 8 to 15, indicating that the innovation correlations among cities became closer. Specifically, in 2010, the degree centrality of all cities was generally low and showed notable discrepancies in space. High-degree-centrality regions were mostly concentrated in Hangzhou, Shanghai, and Nanjing, with the highest value of 25.98, indicating that the centrality of the core node cities in the spatial correlation network in 2010 was weak, and the radiation effect and driving ability were limited. In 2015, the degree centrality of each city had significantly improved, and Shanghai, Nanjing, and Hangzhou were still the regions with the highest degree centrality, with a maximum value of 55.95. The degree centrality of Wuxi and Suzhou showed significant growth, forming innovation axes with neighboring Shanghai and Nanjing. At the same time, the degree centrality of the low-value area also increased significantly, with the lowest value rising from 2 to 15.02. In 2021, the degree centrality of the Yangtze River Delta urban agglomeration continued to grow, forming innovation axes shaped like a “Z”. The growth of Hefei’s degree centrality was prominent. The characteristics and changes in degree centrality, for one thing, reflected the increasing radiating ability and spillover effect of each core node, the strengthening of regional innovation correlations, and the tendency of group development. For another, the Matthew effect was mirrored in the network by it, implying that the strong were always strong. The network status of cities matched the innovation potential, and cities with strong innovation capacity could attract the internal flow of surrounding innovation elements, resulting in a polarization effect and forming a pattern of “the strong become stronger”.
- (2)
- Betweenness centrality
Figure 5 shows that the betweenness centrality of the cities in the Yangtze River Delta urban agglomeration in 2010 varied considerably. Hangzhou, Shanghai, and Nanjing were three provincial capitals with the highest betweenness centrality, among which Hangzhou had a betweenness centrality of 173.17, while Chizhou was the city with the lowest betweenness centrality, at a value of 0.1. Most cities had a generally low betweenness centrality, and the number of cities with a betweenness centrality of less than 1 accounted for 54.5% of all cities. This showed that the three capital cities had the strongest ability to control innovation resources and master the most structural holes. However, most of the cities were at the edge of the network and had not played the role of intermediary transmission, resulting in an unbalanced pattern of betweenness centrality. In 2015, Shanghai, Hangzhou, and Nanjing showed a decreased betweenness centrality, while that of other node cities increased. The betweenness centrality of Hefei and Taizhou surged, the betweenness centrality of five cities exceeded the average, and the lowest one increased from 0.03 to 0.1. In 2021, the betweenness centrality of Shanghai, Hangzhou, and Nanjing increased again, with the highest one reaching 175.49. Suzhou and Hefei made obvious progress and increased rapidly, gradually playing the role of intermediaries in the innovation network and enhancing their control over innovation resources. The betweenness centrality of other cities was also improved to varying degrees and changed from imbalanced to relatively balanced, thus favoring the complete flow of innovation elements in the urban agglomeration network and the positive interaction among different innovation nodes.
3.2.3. Core–Periphery Structure
The core–periphery analysis showed that the innovation correlation network of the Yangtze River Delta urban agglomeration presented a relatively obvious core–periphery structure from 2010 to 2021, with Shanghai, Hangzhou, Nanjing, and Suzhou being the core cities in the network while other cities were the edge cities in the network (Figure 6). Table 3 shows that the overall innovation correlation network density grew from 0.068 in 2010 to 0.286 in 2021, demonstrating that the structural density of the innovation network in the whole Yangtze River Delta urban agglomeration was enhanced. Specifically, from 2010 to 2021, the network density in the core area of the urban agglomeration increased from 0.299 to 0.426, and that in the periphery area changed from 0.012 to 0.111. This indicated that the network correlation of the core area and the periphery area was enhanced, with large hierarchical differences. The density from the core area to the periphery area was always greater than that from the periphery area to the core area, indicating that the spillover effect in the core area was much better than that in the periphery area, and the spatial spillover effect in the periphery area was highly dependent on the core area. On the one hand, this revealed that the core node cities had frequent innovation interaction, while the periphery cities had much less innovation interaction. On the other hand, peripheral cities were more likely to collaborate on innovation with core cities than with other periphery cities in the network. The core–periphery pattern was formed because of this associational tendency.
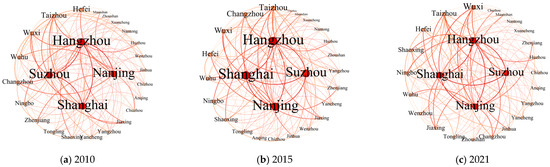
Figure 6.
Core–periphery structure of spatial correlation network of innovation.
Table 3.
Spatial correlation network density of innovation.
3.2.4. Modular Analysis
Through iterative analysis and the CONCOR module of Ucinet, and according to the criterion of a maximum segmentation depth of 2 and a concentration degree of 0.2, 27 cities in the Yangtze River Delta urban agglomeration were grouped into four blocks (Table 4). Overall, there were 551 innovation relations in the four blocks and 225 spatial relations within each block, making up 40.83% of all relations. In addition, there was a total of 326 spatial relations among blocks, accounting for 59.16% of the total. This revealed that spatial correlations and spillover effects between blocks were clearly present. Specifically, in 2010, there were 24 spillover relations in block 1, among which 19 were internal relations and 33 were off-block relations. The expected proportion of internal relations was 26.92%, while the actual proportion was 79.17%. This meant that the total number of relations that a block obtained from other blocks was much larger than the total number of relations that flowed out. The impact of block members’ spillovers was insignificant, so block 1 belonged to the “main benefit” block. Block 2 had a total of 15 spillover relations, of which 10 were internal relations and 49 were off-block relations. The expected proportion of internal relations was 26.92%, while the actual proportion was 66.67%. Because block 2 served as the network’s “bridge” but had little internal interaction, it was a “broker” block. There was a total of 24 spillover relations in block 3, of which 12 were internal relations and 20 were off-block relations. The expected proportion of internal relations was 15.38%, while the actual proportion was 50%, with clear spillover effects occurring both inside and beyond the block. Therefore, block 3 was a “two-way spillover” block. Block 4 had a total of 118 spillover relations, of which 25 were internal relations and 13 were off-block relations. The expected proportion of internal relations was 19.23%, while the actual proportion was 21.19%. Block 4 belonged to the “net spillover” block because of the obvious spillover effect.
Table 4.
Division of spatial correlation network of innovation.
In general, from 2010 to 2021, based on the number of receiving relations and spillover relations, blocks 2 and 4 played the roles of “broker” and “net spillover”, respectively. In 2021, the receiving relation of block 1 was close to the spillover relation, and the relation of members within the block had relatively increased, so it changed from a “main beneficiary” block to a “two-way spillover” block. Moreover, the number of receiving relations of block 3 was higher than that of spillover relations, so it changed to a “main beneficiary” block.
To further analyze the spatial correlation of each block in the innovation network, the network density matrix of each block was constructed. If the block density was larger than the overall network density, it indicated that the innovation network presented a concentrated trend in the block, and the value of 1 was assigned; otherwise, the value of 0 was assigned. The interaction diagram of four blocks was drawn (Figure 7). Specifically, block 4, in addition to its internal correlation, had a spillover effect on blocks 1, 2, and 3. This block had a solid urban development foundation, highly concentrated innovation resources and information, and strong innovation spillover ability, including Shanghai, Hangzhou, Nanjing, and other cities. It was the engine for the innovation development of the Yangtze River Delta urban agglomeration and belonged to the “net spillover block”. Block 2 had a spillover effect on blocks 1 and 4. The members of this block were located around block 4, and their innovation development level was mostly at a high level. At the same time, block 2 continuously received resources from block 1 and block 4, serving as a “bridge” in the spatial correlation network of innovation. Block 3, which was mostly located in the southern part of the urban agglomeration, had an indirect spillover relation with block 1 and block 4 through the “broker” role of block 2. In 2010 and 2015, block 3 was a “two-way spillover” block, and by 2021, it was transformed into a “main benefit” block, requiring more support and contact from block 1 and block 4. The members of block 1 were basically at the periphery of the western network of the urban agglomeration, and in 2010 and 2015, it was a “main benefit” block, while in 2021, it was transformed into a “two-way spillover” block as the urban economy developed, with the innovative factors received continuing to increase. Overall, the transmission relations of each block in the spatial correlation network of the Yangtze River Delta urban agglomeration had obvious gradient characteristics.
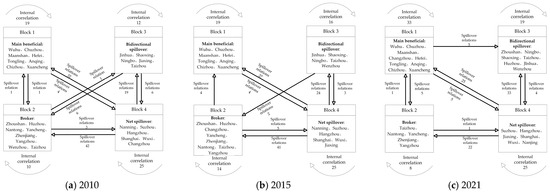
Figure 7.
Interaction diagram of four blocks.
4. Discussion
4.1. The Network Development Model Has Become a New Paradigm for the Innovative Development of the Yangtze River Delta Urban Agglomeration
With the in-depth development of urban innovation and correlation, the traditional monocentric or bicentric development model has been unable to cater to the trend of regional economic integration development, and the polycentric network spatial development model has been the optimal choice for urban development. In the process of directing the spatial arrangement of innovative activities, it is necessary to combine the reality of the balanced development of each city, make full use of the developed transportation and communication network and open factor exchange market, guide the flow of production factors, optimize the functional division of the cities, reduce the opportunity cost of innovative growth, and improve the polycentric innovation network development mode where the cities are in independent development and coordinated complementarity. Specifically, Shanghai, Nanjing, and Hangzhou should maintain and optimize the network pattern of local and cross-border innovation cooperation and play the intermediary role of key nodes in the innovation network. Subcore cities, such as Suzhou, Wuxi, Ningbo, and Hefei, should not only maintain innovation relations with nonlocal regions but also strengthen interaction and cooperation among local entities to accelerate the absorption and transformation of external knowledge. The innovation network’s perimeter area should foster the interaction between the cross-border network and the local network, properly appreciate the network’s essential role in information transfer and innovation, attach importance to the construction of the innovation network, and gradually establish the innovation network of local and cross-border interactions.
4.2. Influence Mechanism of Innovation Network Structure in Yangtze River Delta Urban Agglomeration
The establishment of the innovation network in the Yangtze River Delta is significantly influenced by factors such as administrative rank, geographic proximity, technical proximity, and institutional proximity. Higher administrative levels are associated with more abundant innovation resources, unique institutional advantages, and preferred innovation policies and thus can be instrumental in reducing the uncertainty of innovation cooperation and promoting innovation technology cooperation [57]. Geographical proximity promotes the formation of the core–periphery network structure. The closer the spatial distance is, the easier it is for innovative cooperation to take place between cities. This is mainly attributed to the fact that two geographically adjacent cities have the spatial advantage of proximity, hence facilitating the dissemination, sharing, and allocation of production capital, technological factors, and knowledge between cities, promoting communication and cooperation between cities and the spatial agglomeration of innovation elements, and improving the intensity of collaborative innovation [58]. In addition, the four innovation blocks reflect the characteristics of preferential cooperation and local neighboring cooperation. Technological proximity means that cities with higher levels of innovation preferentially choose cities that are closer to their level. Too close of a technological distance easily forms knowledge and technology locking, and excessive technological distance leads to a weak common knowledge base and hence is not favorable to intercity collaboration on innovation. Therefore, the spatial correlation network of innovation of the Yangtze River Delta urban agglomeration displayed characteristics of “strong–strong correlation” and “weak–weak correlation”. In terms of institutional proximity, Anhui, northern Jiangsu, and western Zhejiang are located at the periphery of the spatial correlation network of the Yangtze River Delta urban agglomeration. In addition to being affected by geographical distance and innovation scale, there is a deep gap between the periphery area and the core area in the innovation system and method, thus further affecting the occurrence of innovation correlation.
4.3. Weakness and Future Work
As an abstract relation, innovation correlation is difficult to calculate accurately and concretely. The intensity of innovation correlation calculated by the modified gravity model in this study can only reflect the innovation correlation between cities to a certain extent, while realistically, it is hard to collect and obtain some data directly reflecting the innovation correlation, such as the number of joint publications and joint patents. The way to obtain such data through data mining technology or cooperation with relevant data statistics departments will be a difficult issue worthy of further discussion. Moreover, the distance in the gravity model used in this study is geographical distance. In future studies, geographical distance, time distance, social distance, cultural distance, transportation mode, and spatial factors can be comprehensively considered, and a multi-index system evaluating functional distance can be constructed to more accurately reflect intercity distance.
It should be pointed out that the spatial pattern and evolution trend of the innovation network of urban agglomerations are obtained by visualizing the network using GIS. Strictly speaking, one might define GIS as a set of tools and technologies through which spatial data are encoded, analyzed, and communicated. More importantly, we need to analyze the power, systems, advantages, etc., of different network nodes (cities) and reveal power differentials and environmental injustice in network structure, namely revealing spatial configurations of power [59] and emphasizing participation (especially under China’s current administrative system). In the contemporary geoweb era, Critical GIS plays an important role in explaining human and social phenomena which expands the knowledge domains of GIS and the ways we can represent people and places, as well as embracing processes, phenomena, experiences, events, and ideas that absolute space fails to account for [60,61]. Critical GIS is forward-looking, examining not only the historical paths that led to the present innovation network but also those paths opened and foreclosed toward possible futures. Critical GIS also pays attention to the specific functions of traditional GIS in society, including the economic growth of private enterprises, path dependence, and behavioral entities. So, Critical GIS can help us constructively engage not only mainstream GIS science and the ever-proliferating intersections of computation with space and place but also critical human geography. Bridging the gap between technology-oriented map design and social power analysis is the focus of future research [62].
5. Conclusions and Suggestions
This study measured and explained the innovative development level, features of the spatial correlation network, and spatiotemporal evolution of the Yangtze River Delta urban agglomeration from 2010 to 2021 using a comprehensive assessment approach, modified gravity model, and social network analysis. The main conclusions were as follows:
- (1)
- The innovation development level in the Yangtze River Delta urban agglomeration varied significantly, demonstrating a spatial pattern of high in the southeast and low in the northwest. From the perspective of spatial structure, the innovation correlation axis presented a multi-hierarchical structure, forming a Z-shaped axis in the Yangtze River Delta urban agglomeration, where Shanghai is the radiating central city with the highest innovation development level and Nanjing, Hangzhou, Suzhou, and Ningbo serve as the secondary city nodes.
- (2)
- The innovation network of the Yangtze River Delta urban agglomeration had significant spatial correlation and spillover effects. The intensity and density of the network correlation were continually growing, and the centrality of the network nodes had obvious hierarchical characteristics, forming a core–periphery structure with Shanghai, Hangzhou, Nanjing, and Suzhou as the core and radiating to the surrounding cities. In addition, Hefei’s degree of integration into the innovation network was still not high due to the impact of spatial distance and geographical proximity. Therefore, efforts should be made to enhance Hefei’s innovative service and ability to radiate to neighboring cities and solve the problem of the low collaborative innovation ability of cities in Anhui.
- (3)
- There was a significant relationship between the blocks in the innovation network. The members of block 1 were basically at the periphery of the western network, changing from a “main benefit” block to a “two-way spillover” block. Block 2 played an intermediary role in the innovation network and belonged to the “broker” block. Block 3 was largely concentrated in the southern half of the Yangtze River Delta urban agglomeration, and through the broker function of block 2, it exerted an indirect spillover relationship on block 1 and block 4 and changed from a “two-way spillover” block to a “main benefit” block. Block 4 had strong innovation spillover ability, and hence, it was the engine of the innovation network of the Yangtze River Delta urban agglomeration and belonged to the “net spillover” block. In addition, the spillover effect of the innovation network in urban agglomeration had obvious gradient transmission characteristics, where block 4 was the main body of innovation spillover, the mediating role of block 2 transferred the innovation momentum from block 4 to block 1 and block 3, and block 1 was the end point of the transmission of innovation correlation.
Based on the empirical analysis and considering the actual development of the urban agglomeration of Yangtze River Delta, this research proposed the following suggestions: (1) Narrow the gap in the innovation level and improve the balance of innovation capacity among cities in the Yangtze River Delta urban agglomeration. While improving the innovation capacity of an individual city, it is essential to pay attention to the collaborative innovation relationship among cities, utilize the radiation-driven impact of core cities to the fullest, improve the undertaking and transfer ability of periphery cities, enhance the synergy of innovation and development of urban agglomeration, and narrow the spatial difference of urban innovation correlations. (2) Give core cities’ advantages in competition their due and enhance their radiation-driven ability. Depending on each city’s unique status and function within the innovation network, and combined with the location advantage and resource endowment, it is important to build a good innovation environment to promote the unrestricted exchange of high-quality factors such as technology, talent, and capital within urban agglomerations, strengthen innovation relations between core cities and periphery cities, and form a closer spatial network of regional innovation correlations. (3) Follow the regional differentiation policy and implement accurate policies according to local conditions. Give great consideration to the “net spillover” block’s motivating impact based on the peculiarities of the spatial correlation of each block, continuously strengthen the “two-way spillover” effect and the cooperation relation within and between blocks, and constantly increase the density of the innovation network to achieve the overall development of collaborative innovation in urban agglomeration through the strengthening of “local buzz”.
Author Contributions
This paper was written with the contribution of all authors as follows: conceptualization, Jie Chen; data curation, Ye Tian; funding acquisition, Jie Chen, Ye Tian, and Jing Luo; investigation, Jie Chen and Jing Luo; methodology, Jie Chen; project administration, Liang Jiang; supervision, Liang Jiang; visualization, Ye Tian; writing—original draft, Jie Chen; writing—review and editing, Liang Jiang. All authors have read and agreed to the published version of the manuscript.
Funding
This research was supported by the National Natural Science Foundation of China (No. 41871176, No. 42001185, No. 42271228), the Humanities and Social Science Foundation of the Ministry of Education of China (No. 20YJCZH147), and the Doctoral Research Foundation of Huizhou University (No. 2022JB050).
Data Availability Statement
Not applicable.
Conflicts of Interest
The authors declare no conflict of interest.
References
- Li, Y.; Du, R. Polycentric Urban Structure and Innovation: Evidence from a Panel of Chinese Cities. Reg. Stud. 2022, 56, 113–127. [Google Scholar] [CrossRef]
- Gong, Q.; Song, M.; Han, T. Research on the Measurement of Collaborative Innovation Level and Evolution of Spatial Connection Network in Chengdu-Chongqing Economic Circle. Soft Sci. 2022, 36, 28–37. [Google Scholar] [CrossRef]
- Lv, L.; Xin, X.; Chen, D. Urban Innovation Infrastructure and Innovation Output: An Empirical Analysis Based on 290 Cities at the Prefecture Level or above in China. Hum. Geogr. 2021, 36, 104–113+125. [Google Scholar] [CrossRef]
- Castells, M. The Rise of the Network Society; Blackwell Publishing: Oxford, UK, 2009. [Google Scholar]
- Wu, L.; Wang, D.; Evans, J. Large Teams Develop and Small Teams Disrupt Science and Technology. Nature 2019, 566, 378–382. [Google Scholar] [CrossRef] [PubMed]
- Li, Y.; Phelps, N. Megalopolis Unbound: Knowledge Collaboration and Functional Polycentricity within and beyond the Yangtze River Delta Region in China, 2014. Urban Stud. 2014, 55, 443–460. [Google Scholar] [CrossRef]
- Marshall, A. Principles of Economics; Macmillan: London, UK, 1890. [Google Scholar]
- Cooke, P. Regional Innovation Systems: Competitive Regulation in the New Europe. Geoforum 1992, 23, 365–382. [Google Scholar] [CrossRef]
- Porter, M. The Competitive Advantage of Nations; Palgrave Macmillan: New York, NY, USA, 1990. [Google Scholar]
- Cooke, P.; Asheim, B.; Boschma, R.; Martin, R.; Schwartz, D.; Todtling, F. Handbook of Regional Innovation and Growth; Edward Elgar Publishing: Cheltenham, UK, 2011. [Google Scholar]
- Malmberg, A.; Maskell, P. The Elusive Concept of Localization Economies: Towards a Knowledge-Based Theory of Spatial Clustering. Environ. Plan. A 2002, 34, 429–449. [Google Scholar] [CrossRef]
- Castells, M. The Informational City: Information Technology, Economic Restructuring and the Urban-Regional Progress; Blackwell: Oxford, UK; Cambridge, MA, USA, 1992. [Google Scholar]
- Zhou, C.; Zeng, G.; Cao, X. Chinese Inter-City Innovation Networks Structure and City Innovation Capability. Geogr. Res. 2017, 36, 1297–1308. [Google Scholar]
- Taylor, P.; Csomós, G. Cities as Control and Command Centres: Analysis and Interpretation. Cities 2012, 29, 408–411. [Google Scholar] [CrossRef]
- Neal, Z. Refining the Air Traffic Approach to City Networks. Urban Stud. 2010, 47, 2195–2215. [Google Scholar] [CrossRef]
- Townsend, A. Network Cities and the Global Structure of the Internet. Am. Behav. Sci. 2001, 44, 1697–1716. [Google Scholar] [CrossRef]
- Derudder, B. Mapping Global Urban Networks: A Decade of Empirical World Cities Research. Geogr. Compass 2010, 2, 559–574. [Google Scholar] [CrossRef]
- Bathelt, H.; Malmberg, A.; Maskell, P. Clusters and Knowledge: Local Buzz, Global Pipelines and the Process of Knowledge Creation. Prog. Hum. Geogr. 2004, 28, 31–56. [Google Scholar] [CrossRef]
- Tang, F.; Tang, H.; Sun, Q.; Tang, D. Analysis of the Economic Network Structure of Urban Agglomerations in the Middle Yangtze River. Acta Geogr. Sin. 2013, 68, 1357–1366. [Google Scholar] [CrossRef]
- Taylor, P.; Derudder, B.; Faulconbridge, J.; Hoyler, M.; Ni, P. Advanced Producer Service Firms as Strategic Networks, Global Cities as Strategic Places. Econ. Geogr. 2013, 90, 267–291. [Google Scholar] [CrossRef]
- Choi, J.; Barnett, G.; Chon, B. Comparing World City Networks: A Network Analysis of Internet Backbone and Air Transport Intercity Linkages. Glob. Netw. 2006, 90, 267–291. [Google Scholar] [CrossRef]
- Lee, D.-S. The Changing Structures of Co-Invention Networks in American Urban Areas. Procedia Comput. Sci. 2016, 96, 1075–1085. [Google Scholar] [CrossRef]
- Huggins, R.; Prokop, D. Network Structure and Regional Innovation: A Study of University-Industry Ties. Urban Stud. 2017, 54, 931–952. [Google Scholar] [CrossRef]
- Nomaler, Ö.; Verspagen, B. River Deep, Mountain High: Of Long Run Knowledge Trajectories within and between Innovation Clusters. J. Econ. Geogr. 2016, 16, 1259–1278. [Google Scholar] [CrossRef][Green Version]
- Zhang, K.; Qian, Q.; Zhao, Y. Evolution of Guangzhou Biomedical Industry Innovation Network Structure and Its Proximity Mechanism. Sustainability 2020, 12, 2456. [Google Scholar] [CrossRef]
- Broekel, T.; Boschma, R. Knowledge Networks in the Dutch Aviation Industry: The Proximity Paradox. J. Econ. Geogr. 2012, 12, 409–433. [Google Scholar] [CrossRef]
- Miiller, M. Urban Assemblages: How Actor-Network Theory Changes Urban Studies. Urban Studies 2011, 48, 222–224. [Google Scholar] [CrossRef]
- Jonas, E.A.; Moisio, S. City Regionalism as Geopolitical Processes: A New Framework for Analysis. Prog. Hum. Geogr. 2018, 42, 350–370. [Google Scholar] [CrossRef]
- Farías, I. The politics of urban assemblages. City 2011, 15, 365–374. [Google Scholar] [CrossRef]
- Simandan, D. Competition, Contingency, and Destabilization in Urban Assemblages and Actor-Networks. Urban Geogr. 2018, 39, 655–666. [Google Scholar] [CrossRef]
- Wang, X.; Feng, M.; Gu, H. A Study of Discriminative Characteristics of Intercity Innovation Linkage at Different Scales: A Case Study of Yangtze River Delta. J. Southeast Univ. 2015, 17, 108–116. [Google Scholar] [CrossRef]
- Gao, L.; Jiang, F. Economic Growth Effect Analysis on Concentration and Diffusion of Innovation Elements: Area of Nanjing, Zhenjiang and Yangzhou as an Example. Nanjing J. Soc. Sci. 2011, 2011, 30–36. [Google Scholar] [CrossRef]
- Ma, S.; Zeng, G. Analysis of China’s Urban Innovation Network Pattern and Its Proximity Mechanism from a Multi-Scale Perspective. Hum. Geogr. 2020, 35, 95–103. [Google Scholar] [CrossRef]
- Xie, Q.; Song, W. Research on the Mechanism of Geographical Proximity Affecting Inter-Regional Collaboration Networks and Regional Innovation Performance. Chin. J. Manag. 2020, 17, 1016–1023. [Google Scholar] [CrossRef]
- Xian, G.; Zeng, G.; Cao, X. Structural Feature and Proximity Mechanism of Chinese Intercity Innovation Network. World Reg. Stud. 2018, 27, 136–146. [Google Scholar] [CrossRef]
- Dai, L.; Ji, Y.; Wang, S.; Zhu, Q.; Ding, Z. Evolutionary Characteristics and Proximity Mechanism of Intercity Knowledge Innovation Networks in China. Resour. Sci. 2022, 44, 1494–1505. [Google Scholar] [CrossRef]
- Ma, H.; Huang, X.; Li, Y. The Evolution and Mechanisms of Megalopolitan Knowledge Polycentricityof Guangdong-Hong Kong-Macao Greater Bay Area. Acta Geogr. Sin. 2018, 73, 2297–2314. [Google Scholar] [CrossRef]
- Ma, S.; Zeng, G. Regional Innovation Models of China’s Ten Major Urban Agglomerations from the Perspective of Network. Sci. Geogr. Sin. 2019, 39, 905–911. [Google Scholar] [CrossRef]
- Wu, K.; Fang, C.; Zhao, M. The Spatial Organization and Structure Complexity of Chinese Intercity Networks. Geogr. Res. 2015, 34, 711–728. [Google Scholar]
- Zhang, Y.; Li, D. Evolution of Innovation Network of Local Enterprises in China from the Perspective of Globalization-A Case Study of Huawei. World Reg. Stud. 2017, 26, 92–100. [Google Scholar] [CrossRef]
- Zhang, K.; Qian, Q.; Chen, Q. Multilevel Spatial Patterns and Network Characteristics of China’s New Energy Vehicle Industrial Technological Innovation. Prog. Geogr. 2021, 40, 1824–1838. [Google Scholar] [CrossRef]
- Zhou, R.; Qiu, Y.; Hu, Y. Characteristics, Evolution and Mechanism of Inter-City Innovation Network in China: From a Perspective of Multi-Dimensional Proximity. Econ. Geogr. 2021, 41, 1–10. [Google Scholar] [CrossRef]
- Duan, D.; Du, D.; Chen, Y.; Zhai, Q. Spatial-Temporal Complexity and Growth Mechanism of City Innovation Network in China. Sci. Geogr. Sin. 2018, 38, 1759–1768. [Google Scholar] [CrossRef]
- Chen, Q.; Qian, Q.; Yao, Z. Urban Innovation Development Level and Network Structure Evolution in Guangdong Province. Econ. Geogr. 2021, 41, 38–47. [Google Scholar] [CrossRef]
- Ma, H.; Cao, X.; Li, X. Synergy Degree of Innovation Network of Emerging Technology Industry in Central China. Econ. Geogr. 2019, 39, 164–173. [Google Scholar] [CrossRef]
- Huang, D.; Wang, F.; Zhu, X.; Wang, H. Two-Mode Network Autoregressive Model for Large-Scale Networks. J. Econom. 2020, 216, 203–219. [Google Scholar] [CrossRef]
- Chong, Z.; Pan, S. Understanding the Structure and Determinants of City Network through Intra-Firm Service Relationships: The Case of Guangdong-Hong Kong-Macao Greater Bay Area. Cities 2020, 103, 102738. [Google Scholar] [CrossRef]
- Xin, N.; Xiangdong, C. Innovation Connection between Cities and Spatial Structure of Innovation Network. Chin. J. Manag. 2013, 10, 575–582. [Google Scholar] [CrossRef]
- Bode, E. The Spatial Pattern of Localized R&D Spillovers: An Empirical Investigation for Germany. J. Econ. Geogr. 2004, 4, 43–64. [Google Scholar] [CrossRef]
- Maggioni, M.; Uberti, T. Inter-Regional Knowledge Flows in Europe: An Econometric Analysis; Edward Elgar Publishing: Camberley, UK, 2007. [Google Scholar]
- China Science and Technology Development Strategy Research Group; China Innovation and Entrepreneurship Management Research Center, University of Chinese Academy of Sciences. China’s Regional Innovation Capability Evaluation Report; Scientific and Technical Literature Press: Beijing, China, 2016. [Google Scholar]
- Lv, L.; Li, Y. Research on Chinese Renovation Urban System Based on Urban Renovation Function. Acta Geogr. Sin. 2010, 65, 177–190. [Google Scholar]
- Fang, C.; Ma, H.; Wang, Z. Comprehensive Assessment and Spatial Heterogeneity of the Construction of Innovative Cities in China. Acta Geogr. Sin. 2014, 69, 459–473. [Google Scholar] [CrossRef]
- Ji, Y.; Huang, G.H.; Sun, W. Risk Assessment of Hydropower Stations Through an Integrated Fuzzy Entropy-Weight Multiple Criteria Decision Making Method: A Case Study of The Xiangxi River. Expert Syst. Appl. 2015, 42, 5380–5389. [Google Scholar] [CrossRef]
- Lv, L.C.; Liang, Z.J.; Huang, R. The Innovation Linkage Among Chinese Major Cities. Sci. Geogr. Sin. 2015, 35, 30–37. [Google Scholar] [CrossRef]
- Liu, X. Structure and Division of Urban Innovation Network in the Guangdong-Hong Kong-Macao Greater Bay Area. Sci. Geogr. Sin. 2020, 40, 874–881. [Google Scholar] [CrossRef]
- Cao, Z.; Derudder, B.; Peng, Z. Comparing the Physical, Functional and Knowledge Integration of the Yangtze River Delta City-Region through the Lens of Inter-City Networks. Cities 2018, 82, 119–126. [Google Scholar] [CrossRef]
- Du, Y.; Wang, Q.; Wang, Z. Characteristics and Mechanism of Innovation Networks in Three Major Urban Agglomerations of China from the Perspective of Multidimensional Proximities. Sci. Geogr. Sin. 2023, 43, 197–207. [Google Scholar] [CrossRef]
- Pavlovskaya, M. Critical GIS as a Tool for Social Transformation. Can. Geogr. 2018, 62, 40–54. [Google Scholar] [CrossRef]
- Thatcher, J.; Bergmann, L.; Ricker, B.; Rose-Redwood, R.; O’Sullivan, D.; Barnes, T.J.; Barnesmoore, L.R.; Imaoka, L.B.; Burns, R.; Cinnamo, J.; et al. Revisiting Critical GIS. Environ. Plan. A 2016, 48, 815–824. [Google Scholar] [CrossRef]
- Schuurman, N. Critical GIS. Int. Encycl. Hum. Geogr. 2009, 363–368. [Google Scholar] [CrossRef]
- Wang, T.; Liu, Y.G. Mapping and “Cartographicality”: Progress Review of Critical Cartography and Critical GIS. Prog. Geogr. 2022, 41, 1097–1108. [Google Scholar] [CrossRef]


Disclaimer/Publisher’s Note: The statements, opinions and data contained in all publications are solely those of the individual author(s) and contributor(s) and not of MDPI and/or the editor(s). MDPI and/or the editor(s) disclaim responsibility for any injury to people or property resulting from any ideas, methods, instructions or products referred to in the content. |
© 2023 by the authors. Licensee MDPI, Basel, Switzerland. This article is an open access article distributed under the terms and conditions of the Creative Commons Attribution (CC BY) license (https://creativecommons.org/licenses/by/4.0/).