Abstract
The outbreak of COVID-19 in Beijing has been sporadic since the beginning of 2022 and has become increasingly severe since October. In China’s policy of insisting on dynamic clearance, fine-grained management has become the focus of current epidemic prevention and control. In this paper, we conduct a refined COVID-19 risk prediction and identification of its influencing factors in Beijing based on neighborhood-scale spatial statistical units. We obtained geographic coordinate data of COVID-19 cases in Beijing and quantified them into risk indices of each statistical unit. Additionally, spatial autocorrelation was used to analyze the epidemic risk clustering characteristics. With the multi-source data, 20 influencing elements were constructed, and their spatial heterogeneity was explored by screening 8 for Multiscale Geographically weighted regression (MGWR) model analysis. Finally, a neural network classification model was used to predict the risk of COVID-19 within the sixth ring of Beijing. The MGWR model and the neural network classification model showed good performance: the R2 of the MGWR model was 0.770, and the accuracy of the neural network classification model was 0.852. The results of this study show that: (1) COVID-19 risk is uneven, with the highest clustering within the Fifth Ring Road of Beijing; (2) The results of the MGWR model show that population structure, population density, road density, residential area density, and living service facility density have significant spatial heterogeneity on COVID-19 risk; and (3) The prediction results show a high COVID-19 risk, with the most severe risk being in the eastern, southeastern and southern regions. It should be noted that the prediction results are highly consistent with the current epidemic situation in Shijingshan District, Beijing, and can provide a strong reference for fine-grained epidemic prevention and control in Beijing.
1. Introduction
1.1. Background
According to the WHO, as of November 2022, more than 616 million cumulative confirmed infections with COVID-19 disease and more than 6.52 million deaths due to COVID-19 have been recorded [1]. COVID-19 has become the most severe epidemic in the world [2]. At the beginning of the outbreak, there were no vaccines or other targeted medical interventions, so non-pharmacological interventions (NPI) [3], such as city closures, travel restrictions, and self-isolation, were the most critical prevention and control measures for the epidemic. As research on COVID-19 intensified and COVID-19 vaccines were developed, many regions gradually relaxed their efforts to prevent and control the spread of COVID-19. However, it was soon discovered that although the COVID-19 vaccine effectively reduced the disease in infected individuals and mitigated its spread, it did not seem to be able to eliminate the spread of the virus in the population [4]. The highly mutable nature of the COVID-19 virus has led to a wave of infections worldwide with variants of the Delta and Omicron viruses [5]. As such, NPI still plays a vital role in epidemic prevention.
However, it is worth noting that although long-term, complete NPI can have a significant effect on epidemic prevention and control, it also dramatically inhibits economic development, affects the everyday life of the population, and brings about many social problems [6]. Complete NPI is no longer suitable for current epidemic control. In cosmopolitan cities such as Beijing, Shanghai, and New York, it is important not to affect the city’s functioning while keeping the epidemic under control. Targeted NPI has become the first choice. Therefore, the identification of risk levels and risk elements in different areas of the city has become a top priority for current epidemic prevention efforts.
Beijing, the capital of China, is a typical international metropolis. Its high-density built environment and high-intensity population [7] movement expose it to the constant risk of various public health emergencies, e.g., the SARS outbreak in 2003 [8] and COVID-19 in 2020 (Xinfadi Market) [9]. This paper takes Beijing as an example. It explores the risk of COVID-19 infection in areas where Beijing has had outbreaks from a perspective of geographic and influencing factors. We also use machine learning techniques to measure the risk of outbreaks and identify vulnerable areas at the neighbourhood scale for each region in Beijing. It was our goal to comprehensively analyze the risk of COVID-19 outbreaks and the causes of such outbreaks in different areas of Beijing. It is expected that this study will provide technical support for future normalized epidemic prevention work in Beijing, as well as research paradigms for refined risk diagnosis in other regions.
1.2. Literature Review
In our attempt to achieve the goals described above, the most important thing was to identify the risk elements in urban spaces and to judge and predict the risk level in order to implement localized prevention and control the city’s vulnerable areas. A review of previous studies since the outbreak of COVID-19 revealed that research on the risk of spreading COVID-19 in urban spaces is divided into two categories: the identification of risk elements in cities using geography [10] and statistics [11,12], and the prediction of regional risk through the establishment of risk indicators and machine learning.
Since the COVID-19 outbreak, scholars have been actively studying the elements that influence the spread of COVID-19 in cities; various statistical models have been used in such studies. For example, one study used hierarchical linear regression models and ridge regression models to explore the factors influencing the built environment of the outbreak in 150 communities in Wuhan [13]; another used stepwise regression models to explore the influence of urban geometry and sociodemographic factors on the spread of the outbreak in Hong Kong [14]; in addition to the use of regression models, structural equation models have also been widely used in the study of the outbreak, from the macro level in the United States [15] to the city level in Huangzhou [16], and some environmental-level influences have been confirmed. Geographically weighted regression GWR and mixed geographically weighted regression MGWR were used as practical tools to explore the spatial heterogeneity of each influencing factor in geographic level studies and to explore the spatial heterogeneity of urban influencing factors in China [17] and the United States [18].
At the same time, research targeting urban spatial risk prediction using risk elements in cities has been increasing. The establishment of risk indicators has been widely used in traditional risk measurement. Some scholars have established a risk evaluation system based on various urban elements to quantify the environmental risk of each region and city [19], while others have used the resilience of communities to cope with the COVID-19 as a risk evaluation indicator, as judged based on multiple dimensions such as the infrastructure, socioeconomic, and environmental conditions of the community [20]. Other studies have used the identified potential COVID-19 risk table to make a preliminary determination of urban classes and then analyzed the spatial relationship between urban form and population density to obtain the risk factors that most influence the spread of the disease [21]. In addition to the more traditional research methods, machine learning methods have also been widely used in risk prediction. Some scholars took Wuhan and Guangzhou as examples and used urban population data and various environmental factors of these cities as a basis for logit regression [22,23]. In addition, several studies have used structured Gaussian models with demographic, socioeconomic, and political data and demographic information as the computational framework to predict regional risk for U.S. counties [24] or the Cantabria region of Spain at the community level [25]. Maxent machine learning models have also been widely used for the evaluation of regional epidemic risk levels [26,27]. In addition, a portion of research has also focused on a specific element for risk prediction, with building density [28] and human activity patterns [29] being used to determine and identify potential site transmission risk in cities.
Among the research on COVID-19, there is no shortage of studies specific to Beijing. For example, one study conducted a sociological analysis of the behavioral patterns of different Beijing populations during the COVID-19 epidemic and identified the entire population as being at risk [30]. Factors influencing the differences in COVID-19 epidemic prevention behaviors among the college student population in Beijing have also been studied [31]. Additionally, environmental factors have been used as a focus of research. Micro aspects, such as the effect of indoor air quality [32] and indoor ventilation [33], as well as macro aspects, such as the spatial heterogeneity of COVID-19 cases and their environmental influences, have been studied in various districts of Beijing [9]. Different environments have been shown to have different effects on people’s psychology during the COVID-19 epidemic [34,35]. Simulation studies of COVID-19 risk [36] are also increasing, e.g., of the impact of the Beijing rail network on the spread of COVID-19 [37], and of COVID-19 risk in the “Xinfadi market,” an area with a high prevalence of COVID-19 [38].
A review of previous studies showed that current research on the risk of transmission in urban spaces is very in-depth. However, there are still some research gaps. (1) Research on the influencing factors of COVID-19 risk in cities is mainly based on administrative divisions such as cities, counties, and streets. There is a lack of neighborhood-level research, and the scale is too large to allow for the fine-tuning of prevention and control in cities. (2) Research on influencing factors and prediction of epidemic risk is chiefly conducted independently. In devising prevention and control measures for cities, each region’s impact factors and risk levels are combined. (3) Few studies are exploring the relationship between the urban environment and COVID-19 risk in Beijing, and there needs to be more research on accurately identifying risk elements in cities in advanced epidemic prevention and control. (4) Although some studies predicted the outbreak in Beijing, they were all in the early stages of the outbreak. As the COVID-19 virus continues to evolve and epidemic prevention policies continue to change, the risk of an outbreak has likely changed significantly.
1.3. Framework
We established a grid network with a cell of size 500 m × 500 m in the ArcGIS software as the statistical unit for our experiments. We obtained the geographic coordinate data of COVID-19 cases in Beijing (from June 2020 to October 2022) from the official website of the Beijing Health and Health Commission. We quantified the COVID-19 risk into the aforementioned statistical unit. Spatial autocorrelation was then used to explore the clustering characteristics of the epidemic risk in Beijing. Based on a previous study, 20 COVID-19 risk evaluation features were established. After statistical tests, eight features were identified as the most significant influences on the epidemic: elderly population, shopping and service facilities, companies, residential areas, living service facilities, roads, total population, and scientific, educational, and cultural facilities. After identifying these features, a multiple geographically weighted regression (MGWR) analysis was performed on the statistical units according to epidemic risk in order to determine the differences in the strength of influence of different features in each statistical unit. Next, we trained a neural network classification model to classify and predict the risk of locations within the Sixth Ring Road in Beijing that have not yet been significantly affected by the epidemic (Figure 1).
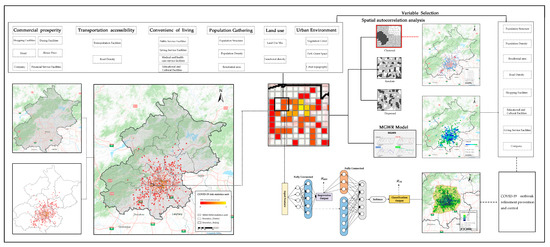
Figure 1.
Project framework and workflow.
In summary, this article’s research objectives and contributions are as follows.
- (1)
- To explore the risk clustering characteristics of COVID-19 in Beijing.
- (2)
- To identify and analyze the influencing factors affecting the risk of COVID-19.
- (3)
- To classify and predict the COVID-19 risk in the Sixth Ring Road area of Beijing.
2. Materials and Methods
2.1. Study Area
Beijing is located at longitude 115°25′–117°30′ East and latitude 39°28′–41°05′ North. There are 16 districts in the city, with a total land area of 16,411 square kilometers, of which 3670 square km are construction areas. The scale of urban and rural construction land is kept at 2790 square km. At the end of 2020, the population of Beijing was 2,189,095 people. In other words, the population density of Beijing is 1334 people per square km, while that of built-up areas in the city is as high as 7847 people per square km. Beijing has two international airports and 11 railway stations, making it an important transportation hub in China and East Asia. Beijing’s high population density and its high-frequency of people movement inevitably exposes it to the risk of a COVID-19 outbreak. The high frequency of human movement in the city will result in a constant importation of cases into the inner districts. Its high-density residential environment will also increase the likelihood and extent of transmission of COVID-19.
Several epidemics of COVID-19 have occurred in Beijing since January 2020. In early 2022, the insidious and more infectious nature of the imported Omicron strain made detection extremely difficult and led to multiple epidemics in Beijing. In this paper, the MGWR model was applied using Beijing as the study area. The area within the sixth ring road was used as the scope of the neural network classification model prediction for urban space COVID-19 risk identification and to explore influencing factors (Figure 2).
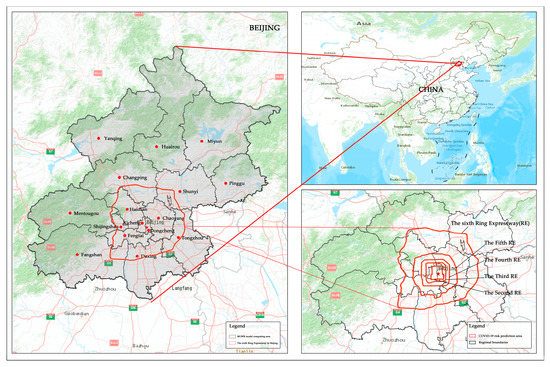
Figure 2.
Study area of this paper.
2.2. Research Materials
2.2.1. COVID-19 Risk Data Acquisition and Processing
After combining different studies [22,23,26,27], we decided to quantify the risk of the epidemic by the number of COVID-19 cases present in each statistical unit. This study collected the geographic location of COVID-19 cases from January 2022 (Omicron variant introduced to Beijing [39]) until 15 October 2022, taken from the Beijing Municipal Health and Wellness Commission (http://wjw.Beijing.gov.cn/ (accessed on 15 October 2022)). After the geographic locations of the cases had been statistically organized, their latitude and longitude coordinates were determined using Baidu Maps and converted into point data.
Meanwhile, this study used ArcGIS software to establish a 500 m × 500 m neighborhood-scale statistical fishing network for Beijing (according to the 15-min living circle proposed by the Shanghai Municipal Government in 2016 to delineate the scale [40]). This indicated the number of new virus cases within each table with a 500 m search radius to determine the existing epidemic risk index within each statistical unit. In this way, 2497 risk units were identified. We applied these data to our MGWR model and to train the neural network prediction model (Figure 3).
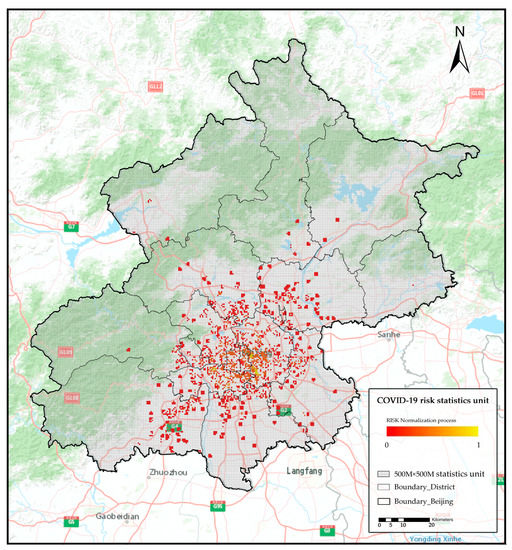
Figure 3.
Graphical representation of COVID-19 risk statistics.
2.2.2. Space Autocorrelation
However, it is essential to note that some environmental factors, despite their influence on the incidence of epidemics, are spatially heterogeneous and uncertain in their degree of influence [41]. Therefore, in identifying area-specific vulnerable spaces, detailed site-specific analyses and judgments are required to determine the elements influencing the risk of epidemic transmission.
In summary, we selected six dimensions and 20 variables, including Commercial prosperity [16], Transportation accessibility [17], Convenience of living [16], Population Gathering [13], Land use [42], and Urban environment [43], for our analysis of influencing factors and prediction of the degree of risk (Table 1).

Table 1.
This is a table. Tables should be placed in the main text near to the first time they are cited.
2.3. Methods
2.3.1. Space Autocorrelation
Spatial autocorrelation analyses may be divided into global correlation and local correlation, where global correlation, i.e., Moran’s l, is used to analyze the correlation characteristics exhibited by the study object at the global scale and to determine whether there is spatial autocorrelation between the whole study object and the samples in the whole domain. Local spatial correlation (LISA) [45] is used to analyze the correlation between the study object and its neighboring regions at various scales; as such, it can better reflect the local characteristics of the study object in space than global correlation. This paper aims to explore whether there was spatial clustering of all outbreak locations in Beijing to provide a specific analysis of the causes of the distribution of the outbreak. Therefore, Moran’s l was used to explore the spatial autocorrelation of COVID-19 outbreak locations.
The Global Moran’s I method of global spatial autocorrelation is given as
where and are the attribute values of features and , is the spatial weight between features and , and is the number of features in the dataset.
The global autocorrelation statistic indicates the existence of clusters, while local autocorrelation indicates the location and spatial association type of the clusters. To further study the distribution pattern of COVID-19 epidemic infection risk in Beijing, spatial autocorrelation was used to identify locally accessible clusters. Due to the characteristics of spatial heterogeneity, the distribution of COVID-19 risk appeared to be clustered in different geographical locations. LISA was applied to study the heterogeneity characteristics of the clustering of COVID-19 epidemic risk distribution, calculated as follows:
where and are the attribute values of features and , is the spatial weight between features and , and is the number of features in the dataset.
2.3.2. Feature Screening
Due to the large set of candidate variables, the selected variables had to be filtered according to the 20 applied urban features that affect the risk of COVID-19 transmission. The specific feature selection steps were as follows.
Step 1: First, we performed t-testing of each indicator by Ordinary Least Squares (OLS) with the following formula:
In the statistical cell, is the risk coefficient of the epidemic within the statistical cell, is the intercept, is the vector of selected explanatory variables, is the vector of regression coefficients, and is the random error term.
Step 2: After selecting indicators, the inflated variance factor (VIF) was used to detect the covariance between indicators with the following equation:
where is the negative correlation coefficient of the independent variable on the remaining independent variables for regression analysis; the larger the VIF, the greater the possibility of covariance between the independent variables.
2.3.3. Multiscale Geographically Weighted Regression (MGWR)
Global regression models, such as OLS, and the Spatial Error Model (SEM) implicitly assume that the relationship between the explanatory and dependent variables is spatially smooth, meaning that they assume that the relationship between them is spatially unvarying [46]. However, if this assumption is relaxed, the extent to which the explanatory variables explain the dependent variable is inconsistent across locations, i.e., the “parameters vary spatially”. Brunsdon et al. [47] proposed a geographically weighted regression GWR as an extension of the general regression model. It allows these parameters to be derived separately for each location [48].
Although traditional GWR has been dramatically improved relative to global regression, it still assumes that the scale of all correlations is spatially constant [49]. However, in many cases, including the propagation of COVID-19, this assumption is invalid, because different propagation processes involve different spatial scales. MGWR was inspired by GWR; it can be used to study relationships at different spatial scales and through different bandwidths [49]. It can be expressed as [50]:
where is the th predictor variable, is the center-of-mass coordinate of statistical unit , and represents the bandwidth of the regression coefficient of the th variable. In practice, MGWR is usually considered as a generalized summation model (GAM); thus, it allows calibration using a backward fitting algorithm [50]. By redefining MGWR as a GAM, it is possible to obtain:
where (which replaces in the previous equation) is the smoothing function for the th explanatory variable. The calibration model will generate a set of bandwidths, one for each jth explanatory variable, and the difference in bandwidths indicates the difference in spatial scales. By obtaining the effect of scale in the spatial process, MGWR can more accurately obtain spatial heterogeneity [50].
2.3.4. Neural Network Classification Model
The main framework of our model is illustrated in Figure 4. Formally, given a set of input features consisting of -dimensional features, our model is trained to predict the risk value and the risk level . Specifically, we first concatenated all the input features to get a -dimensional vector, which was then encoded by a fully connected layer to get hidden representation :
where is the activation function (ReLU), and are trainable parameters. Then, hidden representation is sent into a projection layer to calculate the predicted regression value of risk. Here, the loss function we used was the Mean-Square Error (MSE):
where and are the predicted and ground truth value of the -th example, respectively, and is the number of examples in a mini-batch. After this, the predicted value is sent into another fully connected layer to get hidden representation :
where and are trainable parameters. In our experiment, was set as 256 while was set as 128. Then, hidden representation and were concatenated and sent into a projection layer and a softmax later to get the final probability distribution of the risk level. For classification, the loss function we used was cross-entropy:
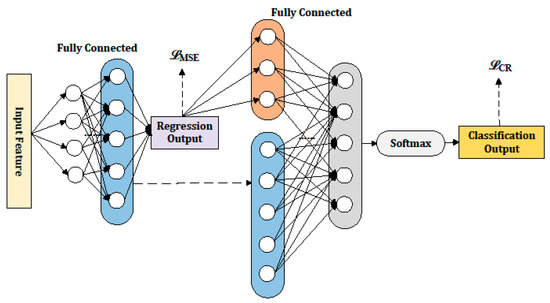
Figure 4.
Neural network classification model. (Note:The same color represents the same set of parameters for the same set of neural networks.)
In order to balance the effects of the two parts of the loss, we used a manual hyperparameter , set to 5 during the experiments, as the adjustment factor.
3. Results and Discussion
3.1. Spatial Autocorrelation of COVID-19 Risk
By Global Moran’s I analysis, the values passed the 1% significance level test (p-value less than 0.00001) with a highly significant Z-score of 268.87, indicating that the distribution of COVID-19 risk levels was not random, but rather, had a high degree of clustering (Figure 5a).
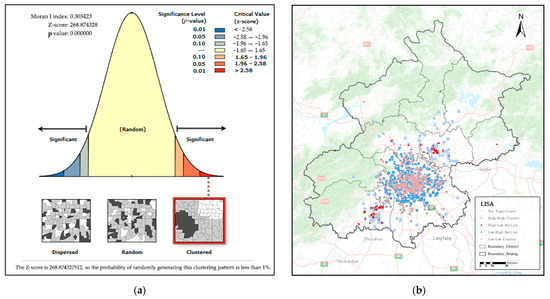
Figure 5.
Results of spatial autocorrelation analysis: (a) Results of Moran’s 1 spatial autocorrelation analysis; (b) LISA analysis results.
After the spatial clustering of COVID-19 epidemic risk had been detected, a further LISA analysis was performed to investigate the clustering types. (Figure 5b) The results of the LISA measurements are shown in Figure 5b. The urban areas of Beijing (Xicheng, Dongcheng, Haidian, Chaoyang, Shijingshan, and Fengtai) showed H-H type clusters. In contrast, the edges of the urban and suburban areas showed L-H type clusters. This implies that a buffer zone of lower risk existed between the risky areas. It can be concluded that the risk of a COVID-19 outbreak is higher within the urban areas of Beijing than in the suburban areas. The risk of COVID-19 showed a decaying trend from the interior to the edge of each district. This indicates a clear administrative boundary between the urban and suburban areas of Beijing for outbreak control. Both urban and suburban areas have tried to contain the COVID-19 risk and inhibit its spread.
3.2. Results of MGWR and Discussion
3.2.1. Variable Filter Results
After feature selection and correlation analysis, 8 of the 20 features selected for the article were finally identified for inclusion in the MGWR model calculations. These features included population density, population structure, road density, residential area, company, educational and cultural facilities, living service facilities, and shopping facilities (Table 2). As shown in Table 2, the selected variables had relatively low multicollinearity in the OLS model, because all VIFs were below the threshold of 5 (all VIFs < 5) [51] and were positively correlated with COVID-19 risk (p < 0.001). The OLS model gave an of 0.597, which allowed the subsequent MGWR model to provide a baseline.
Table 2.
Summary statistics of the OLS model on selected variables in modeling COVID-19 incidence risk.
3.2.2. MGWR Model Results
As shown in Table 3, the results of MGWR showed that the adjustment R-square was 0.743. The eight selected indicators explained the dependent variable better than the OLS regression model established in Table 3.
Table 3.
MGWR model regression results statistics.
The results of the MGWR model allowed us to examine the relationship between COVID-19 risk and the selected characteristics, as well as the spatial variation in the influence of each feature. As can be seen in Figure 6, the fit of each statistical unit varied considerably, showing a gradual decrease from the middle to the surrounding area in general. It can be seen that a poorly fitted ring occurred in the central Beijing area. This indicates that the explanatory power of the selected features in this region is highly differentiated in space.
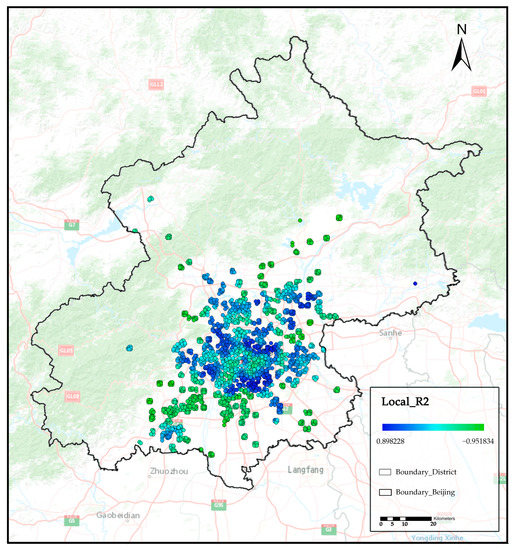
Figure 6.
The spatial distribution of R-squared values from the MGWR model.
The statistical results of each characteristic coefficient of the MGWR model are shown in Table 3. Elderly population density, shopping service facilities, corporate enterprises, residential areas, and living service facilities showed a positive influence on COVID-19 risk. Road density, total population density, and density of scientific, educational, and cultural facilities showed a negative effect on COVID-19 risk. The indicator of standard deviation reflects the dispersion degree of each characteristic on the likelihood of COVID-19 occurrence; a larger standard deviation represents a more significant difference in the degree of influence in different neighborhoods. The densities of population, shopping service facilities, corporate enterprises, and scientific, educational, and cultural service facilities showed global influence. In contrast, the effect of the remaining four characteristics on COVID-19 risk showed evident spatial heterogeneity.
The spatial distribution of the coefficients for each feature is shown in Figure 7:
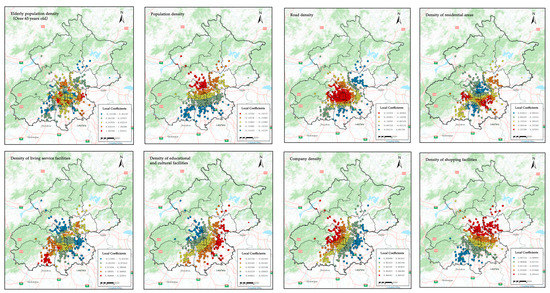
Figure 7.
Spatial distribution of the MGWR local coefficients.
- ·
- Overall, the effect of road density on COVID-19 risk varied widely within statistical units, reflecting significant spatial heterogeneity. The impact of road density on the epidemic gradually diminished from the urban areas to the suburban areas of Beijing.
- ·
- Elderly population density had the most significant positive effect on COVID-19 risk. It was highly spatially heterogeneous, with its influence showing an overall decay from the center to the northeast and southwest. Even in the central city, it offered substantial spatial heterogeneity: its power was most significant for the Fengtai district. Additionally, in Beijing’s urban sub-center (Tongzhou district), the impact of elderly population was relatively high.
- ·
- Population density strongly negatively affected COVID-19 risk. However, the spatial heterogeneity of its effect was weak, showing a trend of decay from northwest to southeast. The Haidian and northern Chaoyang and western Shunyi and Changping districts showed relatively strong results.
- ·
- For the density of shopping service facilities, there was a positive effect on the risk of COVID-19 outbreak. The overall distribution showed a gradually decreasing effect from northeast to southwest. Still, the overall difference was not significant, which, to some extent, reflects the slightly higher commercial vitality in the northeast compared to the southwest.
- ·
- Overall, corporate firms had a positive effect on COVID-19 risk. Their influence gradually decreased from the western part of Beijing to the east and showed a more substantial impact in parts of Haidian, Changping, Xicheng, and Fengtai.
- ·
- Residential areas had a strong positive effect on COVID-19 risk, with considerable spatial heterogeneity. This was shown by the overall higher impact in the southern part of central Beijing than in the northern region, although the suburban areas presented a higher result in the northeast and southeast. The northern areas of Daxing, Chaoyang, and Haidian, which are located in the south, as well as Chang, showed relatively weaker impacts.
- ·
- Science, education and cultural service facilities negatively influenced COVID-19 risk. However, their spatial heterogeneity was weak, and the overall impact gradually increased from the west to the southeast. This impact was greatest in the Tongzhou and Changping districts.
- ·
- For amenities, there was also a substantial impact on COVID-19 risk with significant spatial heterogeneity. This feature presented the most potent negative effect in Tongzhou and Changping districts but had a strong positive effect in Fengtai, Changping and Fangshan districts, with Fengtai being the most positive. The spatial heterogeneity of this feature was most evident in the center of the city, with different degrees of influence in each of the six districts.
3.3. Neural Network Classification Model Prediction Results
3.3.1. Experimental Results
In this study, a risk prediction for the area within the Sixth Ring Road of Beijing was performed using the adopted neural network classification model. In this case, 2497 statistical units with confirmed cases were used as the training set. It should be noted that as the neural network model works differently from the OLS and MGWR models, 20 influencing factors were used as the features for training, and risk was classified into 5 categories as the labels for the features for model training. The results of the model training are as follows (Table 4).
Table 4.
Neural network classification model training results.
3.3.2. COVID-19 Risk Prediction Results
The trained neural network classification model was used to predict the COVID-19 risk level in a 500 m × 500 m grid for the area within the sixth ring road of Beijing. The prediction results are shown in Figure 6. According to the results, the overall distribution of COVID-19 risk predicted by the model decreases gradually from the center to the surrounding area. However, Dongcheng and Xicheng Districts, located in the center of Beijing, are not at the highest risk of an outbreak. In contrast, the western part of Chaoyang District and the northeastern part of Fengtai District are at the highest risk in the region. The predictions for some of Beijing’s suburban areas revealed that the Beijing urban sub-center in Tongzhou District has a high predicted risk value. The Liangxiang urban area in Fangshan District is also at high risk. High risk was also noted near Xisanqi, on the border between Changping and Haidian, and near Beijing International Airport in Shunyi. The predicted results are relatively consistent with the general perception. It is important to note that even in areas with a generally high risk, some areas are at low risk. The projections can provide the government with a risk guide for outbreaks and, together with the MGWR results, can be used to tailor outbreak prevention policies at the neighborhood scale for each district (Figure 8).
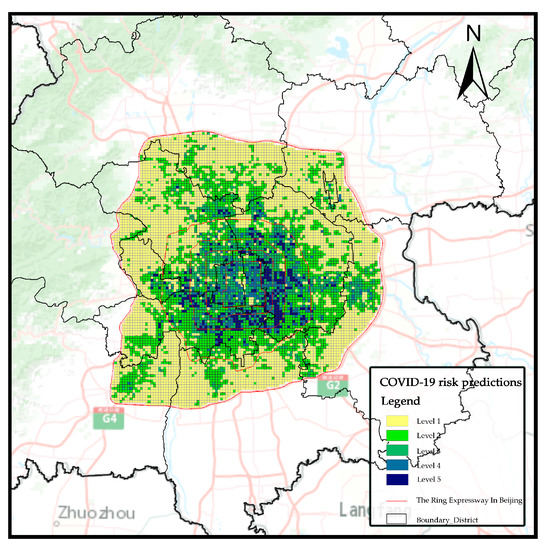
Figure 8.
This is a figure. Schemes follow the same formatting.
3.4. Global Estimation of MGWR Model Results
As the number of MGWR operational results was 2497 statistical samples of different impact factors, not all regions were included. In order to comprehensively assign spatial heterogeneity weights to the different COVID-19 risk impact factors for each statistical cell, the results of the MGWR model were estimated globally (within the Sixth Ring Road of Beijing) using kriging interpolation (Equation (1)) (Figure 9). The following analysis was derived by combining the prediction results of COVID-19 risk and the global estimation results of each influencing factor:
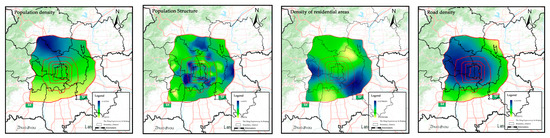
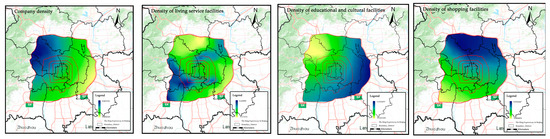
Figure 9.
MGWR local coefficient kriging interpolation analysis results.
- ·
- The predicted risk locations of the epidemic in the Haidian District were mainly within the Fifth Ring Road and the northeastern part of the Haidian District. Combined with the results of the COVID-19 epidemic risk estimation, it was found that the influence of roads, companies, and shopping facilities was more substantial in the Haidian District. In contrast, the influence of demographics was particularly evident in Haidian District (the part within the Fifth Ring Road). In the case of the epidemic in the Haidian District, in the light of the analysis results, a focused and targeted prevention and control was adopted for each area.
- ·
- The prediction results showed that most areas in Chaoyang District (except for the northeast part) have a high risk of epidemic. The spatial heterogeneity of the influencing factors was also evident in Chaoyang District. The influence of population structure and amenities was more substantial in the northern and southern parts of Chaoyang District. The influence of residential areas and educational and cultural facilities decreased from east to west, while the influence of road density and company density decreased in the opposite direction. The influence of population density and shopping facilities decreased from north to south. In formulating the epidemic policy for Chaoyang District, different prevention measures should be adopted according to the different influencing factors and risks.
- ·
- Parts of Changping and Shunyi within the Sixth Ring Road are also at high risk, despite their small size. Among the various influencing factors, elderly population was found to be influential in Changping, while all other influences were primarily global for these two areas. More consideration should be given to the risk of special populations in epidemic prevention, and appropriate measures should be taken in the locations with higher risk.
- ·
- From the predicted results, the risk of an epidemic was found to be higher in most areas of Fengtai. Indeed, these areas were particularly badly affected by the epidemic in the last three years. Among the influencing factors, population structure and living service facilities showed substantial spatial heterogeneity in Fengtai. A strong influence was produced in the central and western parts of Fengtai. Therefore, epidemic prevention and control in Fengtai should apply appropriate and strict prevention and control, and targeted measures should be taken to address different influencing factors.
- ·
- For the area between the fifth and sixth ring roads in southern Beijing, which are parts of Fangshan, Daxing, and Tongzhou, respectively, the prediction results showed a higher risk. The impact factors also showed different levels of impact in each area, with residential areas having a higher impact at the intersection of Daxing and Tongzhou, while living services were shown to have a higher impact on the Fangshan area.
- ·
- Shijingshan is located in the western area between the fifth and sixth ring roads; its southern area is at higher risk due to the impact of residential areas and living service facilities.
- ·
- For the Dongcheng and Xicheng districts, the risk was generally predicted to be higher. In contrast, spatial heterogeneity was weak among the eight risk-influencing factors analyzed, most of which are global influences. Since the two districts are located in the center of Beijing, bearing essential urban functions, and have high risks, all impacting factors should be strictly controlled to prevent new outbreaks.
4. Conclusions
In establishing a neighborhood-scale, this study used a 500 m × 500 m fishing network divided using the ArcGIS software as the primary research unit to study the distribution characteristics of COVID-19 risk in Beijing, explore the influencing factors of risk distribution status, and predict the epidemic risk in the sixth ring of Beijing. We also combined the experimental results of influencing factors to identify the key areas and critical factors for good prevention and control of the epidemic. Overall, three essential findings corresponding to the objectives were derived.
- (1)
- Regarding the distribution characteristics of the COVID-19 epidemic risk in Beijing.
- ·
- The distribution of epidemic risk in Beijing was found to be highly uneven, with a high concentration within the Fifth Ring Road and an overall feature of gradual weakening from the city center outward. It was also found that the distribution of epidemic risk values at the intersection of districts between the sixth and fifth rings showed an L-H clustering phenomenon, indicating that each district has obvious administrative boundaries.
- (2)
- Influencing factors that cause this distribution of pension resources.
- ·
- After analysis, it was found that the factors that have a strong influence on the risk value of COVID-19 are: population structure, population density, road density, the density of residential areas, and density of living service facilities. In comparison, shopping facility density and educational and cultural facility density have a weaker impact on COVID-19 risk.
The MGWR results show that population structure, living service facilities, and residential areas have the highest degrees of spatial heterogeneity among the eight selected features. In comparison, the remaining five features have weaker spatial heterogeneity.
- (3)
- Predictive analysis of risk for areas within the Sixth Ring Road of Beijing.
- ·
- Our predictive analysis of the areas within the Sixth Ring Road of Beijing found that there is a high risk of COVID-19 within the entire Fifth Ring Road, with the eastern, southeastern and southern areas showing the greatest risk, and some areas in the northeast and west also having equally high-risk areas. Meanwhile, the areas outside the Fifth Ring Road, such as Tongzhou, Fangshan, Haidian and Changping, are all high-risk areas.
The COVID-19 epidemic has lasted nearly three years. After understanding the virus and successfully developing vaccines, COVID-19 does not bring as much fear as it did in early 2020. In this “post-epidemic era”, it is necessary to ensure people’s well-being while carrying out essential production and daily activities. Therefore, prevention and control measures typically focus on the key areas and influencing factors in an attempt to make epidemic prevention and control more specific and localized. The contribution of this study is to investigate the characteristics of COVID-19 risk distribution in Beijing, explore and discover the urban elements affecting COVID-19 risk distribution, and predict the COVID-19 risk level in areas with high epidemic incidence. It is worth noting that the prediction of the risk level of COVID-19 in the Shijingshan area in this study was corroborated by recent statistics. This provides both a reference basis for advanced epidemic prevention and control in Beijing and a research paradigm for the study of epidemics in other cities.
Author Contributions
Conceptualization, Demiao Yu and Xiaoran Huang; Methodology, Demiao Yu and Xiaoran Huang; Software, Demiao Yu; Validation, Demiao Yu, Hengyi Zang and Yuanwei Li; Formal analysis, Demiao Yu, Yuchen Qin and Yuanwei Li; Investigation, Demiao Yu and Xiaoran Huang; Resources, Demiao Yu and Xiaoran Huang; Data curation, Demiao Yu and Yuchen Qin; Writing—original draft, Demiao Yu; Writing—review & editing, Xiaoran Huang; Visualization, Demiao Yu and Hengyi Zang; Supervision, Xiaoran Huang and Daoyong Li; Project administration, Xiaoran Huang and Daoyong Li; Funding acquisition, Xiaoran Huang. All authors have read and agreed to the published version of the manuscript.
Funding
This project is funded by the National Natural Science Foundation of China (NSFC) [52208039], the National key R&D program “Science and Technology Winter Olympics” key project “Evacuation system and support technology for assisting physically challenged communities” [2020YFF0304900], the Beijing High-level Overseas Talents Support Funding, R&D Program of Beijing Municipal Education Commission (KM202210009008), the NCUT Young Scholar Development Project, and the Australian Research Council Linkage Project [LP190100089].
Institutional Review Board Statement
Not applicable.
Informed Consent Statement
Not applicable.
Data Availability Statement
The dataset is available upon request.
Conflicts of Interest
The authors declare no conflict of interest.
References
- COVID-19 Map. Available online: https://coronavirus.jhu.edu/map.html (accessed on 23 September 2022).
- IHR Emergency Committee on Novel Coronavirus (2019-NCoV). Available online: https://www.who.int/director-general/speeches/detail/who-director-general-s-statement-on-ihr-emergency-committee-on-novel-coronavirus-(2019-ncov) (accessed on 23 September 2022).
- Yip, T.L.; Huang, Y.; Liang, C. Built Environment and the Metropolitan Pandemic: Analysis of the COVID-19 Spread in Hong Kong. Build. Environ. 2021, 188, 107471. [Google Scholar] [CrossRef] [PubMed]
- Polack, F.P.; Thomas, S.J.; Kitchin, N.; Absalon, J.; Gurtman, A.; Lockhart, S.; Perez, J.L.; Perez Marc, G.; Moreira, E.D.; Zerbini, C.; et al. Safety and Efficacy of the BNT162b2 MRNA Covid-19 Vaccine. N. Engl. J. Med. 2020, 383, 2603–2615. [Google Scholar] [CrossRef] [PubMed]
- COVID-19 Will Continue but the End of the Pandemic Is near—The Lancet. Available online: https://www.thelancet.com/journals/lancet/article/PIIS0140-6736(22)00100-3/fulltext (accessed on 23 September 2022).
- Ammar, A.; Brach, M.; Trabelsi, K.; Chtourou, H.; Boukhris, O.; Masmoudi, L.; Bouaziz, B.; Bentlage, E.; How, D.; Ahmed, M.; et al. Effects of COVID-19 Home Confinement on Eating Behaviour and Physical Activity: Results of the ECLB-COVID19 International Online Survey. Nutrients 2020, 12, 1583. [Google Scholar] [CrossRef] [PubMed]
- Gao, X.; Li, G.; Wang, J.; Xu, T. Spatiotemporal Evolution, Pattern of Diffusion, and Influencing Factors of the COVID-19 Epidemic in Hainan Province, China. J. Med. Virol. 2022, 94, 1581–1591. [Google Scholar] [CrossRef] [PubMed]
- Kan, H.D.; Chen, B.H.; Fu, C.F.; Yu, S.Z.; Mu, L.N. Relationship between Ambient Air Pollution and Daily Mortality of SARS in Beijing. Biomed. Environ. Sci. 2005, 18, 1–4. [Google Scholar]
- Han, Y.; Yang, L.; Jia, K.; Li, J.; Feng, S.; Chen, W.; Zhao, W.; Pereira, P. Spatial Distribution Characteristics of the COVID-19 Pandemic in Beijing and Its Relationship with Environmental Factors. Sci. Total Environ. 2021, 761, 144257. [Google Scholar] [CrossRef]
- Li, W.; Zhang, P.; Zhao, K.; Zhao, S. The Geographical Distribution and Influencing Factors of COVID-19 in China. Trop. Med. Infect. Dis. 2022, 7, 45. [Google Scholar] [CrossRef]
- Ma, J.; Zhu, H.; Li, P.; Liu, C.; Li, F.; Luo, Z.; Zhang, M.; Li, L. Spatial Patterns of the Spread of COVID-19 in Singapore and the Influencing Factors. ISPRS Int. J. Geo-Inf. 2022, 11, 152. [Google Scholar] [CrossRef]
- Mansour, S.; Al Kindi, A.; Al-Said, A.; Al-Said, A.; Atkinson, P. Sociodemographic Determinants of COVID-19 Incidence Rates in Oman: Geospatial Modelling Using Multiscale Geographically Weighted Regression (MGWR). Sustain. Cities Soc. 2021, 65, 102627. [Google Scholar] [CrossRef]
- Wang, J.; Zeng, F.; Tang, H.; Wang, J.; Xing, L. Correlations between the Urban Built Environmental Factors and the Spatial Distribution at the Community Level in the Reported COVID-19 Samples: A Case Study of Wuhan. Cities 2022, 129, 103932. [Google Scholar] [CrossRef]
- Kwok, C.Y.T.; Wong, M.S.; Chan, K.L.; Kwan, M.-P.; Nichol, J.E.; Liu, C.H.; Wong, J.Y.H.; Wai, A.K.C.; Chan, L.W.C.; Xu, Y.; et al. Spatial Analysis of the Impact of Urban Geometry and Socio-Demographic Characteristics on COVID-19, a Study in Hong Kong. Sci. Total Environ. 2021, 764, 144455. [Google Scholar] [CrossRef]
- Hamidi, S.; Sabouri, S.; Ewing, R. Does Density Aggravate the COVID-19 Pandemic? J. Am. Plan. Assoc. 2020, 86, 495–509. [Google Scholar] [CrossRef]
- Li, B.; Peng, Y.; He, H.; Wang, M.; Feng, T. Built Environment and Early Infection of COVID-19 in Urban Districts: A Case Study of Huangzhou. Sustain. Cities Soc. 2021, 66, 102685. [Google Scholar] [CrossRef] [PubMed]
- Li, S.; Ma, S.; Zhang, J. Association of Built Environment Attributes with the Spread of COVID-19 at Its Initial Stage in China. Sustain. Cities Soc. 2021, 67, 102752. [Google Scholar] [CrossRef] [PubMed]
- Mollalo, A.; Vahedi, B.; Rivera, K.M. GIS-Based Spatial Modeling of COVID-19 Incidence Rate in the Continental United States. Sci. Total Environ. 2020, 728, 138884. [Google Scholar] [CrossRef]
- Coccia, M. An Index to Quantify Environmental Risk of Exposure to Future Epidemics of the COVID-19 and Similar Viral Agents: Theory and Practice. Environ. Res. 2020, 191, 110155. [Google Scholar] [CrossRef]
- Lak, A.; Hakimian, P.; Sharifi, A. An Evaluative Model for Assessing Pandemic Resilience at the Neighborhood Level: The Case of Tehran. Sustain. Cities Soc. 2021, 75, 103410. [Google Scholar] [CrossRef]
- Zhou, L.; Li, S.; Li, C.; Shen, G.; Yang, H.; Zhu, P.; Han, H.; Li, B. Spatial Congruency or Mismatch? Analyzing the COVID-19 Potential Infection Risk and Urban Density as Businesses Reopen. Cities 2022, 123, 103615. [Google Scholar] [CrossRef]
- Zhang, J.; Yuan, X. COVID-19 Risk Assessment: Contributing to Maintaining Urban Public Health Security and Achieving Sustainable Urban Development. Sustainability 2021, 13, 4208. [Google Scholar] [CrossRef]
- He, X.; Zhou, C.; Wang, Y.; Yuan, X. Risk Assessment and Prediction of COVID-19 Based on Epidemiological Data From Spatiotemporal Geography. Front. Environ. Sci. 2021, 9, 634156. [Google Scholar] [CrossRef]
- Ak, Ç.; Chitsazan, A.D.; Gönen, M.; Etzioni, R.; Grossberg, A.J. Spatial Prediction of COVID-19 Pandemic Dynamics in the United States. ISPRS Int. J. Geo-Inf. 2022, 11, 470. [Google Scholar] [CrossRef]
- De Cos, O.; Castillo, V.; Cantarero, D. Differencing the Risk of Reiterative Spatial Incidence of COVID-19 Using Space–Time 3D Bins of Geocoded Daily Cases. ISPRS Int. J. Geo-Inf. 2021, 10, 261. [Google Scholar] [CrossRef]
- Ren, H.; Zhao, L.; Zhang, A.; Song, L.; Liao, Y.; Lu, W.; Cui, C. Early Forecasting of the Potential Risk Zones of COVID-19 in China’s Megacities. Sci. Total Environ. 2020, 729, 138995. [Google Scholar] [CrossRef] [PubMed]
- He, P.; Gao, Y.; Guo, L.; Huo, T.; Li, Y.; Zhang, X.; Li, Y.; Peng, C.; Meng, F. Evaluating the Disaster Risk of the COVID-19 Pandemic Using an Ecological Niche Model. Sustainability 2021, 13, 11667. [Google Scholar] [CrossRef]
- Lall, S.V.; Wahba, S.N. Crowded Cities: New Methodology in COVID-19 Risk Assessment. Sustainability 2021, 13, 7167. [Google Scholar] [CrossRef]
- Yuan, M.; Liu, T.; Yang, C. Exploring the Relationship among Human Activities, COVID-19 Morbidity, and At-Risk Areas Using Location-Based Social Media Data: Knowledge about the Early Pandemic Stage in Wuhan. Int. J. Environ. Res. Public Health 2022, 19, 6523. [Google Scholar] [CrossRef] [PubMed]
- Wang, H.; Yuan, P.; Tang, C.; Guan, Z.; Xiang, P.; Chen, X.; Zhang, D.; Li, Q.; Hu, S.; Bo, T.; et al. COVID-19 Control in Community Hospitals: Experience From Four Community Hospitals in Beijing, China. INQUIRY J. Health CareOrgan.Provis. Financ. 2022, 59, 00469580211055621. Available online: https://journals.sagepub.com/doi/full/10.1177/00469580211055621 (accessed on 16 November 2022). [CrossRef]
- Li, J.; Liu, X.; Zou, Y.; Deng, Y.; Zhang, M.; Yu, M.; Wu, D.; Zheng, H.; Zhao, X. Factors Affecting COVID-19 Preventive Behaviors among University Students in Beijing, China: An Empirical Study Based on the Extended Theory of Planned Behavior. Int. J. Environ. Res. Public Health 2021, 18, 7009. [Google Scholar] [CrossRef]
- Field Measurements of Indoor and Community Air Quality in Rural Beijing before, during, and after the COVID-19 Lockdown—Li—2022—Indoor Air—Wiley Online Library. Available online: https://onlinelibrary.wiley.com/doi/full/10.1111/ina.13095 (accessed on 16 November 2022).
- Optimization of Energy Efficiency and COVID-19 Pandemic Control in Different Indoor Environments—ScienceDirect. Available online: https://www.sciencedirect.com/science/article/pii/S0378778822001256 (accessed on 16 November 2022).
- Ma, L.; Huang, Y.; Liu, T. Unequal Impact of the COVID-19 Pandemic on Mental Health: Role of the Neighborhood Environment. Sustain. Cities Soc. 2022, 87, 104162. [Google Scholar] [CrossRef] [PubMed]
- Guo, X.; Tu, X.; Huang, G.; Fang, X.; Kong, L.; Wu, J. Urban Greenspace Helps Ameliorate People’s Negative Sentiments during the COVID-19 Pandemic: The Case of Beijing. Build. Environ. 2022, 223, 109449. [Google Scholar] [CrossRef] [PubMed]
- Jiang, M.; Zu, L.; Li, Z.; Zhao, Z.; Pan, Y.; Liu, W.; Yang, S. Analysis on the Development Trend of COVID-19 Outbreak in Beijing Based on the Cluster Analysis and SEIR Model. In Proceedings of the 2020 Chinese Automation Congress (CAC), Shanghai, China, 6–8 November 2020; pp. 6203–6207. [Google Scholar]
- Jia, J.; Chen, Y.; Wang, Y.; Li, T.; Li, Y. A New Global Method for Identifying Urban Rail Transit Key Station during COVID-19: A Case Study of Beijing, China. Phys. A Stat. Mech. Its Appl. 2021, 565, 125578. [Google Scholar] [CrossRef] [PubMed]
- Li, X.; Wang, Q.; Ding, P.; Cha, Y.; Mao, Y.; Ding, C.; Gu, W.; Wang, Y.; Ying, B.; Zhao, X.; et al. Risk Factors and On-Site Simulation of Environmental Transmission of SARS-CoV-2 in the Largest Wholesale Market of Beijing, China. Sci. Total Environ. 2021, 778, 146040. [Google Scholar] [CrossRef] [PubMed]
- Prevention and Control Work. Available online: http://wjw.beijing.gov.cn/wjwh/ztzl/xxgzbd/gzbdjkts/202201/t20220117_2592609.html (accessed on 17 November 2022).
- Wu, X.; Mao, R.; Guo, X. Equilibrium of Tiered Healthcare Resources during the COVID-19 Pandemic in China: A Case Study of Taiyuan, Shanxi Province. Int. J. Environ. Res. Public Health 2022, 19, 7035. [Google Scholar] [CrossRef] [PubMed]
- Han, J.; Yin, J.; Wu, X.; Wang, D.; Li, C. Environment and COVID-19 Incidence: A Critical Review. J. Environ. Sci. 2023, 124, 933–951. [Google Scholar] [CrossRef] [PubMed]
- Identifying the Space-Time Patterns of COVID-19 Risk and Their Associations with Different Built Environment Features in Hong Kong—ScienceDirect. Available online: https://www.sciencedirect.com/science/article/pii/S0048969721004472 (accessed on 4 October 2022).
- Hassan, M.S.; Bhuiyan, M.A.H.; Tareq, F.; Bodrud-Doza, M.; Tanu, S.M.; Rabbani, K.A. Relationship between COVID-19 Infection Rates and Air Pollution, Geo-Meteorological, and Social Parameters. Environ. Monit. Assess 2021, 193, 29. [Google Scholar] [CrossRef]
- Yang, J.; Dong, J.; Xiao, X.; Dai, J.; Wu, C.; Xia, J.; Zhao, G.; Zhao, M.; Li, Z.; Zhang, Y.; et al. Divergent Shifts in Peak Photosynthesis Timing of Temperate and Alpine Grasslands in China. Remote Sens. Environ. 2019, 233, 111395. [Google Scholar] [CrossRef]
- Anselin, L. Local Indicators of Spatial Association—Lisa. Geogr. Anal. 1995, 27, 93–115. [Google Scholar] [CrossRef]
- Brunsdon, C.; Fotheringham, S.; Charlton, M. Geographically Weighted Regression—Modelling Spatial Non-Stationarity. J. R. Stat. Soc. Ser. D-Stat. 1998, 47, 431–443. [Google Scholar] [CrossRef]
- Leung, Y.; Mei, C.L.; Zhang, W.X. Statistical Tests for Spatial Nonstationarity Based on the Geographically Weighted Regression Model. Environ. Plan. A 2000, 32, 9–32. [Google Scholar] [CrossRef]
- Oshan, T.M.; Smith, J.P.; Fotheringham, A.S. Targeting the Spatial Context of Obesity Determinants via Multiscale Geographically Weighted Regression. Int. J. Health Geogr. 2020, 19, 11. [Google Scholar] [CrossRef] [PubMed]
- Oshan, T.M.; Li, Z.; Kang, W.; Wolf, L.J.; Fotheringham, A.S. MGWR: A Python Implementation of Multiscale Geographically Weighted Regression for Investigating Process Spatial Heterogeneity and Scale. ISPRS Int. Geo-Inf. 2019, 8, 269. [Google Scholar] [CrossRef]
- Fotheringham, A.S.; Yang, W.; Kang, W. Multiscale Geographically Weighted Regression (MGWR). Ann. Am. Assoc. Geogr. 2017, 107, 1247–1265. [Google Scholar] [CrossRef]
- O’Brien, R.M. A Caution Regarding Rules of Thumb for Variance Inflation Factors. Qual. Quant. 2007, 41, 673–690. [Google Scholar] [CrossRef]


Disclaimer/Publisher’s Note: The statements, opinions and data contained in all publications are solely those of the individual author(s) and contributor(s) and not of MDPI and/or the editor(s). MDPI and/or the editor(s) disclaim responsibility for any injury to people or property resulting from any ideas, methods, instructions or products referred to in the content. |
© 2023 by the authors. Licensee MDPI, Basel, Switzerland. This article is an open access article distributed under the terms and conditions of the Creative Commons Attribution (CC BY) license (https://creativecommons.org/licenses/by/4.0/).