Abstract
Driving analysis of urban expansion (DAUE) is usually implemented to identify the driving factors and their corresponding driving effects/mechanisms for the expansion processes of urban land, aiming to provide scientific guidance for urban planning and management. Based on a thorough analysis and summarization of the development process and quantitative models, four major limitations in existing DAUE studies have been uncovered: (1) the interactions in hierarchical urban systems have not been fully explored; (2) the employed data cannot fully depict urban dynamic through finer social perspectives; (3) the employed models cannot deal with high-level feature correlations; and (4) the simulation and analysis models are still not intrinsically integrated. Four future directions are thus proposed: (1) to pay attention to the hierarchical characteristics of urban systems and conduct multi-scale research on the complex interactions within them to capture dynamic features; (2) to leverage remote sensing data so as to obtain diverse urban expansion data and assimilate multi-source spatiotemporal big data to supplement novel socio-economic driving factors; (3) to integrate with interpretable data-driven machine learning techniques to bolster the performance and reliability of DAUE models; and (4) to construct mechanism-coupled urban simulation to achieve a complementary enhancement and facilitate theory development and testing for urban land systems.
1. Introduction
At present, urban areas on earth accommodate approximately one-half of the world’s population, and this proportion will increase to about two-thirds by 2050 [1]. This continuous urbanization will inevitably lead to urban expansion in order to provide urban residents with adequate living space and sufficient utilities. However, unorderly urban expansion will result in the occupation of fertile cultivated land and public green areas, leading to environmental issues such as ecosystem degradation, eventually affecting sustainable development.
Thus, scholars have carried out extensive studies on the driving analysis of urban expansion (abbreviated to DAUE) with the goal of providing scientific guidance on rational urban land allocation for urban management and planning (Figure 1). Here, DAUE is defined to cover all related driving effect/relationship/mechanism research on urban expansion and includes the employed analysis methods within them, i.e., correlation analysis, regression analysis, causal analysis, and so on. The key research areas of current DAUE include (1) exploring the qualitative/quantitative relationship between urban expansion and certain driving factors(e.g., [2,3]); (2) identifying the major driving factors of urban expansion from socio-economic, policy, topographic, and other perspectives (e.g., [4,5]); (3) understanding the spatiotemporal dynamics of driving effects or mechanisms during the process of long-term urban expansion (e.g., [6,7]); and (4) providing theoretical support for urban expansion modelling (e.g., [8]).
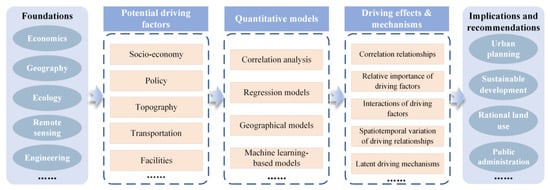
Figure 1.
Road map for DAUE study.
There are many reviews focusing on the potential driving factors and how they affect urban expansion. However, in-depth summaries and discussions of the development process and research methods of DAUE have not yet been implemented. Specifically, the works of Lambin et al. [9], Van Vliet et al. [10] and Shaw et al. [11] have explored much broader research topics such as urbanization, land use/cover change and land system science, meaning that DAUE-related content is limited; Wahyudi and Liu [12], Hersperger et al. [13], and Kim et al. [14] have only summarized all the driving factors that have been discussed in existing studies of urban expansion/land use change simulation; Dadashpoor and Ahani [15], Colsaet et al. [16], Kasraian et al. [17], and Seto et al. [18,19] have only summarized the driving effects or mechanisms of potential driving factors on urban expansion.
Based on the comments above, to facilitate discovering research gaps in DAUE and enlightening future directions, we elaborate upon the development process and mainstream quantitative models or methods in this study by discussing the following three topics:
(1) What is the chronological development of DAUE?
(2) What quantitative models/methods have been used in DAUE case studies, and what are the application scenarios for each approach?
(3) What are the limitations of current DAUE studies and the future research agenda in DAUE?
2. The Development Process of DAUE
The collected DAUE case studies for review are retrieved from the Web of Science Core Collection (WOS CC), which comprises 399 papers from 1961 to 2023. The details of the literature retrieval are introduced in Appendix A. Based on this, we discuss and analyse the evolutionary characteristics of article publication, research collaboration, and hot research themes using a bibliometric analysis. The employed bibliometric analysis methods are provided in Appendix B.
2.1. The Booming of DAUE Study and Transition of Involved Research Institutions
2.1.1. Three Identified Development Stages of DAUE
As Figure 2 illustrates, from January 1961 to March 2023, the annual publication volume (including early accessed paper) and total citation frequency of DAUE studies undergo an overall exponential increase. Three development stages of DAUE can be identified: the start-up stage (1961–2000), growing stage (2001–2013) and booming stage (2014–2023). The publication volume in these three stages accounts for 3%, 16%, and 81%, respectively of the total publications. In the start-up stage, only one DAUE paper was published per year; during the growing stage, the number of publications increased slowly and unsteadily, with the count of annual publications at no more than ten, and the citation frequency generally below 500. Comparatively, during the booming stage, the annual publication volume and total citation frequency underwent an obviously explosive growth, indicating that DAUE attracted extensive attention and experienced rapid development during this stage.
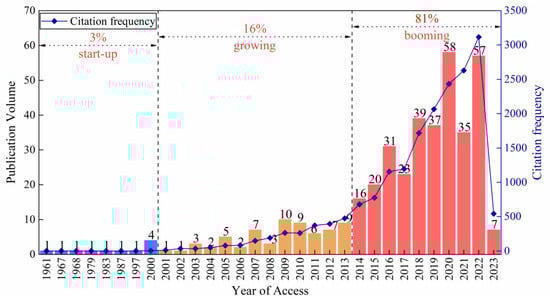
Figure 2.
Annual publication volume (including early-access papers) and citation frequency of DAUE.
2.1.2. Increasingly Multidisciplinary Subjects of DAUE
The DAUE papers in the database were published in a total of 116 different journals. Figure 3 presents the top ten most influential journals, in which 202 papers were published, accounting for about 51% of the total. The most popular journals in the field of DAUE include Sustainability, Land Use Policy, Habitat International, Land, Landscape and Urban Planning, and Applied Geography. Among these, Land Use Policy, Landscape and Urban Planning, Habitat International, and Applied Geography, with their high 5-year impact factor (IF5), have witnessed an impressive total number of DAUE-related publications thus far. In addition, DAUE case studies are mainly published in the journals of SCIE and SSCI. However, it can be observed that the average volume and IF5 of SSCI journals in the top ten journals are higher than those of SCIE journals. This indicates that although DAUE is a multidisciplinary research field, it exerts a more significant influence on social science.
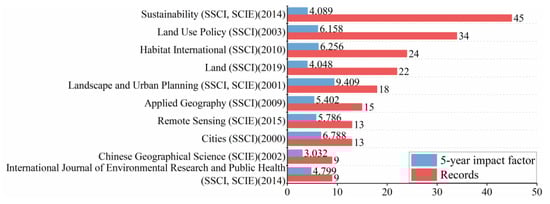
Figure 3.
Top ten influential journals for publications in DAUE. The number in brackets indicates the year that a DAUE paper was first published in this journal.
Since each journal indexed by WOS CC has been classified into at least one subject category by specific algorithms or professional experts, analysing the chronological extension of these subjects can aid in the understanding of the research domains involved in DAUE. Figure 4 demonstrates that the subjects of these 116 DAUE-related journals can be further divided into five categories: economics, urban planning, geography, environmental protection, and frontier technology. The earliest researchers (e.g., [20]) mainly analysed the driving mechanism of urban expansion from the perspective of economics, and subsequent studies were also constantly influenced by economic theories (e.g., [21]). Later, with the continuous development of DAUE, the subjects were gradually enriched, especially those related to environmental protection and sustainable development. Since 2000, DAUE research has begun to address the subjects of “frontier technology”, such as remote sensing, engineering and computer science.
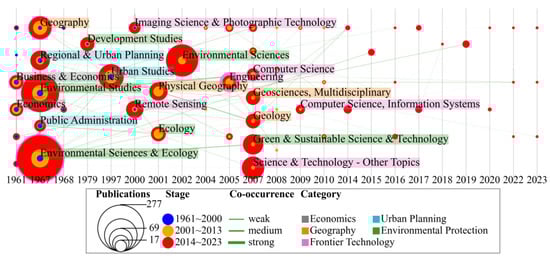
Figure 4.
Development of primary DAUE-related WOS categories.
2.1.3. The Transition of Involved DAUE Research Institutions
Figure 5 shows the major countries that have contributed to DAUE study, along with the cooperative network built from them. Before the year 2000, most publications came from Germany and the USA; since 2000, however, the hotspot of DAUE publications has gradually shifted to China, which has become the most important hub for the knowledge exchange and research cooperation of DAUE study (as indicated by the thickest violet outer ring). Furthermore, as shown in Table 1, Chinese institutions have conducted the highest number of DAUE studies overall, followed by institutions in the USA. Judging from the betweenness centrality of institutions, the Chinese Academy of Sciences has contributed most to DAUE publications.
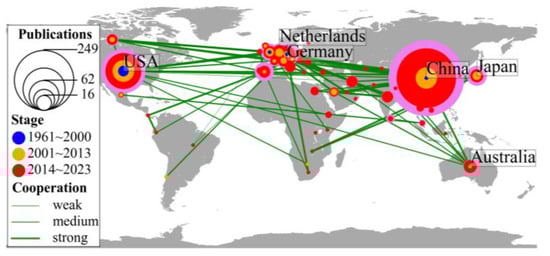
Figure 5.
Cooperative network of major countries involved in DAUE.

Table 1.
Top 10 active institutions.
2.2. Evolution of DAUE Hot Themes
A total of 1211 research themes were extracted from publications in our database. Among them, 155 so-called “hot” themes are identified using the Jenks natural break point method; these account for about 13% of the total themes.
2.2.1. Hot Research Themes and Their Diachronic Extension
In more detail, we divide the hot themes into four categories—keywords of urban expansion, driving analysis, study area and driving factors—and visualize each of their corresponding diachronic extensions.
As shown in Figure 6, keywords related to urban expansion have evolved from relatively narrow to more diverse, and from implicit to explicit. For example, “urban expansion” involves more expansion patterns beyond the special form of “urban sprawl”, and clearly stresses the spatial characteristic of urban land change compared with “urban growth”. Moreover, many of the themes that developed later, such as built-up expansion, impervious surface and construction land, clarify the specific land cover change types of urban expansion in current research.
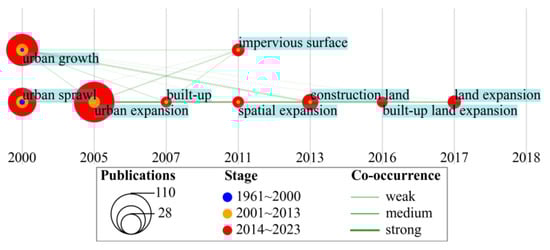
Figure 6.
Development of “keywords of urban expansion”.
Figure 7 shows that although the specific content of driving analysis has gradually become more in-depth and complex, studies addressing driving mechanisms (how the driving factors impact urban expansion) are far fewer than those merely focusing on the driving effects/relationships (to what extent driving factors influence urban expansion). In the selection of driving factors, since approximately 2013, researchers have explicitly extended their sphere of interest from only considering city-level macro driving factors to further exploring how “spatial determinants” at the parcel or pixel level (such as distance to rivers) impact urban structure and urban land allocation.
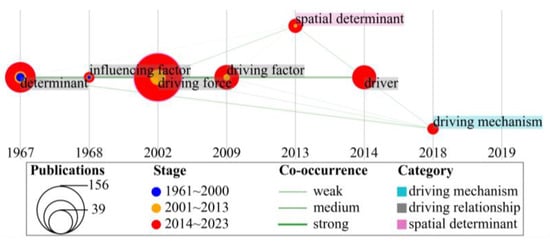
Figure 7.
Development of themes indicating “driving analysis”.
Figure 8 shows that DAUE researchers have gradually come to pay considerable attention to urban agglomerations and the megacities within them, such as Guangzhou in the Pearl River Delta, Wuhan in the Yangtze River Middle Reaches Urban Agglomeration, and Beijing in the Beijing–Tianjin–Hebei Urban Agglomeration. Increasingly complicated urban systems prompt multilevel and interactive urban expansion processes; thus, the study area tends to be diversified and multi-scale, extending from peri-urban areas to single cities, metropolitan areas or megacities, and subsequently to urban agglomerations with complex internal structures.
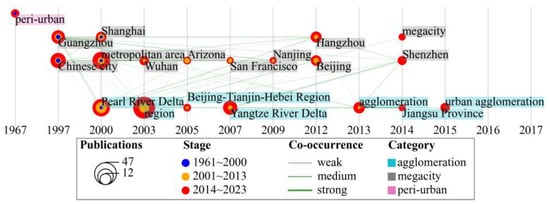
Figure 8.
Development of themes indicating “study area”.
Figure 9 shows that the driving factors constructed in DAUE can be classified as factors related to socio-economics, governance and institutions, and social context. The earliest involved factors such as economy, population, land development and transportation are relevant to discussions of suburbanization and urban sprawl in American and European countries [22,23]. Later, against the backdrop of China’s reform and opening up, the core research focus transferred to China, meaning that the driving factors analysed were greatly influenced by China’s urbanization strategy and policy (e.g., government, foreign investment, markets, and high-speed railway). Recently, moreover, some factors that quantify spatial interaction, such as accessibility and migration, have also attracted widespread attention.
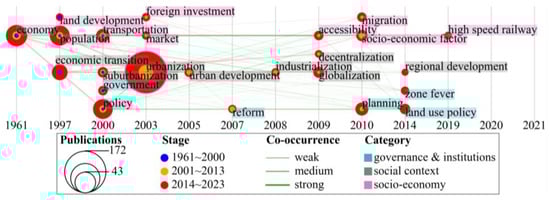
Figure 9.
Development of themes indicating “driving factors”.
2.2.2. Burst Detection for Hot Themes
Four hot themes in DAUE are captured as burst terms: namely, economic transition, remote sensing, GIS, and cellular automata (Table 2). Among them, economic transition describes the social context of urban expansion; remote sensing is an important data source for DAUE; GIS is the technical support platform; and finally, cellular automata can be regarded as a typical application scenario of DAUE.
Table 2.
Results of burst detection.
The economic transition’s burst stage ranges from 2015 to 2017, mainly owing to the transformation of economic development during China’s reform and opening-up. Moreover, it also refers to the economic restructuring in the process of urban development [24] or the economic transformation of resource-based cities resulting from the depletion of resources, e.g., coal, oil, etc. [25].
GIS was applied as an important data analysis and processing tool that attracted a lot of attention in DAUE research from 2005 to 2013. Remote sensing (RS) datasets, especially Landsat data collections, were also widely employed as a new data source from 2002 to 2013. In the earlier stages of DAUE study, the advanced technologies of GIS and RS could meet researchers’ needs for data supplementation, processing, and modelling. After being mastered by more researchers, they have since become basic and indispensable research tools, and are thus no longer highlighted in new DAUE publications after 2013.
The burst stage of cellular automata (CA) ranges from 2017 to 2020. CA has a strong capability to simulate the spatiotemporal dynamics of land use change in complex urban systems. Although CA-based urban simulation places more emphasis on model accuracy, the essence of model calibration in CA is inherently related to DAUE. From approximately 2017 to 2020, some researchers in CA-based urban simulation began to pay close attention to DAUE in order to improve the performance of CA models (e.g., [26,27,28]), or to take DAUE as an auxiliary work in CA (e.g., [29]).
3. Quantification Models in DAUE
A series of quantitative methods have been employed to conduct the DAUE research and explain the driving effects. As shown in Figure 10, models involved in DAUE can be divided into three categories: (1) traditional correlation analysis and regression models that focus on measuring the correlativity between each driving factor (X) and urban expansion (Y); (2) geographical regression models that specifically consider spatial and temporal effects; and (3) machine learning-based models. The former two types of models are mainly mechanism-driven models with specific statistical assumptions, while machine learning-based models are data-driven models.
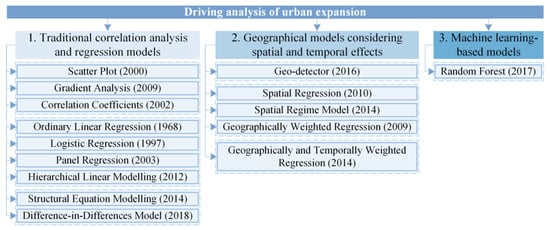
Figure 10.
Major quantitative models/methods employed in DAUE. The number in brackets indicates the specific year in which the model was first used in DAUE.
3.1. Traditional Correlation Analysis and Regression Models
3.1.1. Correlation Analysis
Scatter plots, gradient analyses, and correlation coefficients are methods that have been employed to visualize/measure correlation relationships since the early days of empirical DAUE research. The former two methods present correlation patterns of X and Y by visualizing a set of discrete data points, while the last method can measure the degree of correlation. A scatter plot visualizes the correlation pattern between each driving factor and urban expansion in the form of a 2D plot. Gradient analysis can expose the relationship between the indicators of urban land distribution/expansion and the distance to diverse site factors, such as city centres [30], roads [31], rivers [32], coastal lines [33], subway stations, and highway exits [34]. However, although scatter plots and gradient analysis can be used to display details of correlation patterns, the corresponding correlation strengths cannot be accurately estimated.
Correlation coefficients are indicators that measure the strength of the correlations between driving factors and urban expansion. In DAUE, the Pearson correlation coefficient (PCC) is the most widely used linear correlation analysis, while grey relational analysis (GRA) has been used for nonlinear correlation analysis. Although PCC assumes that observed data were drawn from stochastic processes obeying normal distribution, only very few DAUE studies have conducted the corresponding statistical test before applying it. By contrast, GRA measures the correlation between two variables based on the similarity of their sequence trends, so it imposes fewer limitations on variable distribution. However, GRA cannot identify whether a correlation relationship is positive or negative, since the output values range from 0 to 1.
Currently, due to the diversity of driving factors and the complexity of driving mechanisms, these three methods are primarily employed in DAUE as exploratory data analysis methods to improve the reliability of subsequent regression models, for example, through eliminating multicollinearity of driving factors.
3.1.2. Classic Regression Models without Considering Spatiotemporal Effect
In DAUE, ordinary linear regression (OLR) and logistic regression (LR) are two simple but widely used regression models. OLR is suitable for exploring linear correlations between multiple factors and continuous dependent variables in urban expansion (e.g., urban area and urban expansion intensity), while LR can be applied to discrete or binary dependent variables (e.g., land use types, changes of urban land, etc.). Compared with OLR, LR integrates the logit transformation with a linear regression of driving factors to generate the probability of urban expansion. With support from remote sensing and GIS in DAUE, logistic regression is often combined with other more sophisticated models such as multilevel regression [35], spatial regression [36], and geographically weighted regression [37], among others. Being similar to LR but using different probability distribution, probit regression can also be used to analyse discrete urban expansion variables [7]. The coefficients obtained through probit regression are proportional to those obtained through logistic regression, which indicates that the driving effects measured by the two models are equal. Comparatively, logistic regression is more widely used than probit regression.
Panel regression, which can be regarded as the extension of OLR in the temporal dimension, requires time series analysis of both cross-sectional urban expansion data and related driving factors. By providing more informative data across samples in multiple phases, this method can relieve data multicollinearity, capture individual variability, and identify the effects of unobserved time-invariant variables [38,39]. In DAUE, pooled ordinary least-square regression, fixed-effect regression, and random-effect regression are three most commonly used methods of panel regression analysis [3,40,41]. Statistical tests, especially the F-test and Hausman test, can be used in practice to aid in the selection of the specific panel regression approach that best matches the studied data.
Hierarchical linear modelling (HLM) is a regression approach applied to nested datasets, which enables DAUE research to assimilate driving factors from different administrative levels, such as the prefecture level (level 1, i.e., individual level) and provincial level (level 2, i.e., group/contextual level). The regressions at multiple spatial scales take regional effects on individual units into account, while also considering the effects of the cross-level interaction of driving factors on urban expansion [42,43]. Table 3 lists three basic forms of HLM, namely the null model, random-coefficient regression model, and intercepts-and-slopes-as-outcomes model. Among them, the null model measures the influence of differences within and between groups; the random-coefficient regression model is designed to explore the direct effect of individual-level factors on the dependent variable; finally, the intercepts-and-slopes-as-outcomes model can analyse the driving effect of certain factors at both two levels. These models can be constructed in turn and subsequently combined to illustrate the driving effects of each administrative level.
Table 3.
Three basic forms of HLM.
Structural equation modelling (SEM) is a causal mechanism analysis method that combines factor analysis and path analysis to explore the interactions between a set of observed and latent variables. In land system science, a change of land use usually involves a variable combination of multiple driving factors [44]. Therefore, SEM has been used in the DAUE context to measure and analyse the causal mechanisms between urban expansion and various variables. As illustrated in Figure 11, latent variables are derived from observed variables (i.e., driving factors) in factor analysis, while a theoretical framework explaining how these variables relate to each other can be presupposed by researchers in the form of a path diagram [45]. This structure of causal relationships between variables in fact makes up a group of interrelated equations [46,47], in which regression coefficients are estimated. The model can then be evaluated and modified step-by-step according to fitting indices. However, it should be noted that theoretical frameworks are user-defined, and that multiple distinct SEM analysis results may be obtained from the same research dataset.
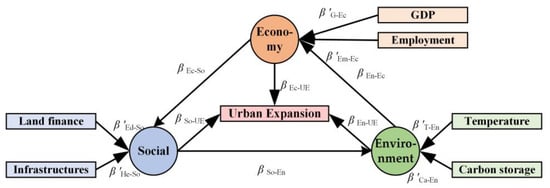
Figure 11.
An example of assumed driving mechanism pending to be tested by structural equation modelling (SEM). Latent variables and observed variables are marked in circles and squares, respectively. Path coefficients (i.e., β, β’) describe the directed prediction relationship between variables.
The difference-in-differences (DID) model is a quasi-experimental approach used to study the influence of a treatment (i.e., explanatory variable) by comparing the changes in outcomes (i.e., explained variable) between a control group and treatment group over time. Therefore, DID is established to measure the impact of only a single factor (one treatment). For example, in DAUE study, Zhou et al. [48] applied DID to explore the impact of the administrative hierarchy system on urban expansion in China, while Deng et al. [49] and Zhang et al. [50] employed DID to study the driving effect of high-speed railways. Furthermore, DID relies on a strict exchangeability assumption, specifically that the treatment group and control group originally have a common trend and that the treatment will cause a difference between them [51]. For this reason, the trend similarity between two groups of samples should be guaranteed to ensure the validity of DID results in the DAUE context. Thus, a common trend test and falsification test on the treatment group and control group are required before analysis; however, only Zhang et al. [50] have explicitly conducted such tests.
Generally, these six classic regression models have a strong generalization capacity and are relatively simple to conduct. However, these models cannot handle sophisticated relationships such as the spatial heterogeneity between Y and X during the diversification of urban development.
3.2. Geographical Models Considering Spatial and Temporal Effects
In the process of urban spatial expansion, complex interaction between geographic entities is widespread, while spatiotemporal non-stationarity and spatial association also cannot be neglected. Thus, to better capture the actual urban expansion mechanisms, researchers have increasingly taken these underlying spatiotemporal effects into account in DAUE modelling.
3.2.1. Geo-Detector: Model Considering Spatial Distribution
The geo-detector is a spatial statistic model consisting of four detectors: a factor detector, interaction detector, risk detector and ecological detector, as shown in Figure 12 [52]. The first three detectors are commonly used in DAUE, especially in urban agglomeration research [53,54]. A factor detector can measure the strength of the correlation between driving factors and urban expansion and imply a stronger causality than correlation coefficients [52], although it cannot present the direction of the correlation due to its value range of 0 to 1. An interaction detector can reveal how paired driving factors interact with each other to affect urban expansion and identify the strength, direction, linearity, or nonlinearity of their interaction. For example, a nonlinear-enhance interaction is often found between driving factors in DAUE [55,56], which indicates that the superposition of two factors nonlinearly enhances their explanatory power for urban expansion. A risk detector employs a t-test to detect whether there are significant differences in the mean values of the urban expansion index at different levels of driving factors, which can further reveal the influence of driving factors and their correlation pattern through visualization.
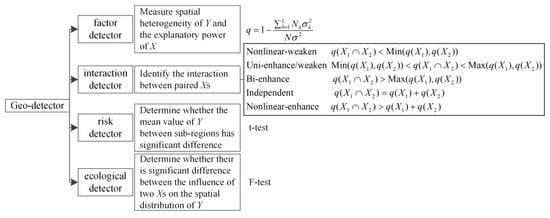
Figure 12.
Geo-detector and its composition.
Geo-detectors avoid the influence of factor multicollinearity and can fulfil numerous different functions when different detectors are chosen. However, they are only applicable to discrete explanatory variables of driving factors; as a result, continuous variables will need to be discretized in practice, which may give rise to the modifiable areal unit problem (MAUP) [52].
3.2.2. Spatial Regression Models: Models Considering Spatial Dependence
Since the intrinsic spatial autocorrelation in DAUE variables is ubiquitous, spatial regression models are applied to explicitly express the impact of spatial dependence, with examples including the spatial lag model (SLM), spatial error model (SEM) and spatial Durbin model (SDM) (Figure 13).
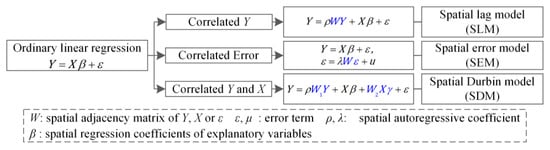
Figure 13.
Spatial regression models.
Among these models, SLM and SEM have been most popular in the DAUE context since 2010 [57]. SLM takes the influence of neighboring urban expansion into account, with the spatially lagged variable established in the model. SEM assumes the existence of unobserved but important explanatory variables that are spatially correlated and affect local expansion; as a result, it multiplies the spatial adjacency matrix with error terms to produce its spatially lagged variable (). These two models have been shown to evaluate the driving effects of factors on urban expansion more precisely than OLS, owing to the spatial relationship in the data [57].
SDM is the extension of SLM and SEM, designed to consider the spatial autocorrelation of both the dependent variable and explanatory variables. Feng et al. [58] employed this model to reveal the spatial characteristics of driving effects on urban sprawl, and identified the so-called siphon effect or spill-over effect between cities at the country scale as well as the spatial correlation of urban sprawl in China. Furthermore, it is notable that the coefficients estimated by spatial dependence terms on the explained variable in SDM, SEM, and SLM can be identified as either direct marginal effects caused by local driving factors or indirect marginal effects caused by neighborhood driving factors [50,58,59].
To guarantee the selection of the spatial regression model that will best match the observed data, it is necessary to conduct a Lagrange multiplier test on the data before modelling. However, the spatial regression models mentioned above belong to the type of global regression that is incapable of modelling spatial heterogeneity in the urban expansion process.
3.2.3. SRM and GWR: Models Considering Spatial Dependence and Spatial Heterogeneity
The spatial regime model (SRM) and geographically weighted regression (GWR) are two typical spatial regression techniques that can not only capture spatial dependence through a spatial weighted matrix, but also address spatial heterogeneity by spatially varying coefficients. SRM regards homogeneous geographical units as subsets, and subsequently constructs regression equations for each of them. At present, few studies have applied SRM to quantitatively measure the distinct driving effects on regions within and outside development zones of the city under study [60], or on cities in different administrative levels [61].
GWR can estimate the regression coefficients for each spatial entity by jointly taking its geographical neighbors within a certain spatial range as observed sample sets. Based on Tobler’s first law of geography [62], neighbors of different distances within the bandwidth should have different weights obtained from proper kernel functions (Figure 14). In the DAUE context, GWR can provide both global and local implications for rational urban expansion according to spatially varying coefficients. Moreover, it is often integrated with logistic regression to capture the spatial heterogeneity in the probability pattern of urban land transition [63]. Besides, multiscale GWR has been employed to generating unique spatial scale for different driving factors [64].
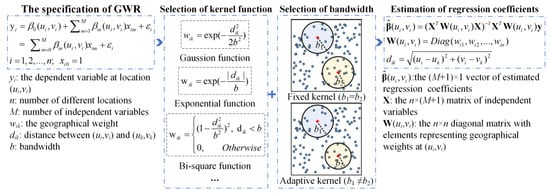
Figure 14.
Scheme of GWR model.
Compared with GWR, SRM only considers spatial heterogeneity across different clusters in a study area rather than each spatial entity in turn. However, GWR is sensitive to bandwidth selection and unsuitable for small samples. Notably, when the number of studied entities is too large, solving GWR will require significant storage space and large amounts of computational resources [65].
3.2.4. GTWR and GTWLR: Models Considering Both Spatial and Temporal Effects
Geographically and temporally weighted regression (GTWR) [66] and geographically and temporally weighted likelihood regression (GTWLR) [67] are two models that can deal with both spatial and temporal effects simultaneously. However, relatively few existing DAUE studies have taken temporal dependence into account and applied this kind of model [66,67,68,69]. As extensions of GWR in the temporal dimension (Figure 15), GTWR and GTWLR have similar bandwidth selection-related limitations; moreover, with the temporal dimension considered, adequate panel datasets are required before these models can be applied. In addition, GTWR requires the analysed geographic entities of urban expansion to have varying spatial coordinates at different study phases; if this condition is not satisfied, the estimated results will be close to pooled OLS [66,70].
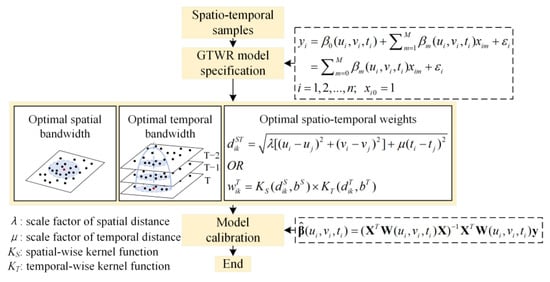
Figure 15.
Scheme of GTWR model [70,71].
3.3. Machine Learning-Based Models
In recent years, machine learning-based models have been widely applied in various fields for clustering, classification and regression. Among them, random forest (RF), a tree-based machine learning model (Figure 16), has been extensively employed in DAUE. This model can deal with driving factors with high dimension and multicollinearity while avoiding overfitting [72]. Unlike many other weakly interpretable machine learning models, such as the multilayer perceptron (MLP) and convolution neural network (CNN), RF is able to identify the importance of features by comparing the changes in out-of-bag errors after the features are disturbed [29], or the average changes in the Gini index following the splitting of feature nodes [73]. Moreover, the correlation pattern between each driving factor and urban expansion can be visualized in the form of partial dependency plots [74].
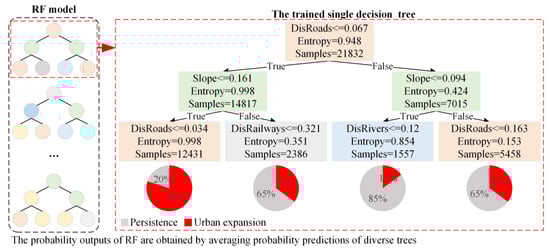
Figure 16.
An example of random forest algorithm.
Compared with regression models, RF can be applied to datasets with finer spatial resolution and more multidimensional driving factors, although it is still impacted by poorer interpretability. For example, for the above-mentioned regression models, the necessity of specific factors can be tested with reference to the statistical significance of coefficients; by contrast, RF can only provide a global ranking of the features’ importance, and cannot evaluate whether this factor is redundant for the whole model.
3.4. Brief Model Summary
Most of the above-mentioned traditional correlation analysis and regression models are mechanism-driven models with specific statistical assumptions; a few such assumptions are that the input features are linearly addictive to some extent, the residuals are drawn from white noise distribution, and the spatial effect is isotropic. Therefore, the observed data must be pre-processed (for example, through spatial resolution reduction) to fit the model-specific statistical assumption, which will inevitably lead to the loss of important information. Additionally, because of ideal assumptions, mechanism-driven models fail to capture latent relationships beyond imagination, such as high-order interaction between features, geometrically anisotropic relationships, and spatially varying driving relationships at finer resolutions.
On the other hand, most machine learning models can be categorized as data-driven models, and complex relations in driving factors can thus be automatically learned by these models. However, being constrained by interpretability, only RF among the existing machine learning models has been widely used in DAUE. However, since any linear relationship between input feature and the outcome has to be approximated by splits in trees [75], tree-based models may be weak when dealing with linear relationships. Besides, as a shallow learning model, RF is not able to extract high-level information (e.g., texture information) on driving factors.
In terms of the analysis of driving relationships or driving mechanisms, except for SEM, all the aforementioned models can only quantitatively measure the strength of driving effect, and the underlying driving mechanisms are usually obtained by supplemented qualitative analysis. Furthermore, although SEM can quantitatively analyse the assumed driving mechanism, this type of analysis model is commonly built on simple regression methods. Therefore, modelling the complex feedback mechanisms between urban expansion and multiple socio-environmental factors at fine spatial resolution are beyond the scope of all these models thus far. Here, we provide a theoretical description of these models and summarize their advantages and disadvantages in Table 4.
Table 4.
Characteristics of quantitative models employed in DAUE.
4. Discussion: Limitations and Future Research Directions
Through a holistic review of the development processes, hot themes and quantitative models employed in DAUE cases published between January 1961 to March 2023, this study found that the DAUE field in the past 40 years mainly had the following four limitations:
(1) The scales of study targets in existing DAUE researches have been expanded from single cities to entire countries, and the analysis granularity has been increasingly refined from city level to pixel/parcel level. However, the vertical and horizontal interactions among hierarchical urban systems have not been fully addressed.
(2) The research area of DAUE has gradually evolved into a stage of data-driven analysis; thus, various physical information has been extracted from abundant remote sensing data to improve DAUE research. However, the potential of these data has not been completely exploited, and the required fine-scale social factors cannot be adequately extracted only based on these data sources.
(3) Both mechanism-driven and data-driven models have been employed in research in DAUE. However, most of the employed models can only measure driving effects via processing shallow feature relationships, so that complex driving mechanisms with higher-level feature patterns (e.g., high-order interaction, feedback) are ignored.
(4) Both researchers in CA-based urban simulation and in the DAUE field have paid close attention to the solutions of sustainable urban development. Meanwhile, simulation models can play an important role in the development and testing of theories [76]. However, most research works in urban CA and DAUE are independent from each other, and integrations of both of them are seldom conducted.
These limitations and their corresponding solutions (i.e., future research directions) are presented in detail as follows.
4.1. The Complement of Multi-Scale Interaction Research on Hierarchical Urban Systems
Current study targets covered by the field of DAUE have expanded in scale from single cities to metropolitan areas to urban agglomerations and even to entire countries, while the analysis granularity has gradually shifted from cities to parcels and even pixels. However, due to the intrinsic hierarchy and complex interactions in urban systems, quantitative research in DAUE still suffers from twofold inadequacies.
First, few existing studies consider hierarchical interactions across different spatial levels. Geographical units at all administrative levels are interrelated as a nested system, in which a change in spatial pattern at one level is usually associated with combined impacts from the upper or lower levels. For example, the transformation of cultivated lands to residential areas is not only driven by the living convenience of surrounding functional zones such as shopping malls, but is also controlled by macro-scale governmental urban planning.
To date, several multi-scale analyses have been proposed to address interactions across different levels. For example, C. Li et al. [77] studied the driving effects of the same factors on the prefecture and county levels, respectively, finding that both similarities and differences between different urban levels could be observed. Since these multi-scale models usually operate on different spatial levels in parallel, attempts to find top-down synergistic driving mechanisms remained unsuccessful. In this regard, some researchers have also employed HLM to study the driving relationships across adjacent administrative levels, such as modelling the ancillary effect of provincial socioeconomic factors on prefectural urban expansion [43]. However, this type of hierarchical method focuses more on the macro-scale levels and thus cannot be directly extended to much finer levels (e.g., cadastral parcels).
To solve these problems, it is critical to explore a unifying analysis framework or hybrid coupling approach in order to capture the comprehensive characteristics of multi-scale DAUE, such as hierarchical interrelation and the scale dependency of driving effects. This will enable the drivers or constraints on specific urban levels to be efficiently determined, so that both macro- and micro-policies can be recommended together to regulate urban expansion.
Second, existing studies do not adequately represent the mutual interactions between cities in the context of urban agglomeration. With the continuous improvement of infrastructure networks, interactions caused by the flows of material, information and capital are an inherent aspect of the urban expansion process in urban agglomerations. The cities within these networks are closely connected, meaning that urban expansion in each city will be affected not only by local driving factors but also by distant factors (i.e., tele-driving factors).
Early DAUE studies usually treated cities in urban agglomerations as independent, and neglected the impacts of intensive interactions between them. Several theories were subsequently proposed to model this spatial interaction, including land teleconnection [78] and land telecoupling [79]. Li and Xiong [80] investigated the driving mechanisms of urban expansion in China, suggesting that local driving factors would have spill-over effects on neighbouring cities. Several other studies employed gravity-based models to measure the interrelationships between cities [81,82,83]. However, these theories or models cannot fully represent the complex interactions occurring in urban agglomeration because of their ideal prerequisite hypothesis and oversimplification of reality.
Therefore, to arrive at a more profound analysis of the driving effects and mechanisms underlying urban expansion, researchers need to treat urban agglomerations as dynamic interactive systems rather than isolated independent urban sets. When constructing driving factors in these areas, spatial interactions caused by regional factor mobility, the spatial spill-over effect, and the siphon effect should all be highlighted.
4.2. The Supplement of Remote Sensing-Derived Data and Assimilation of Multi-Source Spatiotemporal Big Data
Classic data sources in DAUE are statistical data from governments or questionnaire data obtained through public surveys; notably, in earlier studies, the poor acquisition efficiency and low spatiotemporal resolution of such data placed significant constraints on deeper analysis [84]. Thereafter, the application of remote sensing (RS) and GIS technology greatly improved the availability of high-resolution geographical data, enabling researchers to monitor spatiotemporal dynamics while delving into the driving analysis of urban expansion at multiple scales.
Nevertheless, in terms of the data obtained through remote sensing, most such data are 2D urban physical data (e.g., those pertaining to land use type, impervious surfaces, DEM, and waterbodies); accordingly, the potential of various RS data in DAUE has not been fully exploited, and additional data sources with greater diversity, accessibility, and completeness are also required. For example, the long-term height data of buildings will facilitate the identification and monitoring of urban regeneration, which can be derived from satellite-based photogrammetry [85] or Interferometric Synthetic Aperture Radar (InSAR) images [86]. Furthermore, night-time light (NTL) remote sensing data have been widely utilized to predict regional GDP and population distributions [87,88]; thus, efforts can also be made to derive more socio-economic indicators of this kind for adoption in DAUE. With the help of these RS data, it will be possible to conduct a more multi-dimensional assessment and analysis of urban expansion.
Meanwhile, with the development of information and communications technology, individuals have become ubiquitous social sensors that are constantly collecting data about modern society [89]. Thus, massive spatiotemporal big data are emerging from social sensing (e.g., mobile phone data, GPS trajectories, social media data, and other volunteered geographic information (VGI)) and can be assimilated into DAUE study [90,91]. Since these accumulated social sensing data accurately represent the daily activities of urban residents, they can be utilized to construct more diverse driving factors that reveal the interactions between regions or cities. For instance, through logistic data and online shopping data, the economic connections between cities and their spatiotemporal dynamics can be identified; with business data on mergers and acquisition, the capital flow and network structure within urban agglomeration can be determined [92]; by identifying the mobility and distribution patterns of intra-urban residents using social media data or trajectory data, long-term driving factors can be built to indicate neighbourhood isolation, social segregation, and urban vibrancy [93,94,95]. Therefore, assimilating more novel spatiotemporal data, with large samples and wide coverage, in support of DAUE study represents a promising research direction.
4.3. The Performance Improvement of Quantitative Models Based on Interpretable Machine Learning
Quantitative DAUE models have progressively evolved to keep up with researchers’ deepening perceptions of the dynamics of urban expansion over space and time. More specifically, a series of models have been proposed for spatial effects, including the geo-detector, SLM, SEM, and GWR, etc. Moreover, to characterize temporal correlation, some studies have employed fixed-effect or random-effect models, while GTWR was developed to capture both spatial and temporal effects.
As the diversity and volume of geo-referenced datasets have increased, the application of classic regression models has inevitably encountered some challenges. First of all, studies of micro-scale urban expansion will tend to suffer from sample imbalance, as most of the land use cells are unchanged. Moreover, the complicated relationships embedded in the process of urban expansion (such as the multicollinearity of factors, tele-coupling among cities, and mutual feedback between land use change and environmental factors) cannot be processed intelligently by classic regression models. In addition, large numbers of samples from richer data sources will cause further computational efficiency problems. For example, the computational intensity of spatial regression will increase exponentially with the amount of input data, as the dimension of a spatial adjacency matrix is equal to the sample count.
Current machine learning (ML) models, especially deep learning (DL) models, excel at processing high-dimensional samples, extracting high-level feature information and handling nonlinear laws. Moreover, a variety of ML-based models have been extensively applied in various fields, such as anomaly detection [96], computer vision [97], traffic prediction [98], satellite image classification [99], and land-use/land-cover (LULC) modelling [100]. Therefore, these powerful ML/DL models (e.g., CNN) could be employed in DAUE to address the aforementioned challenges. However, an obvious shortcoming is the generally low interpretability of ML/DL models, which will impede their application.
To date, the interpretability of machine learning has attracted widespread research interest, such that considerable advances in this area have already been achieved [101]. A series of intrinsically interpretable models (such as Bayesian networks that are integrated with causal inference) and post hoc explanation methods have been developed and successfully applied in many fields, including knowledge discovery, image classification, and clinical medicine [102,103,104]. Moreover, theory-coupled interpretable ML models are encouraged [105] and have already been preliminarily practiced [106]. Therefore, the combination of interpretable machine learning models with multi-source spatiotemporal big data for DAUE will not only broaden the horizon of research, but will also facilitate the transition of its study paradigm from mechanism-driven regression analysis to data-driven causality inference.
4.4. The Mutually Beneficial Integration of CA-Based Urban Expansion Simulation and DAUE
DAUE and CA-based urban simulation are two relatively independent branches in the domain of LULC research. DAUE study stresses the interpretability and reliability of the model outputs that quantify the driving relationships or mechanisms underlying urban expansion, while CA-based urban simulation focuses more on the predictability and prediction accuracy of urban land use change models. However, if the interpretability of driving relationships and mechanisms is ignored, the CA simulation results cannot provide scientific guidance for practical urban planning; moreover, the low accuracy of CA simulation models may imply that important factors affecting urban expansion have been neglected in the DAUE context. In essence, the research contents of CA-based simulation and quantitative DAUE overlap to a certain extent, indicating a strong tendency to interrelate. Therefore, efforts could be made to facilitate the coupling of CA-based urban simulation and DAUE in order to achieve complementarity.
DAUE-related research can gain helpful insights from CA-based urban simulation in several key ways. First, there exists CA-based urban simulation focusing on multi-scale urban expansion (e.g., [107]), which can provide a valuable reference for modelling hierarchically interrelated urban systems in the DAUE context. Additionally, studies of temporal dependency are inadequate in DAUE, while the ways in which temporally stationary driving factors explain urban expansion have been discussed at length through CA-based urban simulation [28]. Finally, interactions within neighbourhoods, an issue of concern in DAUE modelling, have long been probed in simulation fields. For example, CLUE is a type of LULC simulation model designed to capture the feedback between land use change and the relevant factors [108]; FLUS integrates the interactions and competition of different land use types driven by human and natural factors [109]. In turn, one future direction of CA-based urban simulation would be to achieve long-term, interpretable, and transferrable simulation of urban systems [110,111,112,113]. To accomplish this, a thorough and deep understanding of the driving mechanisms in the dynamic of urban expansion should be attained, primarily through DAUE. Detailed spatiotemporal patterns of driving factors identified through DAUE will provide CA-based urban simulation with sound reference to this research objective.
In short, DAUE can pave the way for more scientific and realistic urban simulation, while urban simulation will simultaneously deepen DAUE research and enable it to better serve urban land management. Therefore, it will be mutually beneficial to motivate the integration of DAUE and CA-based urban expansion simulation in order to develop a multi-scale, wide-range, and long-term urban simulation system, at the same time facilitating the integration of simulation modelling and causal explanations of the processes underlying urban land system.
5. Conclusions
Urban expansion is an important indicator of socioeconomic development in the progress of urbanization, and has accordingly attracted many researchers to carry out intensive studies on the driving analysis of urban expansion (DAUE). Based on DAUE case studies from the WOS Core Collection, we holistically analysed the development process and quantitative models of current DAUE research. In conclusion, the past half-century has witnessed an explosive growth in DAUE case studies. Benefiting from the abundance of finer spatial data and the innovation of quantitative models, research content has become increasingly diverse in terms of research scale, driving factors, and analysis perspectives. To encourage the furtherance of DAUE research, we map out the following future research directions:
(1) to pay attention to the hierarchical characteristics of urban systems and conduct multi-scale research on the complex interactions within them in order to capture more dynamic features;
(2) to leverage remote sensing data to obtain more urban expansion data and assimilate multi-source spatiotemporal big data to supplement novel socio-economic driving factors;
(3) to integrate with interpretable data-driven machine learning techniques in order to bolster the performance and reliability of DAUE models, as well as to favour data-driven causal inference;
(4) to couple with the field of urban simulation to achieve the complementary enhancement of model accuracy, interpretability and transferability, meanwhile facilitating model-driven theory development and testing.
Author Contributions
Conceptualization, Xuefeng Guan, Jingbo Li and Changlan Yang; methodology, Xuefeng Guan and Changlan Yang; software, Changlan Yang and Jingbo Li; validation, Xuefeng Guan, Jingbo Li and Changlan Yang; formal analysis, Xuefeng Guan, Jingbo Li and Changlan Yang; investigation, Xuefeng Guan, Jingbo Li and Changlan Yang; resources, Xuefeng Guan; data curation, Jingbo Li and Changlan Yang; writing—original draft preparation, Xuefeng Guan, Jingbo Li and Changlan Yang; writing—review and editing, Xuefeng Guan, Jingbo Li, Changlan Yang and Weiran Xing; visualization, Jingbo Li and Changlan Yang; supervision, Xuefeng Guan; project administration, Xuefeng Guan; funding acquisition, Xuefeng Guan. All authors have read and agreed to the published version of the manuscript.
Funding
This work has been supported by the National Natural Science Foundation of China program (grant number: 41971348) and Hubei Luojia Laboratory (Grant No. 220100010).
Informed Consent Statement
Informed consent was obtained from all subjects involved in the study.
Data Availability Statement
The data that support the findings of this study is available from the corresponding author [C.L. Yang], upon reasonable request.
Conflicts of Interest
The authors declare no conflict of interest.
Appendix A. Data Collection
As Figure A1 shows, the data used in this review are collected from the WOS CC, which consists of publications from SCIE, SSCI, A&HCI, ESCI, CPCI, etc. Two groups of search terms related to DAUE, namely “urban expansion” and “driving mechanism analysis”, are first selected (see Table A1); these two groups of terms should be simultaneously contained in either the title or keywords of the target publications. The publication language is limited to English and the publication type is set to “Article”. Only case studies of DAUE are included. Ultimately, a total of 379 publications from 1990 to 2023 were retrieved in March 2023. To ensure the completeness of the database, we further scanned the references of these 379 papers and extracted another 22 case studies. Thus, the final database includes a total of 399 records, the earliest in which was published in 1961 [20]. Finally, these records were exported for subsequent bibliometric analysis and detailed review.
Table A1.
Two groups of terms used in search of DAUE publications.
Table A1.
Two groups of terms used in search of DAUE publications.
| Term Indicates “Urban Expansion” | Term Indicates “Driving Mechanism Analysis” |
|---|---|
| Urban expansion | Driver |
| Urban extension | Driving force/factor |
| Urban growth | Influencing factor |
| Urban land growth | Determinant |
| Urban sprawl | Factor |
| Land expansion | Cause |
| Built-up expansion | Causal |
| Land take | Mechanism |
| Land development | |
| Urban land change |

Figure A1.
Flowchart of data collection and systematic review.
Figure A1.
Flowchart of data collection and systematic review.

Appendix B. Research Methods
Bibliometric analysis has been widely used to explore and analyse research records in various scientific fields [114]. In bibliometric analysis, selected publications from a given domain can be dynamically organized into a network structure based on the co-occurrence relationships between keywords (co-words), authors (co-authorship), cited documents (co-citations), and so on. Taking a small part of one co-authorship network as an example (Figure A2), it can be observed that nodes and links in the network, respectively, represent authors and the cooperation relationships between authors. The node size is proportional to the publication count of the corresponding author, while the node colour illustrates the time slice of the author’s publications. The link thickness indicates the strength of cooperation between two authors.
After network-building is complete, complex network theories can be further employed to identify patterns and evolutionary trends from the structure and dynamics of the built network, such as the betweenness centrality score of nodes. Betweenness centrality is used to measure the importance or influence of nodes in the co-occurrence network, which is represented by the violet outer ring around a node (as in Figure A2). A thicker violet ring indicates a higher betweenness centrality, i.e., a more influential node. For example, Figure A2 shows that “Peilei Fan” is the pivot person in this co-authorship network.

Figure A2.
An example of co-authorship analysis results.
Figure A2.
An example of co-authorship analysis results.

The burst detection algorithm proposed by Kleinberg [115] can detect significant changes in the frequency of keywords or terms over a short period of time. A detected burst term has two features: burst strength and burst duration. High burst strength indicates a remarkable aggregation of research interest in the detected terms. Moreover, burst duration is defined with reference to the beginning and ending year of the burst state, as shown in Figure A3. The application of burst detection can reveal the explosion, evolution, and decline of the concern for research themes and accordingly facilitate the identification of research fronts in an academic field.

Figure A3.
Burst detection of the research theme “GIS”, for which the burst state extended from 2005 to 2013.
Figure A3.
Burst detection of the research theme “GIS”, for which the burst state extended from 2005 to 2013.

References
- Ritchie, H.; Roser, M. Urbanization. 2018. Available online: https://ourworldindata.org/urbanization (accessed on 16 May 2022).
- Deng, Y.; Fu, B.; Sun, C. Effects of urban planning in guiding urban growth: Evidence from Shenzhen, China. Cities 2018, 83, 118–128. [Google Scholar] [CrossRef]
- Li, G.; Li, F. Urban sprawl in China: Differences and socioeconomic drivers. Sci. Total Environ. 2019, 673, 367–377. [Google Scholar] [CrossRef] [PubMed]
- Fan, P.; Yue, W.; Zhang, J.; Huang, H.; Messina, J.; Verburg, P.H.; Qi, J.; Moore, N.; Ge, J. The spatial restructuring and determinants of industrial landscape in a mega city under rapid urbanization. Habitat Int. 2020, 95, 102099. [Google Scholar] [CrossRef]
- Pierri Daunt, A.B.; Sanna Freire Silva, T.; Bürgi, M.; Hersperger, A.M. Urban expansion and forest reserves: Drivers of change and persistence on the coast of São Paulo State (Brazil). Land Use Policy 2021, 101, 105189. [Google Scholar] [CrossRef]
- Park, H.; Fan, P.; John, R.; Chen, J. Urbanization on the Mongolian Plateau after economic reform: Changes and causes. Appl. Geogr. 2017, 86, 118–127. [Google Scholar] [CrossRef]
- Li, G.; Sun, S.; Fang, C. The varying driving forces of urban expansion in China: Insights from a spatial-temporal analysis. Landsc. Urban Plan. 2018, 174, 63–77. [Google Scholar] [CrossRef]
- Liang, X.; Guan, Q.; Clarke, K.C.; Liu, S.; Wang, B.; Yao, Y. Understanding the drivers of sustainable land expansion using a patch-generating land use simulation (PLUS) model: A case study in Wuhan, China. Comput. Environ. Urban Syst. 2021, 85, 101569. [Google Scholar] [CrossRef]
- Lambin, E.F.; Geist, H.J.; Lepers, E. Dynamics of land-use and land-cover change in tropical regions. Annu. Rev. Environ. Resour. 2003, 28, 205–241. [Google Scholar] [CrossRef]
- Van Vliet, J.; Magliocca, N.R.; Büchner, B.; Cook, E.; Rey Benayas, J.M.; Ellis, E.C.; Heinimann, A.; Keys, E.; Lee, T.M.; Liu, J.; et al. Meta-studies in land use science: Current coverage and prospects. Ambio 2016, 45, 15–28. [Google Scholar] [CrossRef]
- Shaw, B.J.; van Vliet, J.; Verburg, P.H. The peri-urbanization of Europe: A systematic review of a multifaceted process. Landsc. Urban Plan. 2020, 196, 103733. [Google Scholar] [CrossRef]
- Wahyudi, A.; Liu, Y. Cellular automata for urban growth modelling: A review on factors defining transition rules. Int. Rev. Spat. Plan. Sustain. Dev. 2016, 4, 60–75. [Google Scholar] [CrossRef]
- Hersperger, A.M.; Oliveira, E.; Pagliarin, S.; Palka, G.; Verburg, P.; Bolliger, J.; Grădinaru, S. Urban land-use change: The role of strategic spatial planning. Glob. Environ. Change 2018, 51, 32–42. [Google Scholar] [CrossRef]
- Kim YNewman, G.; Güneralp, B. A review of driving factors, scenarios, and topics in urban land change models. Land 2020, 9, 246. [Google Scholar]
- Dadashpoor, H.; Ahani, S. Explaining Objective Forces, Driving Forces, and Causal Mechanisms Affecting the Formation and Expansion of the Peri-Urban Areas: A Critical Realism Approach. Land Use Policy 2021, 102, 105232. [Google Scholar] [CrossRef]
- Colsaet, A.; Laurans, Y.; Levrel, H. What drives land take and urban land expansion? A systematic review. Land Use Policy 2018, 79, 339–349. [Google Scholar] [CrossRef]
- Kasraian, D.; Maat, K.; Stead, D.; van Wee, B. Long-term impacts of transport infrastructure networks on land-use change: An international review of empirical studies. Transp. Rev. 2016, 36, 772–792. [Google Scholar] [CrossRef]
- Seto, K.C.; Sánchez-Rodríguez, R.; Fragkias, M. The new geography of contemporary urbanization and the environment. Annu. Rev. Environ. Resour. 2010, 35, 167–194. [Google Scholar] [CrossRef]
- Seto, K.C.; Fragkias, M.; Güneralp, B.; Reilly, M.K. A meta-analysis of global urban land expansion. PLoS ONE 2011, 6, e23777. [Google Scholar] [CrossRef]
- Muth, R.F. Economic Change and Rural-Urban Land Conversions. Econometrica 1961, 29, 1. [Google Scholar] [CrossRef]
- Zhang, L.; Yue, W.; Liu, Y.; Fan, P.; Wei, Y.D. Suburban industrial land development in transitional China: Spatial restructuring and determinants. Cities 2018, 78, 96–107. [Google Scholar] [CrossRef]
- Harvey, R.O.; Clark, W.A.V. The Nature and Economics of Urban Sprawl. Land Econ. 1965, 41, 1. [Google Scholar] [CrossRef]
- Brueckner, J.K. Urban sprawl: Diagnosis and remedies. Int. Reg. Sci. Rev. 2000, 23, 160–171. [Google Scholar] [CrossRef]
- Tang, W.; Zhou, T.; Sun, J.; Li, Y.; Li, W. Accelerated urban expansion in Lhasa City and the implications for sustainable development in a Plateau City. Sustainability 2017, 9, 1499. [Google Scholar] [CrossRef]
- Cao, Y.; Bai, Z.; Zhou, W.; Zhang, X. Analyses of traits and driving forces on urban land expansion in a typical coal-resource-based city in a loess area. Environ. Earth Sci. 2016, 75, 1191. [Google Scholar] [CrossRef]
- Chen, Y.; Li, X.; Liu, X.; Ai, B.; Li, S. Capturing the varying effects of driving forces over time for the simulation of urban growth by using survival analysis and cellular automata. Landsc. Urban Plan. 2016, 152, 59–71. [Google Scholar] [CrossRef]
- Feng, Y.; Tong, X. Using exploratory regression to identify optimal driving factors for cellular automaton modeling of land use change. Environ. Monit. Assess. 2017, 189, 515. [Google Scholar] [CrossRef] [PubMed]
- Feng, Y.J.; Wang, R.; Tong, X.; Shafizadeh-Moghadam, H. How much can temporally stationary factors explain cellular automata-based simulations of past and future urban growth? Comput. Environ. Urban Syst. 2019, 76, 150–162. [Google Scholar] [CrossRef]
- Zhang, D.; Liu, X.; Wu, X.; Yao, Y.; Wu, X.; Chen, Y. Multiple intra-urban land use simulations and driving factors analysis: A case study in Huicheng, China. GISci. Remote Sens. 2019, 56, 282–308. [Google Scholar] [CrossRef]
- Kuang, W.; Chi, W.; Lu, D.; Dou, Y. A comparative analysis of megacity expansions in China and the U.S.: Patterns, rates and driving forces. Landsc. Urban Plan. 2014, 132, 121–135. [Google Scholar] [CrossRef]
- Subasinghe, S.; Estoque, R.C.; Murayama, Y. Spatiotemporal analysis of urban growth using GIS and remote sensing: A case study of the Colombo metropolitan area, Sri Lanka. ISPRS Int. J. Geo-Inf. 2016, 5, 197. [Google Scholar] [CrossRef]
- Lu, D.; Li, L.; Li, G.; Fan, P.; Ouyang, Z.; Moran, E. Examining spatial patterns of urban distribution and impacts of physical conditions on urbanization in coastal and inland metropoles. Remote Sens. 2018, 10, 1101. [Google Scholar] [CrossRef]
- Ye, Y.; Zhang, H.; Liu, K.; Wu, Q. Research on the influence of site factors on the expansion of construction land in the Pearl River Delta, China: By using GIS and remote sensing. Int. J. Appl. Earth Obs. Geoinf. 2013, 21, 366–373. [Google Scholar] [CrossRef]
- Kasraian, D.; Raghav, S.; Miller, E.J. A multi-decade longitudinal analysis of transportation and land use co-evolution in the Greater Toronto-Hamilton Area. J. Transp. Geogr. 2020, 84, 102696. [Google Scholar] [CrossRef]
- Lei, H.; Koch, J.; Shi, H. An analysis of spatio-temporal urbanization patterns in Northwest China. Land 2020, 9, 411. [Google Scholar] [CrossRef]
- Deng, Y.; Srinivasan, S. Urban land use change and regional access: A case study in Beijing, China. Habitat Int. 2016, 51, 103–113. [Google Scholar] [CrossRef]
- Azhdari, A.; Sasani, M.A.; Soltani, A. Exploring the relationship between spatial driving forces of urban expansion and socioeconomic segregation: The case of Shiraz. Habitat Int. 2018, 81, 33–44. [Google Scholar] [CrossRef]
- Arellano, M. Panel Data Econometrics; OUP Oxford: Oxford, UK, 2003. [Google Scholar]
- Baltagi, B.H. Econometric Analysis of Panel Data, 6th ed.; John Wiley & Sons: Chichester, UK, 2008. [Google Scholar]
- Oueslati, W.; Alvanides, S.; Garrod, G. Determinants of urban sprawl in European cities. Urban Stud. 2015, 52, 1594–1614. [Google Scholar] [CrossRef]
- Chen, J.; Gao, J.; Chen, W. Urban land expansion and the transitional mechanisms in Nanjing, China. Habitat Int. 2016, 53, 274–283. [Google Scholar] [CrossRef]
- Jiang, L.; Deng, X.; Seto, K.C. Multi-level modeling of urban expansion and cultivated land conversion for urban hotspot counties in China. Landsc. Urban Plan. 2012, 108, 131–139. [Google Scholar] [CrossRef]
- Liao, C.; Dai, T.; Cai, H.; Zhang, W. Examining the driving factors causing rapid urban expansion in China: An analysis based on GlobeLand30 data. ISPRS Int. J. Geo-Inf. 2017, 6, 264. [Google Scholar] [CrossRef]
- Meyfroidt, P. Approaches and terminology for causal analysis in land systems science. J. Land Use Sci. 2016, 11, 501–522. [Google Scholar] [CrossRef]
- Thomas, H. Coming of age. In Chemical Engineer; Guilford Publications: New York, NY, USA, 2008; pp. 38–40. [Google Scholar]
- He, C.; Huang, Z.; Wang, R. Land use change and economic growth in urban China: A structural equation analysis. Urban Stud. 2014, 51, 2880–2898. [Google Scholar] [CrossRef]
- Wang, C.; Liu, H.; Zhang, M. Exploring the mechanism of border effect on urban land expansion: A case study of Beijing-Tianjin-Hebei region in China. Land Use Policy 2020, 92, 104424. [Google Scholar] [CrossRef]
- Zhou, D.; Zhang, L.; Wang, R. Administrative-Hierarchical Urban Land Expansion in China: Urban Agglomeration in the Yangtze River Delta. J. Urban Plan. Dev. 2018, 144, 05018018. [Google Scholar] [CrossRef]
- Deng, T.; Wang, D.; Hu, Y.; Liu, S. Did high-speed railway cause urban space expansion?—Empirical evidence from China’s prefecture-level cities. Res. Transp. Econ. 2020, 80, 100840. [Google Scholar] [CrossRef]
- Zhang, H.; Li, X.; Liu, X.; Chen, Y.; Ou, J.; Niu, N.; Jin, Y.; Shi, H. Will the Development of a High-Speed Railway Have Impacts on Land Use Patterns in China? Ann. Am. Assoc. Geogr. 2019, 109, 979–1005. [Google Scholar] [CrossRef] [PubMed]
- Angrist, J.D.; Pischke, J.-S. Parallel Worlds: Fixed Effects, Differences-in-differences, and Panel Data. In Mostly Harmless Econometrics: An Empiricist’s Companion; Princeton University Press: Princeton, NJ, USA, 2008; pp. 165–184. [Google Scholar]
- Wang, J.; Xu, C. Geodetector: Principle and prospective. Acta Geogr. Sin. 2017, 72, 116–134. [Google Scholar]
- Zhou, T.; Jiang, G.; Zhang, R.; Zheng, Q.; Ma, W.; Zhao, Q.; Li, Y. Addressing the rural in situ urbanization (RISU) in the Beijing–Tianjin–Hebei region: Spatio-temporal pattern and driving mechanism. Cities 2018, 75, 59–71. [Google Scholar] [CrossRef]
- Liu, Y.; Cao, X.; Li, T. Identifying driving forces of built-up land expansion based on the geographical detector: A case study of pearl river delta urban agglomeration. Int. J. Environ. Res. Public Health 2020, 17, 1759. [Google Scholar] [CrossRef] [PubMed]
- Yan, Y.; Ju, H.; Zhang, S.; Jiang, W. Spatiotemporal patterns and driving forces of urban expansion in coastal areas: A study on urban agglomeration in the pearl river delta, China. Sustainability 2020, 12, 191. [Google Scholar] [CrossRef]
- Zhang, J.; Yu, L.; Li, X.; Zhang, C.; Shi, T.; Wu, X.; Yang, C.; Gao, W.; Li, Q.; Wu, G. Exploring annual urban expansions in the Guangdong-Hong Kong-Macau Greater Bay Area: Spatiotemporal features and driving factors in 1986–2017. Remote Sens. 2020, 12, 2615. [Google Scholar] [CrossRef]
- Deng, X.; Huang, J.; Rozelle, S.; Uchida, E. Economic growth and the expansion of urban land in China. Urban Stud. 2010, 47, 813–843. [Google Scholar] [CrossRef]
- Feng, Y.C.; Wang, X.; Du, W.; Liu, J.; Li, Y. Spatiotemporal characteristics and driving forces of urban sprawl in China during 2003–2017. J. Clean. Prod. 2019, 241, 118061. [Google Scholar] [CrossRef]
- Gómez-Antonio, M.; Hortas-Rico, M.; Li, L. The Causes of Urban Sprawl in Spanish Urban Areas: A Spatial Approach. Spat. Econ. Anal. 2016, 11, 219–247. [Google Scholar] [CrossRef]
- Li, H.; Wei, Y.H.D.; Huang, Z. Urban land expansion and spatial dynamics in Globalizing Shanghai. Sustainability 2014, 6, 8856–8875. [Google Scholar] [CrossRef]
- Li, H.; Wei, Y.D.; Liao, F.H.; Huang, Z. Administrative hierarchy and urban land expansion in transitional China. Appl. Geogr. 2015, 56, 177–186. [Google Scholar] [CrossRef]
- Tobler, W.R. A Computer Movie Simulating Urban Growth in the Detroit Region. Econ. Geogr. 1970, 46 (Suppl. S1), 234. [Google Scholar] [CrossRef]
- Luo, J.; Wei, Y.H.D. Modeling spatial variations of urban growth patterns in Chinese cities: The case of Nanjing. Landsc. Urban Plan. 2009, 91, 51–64. [Google Scholar] [CrossRef]
- Jing, S.; Yan, Y.; Niu, F.; Song, W. Urban Expansion in China: Spatiotemporal Dynamics and Determinants. Land 2022, 11, 356. [Google Scholar] [CrossRef]
- Liao, F.H.F.; Wei, Y.H.D. Modeling determinants of urban growth in Dongguan, China: A spatial logistic approach. Stoch. Environ. Res. Risk Assess. 2014, 28, 801–816. [Google Scholar] [CrossRef]
- Wang, H.; Zhang, B.; Liu, Y.; Liu, Y.; Xu, S.; Zhao, Y.; Chen, Y.; Hong, S. Urban expansion patterns and their driving forces based on the center of gravity-GTWR model: A case study of the Beijing-Tianjin-Hebei urban agglomeration. J. Geogr. Sci. 2020, 30, 297–318. [Google Scholar] [CrossRef]
- Wrenn, D.H.; Sam, A.G. Geographically and temporally weighted likelihood regression: Exploring the spatiotemporal determinants of land use change. Reg. Sci. Urban Econ. 2014, 44, 60–74. [Google Scholar] [CrossRef]
- Gao, C.; Feng, Y.; Tong, X.; Lei, Z.; Chen, S.; Zhai, S. Modeling urban growth using spatially heterogeneous cellular automata models: Comparison of spatial lag, spatial error and GWR. Comput. Environ. Urban Syst. 2020, 81, 101459. [Google Scholar] [CrossRef]
- Wu, R.; Li, Z.G.; Wang, S.J. The varying driving forces of urban land expansion in China: Insights from a spatial-temporal analysis. Sci. Total Environ. 2021, 766, 142591. [Google Scholar] [CrossRef]
- Huang, B.; Wu, B.; Barry, M. Geographically and temporally weighted regression for modeling spatio-temporal variation in house prices. Int. J. Geogr. Inf. Sci. 2010, 24, 383–401. [Google Scholar] [CrossRef]
- Fotheringham, A.S.; Crespo, R.; Yao, J. Geographical and Temporal Weighted Regression (GTWR). Geogr. Anal. 2015, 47, 431–452. [Google Scholar] [CrossRef]
- Belgiu, M.; Drăgu, L. Random forest in remote sensing: A review of applications and future directions. ISPRS J. Photogramm. Remote Sens. 2016, 114, 24–31. [Google Scholar] [CrossRef]
- Huang, L.; Shahtahmassebi, A.R.; Gan, M.; Deng, J.; Wang, J.; Wang, K. Characterizing spatial patterns and driving forces of expansion and regeneration of industrial regions in the Hangzhou megacity, China. J. Clean. Prod. 2020, 253, 119959. [Google Scholar] [CrossRef]
- You, H.; Yang, X. Urban expansion in 30 megacities of China: Categorizing the driving force profiles to inform the urbanization policy. Land Use Policy 2017, 68, 531–551. [Google Scholar] [CrossRef]
- Molnar, C. Interpretable Machine Learning. 2023. Available online: https://christophm.github.io/interpretable-ml-book/ (accessed on 8 April 2023).
- Meyfroidt, P.; Chowdhury, R.R.; de Bremond, A.; Ellis, E.C.; Erb, K.-H.; Filatova, T.; Garrett, R.D.; Grove, J.M.; Heinimann, A.; Kuemmerle, T.; et al. Middle-range theories of land system change. Glob. Environ. Change 2018, 53, 52–67. [Google Scholar] [CrossRef]
- Li, C.; Li, J.; Wu, J. What drives urban growth in China? A multi-scale comparative analysis. Appl. Geogr. 2018, 98, 43–51. [Google Scholar] [CrossRef]
- Seto, K.C.; Reenberg, A.; Boone, C.G.; Fragkias, M.; Haase, D.; Langanke, T.; Marcotullio, P.; Munroe, D.K.; Olah, B.; Simon, D. Urban land teleconnections and sustainability. Proc. Natl. Acad. Sci. USA 2012, 109, 7687–7692. [Google Scholar] [CrossRef]
- Liu, J.; Hull, V.; Moran, E.; Nagendra, H.; Swaffield, S.R.; Turner, B.L. Applications of the telecoupling framework to land-change science. Rethink. Glob. Land Use Urban Era 2014, 14, 119–140. [Google Scholar]
- Li, Y.; Xiong, W. A spatial panel data analysis of China’s urban land expansion, 2004–2014. Pap. Reg. Sci. 2019, 98, 393–407. [Google Scholar] [CrossRef]
- Chen, B.; Wu, C.; Huang, X.; Yang, X. Examining the relationship between urban land expansion and economic linkage using coupling analysis: A case study of the Yangtze River Economic Belt, China. Sustainability 2020, 12, 1227. [Google Scholar] [CrossRef]
- Tan, R.; Zhou, K.; He, Q.; Xu, H. Analyzing the effects of spatial interaction among city clusters on urban growth-case of Wuhan Urban agglomeration. Sustainability 2016, 8, 759. [Google Scholar] [CrossRef]
- Wu, C.; Huang, X.; Chen, B. Telecoupling mechanism of urban land expansion based on transportation accessibility: A case study of transitional Yangtze River economic Belt, China. Land Use Policy 2020, 96, 104687. [Google Scholar] [CrossRef]
- Weiss, S.F.; Kaiser, E.J. A Quantitative Evaluation of Major Factors Influencing Urban Land Development in a Regional Cluster. Traffic Q. 1968, 22, 109–115. [Google Scholar]
- Mathews, A.J.; Frazier, A.E.; Nghiem, S.V.; Neumann, G.; Zhao, Y. Satellite scatterometer estimation of urban built-up volume: Validation with airborne lidar data. Int. J. Appl. Earth Obs. Geoinf. 2019, 77, 100–107. [Google Scholar] [CrossRef]
- Li, M.; Koks, E.; Taubenböck, H.; van Vliet, J. Continental-scale mapping and analysis of 3D building structure. Remote Sens. Environ. 2020, 245, 111859. [Google Scholar] [CrossRef]
- Shi, K.; Yu, B.; Huang, Y.; Hu, Y.; Yin, B.; Chen, Z.; Chen, L.; Wu, J. Evaluating the Ability of NPP-VIIRS Nighttime Light Data to Estimate the Gross Domestic Product and the Electric Power Consumption of China at Multiple Scales: A Comparison with DMSP-OLS Data. Remote Sens. 2014, 6, 1705–1724. [Google Scholar] [CrossRef]
- Stevens, F.R.; Gaughan, A.E.; Linard, C.; Tatem, A.J. Disaggregating census data for population mapping using Random forests with remotely-sensed and ancillary data. PLoS ONE 2015, 10, e0107042. [Google Scholar] [CrossRef]
- Liu, Y.; Liu, X.; Gao, S.; Gong, L.; Kang, C.; Zhi, Y. Social Sensing: A New Approach to Understanding Our Socioeconomic Environments. Ann. Assoc. Am. Geogr. 2015, 105, 512–530. [Google Scholar] [CrossRef]
- Goodchild, M.F. Citizens as sensors: The world of volunteered geography. GeoJournal 2007, 69, 211–221. [Google Scholar] [CrossRef]
- Tu, W.; Cao, J.; Gao, Q.; Cao, R.; Fang, Z.; Yue, Y.; Li, Q. Sensing Urban Dynamics by Fusing Multi-sourced Spatiotemporal Big Data. Wuhan Daxue Xuebao (Xinxi Kexue Ban)/Geomat. Inf. Sci. Wuhan Univ. 2020, 45, 1875–1883. [Google Scholar]
- Shi, S.; Wong, S.K.; Zheng, C. Network capital and urban development: An inter-urban capital flow network analysis. Reg. Stud. 2022, 56, 406–419. [Google Scholar] [CrossRef]
- Wang, Q.; Phillips, N.E.; Small, M.L.; Sampson, R.J. Urban mobility and neighborhood isolation in America’s 50 largest cities. Proc. Natl. Acad. Sci. USA 2018, 115, 7735–7740. [Google Scholar] [CrossRef]
- Chen, L.; Zhao, L.; Xiao, Y.; Lu, Y. Investigating the spatiotemporal pattern between the built environment and urban vibrancy using big data in Shenzhen, China. Comput. Environ. Urban Syst. 2022, 95, 101827. [Google Scholar] [CrossRef]
- Li, X.; Huang, X.; Li, D.; Xu, Y. Aggravated social segregation during the COVID-19 pandemic: Evidence from crowdsourced mobility data in twelve most populated U.S. metropolitan areas. Sustain. Cities Soc. 2022, 81, 103869. [Google Scholar] [CrossRef] [PubMed]
- Muneer, A.; Mohd Taib, S.; Mohamed Fati, S.O.; Balogun, A.; Abdul Aziz, I. A Hybrid Deep Learning-Based Unsupervised Anomaly Detection in High Dimensional Data. Comput. Mater. Contin. 2022, 70, 5363–5381. [Google Scholar] [CrossRef]
- Georgiou, T.; Liu, Y.; Chen, W.; Lew, M. A survey of traditional and deep learning-based feature descriptors for high dimensional data in computer vision. Int. J. Multimed. Inf. Retr. 2020, 9, 135–170. [Google Scholar] [CrossRef]
- Yao, H.; Tang, X.; Wei, H.; Zheng, G.; Li, Z. Revisiting spatial-temporal similarity: A deep learning framework for traffic prediction. Proc. AAAI Conf. Artif. Intell. 2019, 33, 5668–5675. [Google Scholar] [CrossRef]
- Ma, L.; Liu, Y.; Zhang, X.; Ye, Y.; Yin, G.; Johnson, B.A. Deep learning in remote sensing applications: A meta-analysis and review. ISPRS J. Photogramm. Remote Sens. 2019, 152, 166–177. [Google Scholar] [CrossRef]
- Wang, J.; Bretz, M.; Dewan, M.A.A.; Delavar, M.A. Machine learning in modelling land-use and land cover-change (LULCC): Current status, challenges and prospects. Sci. Total Environ. 2022, 822, 153559. [Google Scholar] [CrossRef]
- Molnar, C.; Casalicchio, G.; Bischl, B. Interpretable Machine Learning—A Brief History, State-of-the-Art and Challenges. Commun. Comput. Inf. Sci. 2020, 1323, 417–431. [Google Scholar]
- Du, M.; Liu, N.; Hu, X. Techniques for interpretable machine learning. Commun. ACM 2020, 63, 68–77. [Google Scholar] [CrossRef]
- Samek, W.; Montavon, G.; Lapuschkin, S.; Anders, C.J.; Müller, K.R. Explaining Deep Neural Networks and Beyond: A Review of Methods and Applications. Proc. IEEE 2021, 109, 247–278. [Google Scholar] [CrossRef]
- Scholkopf, B.; Locatello, F.; Bauer, S.; Ke, N.R.; Kalchbrenner, N.; Goyal, A.; Bengio, Y. Toward Causal Representation Learning. Proc. IEEE 2021, 109, 612–634. [Google Scholar] [CrossRef]
- Reichstein, M.; Camps-Valls, G.; Stevens, B.; Jung, M.; Denzler, J.; Carvalhais, N.; Prabhat. Deep learning and process understanding for data-driven Earth system science. Nature 2019, 566, 195–204. [Google Scholar] [CrossRef]
- Li, F.; Zhu, Q.; Riley, W.J.; Zhao, L.; Xu, L.; Yuan, K.; Chen, M.; Wu, H.; Gui, Z.; Gong, J.; et al. AttentionFire_v1.0: Interpretable machine learning fire model for burned-Area predictions over tropics. Geosci. Model Dev. 2023, 16, 869–884. [Google Scholar] [CrossRef]
- Shu, B.; Zhu, S.; Qu, Y.; Zhang, H.; Li, X.; Carsjens, G.J. Modelling multi-regional urban growth with multilevel logistic cellular automata. Comput. Environ. Urban Syst. 2020, 80, 101457. [Google Scholar] [CrossRef]
- Veldkamp, A.; Fresco, L.O. CLUE: A conceptual model to study the conversion of land use and its effects. Ecol. Model. 1996, 85, 253–270. [Google Scholar] [CrossRef]
- Liu, X.; Liang, X.; Li, X.; Xu, X.; Ou, J.; Chen, Y.; Li, S.; Wang, S.; Pei, F. A future land use simulation model (FLUS) for simulating multiple land use scenarios by coupling human and natural effects. Landsc. Urban Plan. 2017, 168, 94–116. [Google Scholar] [CrossRef]
- Clarke, K.C.; Gaydos, L.J. ; Gaydos, L.J. Loose-coupling a cellular automaton model and GIS: Long-term urban growth prediction for San Francisco and Washington/Baltimore. Int. J. Geogr. Inf. Sci. 1998, 12, 699–714. [Google Scholar] [CrossRef]
- Li, S.; Liu, X.; Li, X.; Chen, Y. Simulation model of land use dynamics and application: Progress and prospects. Yaogan Xuebao/J. Remote Sens. 2017, 21, 329–340. [Google Scholar]
- Chen, Y.; Li, X. Applications and New Trends of Machine Learning in Urban Simulation Research. Geomat. Inf. Sci. Wuhan Univ. 2020, 45, 1884–1889. [Google Scholar]
- Xing, W.; Qian, Y.; Guan, X.; Yang, T.; Wu, H. A novel cellular automata model integrated with deep learning for dynamic spatio-temporal land use change simulation. Comput. Geosci. 2020, 137, 104430. [Google Scholar] [CrossRef]
- Chen, C. Science Mapping: A Systematic Review of the Literature. J. Data Inf. Sci. 2017, 2, 1–40. [Google Scholar] [CrossRef]
- Kleinberg, J. Bursty and hierarchical structure in streams. Data Min. Knowl. Discov. 2003, 7, 373–397. [Google Scholar] [CrossRef]


Disclaimer/Publisher’s Note: The statements, opinions and data contained in all publications are solely those of the individual author(s) and contributor(s) and not of MDPI and/or the editor(s). MDPI and/or the editor(s) disclaim responsibility for any injury to people or property resulting from any ideas, methods, instructions or products referred to in the content. |
© 2023 by the authors. Licensee MDPI, Basel, Switzerland. This article is an open access article distributed under the terms and conditions of the Creative Commons Attribution (CC BY) license (https://creativecommons.org/licenses/by/4.0/).