Abstract
Serving as a crucial part of the Yangtze River Basin (YRB)’s flood control system, Flood Detention Areas (FDAs) are vital in mitigating large-scale floods. Urbanization has led to the development of urban FDAs, but significant losses could ensue if these FDAs are activated. With improved reservoirs and embankments, flood pressure in the middle reaches has lessened, posing challenges in balancing flood control and economic benefits. This paper presents a comparative analysis of land use, GDP, and population in FDAs and adjacent cities, enhancing our understanding of their disparities and interrelations. Using the Analytic Hierarchy Process (AHP)–Entropy Weight Method (EW)–Technique for Order of Preference by Similarity to Ideal Solution (TOPSIS) comprehensive evaluation method, we assess changes in flood control and economic values in FDAs. The results show a conflict between flood control and economic policies in FDAs, highlighting their underestimated economic potential, especially in urban areas. This study identifies differences in economic development across FDAs and a strong correlation between flood control value and inundation rates. Based on evaluations and simulations of the 1954 flood, we provide recommendations for the FDAs’ construction plan, which serves the development and flood management of the YRB and offer insights for similar assessments elsewhere.
1. Introduction
As important flood-control facilities, Flood Detention Areas (FDAs) have been widely applied in flood-prone regions within various major river basins [1,2,3]. When floods surpass the storage and discharge capacity of rivers, these FDAs can take on a certain amount of floodwater, thus reducing the risk of dike breaches and potential flood losses within the basin [4]. In China, given its large population, many FDAs are densely populated. Some of these areas are located near cities and serve as important spaces for urban expansion. Using these FDAs for flood control could result in significant losses [5]. Taking the example of the Dongxihu FDA in Wuhan, if it were to be activated for flood storage, the estimated economic loss would be approximately CNY 39 billion (calculated based on the economic development level in 2011) [6]. As the economy continues to grow, the activation losses of FDAs are progressively increasing year by year.
However, in the context of climate change, the risk of flooding continues to escalate. Despite the implementation of a series of flood-control projects, flood disasters are still occurring [7]. To mitigate the risk of flooding, FDAs remain essential. Consequently, under the current circumstances, striking a balance between flood control benefits and economic benefits within FDAs and seeking a more scientific development strategy for these areas is one of the critical issues in basin development and flood management [1]. It is important to emphasize that this allows for the rational use of the FDAs to support regional sustainable development [8,9].
In large river basins, crucial flood-control facilities such as embankments, reservoirs, and river regulation works are primarily aimed at reducing the impact of floods on human settlements, thus providing a safer and more sustainable environment, effectively offering flood control benefits for the basin. The assessment of these flood control benefits usually relies on flood risk maps, such as those created through hydrological modeling or GIS system simulations of flooding scenarios [10,11,12,13,14,15,16,17], which provide data support for the calculation of flood control benefits. However, these methods often only account for the losses incurred during flood inundation, while the costs associated with the construction and maintenance of the flood control structure, as well as the potential economic benefits they might yield, are neglected.
In recent years, the focus of researchers has shifted to the multiple benefits of flood-control structures, which primarily encompass potential values in water resource utilization and sustainable development. For example, a theory and a quantitative methodology for the multi-dimensional benefit evaluation of reservoirs have been developed, drawing upon interdisciplinary theories from energetics, economics, hydrology, and ecosystem service functions [18]. Moreover, an effectiveness assessment framework based on the Rainfall–Runoff Model (HEC-HMS) for dams and reservoirs has been proposed to balance the flood control, water supply, and irrigation benefits of reservoirs [19]. Although the existing multi-benefit assessment methods can be used to quantitative assess flood risk, which is essential for evaluating the benefits of flood control structures, the economic gains and losses of flood control structures have been ignored. They are not suitable for assessing areas that need economic development, such as FDAs.
For flood-control structures like FDAs, which have a low activation frequency and are populated, assessing their benefits necessitates a more comprehensive consideration. A framework for optimizing the site-selection and operational strategies of FDAs has been developed to maximize the overall benefits of flood-protection systems [4]. This framework adeptly combines a hydrologically based flood simulation module with a comprehensive cost–benefit analysis module, aiming to optimize the system’s efficiency. It achieves this by meticulously balancing flood management in the basin with the advantages offered by flood-protection areas. Furthermore, an agent-based modeling approach has been introduced to simulate various stages of FDA lifecycles, including operation, maintenance, repair, and replacement [20]. These methods can provide optimal maintenance strategies for FDA networks. However, the economic benefits generated by production in FDAs are often overlooked.
Currently, the benefit assessment for FDAs primarily focuses on improving their flood control efficiency, such as the losses reduced or the economic benefits derived from its flood control capacity, and very few studies focus on a comprehensive assessment of the benefits of all FDAs within a large watershed. To assess the flood control and economic benefits of FDAs in the YRB, the AHP–EW–TOPSIS integrated evaluation method is introduced by this study. Compared with previous studies that mainly focused on the assessment of individual FDAs, a statistically comprehensive assessment method for multiply FDAs was proposed in our manuscript; it can be utilized to evaluate the economic development and flood control capacity of multiply FDAs quantitively. The AHP method is one of the most commonly used subjective evaluation methods, then EW is used to increase the objectivity of the assessment, and finally the TOPSIS method is used to synthesize and rank the results. In order to balance the flood control and economic benefits within the FDAs in the YRB, we have referred to several flood scenarios that required partial storage in these basins. Based on our ranking results, the necessary FDAs for activation were selected. Finally, drawing on these outcomes, recommendations for FDAs were provided, prioritizing either economic development or the construction of flood prevention facilities. This strategy aims to enhance the economic benefits of the FDAs while ensuring safety in the basin in the event of floods. According to our review of the existing literature, there are no studies that provide a comprehensive assessment of multiple FDAs considering both economic and flood control benefits in a holistic perspective, and our study fills this gap.
In our evaluation methodology, the Analytic Hierarchy Process (AHP), one of the most frequently utilized Multi-Criteria Decision Making (MCDM) methods, was introduced by Saaty in the 1970s [21]. The AHP stands out from other MCDM methods due to it being recognized for its ease of use, intuitiveness, and robust capability for consistency checks. The multi-benefit assessment of FDAs encompasses a variety of factors. In dealing with complex decision-making issues, such as in flood vulnerability and risk assessments, many studies have adopted diverse methods, including Frequency Ratio (FR), Cluster Analysis (CA), Principal Component Analysis (PCA), and Multi-Criteria Decision Making (MCDM) [22]. MCDM is a prevalent decision-making approach used to select the most critical or best alternative among several potential criteria. For example, the flood risk of the Shenzhen metro system was effectively evaluated by researchers using AHP and TFN-AHP, further validating their findings with actual inundation data and showcasing the strengths of the AHP method in risk assessment [23]. Other researchers have used AHP (the preference ranking organization method for enrichment evaluation) to choose the optimal Low Impact Development (LID) design for urban flood prevention, eventually deriving the most practical solution [24]. However, due to the reliance of the AHP on expert scoring, which introduces a degree of subjectivity, we integrated the Entropy Weight Method (EW) to minimize this subjective bias [25,26].
Lately, the Technique for Order of Preference by Similarity to Ideal Solution (TOPSIS), based on Multi-Criteria Decision-Making (MCDM), has been widely used in assessing flood risk and flood control benefits. It has demonstrated its capability for rapid prediction and high interpretability, making it suitable for addressing various interrelated flood-related issues [27,28]. TOPSIS evaluates the best or worst solutions based on their distance to the Positive Ideal Solution (PIS) and the Negative Ideal Solution (NIS). While TOPSIS does not inherently assign weights, it can be used effectively in combination with other MCDM methods, such as the AHP, to create a robust evaluation model.
In this study, to comprehensively understand the differences among various FDAs, land use changes, GDP fluctuations, and population shifts in various FDAs were analyzed, comparing them with nearby cities from 1995 to 2020. Subsequently, the AHP–EW–TOPSIS comprehensive evaluation system was employed to assess changes in flood control benefits and economic benefits in these FDAs. The assessment results will provide priority construction decision plans for developing FDAs in the YRB and serve SDG10.1 and 11.5. The primary objectives of this study are as follows:
- (1)
- To analyze the changes in economic factors within the Yangtze River Midstream Urban Agglomeration (YRMUA) and FDAs in the YRB to explore the relationships of economic development between FDAs and nearby cities.
- (2)
- To construct a framework that encompasses the assessment of economic value and flood control value for FDAs in the YRB and identify their trends along with the underlying reasons.
- (3)
- To provide constructive recommendations for the economic development and flood management construction of the FDAs in the YRB based on the results of this study.
2. Materials and Methods
2.1. Study Area
The FDAs in the YRB are located in the middle and lower reaches of the Yangtze River, distributed across four provinces: Hubei, Hunan, Jiangxi, and Anhui. These FDAs consist of 42 individual FDAs, covering a total area of approximately 12,400 square kilometers and possessing a combined effective storage volume of approximately 59 billion cubic meters. These areas constitute a crucial component of the Yangtze River flood control system [29]. The majority of these areas have a relatively underdeveloped economic status, with a per capita GDP of approximately half of the national average. However, as urbanization accelerates, FDAs in the vicinity of cities are developing rapidly, leading to an increasingly severe conflict between economic development and the primary functions of FDAs.
With the gradual construction of the joint operation reservoir system, primarily led by the Three Gorges Dam, floods from upstream and middle reaches in the Yangtze River have been effectively regulated, significantly reducing the probability of activating FDAs. In 1954, the middle and lower reaches of the Yangtze River experienced the biggest flood in nearly a century [29]; most of the FDAs were inundated by the 1954 flood [30]. For instance, during the large-scale basin-wide flood of 1954, the FDAs in the YRB would have needed to store approximately 492 billion cubic meters of water before the completion of the Three Gorges Project. In comparison, with the Three Gorges Project constructed, the FDAs in the YRB would only need to store approximately 336 billion cubic meters of water [31]. The gradual improvement in the basin’s flood control system has significantly alleviated the pressure on FDAs in the YRB and provided further space for their economic development. The Comprehensive Planning of the Yangtze River Basin (2012–2030), outlined by China’s Ministry of Water Resources, pointed out that some FDAs should be downgraded or canceled. This provides policy support for the transformation of the functions of these areas.
Most of the FDAs in the YRB are located within the YRMUA, covering approximately 4% of the total urban agglomeration area. The economic development and improvement in living standards in these regions are severely constrained by the ‘label’ of FDAs. To uncover the relationships and disparities between the development of cities in the YRMUA and the surrounding FDAs, nine comparative regions were selected for comparative analysis. These regions include the YRMUA (UA), the FDAs in the YRB (FDA), Wuhan City (Wuhan), FDAs near Wuhan City (Wuhan_FDA), Jingzhou City (Jingzhou), FDAs near Jingzhou City (Jingzhou_FDA), Nanchang City (Nanchang), FDAs near Nanchang City (Nanchang_FDA), and the entire nation (nation) (national data as a comparison benchmark).
As the central city of the Wuhan Metropolitan Area, Wuhan City is recognized as the most economically developed area in the YRMUA. Meanwhile, Nanchang City is the central city of the Poyang Lake Urban Agglomeration and enjoys relatively strong economic development. Jingzhou City, on the other hand, is an ordinary prefecture-level city with a moderately developed economy. These three cities, along with their surrounding FDAs, were selected as study regions due to their significant representativeness.
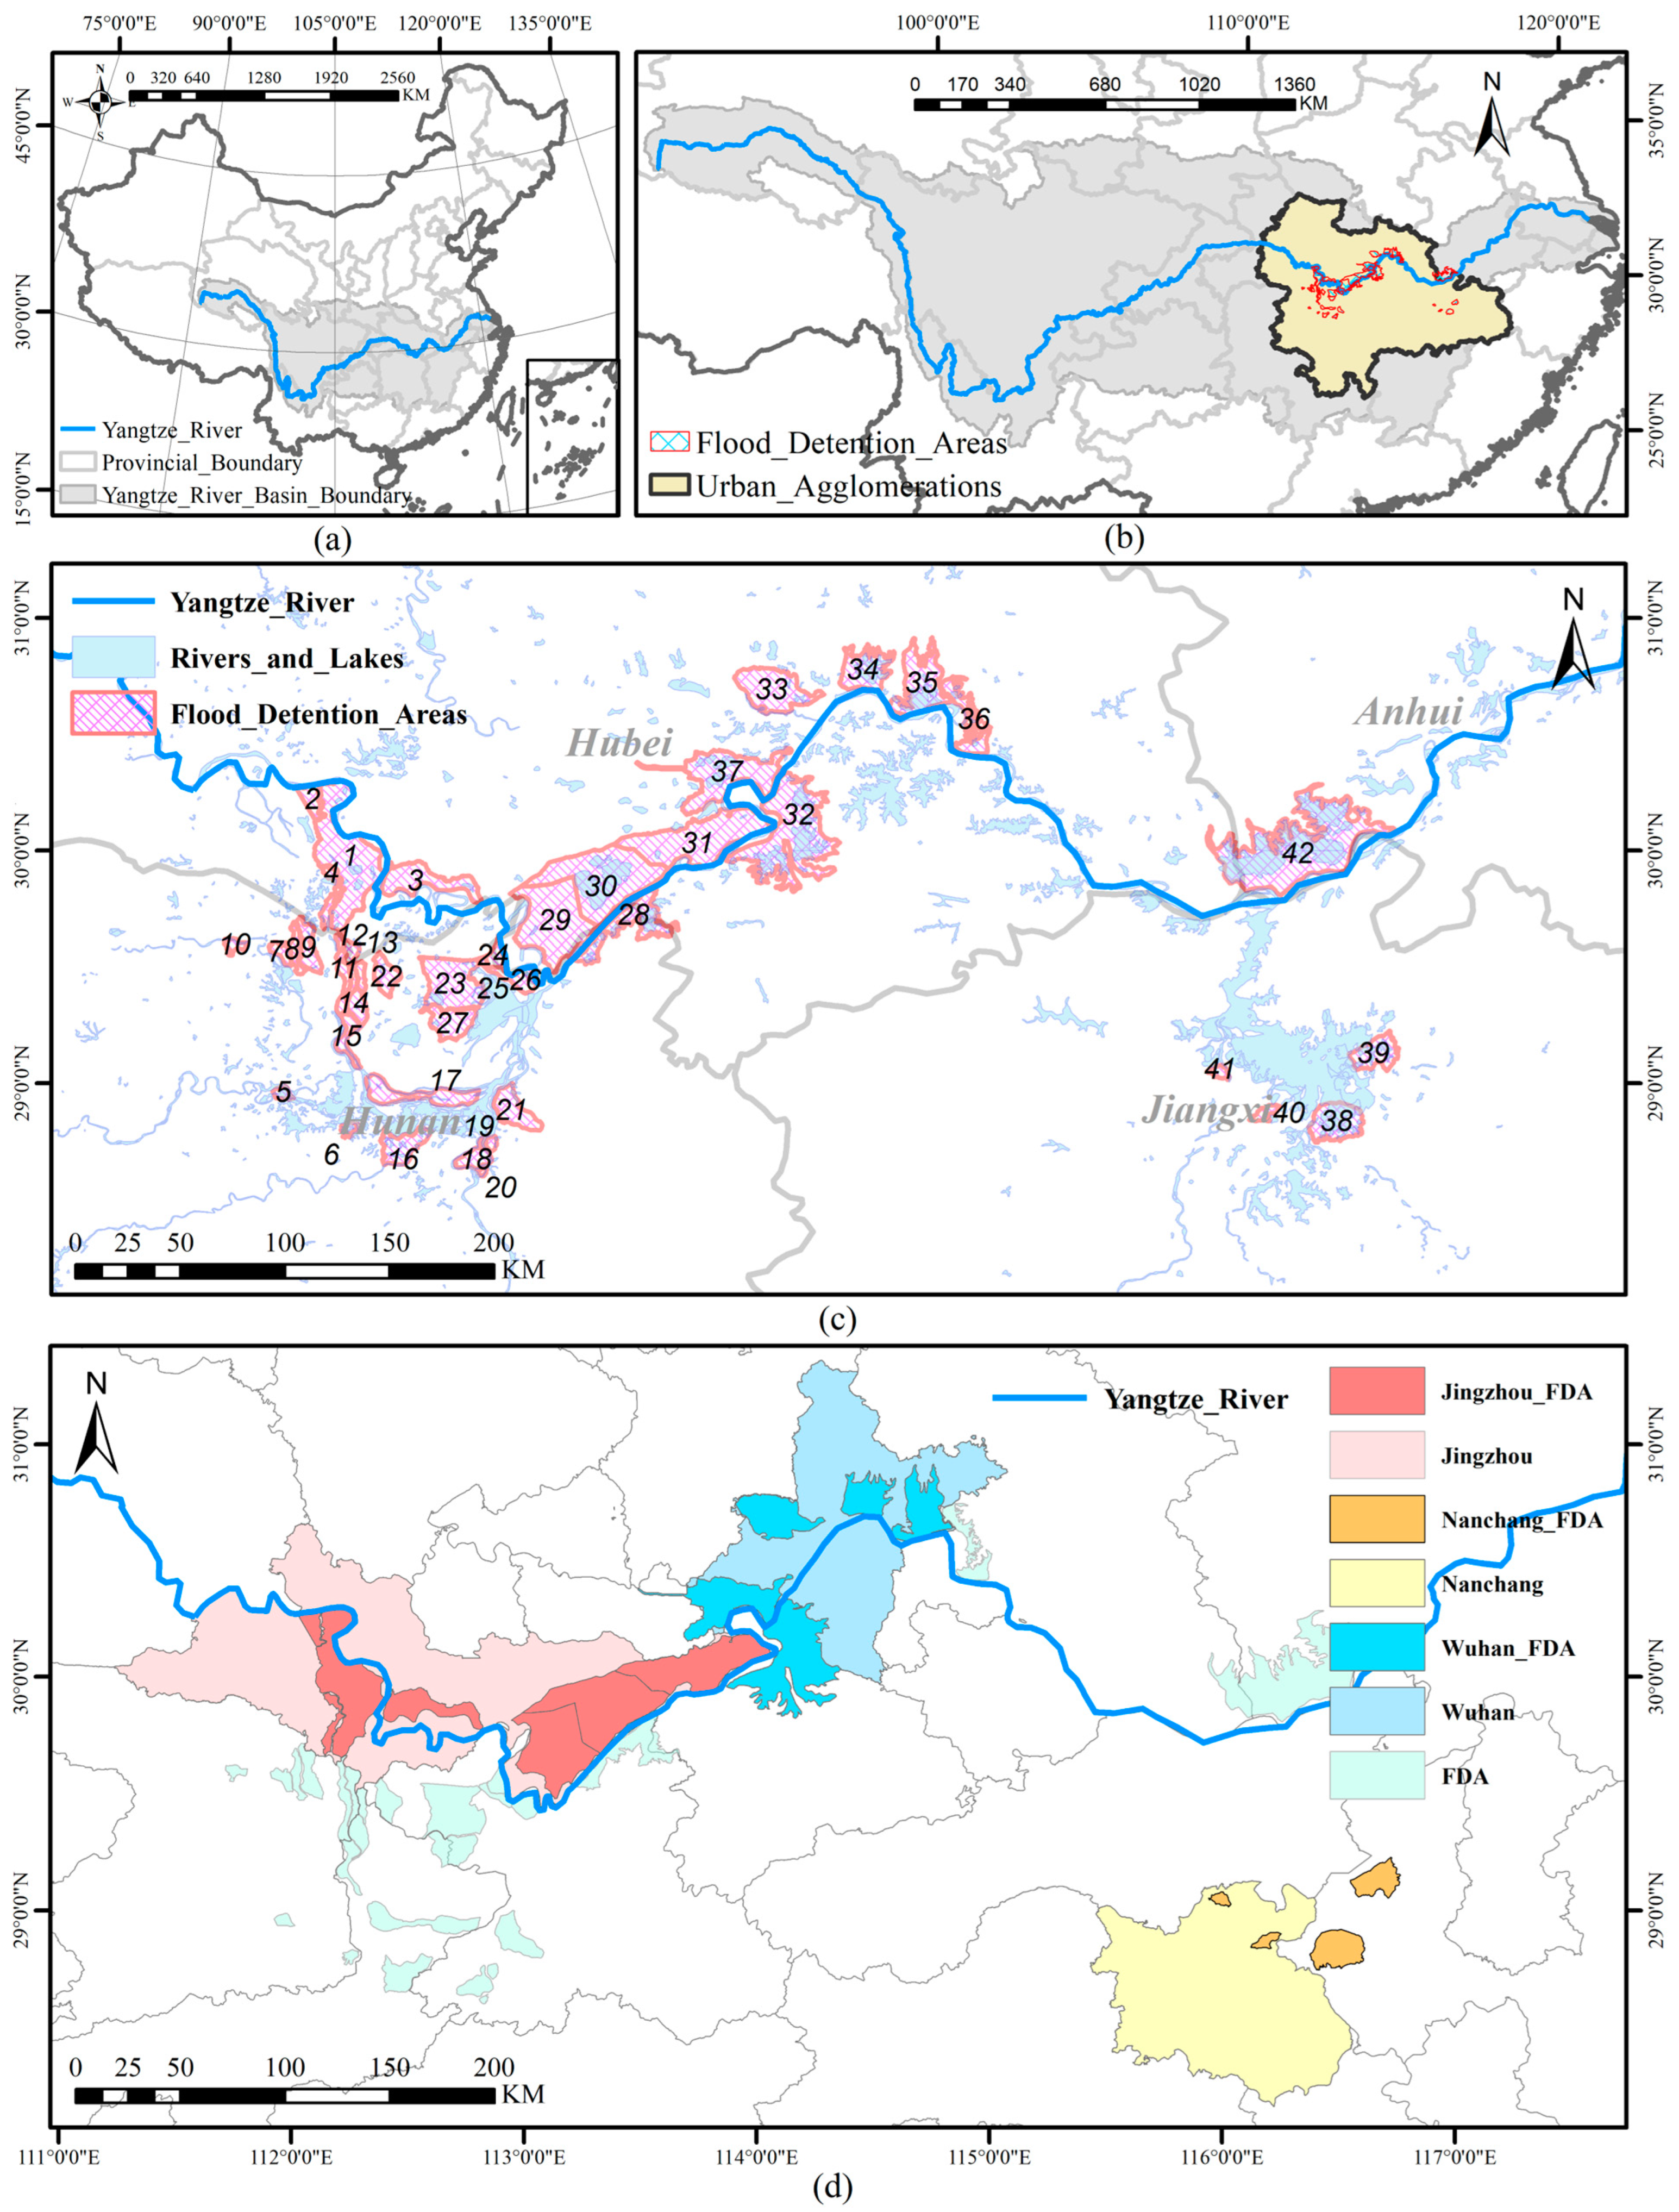
Figure 1 illustrates the distribution of FDAs in the YRB and the extent and locations of the study areas within the comparative regions.
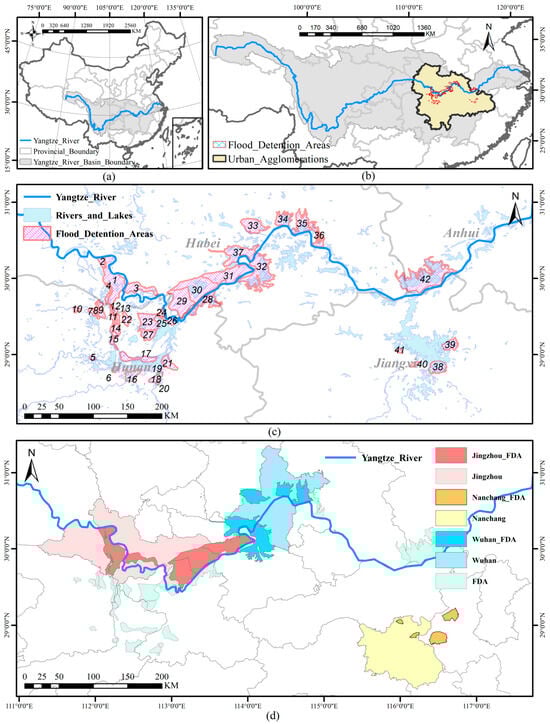
Figure 1.
Distribution of FDAs in the YRB and research areas of land use, GDP, and population change. (a) Description of the YRB in China; (b) Description of the YRMUA and the FDAs in the YRB; (c) The distribution of FDAs: 1, Jingjiang; 2, Woshi; 3, Renmindayuan; 4, Huxi; 5, Weidihu; 6, Liujiaoshan; 7, Jiuyuan; 8, Xiguan; 9, Anli; 10, Li’nan; 11, Anchang; 12, Anhua; 13, Nanding; 14, Hekang; 15, Nanhan; 16, Minzhu; 17, Gongshuangcha; 18, Chengxi; 19, Beihu; 20, Yihe; 21, Quyuan; 22, Jicheng’anhe; 23, Qianlianghu; 24, Jianshe; 25, Jianxin; 26, Junshan; 27, Datonghudong; 28, Jiangnanlucheng; 29, Honghu West; 30, Honghu Middle; 31, Honghu East; 32, Xilianghu; 33, Dongxihu; 34, Wuhu; 35, Zhangduhu; 36, Baitanhu; 37, Dujiatai; 38, Kangshan; 39, Zhuhu; 40, Huanghu; 41, Fangzhouxietang; 42, Huayanghe. More details can be found in Table S1; (d) Description of the research areas of land use, GDP, and population change. Jingzhou_FDA, Jingzhou, Nanchang_FDA, Nanchang, Wuhan_FDA, Wuhan, and FDA in this figure represent the FDAs around Jingzhou City, the areas of Jingzhou City, the FDAs around Nanchang City, the areas of Nanchang City, the FDAs around Wuhan City, the areas of Wuhan City, and the FDAs in the YRB, respectively.
2.2. Data
The data employed in this study can be categorized into three types: remote sensing data, socioeconomic data, and specific FDA data. The land cover and land use data in the remote sensing category originate from the nationwide 30 m land use change dataset (1990–2020) provided by the research group led by Xin Huang [32]. The Digital Elevation Model (DEM) utilized is from ASTER_GDEM_v3 (30 m) [33]. Subsequently, the JRC/GSW monthly historical data on surface water [34] were employed to generate historical flood inundation data for the FDAs in the YRB.
Regarding socioeconomic data, the spatial distribution of GDP (1995–2019) [35] and population (1995–2019) [36] is sourced from the Resource and Environment Science Data Registration and Publishing System. For GDP data, we also acquired the nationwide 1 km × 1 km gridded corrected data developed by Jiandong Chen [37], which corrects national data with night-time light. This dataset demonstrates better continuity across small regions and various temporal scales, which is why it was selected. Road data were obtained from Beijing University’s Geographical Data Platform’s publicly shared data [38] and OpenStreetMap (OSM) data (https://www.openstreetmap.org (accessed on 4 January 2024)). Agricultural, fishing, forestry, and rural household fixed asset data were extracted from the statistical yearbook of Hubei Province published by the National Bureau of Statistics (http://www.stats.gov.cn/ (accessed on 4 January 2024)). The statistical yearbook data uses data from Hubei Province because the area of FDAs in Hubei Province exceeds that of other provinces. Table 1 lists the details of these data.

Table 1.
Data source.
Additionally, regarding the vector data of FDAs in the YRB, since there were no publicly available datasets we created these datasets based on the “Atlas of Flood Detention Areas in the Yangtze River Basin” [31], Google Maps, and ASTER_GDEM_v3 (30 m) [33]. Specific data about the FDA, such as flood storage capacity, FDA grade, and construction status for these FDAs, were obtained from the publication “70th Anniversary of Yangtze River Flood Control and Disaster Reduction (1949–2019)” [29].
2.3. Methods
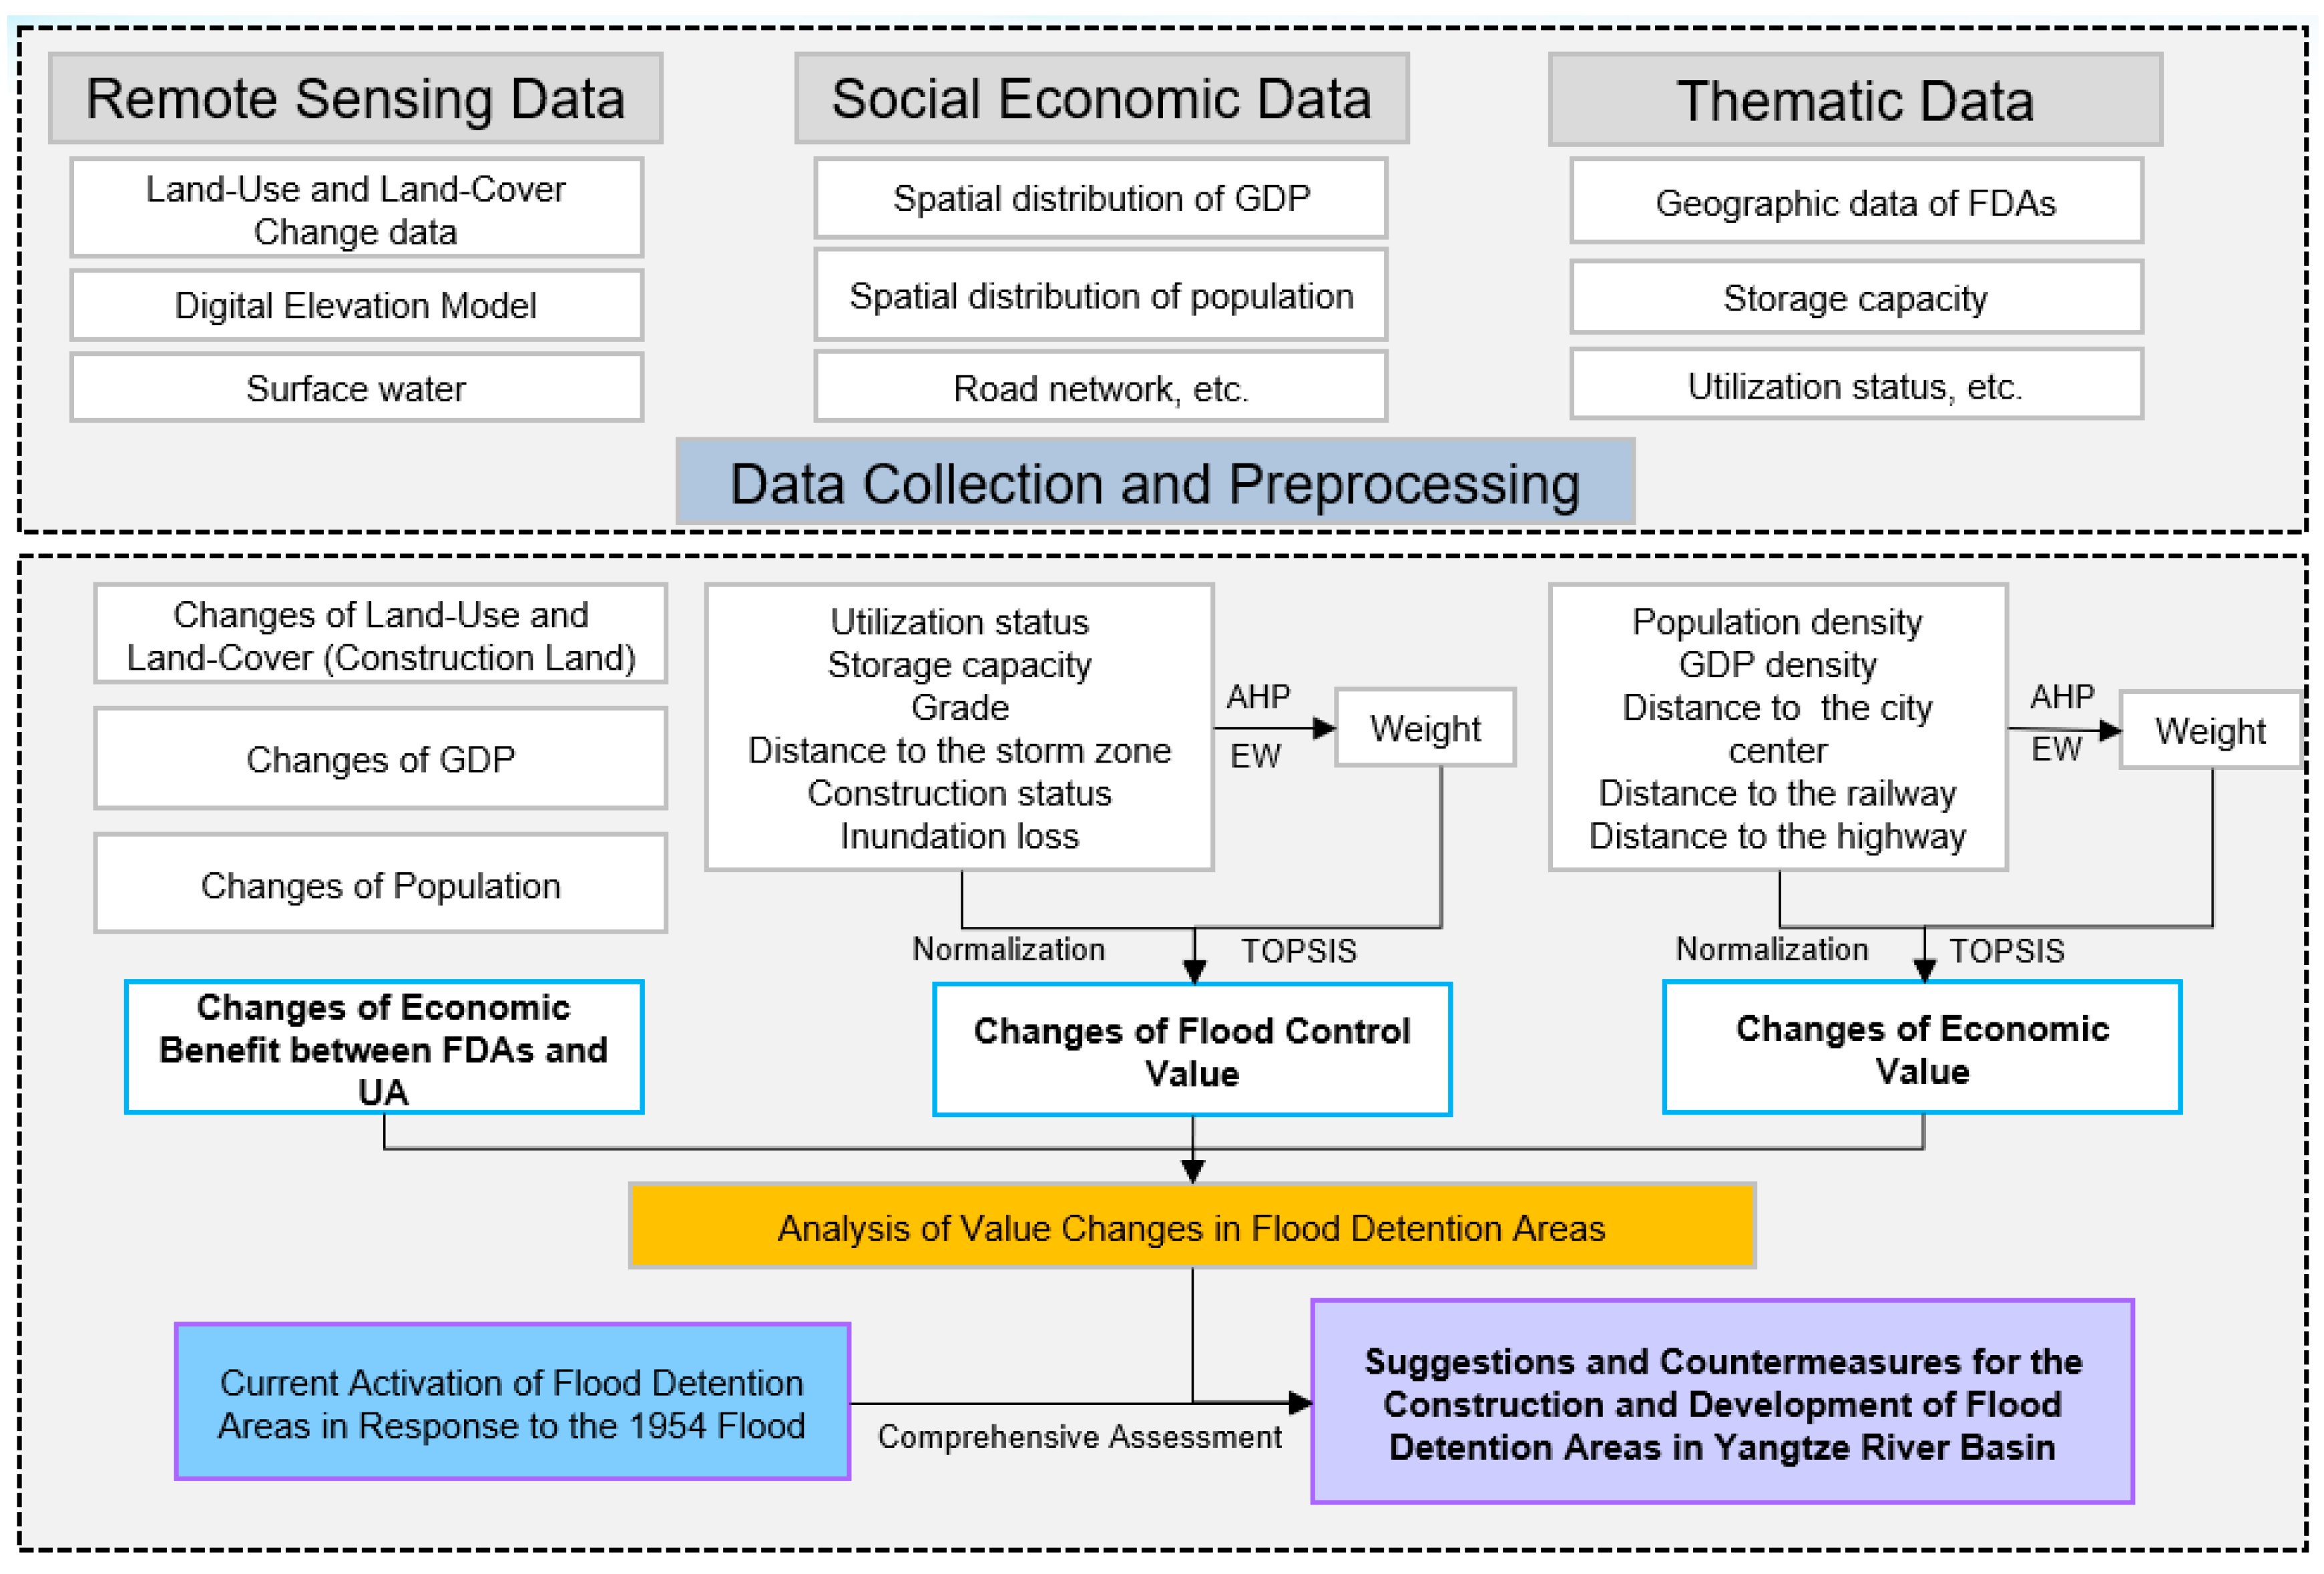
Figure 2 depicts our research roadmap, highlighting that remote sensing data, social economic data, and most thematic data for FDAs are obtained from major data websites and related literature. Due to the lack of publicly available vector data for FDAs, we manually mapped them on Google Earth using the “Atlas of flood storage and detention areas in the Yangtze River Basin” and adjusted their contours with DEM for elevation consistency in mountainous areas. Steps such as image reprojection, image stitching, and data format conversion were all involved in our data preprocessing.

Figure 2.
Flowchart of the research methodology: AHP–EW–TOPSIS.
The primary experimental content of this study includes an analysis of the economic benefits of the YRB’s FDAs and the YRMUA, an analysis of the changes in flood control value in the FDAs of the YRB, and an analysis of the changes in economic value in the FDAs of the YRB. Building on these results, by examining the activation of FDAs under existing conditions during historical floods, priority areas for development or enhancement of flood-prevention infrastructure are identified. This provides optimized suggestions for balancing the flood-control capacity and economic development potential of the FDAs.
2.3.1. Selection of Indicators
- Indicators of Flood Control Value
The primary function of FDAs is identified as reducing flood risk within the basin. Flood risk means the combination of the probability of a flood event and the potential adverse consequences on human health, the environment, cultural heritage, and economic activity associated with a flood event [39]. It can be viewed as a combination of three components: flood hazard (the frequency and severity of flood events), exposure elements (such as people, buildings, infrastructure, and economic and social activities in flood-prone areas), and vulnerability (the propensity of exposed elements to be damaged by floods) [40]. Flood risk can be calculated quantitatively or qualitatively based on these definitions.
For watersheds, the flood control value of FDAs is manifested in their capacity to reduce flood risk, specifically in their ability for flood diversion and flood storage. This capacity can be represented by their geographical location and flood storage capacity. Therefore, the flood storage capacity and geographic factors are used as important assessment indicators. Geographic factors mainly include the FDA grade (which is primarily based on the utilization probability) and the distance to major rainfall areas in the vicinity. Additionally, the construction of flood-control structures within these areas has a significant impact on the storage and discharge capacity of FDAs. Since this capacity can be enhanced through subsequent construction, it is considered a relatively important factor.
For a specific FDA, when it stores floodwaters losses will be incurred within the area. Exposure elements and vulnerability within the area are primarily represented by the types of elements inundated in the region, and the assessment is based on the losses incurred by each land use type during flooding. Different land use types have varying losses when their key elements are submerged [41,42], so the inundation losses are weighted to compare different FDAs.
Regarding the flood control value indicators, the grade of FDA, storage capacity, historical utilization status, and flood control structures status are obtained from “70th Anniversary of Yangtze River Flood Control and Disaster Reduction (1949–2019)” [29]. The distance to the heavy rainfall area and the inundation loss during FDA activation must be calculated.
The distance to the heavy rainfall area is determined by calculating the shortest distance between the main heavy rainfall areas in the YRB [43] and the centroids of the respective FDAs. The calculation of the inundation loss during FDA activation is derived from land use data, statistical yearbook data, and the corresponding loss rates for different industries. The calculation process is as follows:
In the above equation, LOSS represents the loss per unit area during FDA usage. stands for the output value per unit area of the land use type i, represents the average loss rate when the land use type i is affected by flooding, represents the area of the land use type i, and denotes the total area of the FDA.
The indicators of FCV are listed in Table 2, including their specific meanings, whether they are positive or negative indicators, and their importance.
Table 2.
Indicators of Flood Control Value (FCV).
- Indicators of Economic Value
Economic value is reflected in the factors of economic development, which mainly include natural factors and economic factors [44,45,46]. Among them, most of the human factors have a higher explanatory power than natural factors in urban development. The human factors primarily include GDP, population density, distance from the city center, distance from railways, and distance from national highways. The natural factors with higher explanatory ability mainly include distance from water and elevation. Since the FDAs in the Yangtze River generally have numerous water bodies, the distance from water is not considered. Additionally, since the average elevation difference between each FDA is within 20 m, elevation is not taken into account.
The calculation method still uses the AHP–EW–TOPSIS comprehensive evaluation method, with the calculation process following the process of flood control value assessment. These indicators of Economic Value (EV) are listed in Table 3, including their specific meanings, whether they are positive or negative indicators, and their importance.
Table 3.
Indicators of Economic Value (EV).
2.3.2. Framework of Value Assessment
- The Analytic Hierarchy Process (AHP)
The Analytic Hierarchy Process (AHP) is a hierarchical weight decision analysis method proposed by Thomas Saaty [21] in the early 1970s. Its main principle is to construct a hierarchical model, create judgment matrices based on the Saaty 1–9 scale, and calculate the relative weights of the matrices using the eigenvalue method. To ensure the rationality of the matrix weights, a consistency check of the judgment matrices is also required. The process is as follows:
- 1.
- Constructing judgment matrices and determining subjective weight matrices using the 1–9 scale method:In the above equation, represents the weight matrix and denotes the importance ratio of indicator compared to indicator . The weight matrix for flood control value indicators and economic value indicators can be determined based on the importance of indicators presented in Table 2 and Table 3.
- 2.
- Calculate the subjective weight through methods of characteristic root, where the largest eigenvalue is and the corresponding weight vector is .
- 3.
- Perform a consistency check, return to step (1), and reconstruct the weight matrix if it does not pass. Otherwise, use the indicator weights.
- The following is the consistency check process:
- (1)
- Calculate the Consistency Index (CI) using this formula:
- (2)
- Calculate the Consistency Ratio (CR) using this formula:
- (3)
- If CR is less than 0.1, the consistency check is passed, and the last weight of the index is , where is a unit vector. The subjective weights would be determined by this approach.
- The Entropy Weight Method (EW)
The entropy weight method is identified as a mathematical approach for calculating comprehensive indicators based on allowing for the information provided by various factors. The main principle of it is to catch indicator scores and calculate the entropy and weight of the indicators after the scores are standardized. To evaluate data spanning multiple years, these data have been standardized uniformly by us. The process is as follows:
- 1.
- Data standardization: Normalize all data and convert negative indicators to positive ones. For indicators with maximum or minimum ordering, we can use min–max normalization to standardize the data. Assuming we have k indicators , …, , where , we can use the following formula for normalization:
- 2.
- Next, calculate the weight for indicator j of research object i:
Then, calculate the information entropy:
- 3.
- Determine the weights of each indicator:
The last weight of EW is .
- Calculation of the Comprehensive Weight
Utilizing the Lagrange multiplier method, the subjective weights , obtained from the AHP method, and the objective weights , obtained from the entropy weight method, are combined to derive the comprehensive weight , as expressed in the following formula:
- Calculating Sort Using TOPSIS
TOPSIS achieves the ranking of evaluation objects by considering the distances between the best and worst solutions, enabling the identification of the optimal solution in multi-criteria decision analysis. The process is as follows:
- 1.
- Establish the decision matrix R by multiplying the comprehensive weight with the decision normalized matrix :
- 2.
- Determine the positive and negative ideal solutions for each indicator:
- 3.
- Calculate the degree of correlation using the Euclidean norm, calculate the distance between the evaluation object and the best solution , the distance between the evaluation object and the worst solution , and finally, obtain the proximity of each evaluations object to the ideal solution:The value of ranges between 0 and 1; the closer it is to 1, the higher the flood control value or economic value of the FDA.
2.3.3. Validation of Flood Control Value
In flood risk assessments, historical flood inundation data are often employed for validation purposes [47,48]. To reduce flood risk, the flood control capacity of FDAs is a critical focus. To validate its effectiveness, historical flood events were used. A novel method has been developed to assess the flood control value of these areas, which involves analyzing inundation rates in non-water areas within each basin. This analysis helps to rank their capabilities in flood control. The methodology is as follows:
- 1.
- Calculate the non-water area inundation rate Sn for each FDA;
- 2.
- Rank the FDAs based on the inundation rate of non-water areas for each FDA;
- 3.
- Calculate the average accuracy of the flood control value for FDAs:
In the above formula, AC is the accuracy rate (the result is between 0 and 1, with a value closer to 1 indicating a higher level of accuracy), n represents the number of FDAs, represents the ranking result of flood control value obtained from AHP, and represents the ranking of non-water area inundation rates for each FDA.
3. Results
3.1. Changes of Land Use, GDP, Population
3.1.1. Changes of Land Use (Impervious)
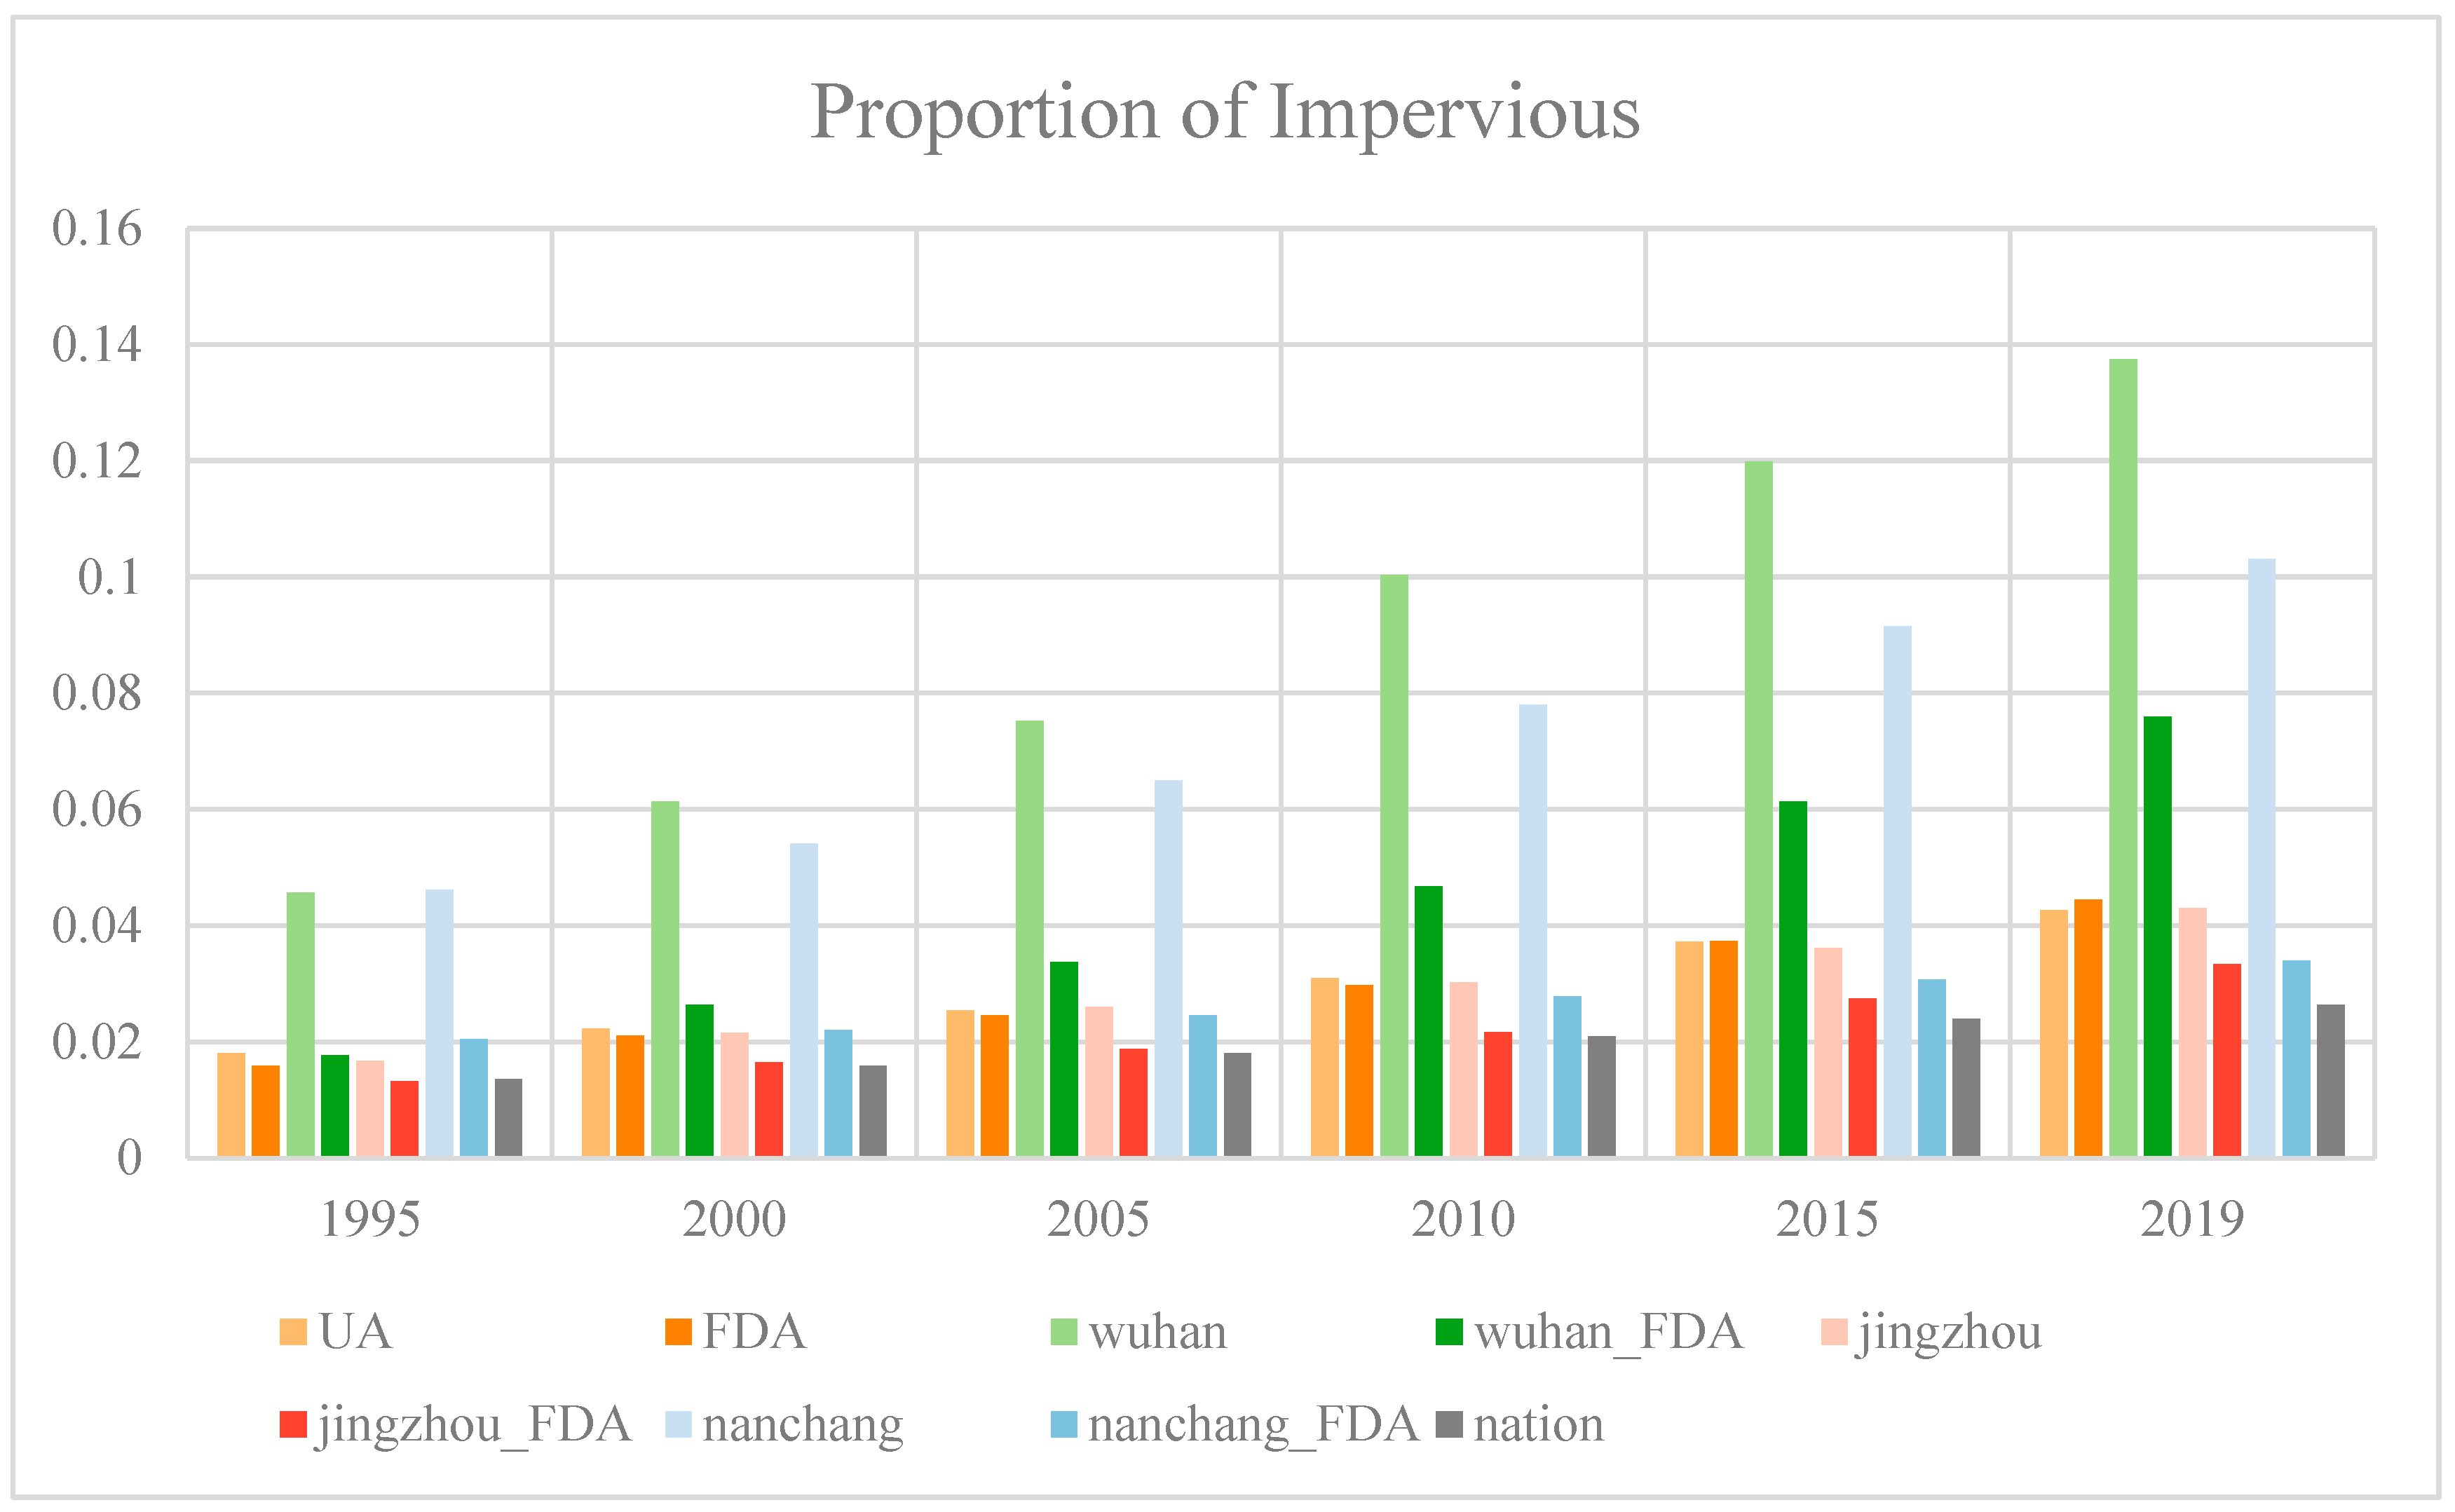
Figure 3 and Figure 4 illustrate the changes and growth rates of impervious areas in nine comparative study regions from 1995 to 2020. During this period, the impervious areas in the FDAs of the YRB and the surrounding cities have been maintained at high growth, consistently exceeding the national average. Wuhan, as the leading city in the YRMUA, had the highest proportion of impervious area in 2020, accounting for 13.7% of the total land use types, and the impervious area doubled over the 25-year period. Contrary to the aforementioned regions, Nanchang and its surrounding FDAs exhibited significant differences in the proportion and growth rate of impervious areas. In 2020, Nanchang’s proportion of impervious area was approximately 10.3%, while the nearby FDAs’ impervious area only reached 2.6%. Moreover, the growth rate of Nanchang’s impervious area far surpassed that of its neighboring FDAs.

Figure 3.
The changes in proportion of impervious area. More details can be found in Table S2.
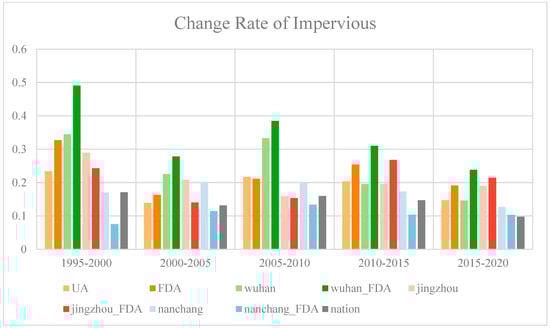
Figure 4.
The growth rate of impervious area. More details can be found in Table S3.
3.1.2. Changes of GDP and Population
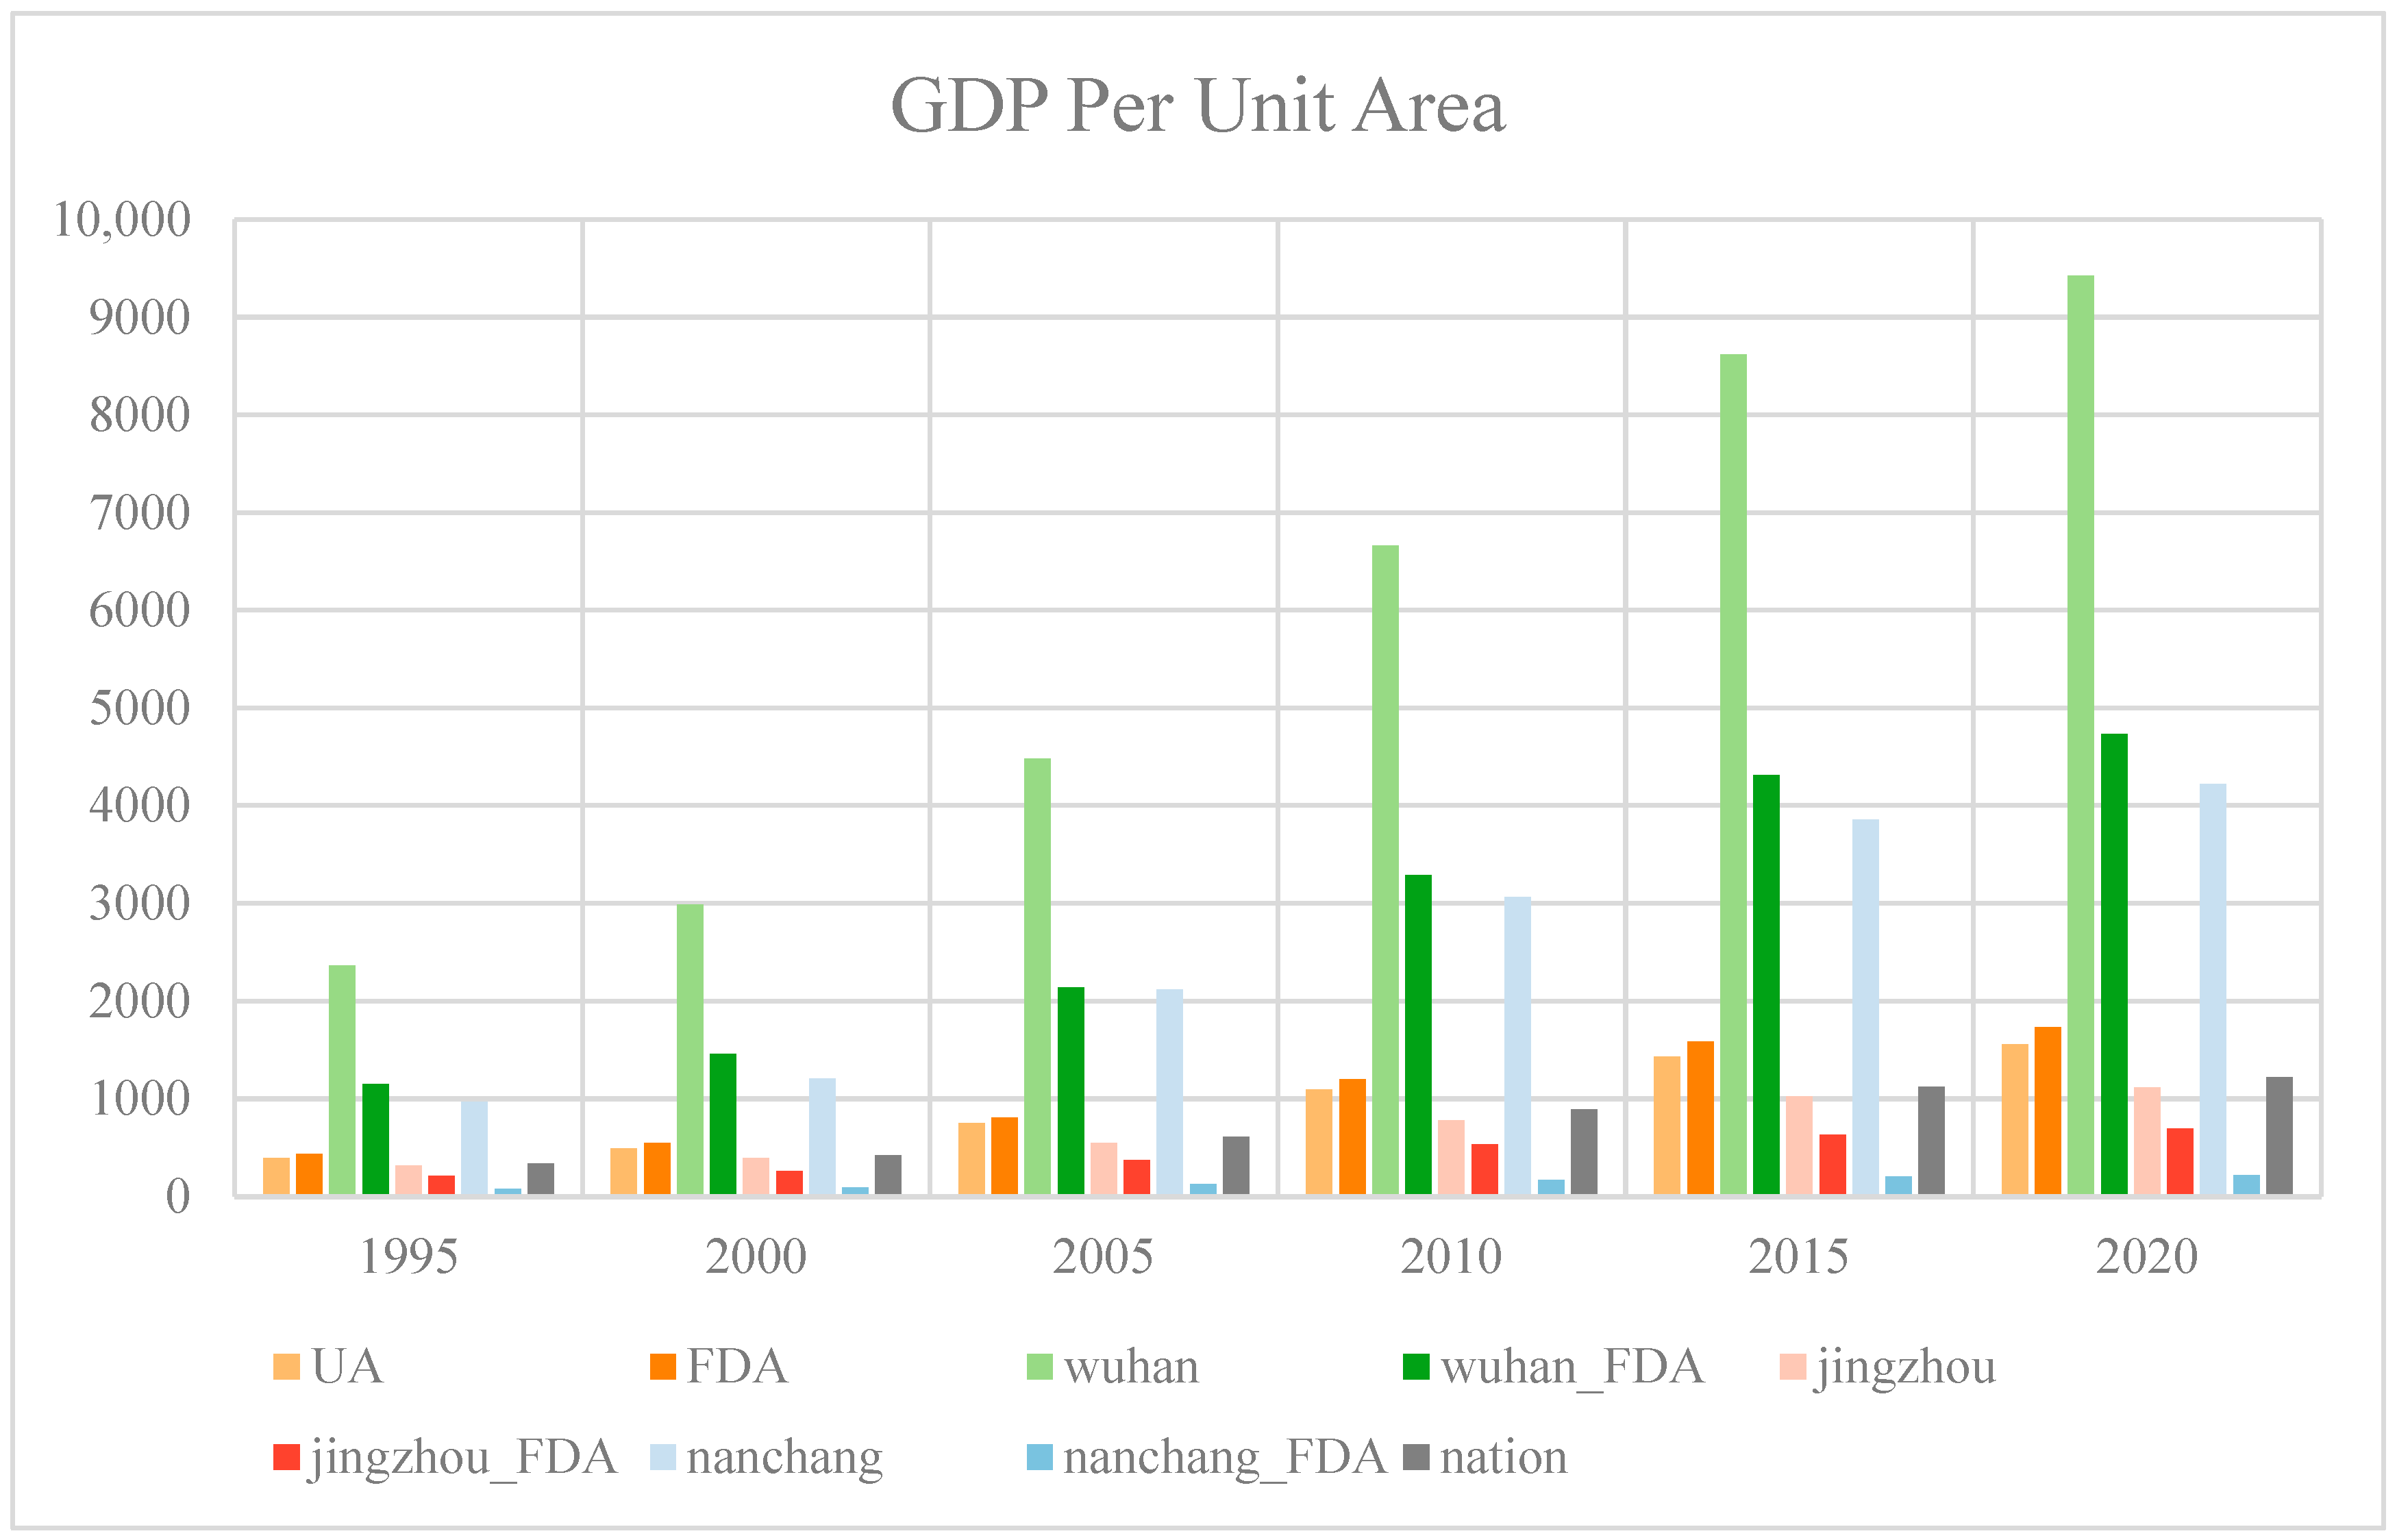
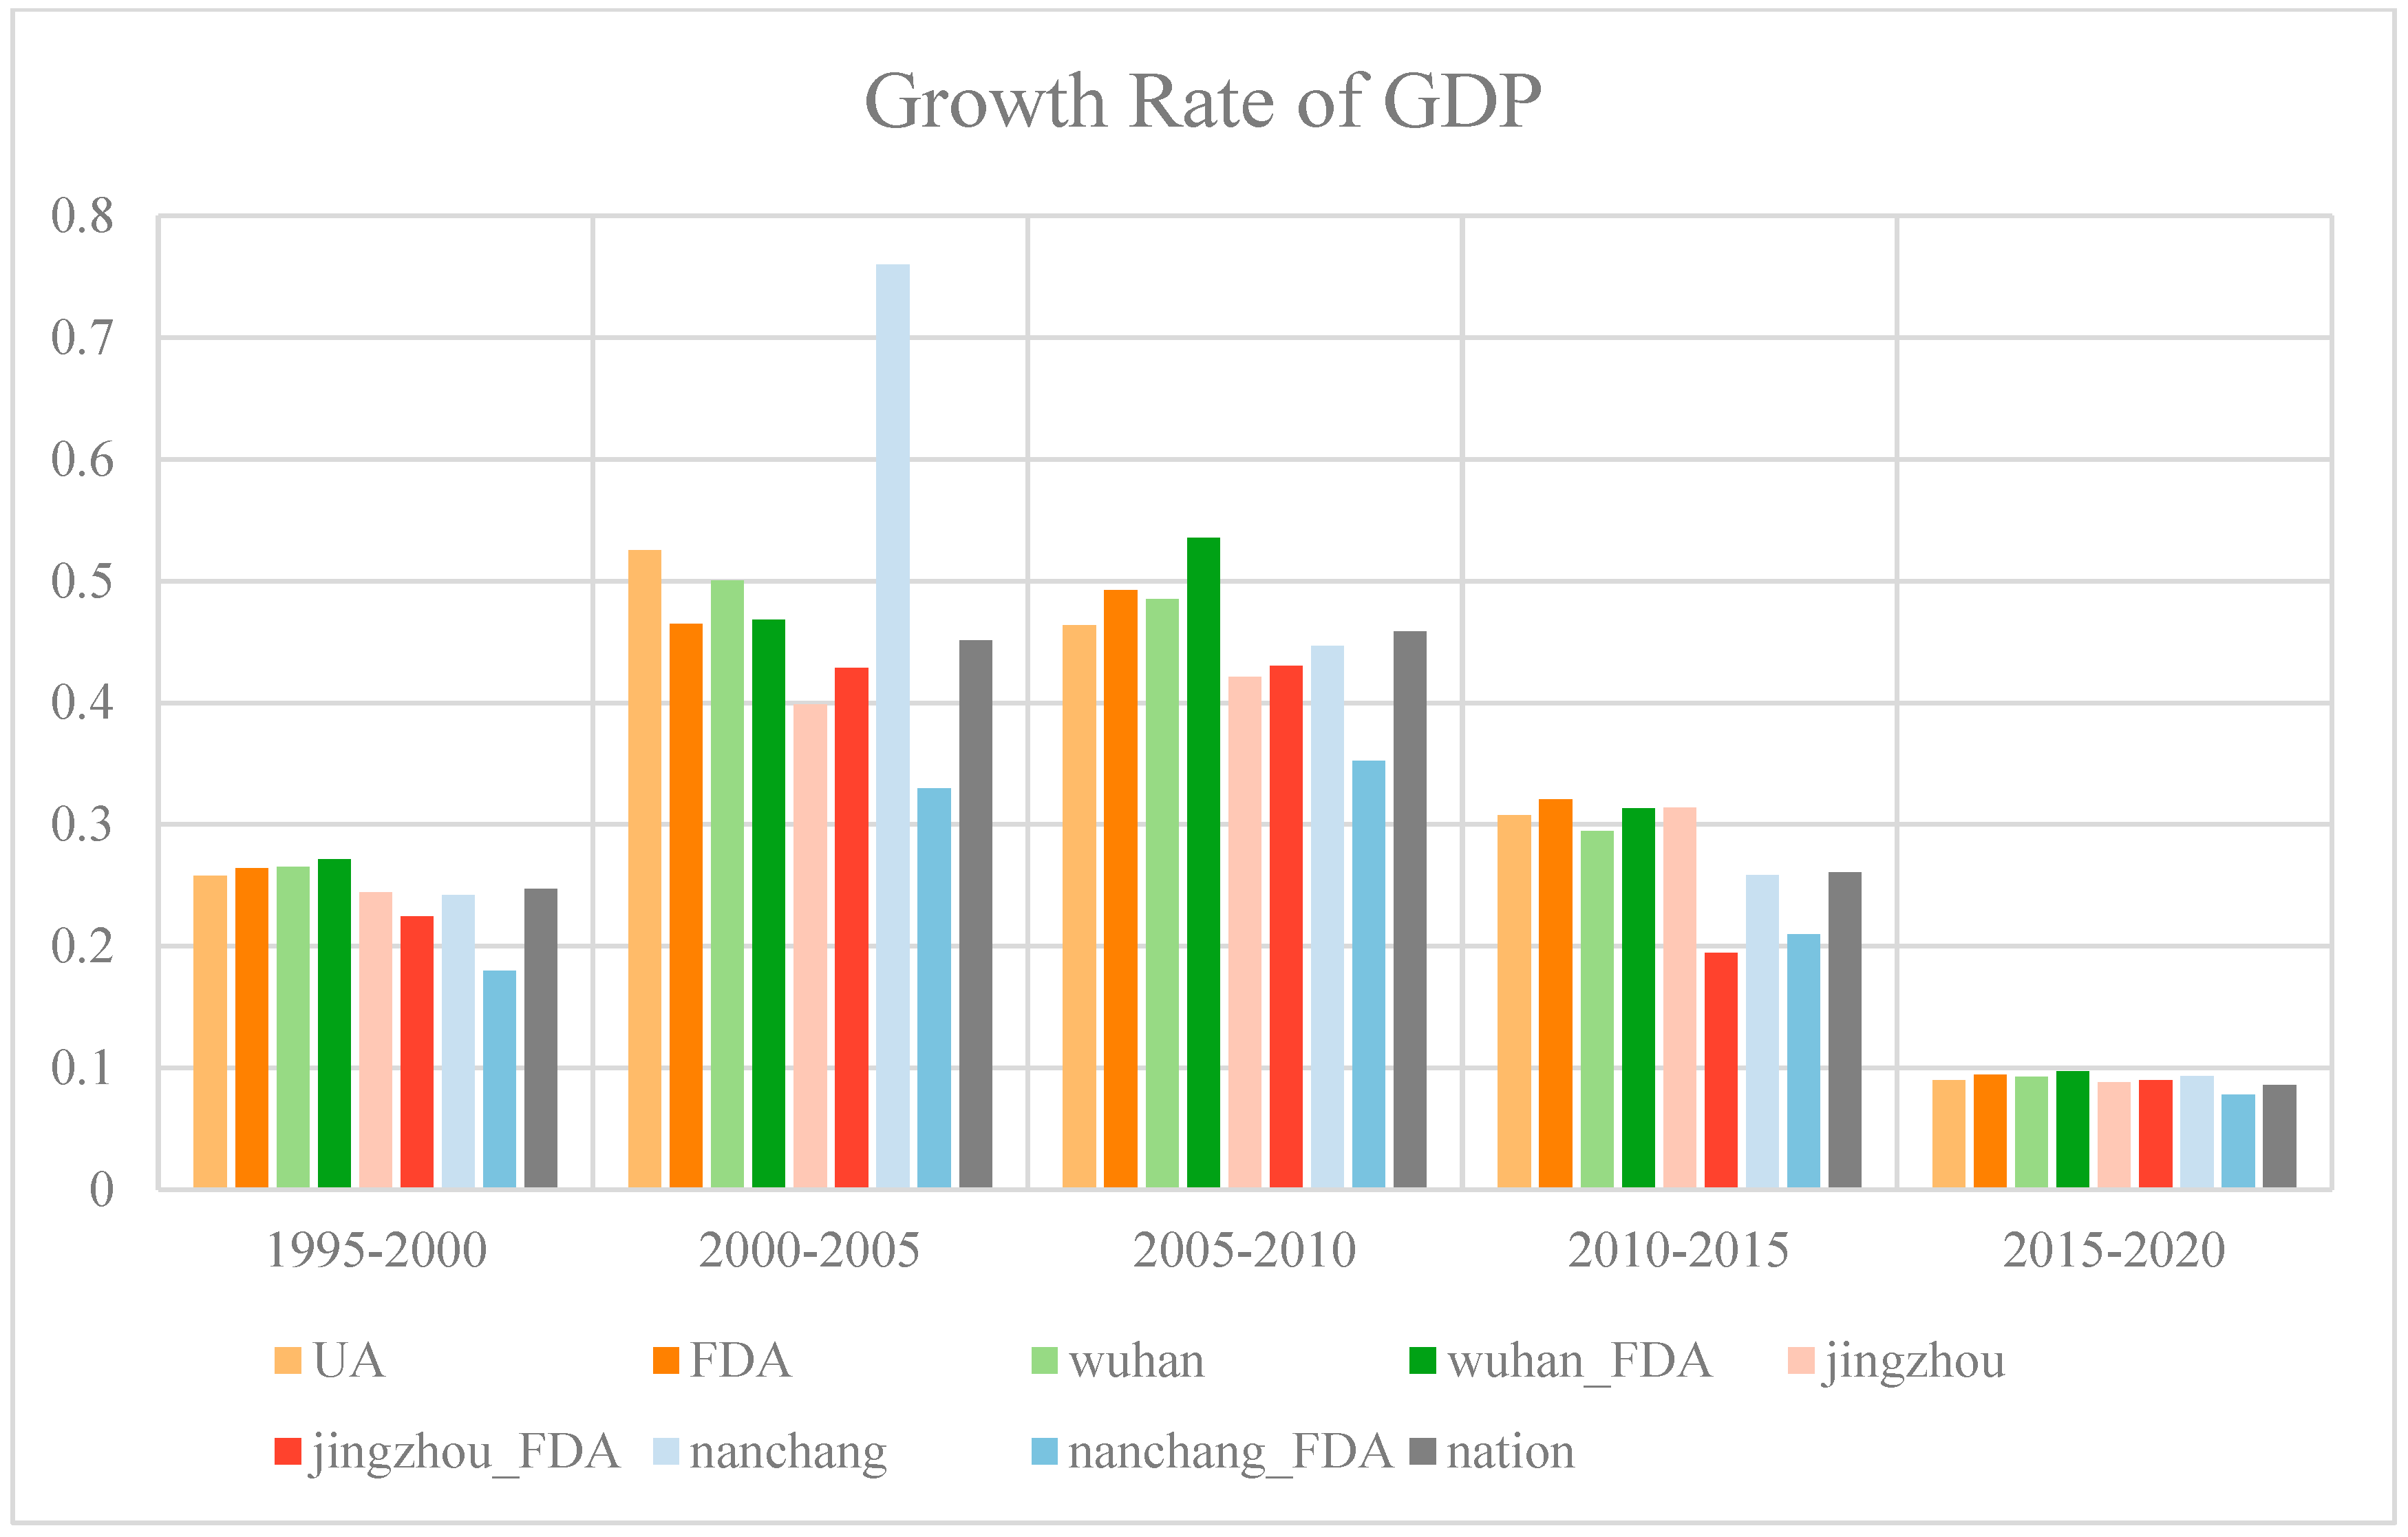
Figure 5 and Figure 6 display the changes in GDP per unit area and GDP growth rate in nine comparative study regions from 1995 to 2020. During these 25 years, steady GDP growth was experienced by each study region, with a similar trend of initial increase followed by a decrease. However, variations were observed in the GDP growth trends of FDAs in different regions, with the areas near Nanchang City showing particularly slow growth, even falling significantly below the national average.
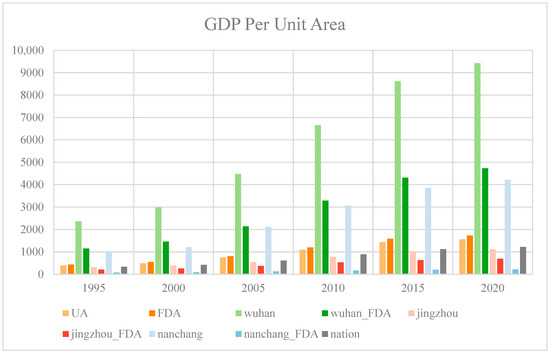
Figure 5.
The changes in GDP per unit area in nine comparative regions from 1995 to 2020, measured in CNY ten thousand per square kilometer. More details can be found in Table S4.
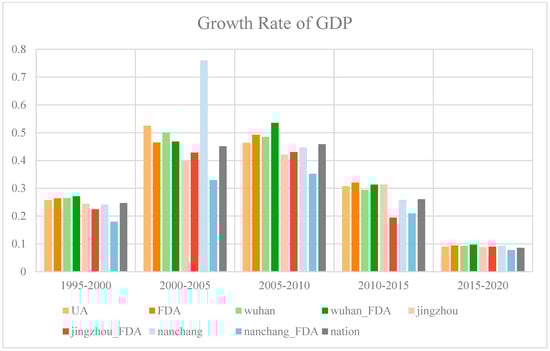
Figure 6.
The changes in GDP growth rate in nine comparative regions from 1995 to 2020. More details can be found in Table S5.
3.2. Changes of Flood Control Value and Economic Value
3.2.1. Changes of Flood Control Value
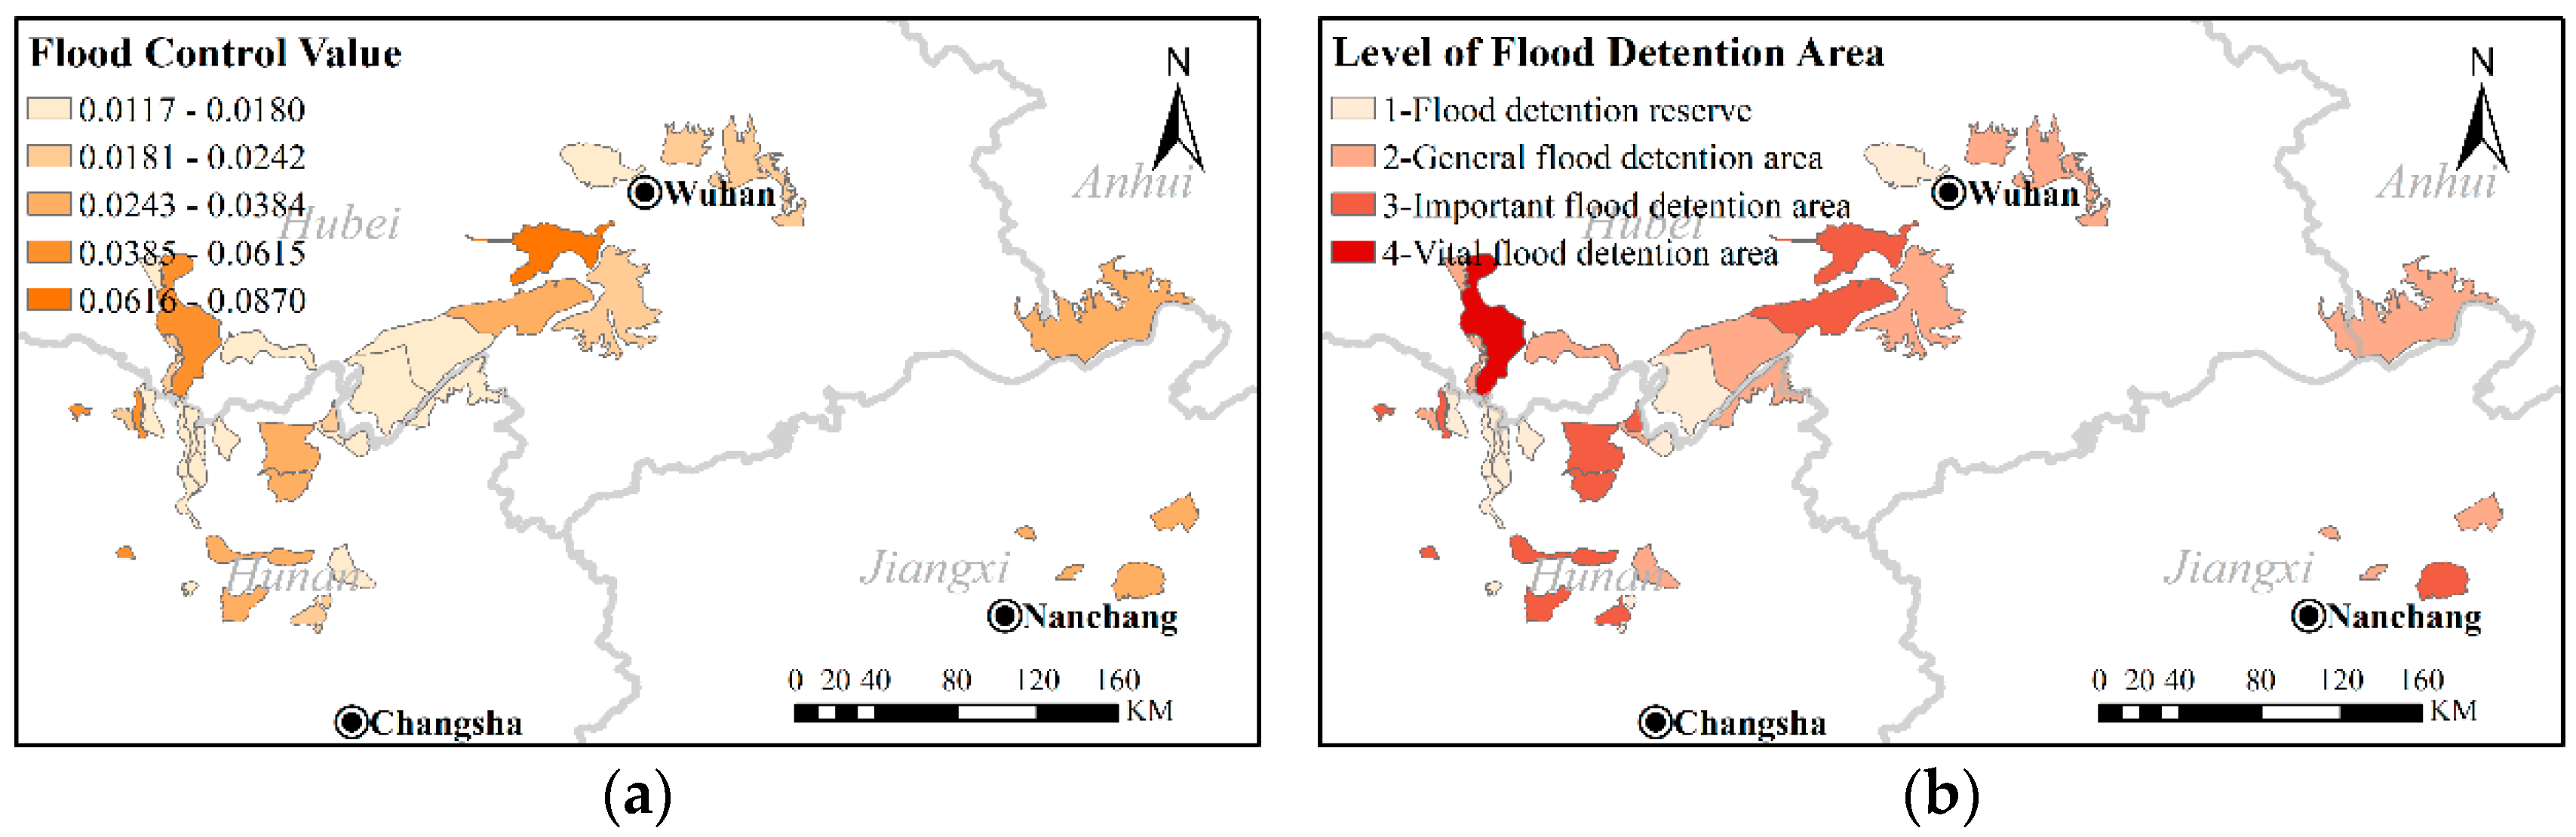
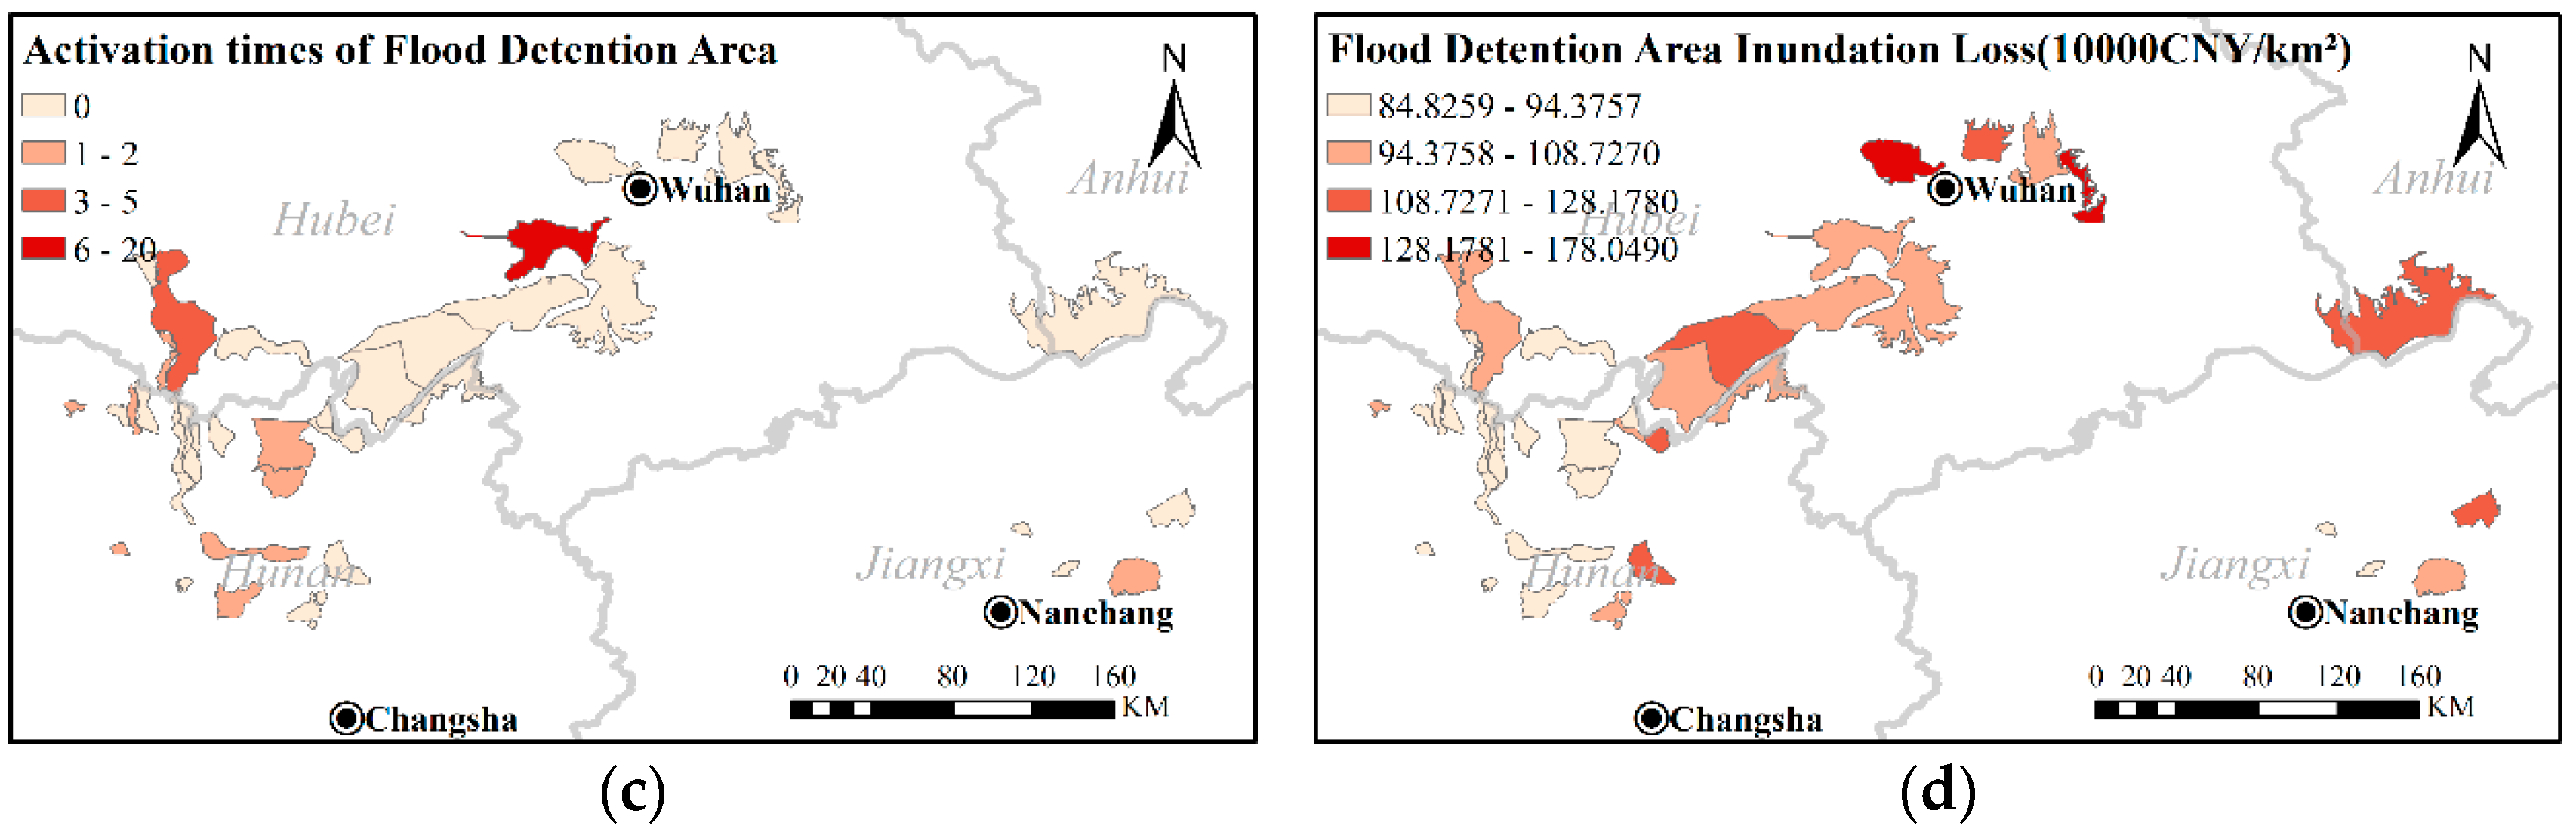
To compare the differences in flood control value among various FDAs, the changes in flood control values for each area were calculated based on flood control indicators, with the results shown in Figure 7. The FDA with higher levels or more frequent utilization has higher flood controls values, aligning with the original purpose of establishing the FDA, which demonstrates the effectiveness of our flood control value assessment. Notably, FDAs such as the Dujiatai FDA and the Jingjiang FDA have higher flood control values, playing irreplaceable roles in basin flood control. On the other hand, FDAs like the Liujiaoshan FDA and the Woshi FDA have relatively lower flood control values and are rarely activated, unless facing extremely large floods.
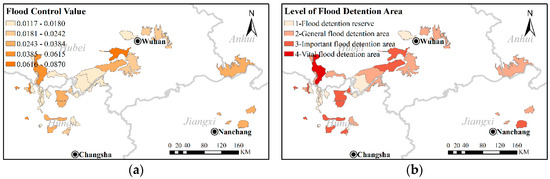
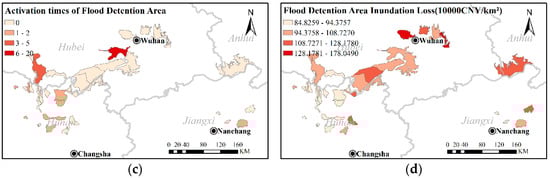
Figure 7.
The comparison of flood control value distribution of FDAs in the YRB. (a) The distribution of flood control value of each FDA in 2020; (b) The level distribution of each FDA; (c) The distribution of number of historical activations of each FDA; (d) The inundation losses under the economic development conditions of each FDA in 2020. More details can be found in Table S6.
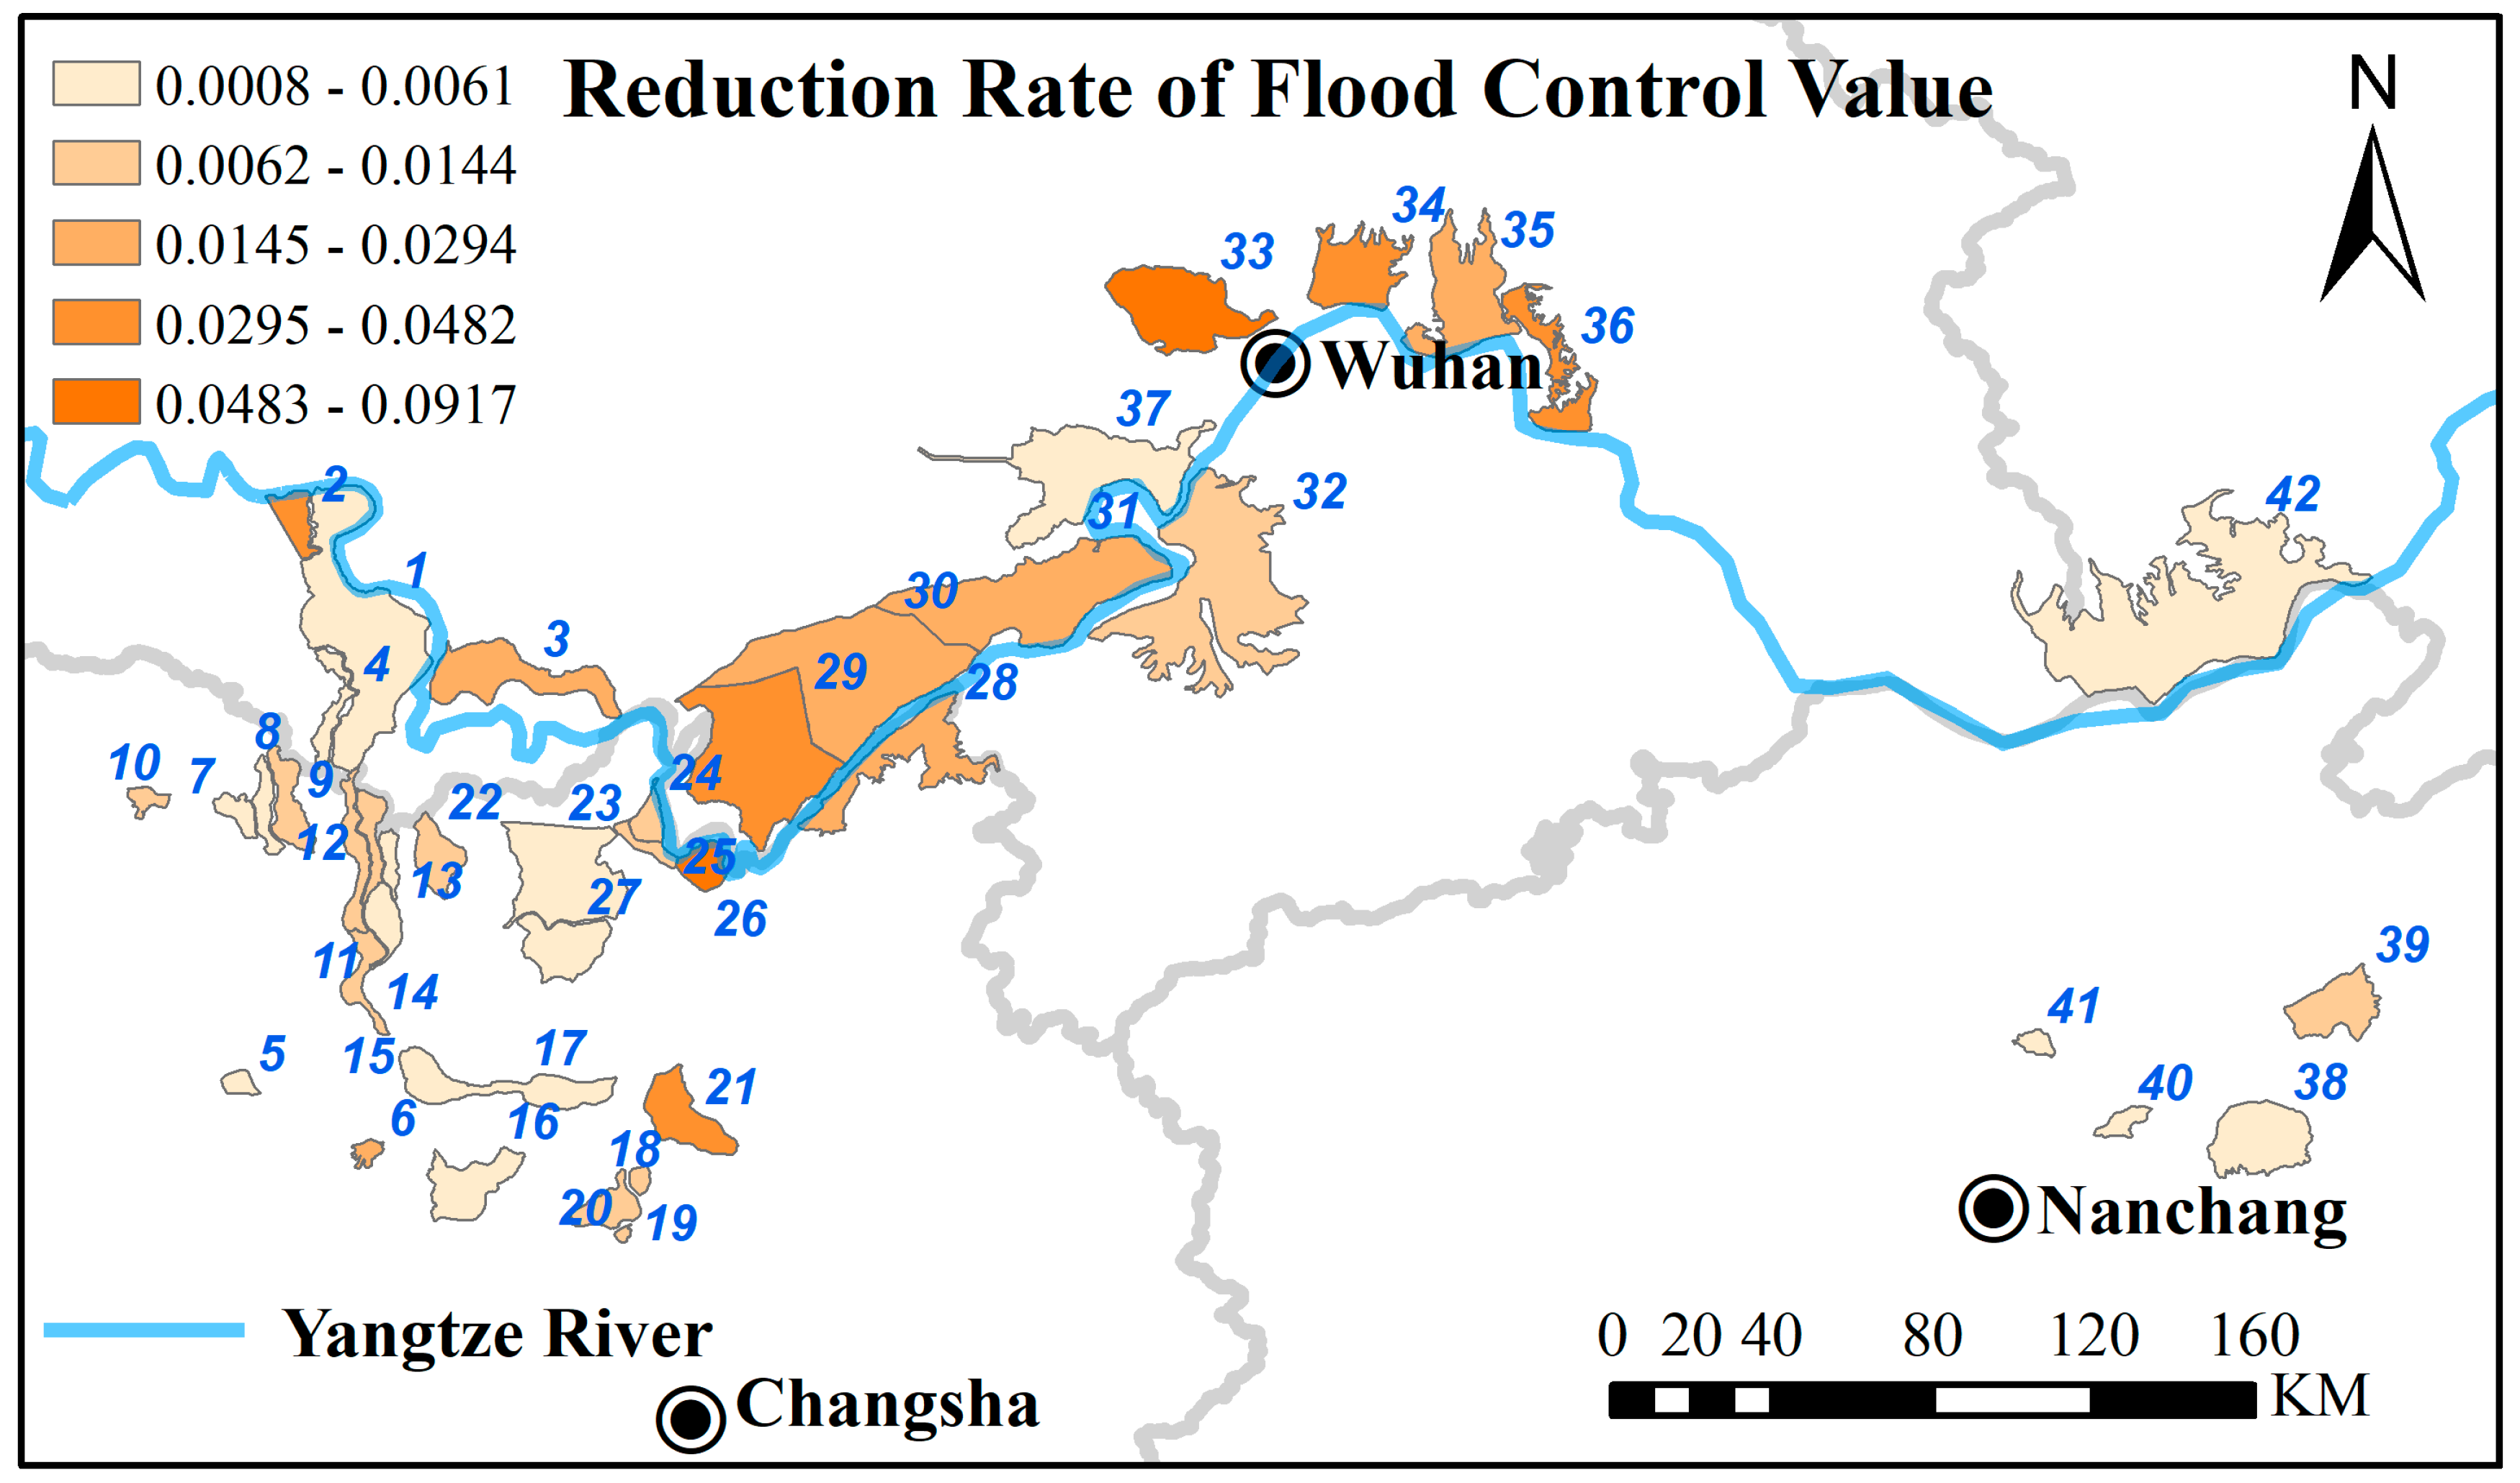
Figure 8 shows the reduction rate in flood control value in the FDAs of the YRB from 1995 to 2020. During these 25 years, the flood control values of all FDAs have declined. The most notable changes are observed in areas near Wuhan City, which include 33—Dongxihu FDA, 36—Baitanhu FDA, and 34—Wuhu FDA. These areas have been significantly affected by urban expansion in Wuhan City, leading to substantial increases in the impervious area, which in turn has resulted in noticeable increases in utilization losses. Conversely, FDAs like 5—Weidihu FDA have experienced slower economic development over these 25 years, leading to gradual increases in impervious areas and, consequently, few changes in flood control values.

Figure 8.
The change rate of flood control value per unit area in FDAs in the YRB from 1995 to 2020. (The explanation of the numbers can be seen in Figure 1).
3.2.2. Changes of Economic Value
The economic indicators have changed over time, except for the distance from city center. To improve the accuracy of the results, the data for all years were normalized collectively by us when calculating the entropy weight of each indicator and the final results.
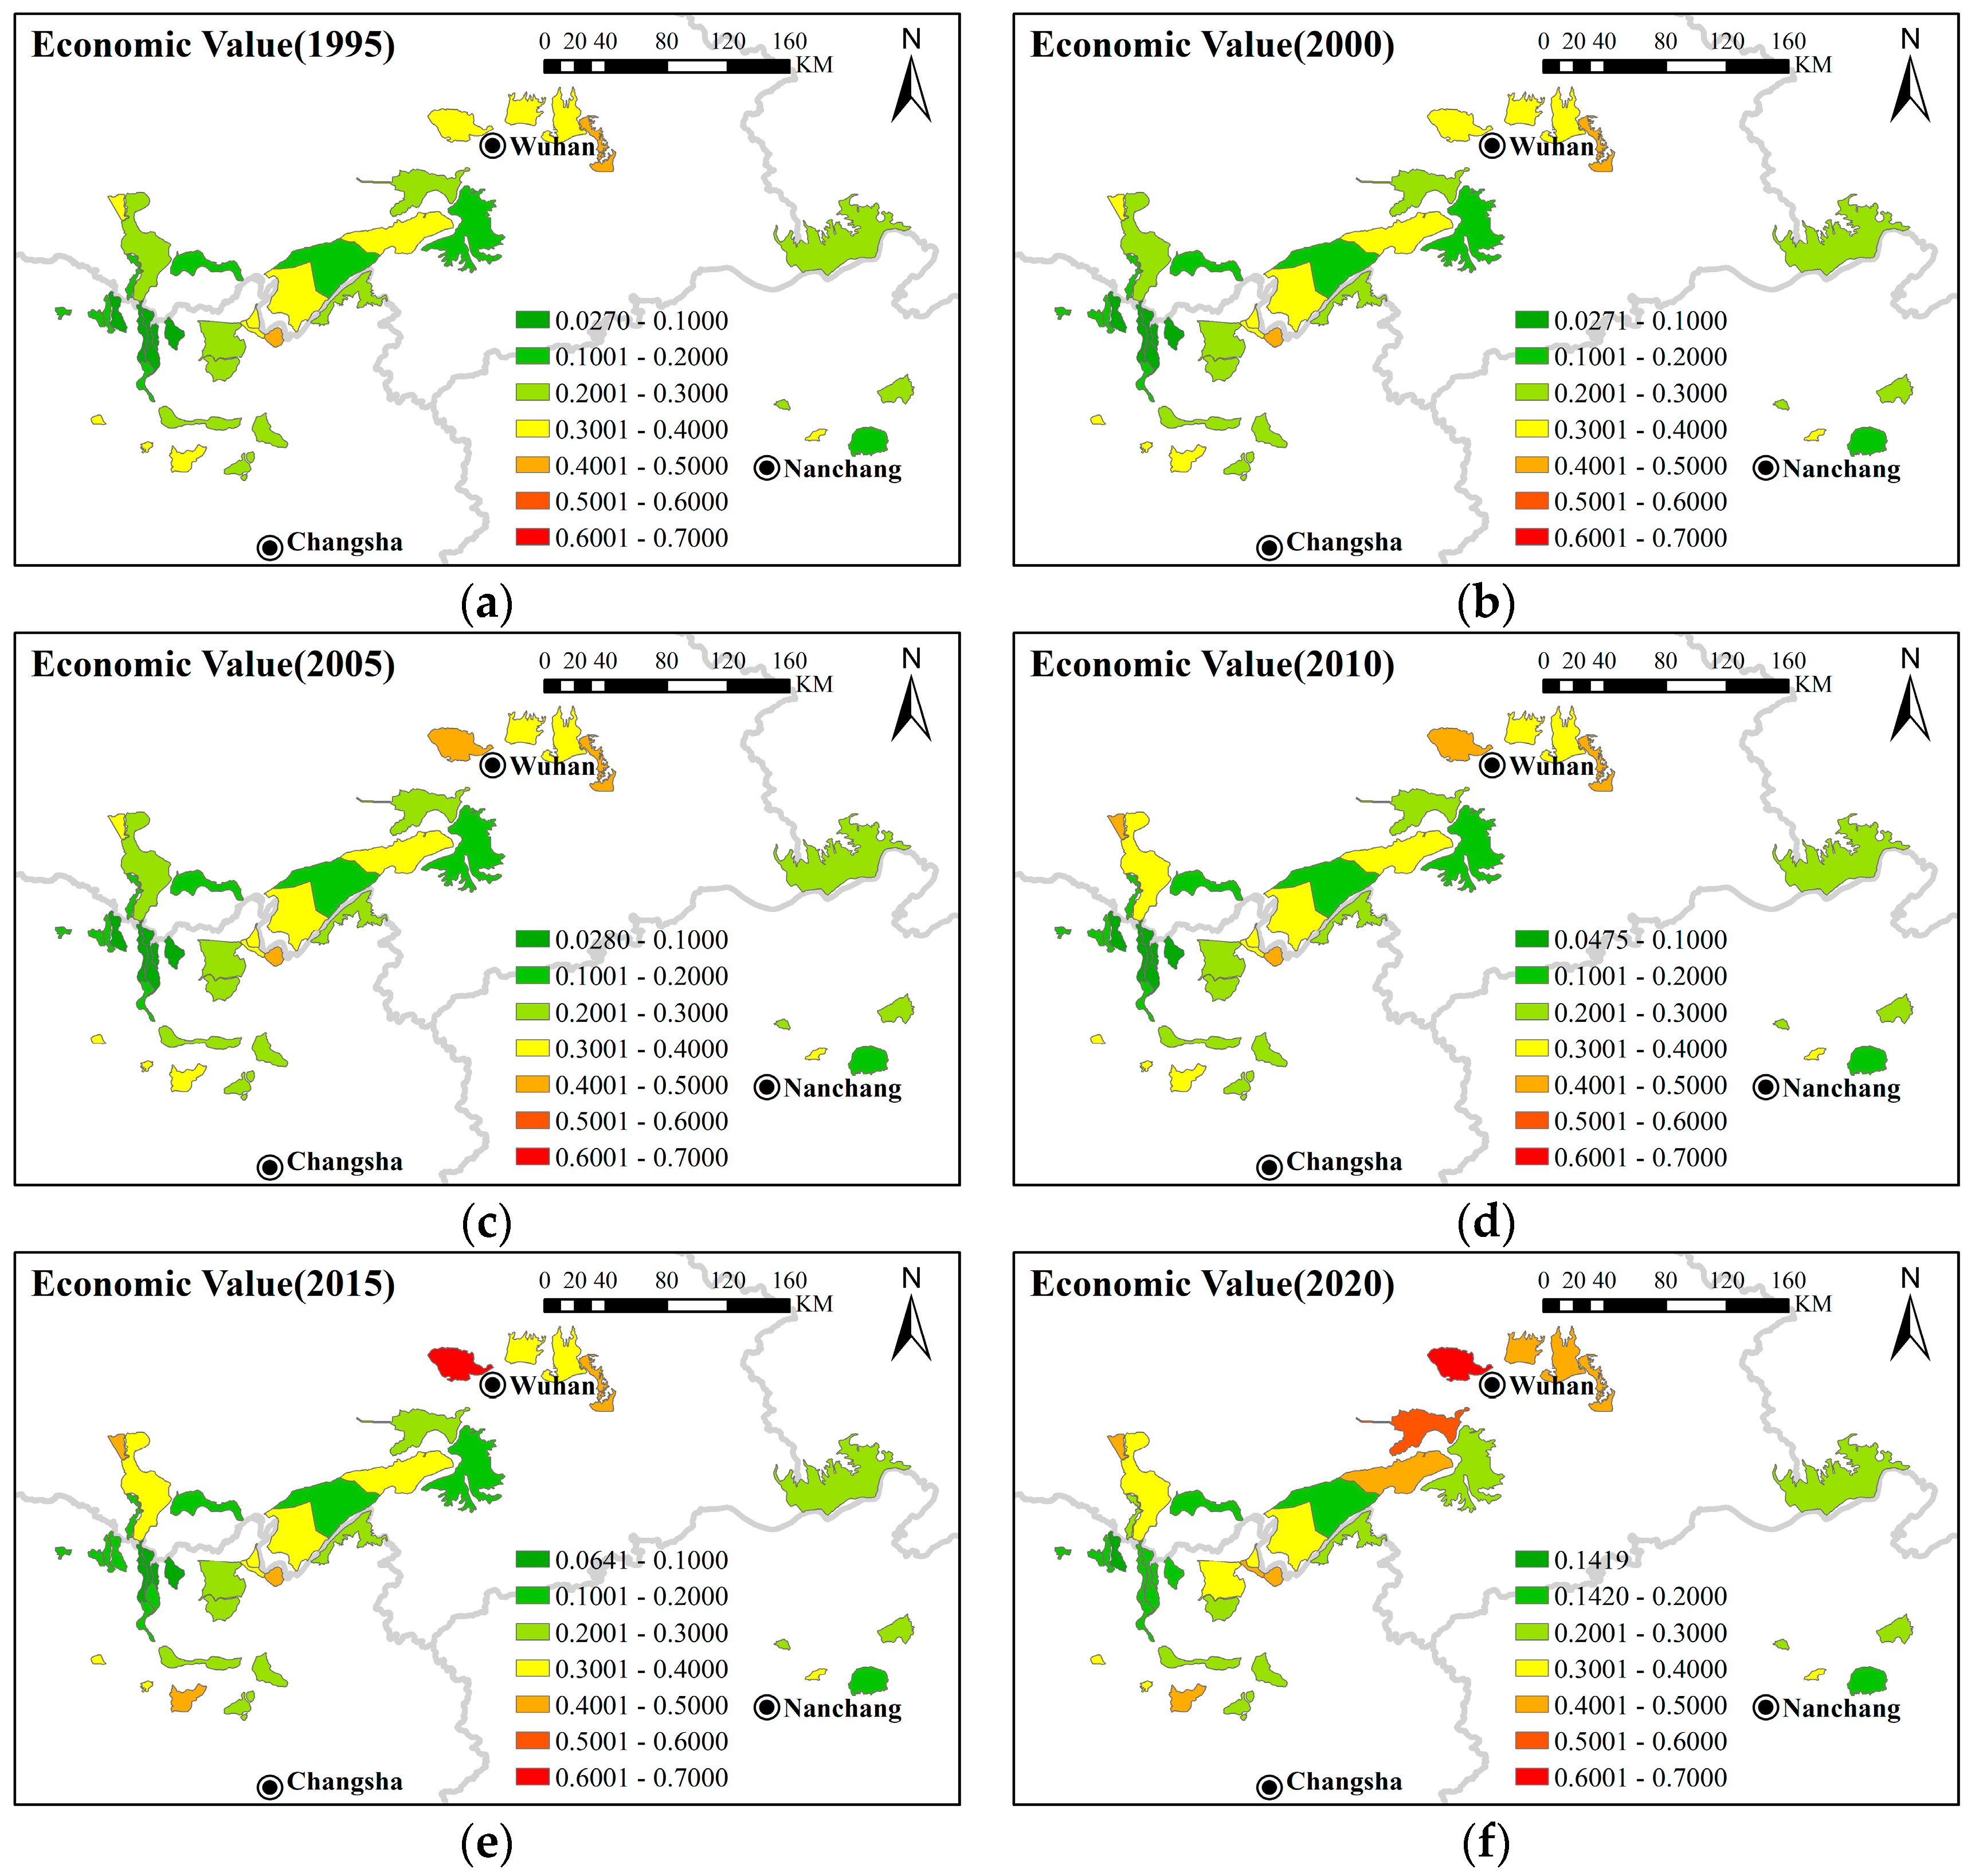
Figure 9 presents the changes in economic value per unit area in the FDAs of the YRB over the course of 25 years. In 1995, these FDAs had relatively low economic values due to limited economic development. However, by the year 2020 significant variations in economic value among different FDAs were observed. FDAs near Wuhan showed notably higher economic values.
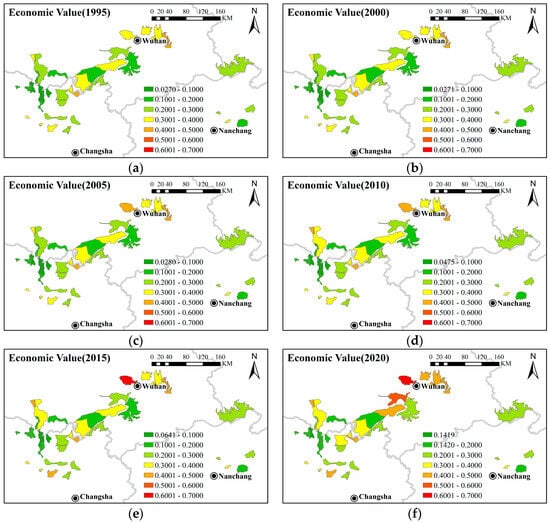
Figure 9.
The change of economic value per unit area in FDAs of the YRB from 1995 to 2020. (a–f) represent the distribution of economic value of each FDA in 1995, 2000, 2005, 2010, 2015, 2020, respectively. More details can be found in Table S7.
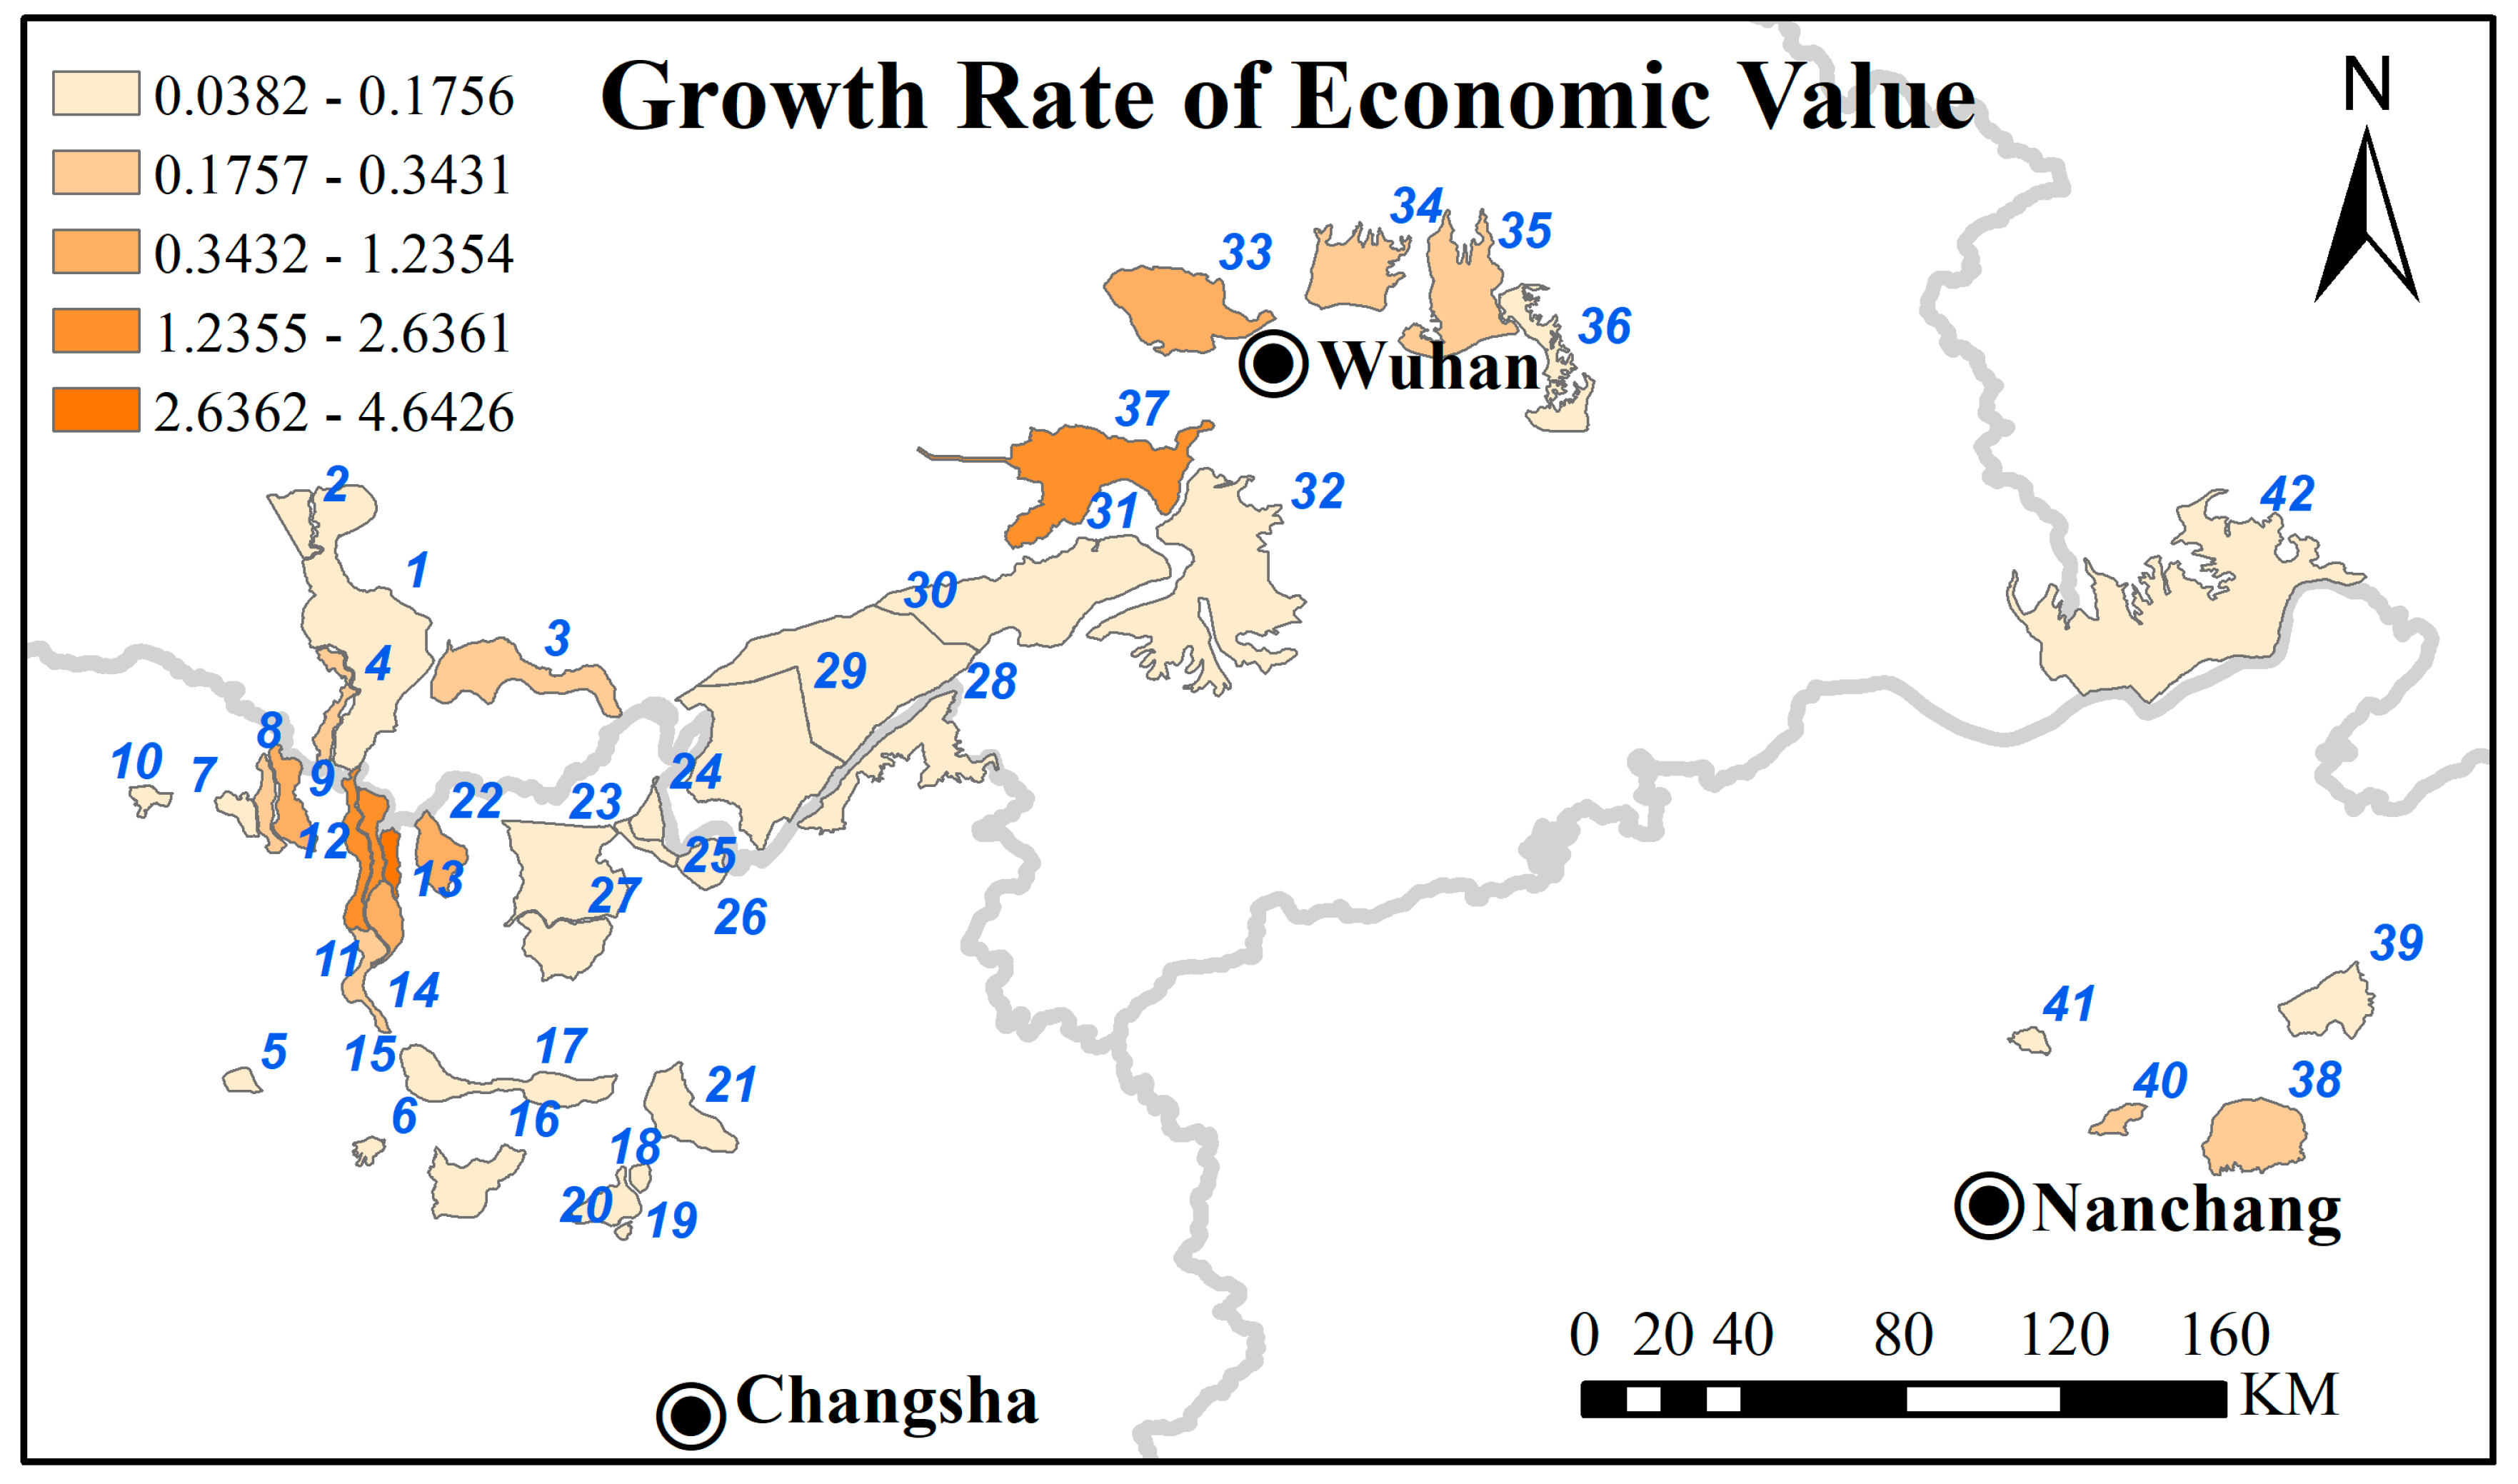
Figure 10 displays the distribution of the change rate in the economic value per unit area in the FDAs of the YRB from 1995 to 2020. During this period, there was an overall increase in the economic value of these areas. The FDAs with notably significant increases are located at the junctions of Jingzhou, Changde, Yiyang, and Yueyang cities, as well as in the vicinity of Wuhan. Although the Nanding FDA and Anhua FDA at these junctions have experienced rapid growth in economic value, their low initial values resulted in lower rankings in the 2020 economic value standings of FDAs. In contrast, the 33—Dongxihu FDA and 34—Wuhu FDA near Wuhan, starting from a higher baseline, achieved substantial economic growth, ranking higher in 2020. Unlike these areas, FDAs like 29—Honghu West FDA, being far from urban centers, not only started with low baselines but also experienced slower economic growth, placing them at the lower end of the economic value rankings in 2020.
Figure 10.
Change rate of economic value per unit area in FDAs of the YRB (1995–2020). (The explanation of the numbers can be seen in Figure 1).
3.3. Verification Results for Flood Control Value
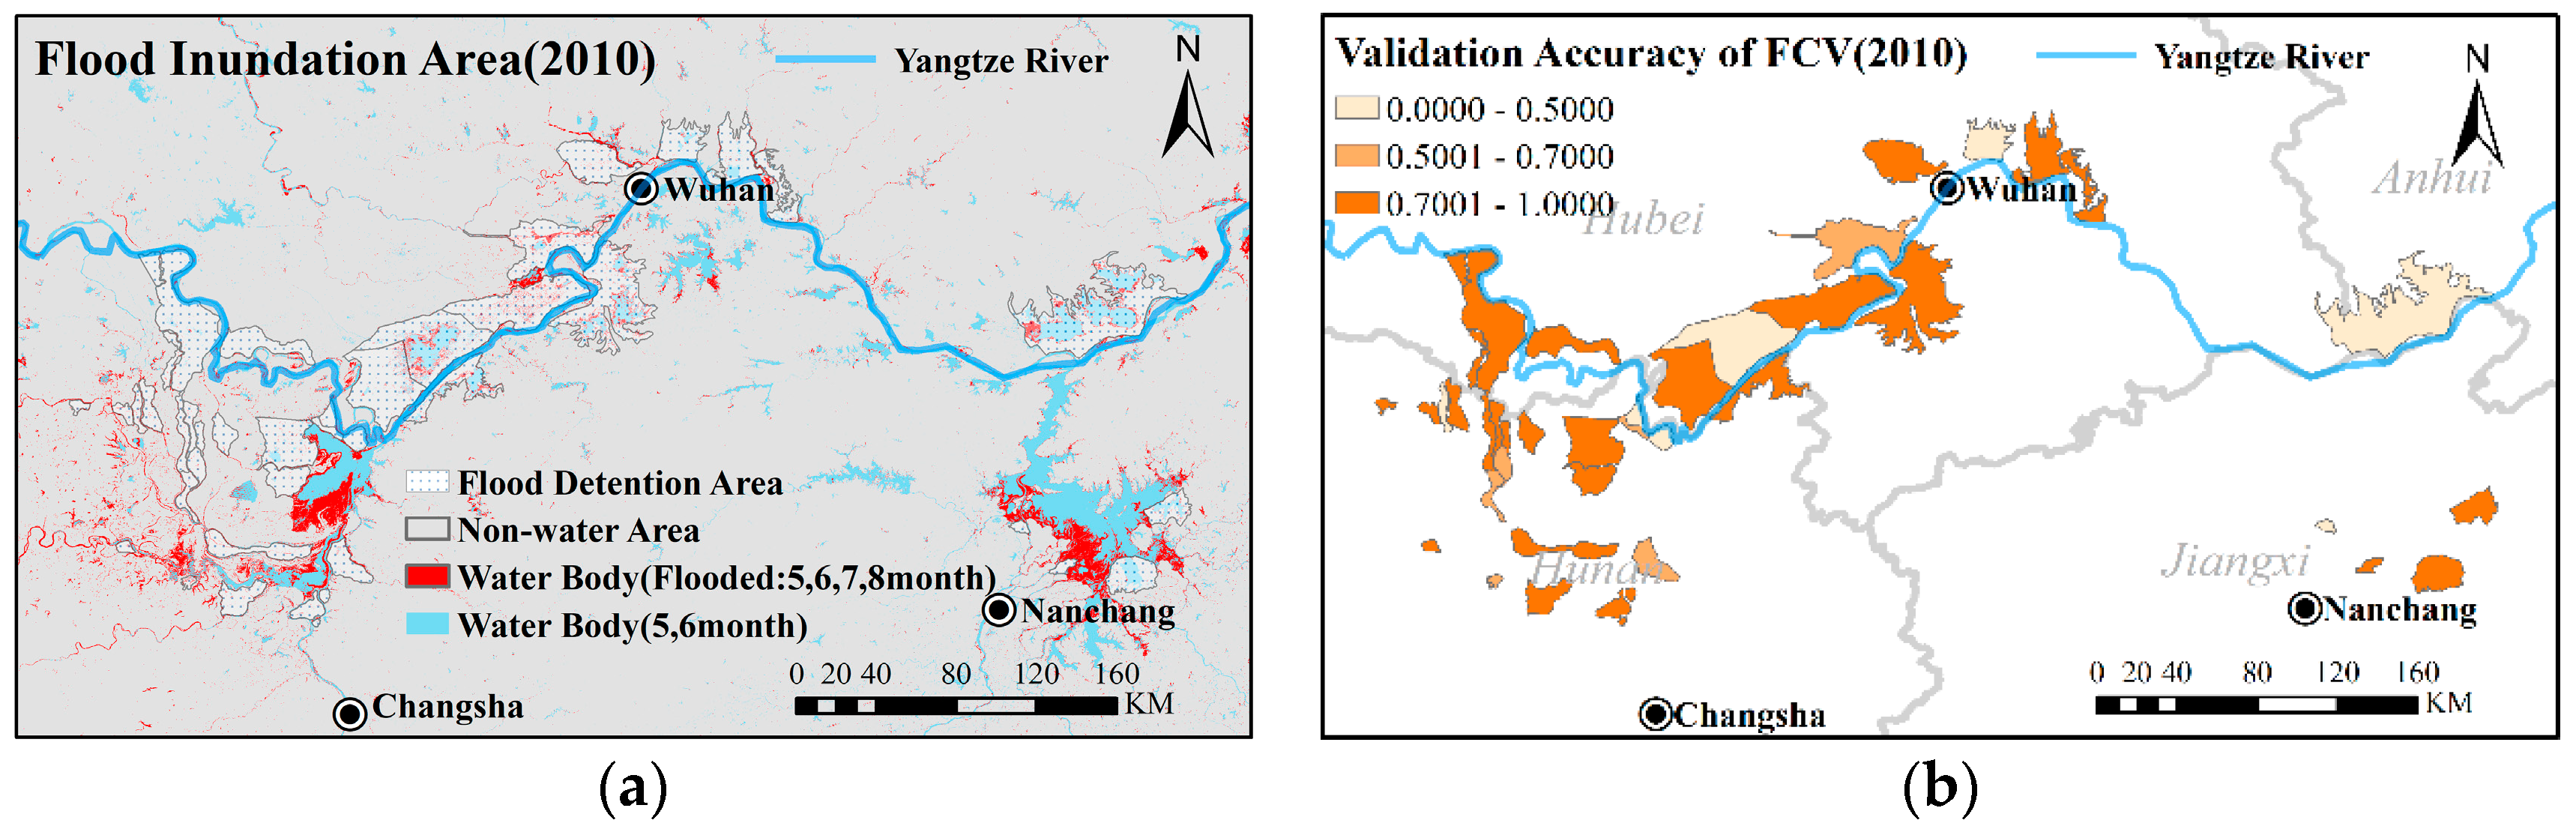
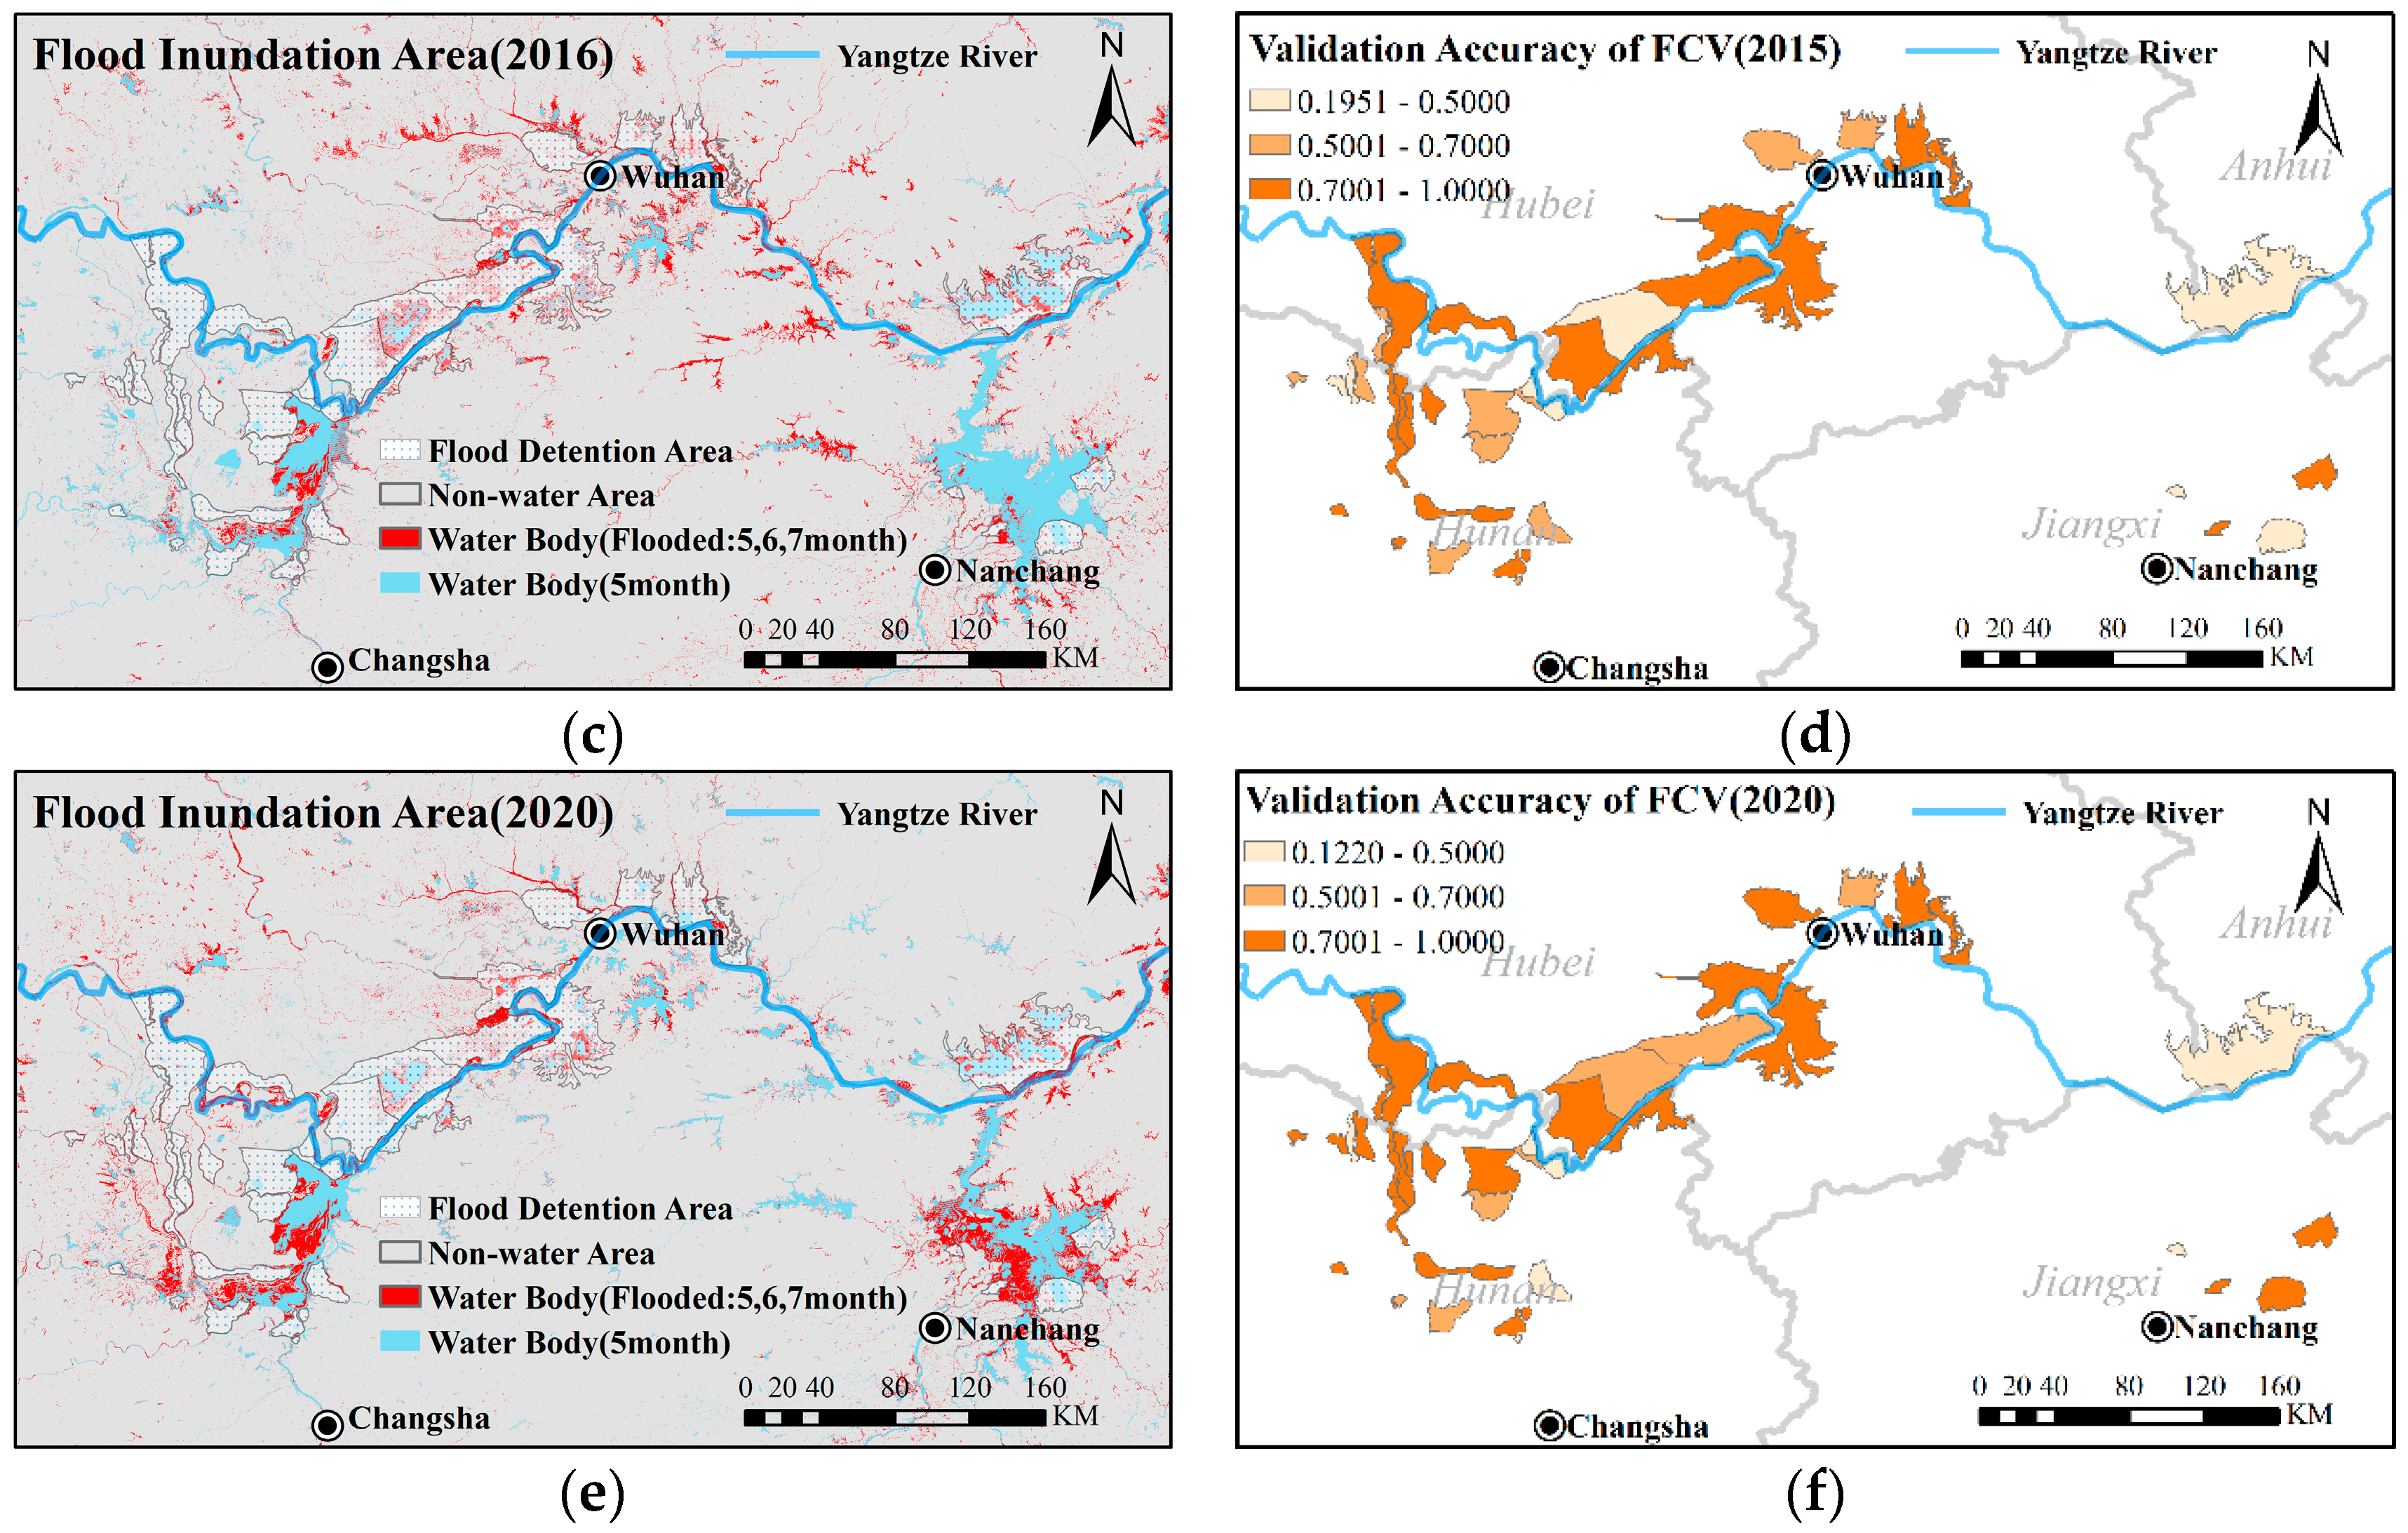
To verify the accuracy of the AHP–EW–TOPSIS model, historical inundation data from three major floods in the YRB in 2010, 2016, and 2020 were selected to validate the flood control value of the FDAs. Flood and surface water data were obtained and processed from the JRC/GSW monthly historical surface water data. Figure 11a,c,e shows the historical inundation patterns in the YRB during these three major flood events. It is important to note that for the months of May and June in 2010 surface water data did not cover the entire study area, so data from May and June 2009 were used as a substitute for the 2010 data. Figure 11b,d,f, however, shows the comparison results of validating the flood control values for each FDA. For ease of display on the map, we use the closeness of two rankings as the indicator, where a value closer to 1 indicates a higher validation accuracy of the FDA.
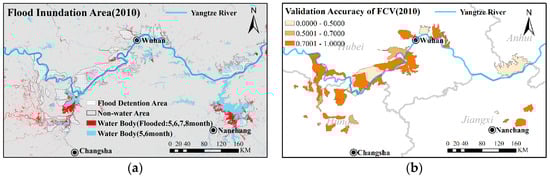
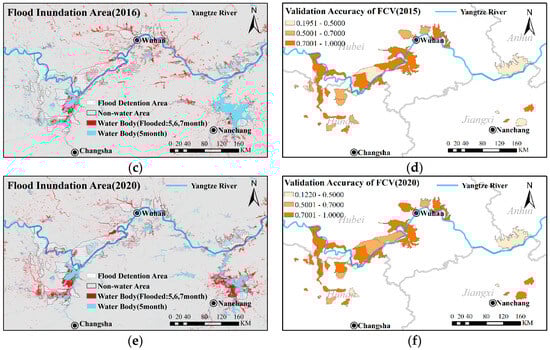
Figure 11.
The results of flood inundation and flood control value validation in the FDAs of the YRB. (a,c,e) represent the historical flood inundation situations in 2010, 2016, and 2020, respectively; (b,d,f) show the validation accuracy of flood control values for each FDA in 2010, 2015, and 2020, respectively. The validation method involves comparing the closeness of the flood control value rankings and the inundation rate rankings for each FDA. A value closer to 1 indicates higher validation accuracy for the FDA. More details about the validation accuracy of FCV can be found in Table S8.
The flood control value of the FDAs was validated based on their rankings in flood control value and the non-water area inundation rate when the flood occurred. The average validation accuracy was above 70%, which mainly confirms the effectiveness of flood control value results. The validation accuracy was obtained by comparing the flood control value rankings of the FDAs with the flood inundation rate rankings. The flood inundation data from the years 2010, 2016, and 2020 were used to validate the flood control values of the FDAs for the years 2010, 2015, and 2020, respectively.
4. Discussion
4.1. Changes in Value of FDAs in Yangtze River Basin
Most of the FDAs in the YRB, established during the 1950s and 1960s, are located in low-lying areas with sparse populations. However, as regional economics developed, there has been a certain degree of population growth within these FDAs. Table 4 compares regional economic developments between the FDAs in the YRB and YRMUA from 1995 to 2020. The values in the table represent the growth rates of various indicators over these 25 years. During this period, the economic development of the FDAs in the YRB was particularly rapid, with the impervious area increasing by 1.8 times and GDP growing by 2.8 times, showing faster development compared to the YRMUA [49].
Table 4.
Comparison of major regional developments between the FDAs in the YRB and YRMUA from 1995 to 2020.
Through several comparative experiments, it has been observed that, as cities expand, the economic development of the surrounding FDAs also accelerates rapidly. The closer an FDA is to a city, the greater the impact it experiences. Large cities have a significantly greater impact on the economic development of FDAs compared to medium and small cities. For instance, in the YRMUA, the most developed city, Wuhan (classified as a new first-tier city according to the “2022 City Commercial Attractiveness Ranking”), experienced an almost 3.3-fold increase in impervious area and an almost 3.1-fold increase in GDP over 25 years in its nearby FDAs. The growth rate of these FDAs even surpassed that of Wuhan itself. The main reason for this discrepancy in development is the relocation of parts of Wuhan’s industrial chain to its adjacent FDAs. In contrast, for slower-developing cities like Jingzhou (a third-tier city), the economic growth rate of its surrounding FDAs was roughly consistent with that of Jingzhou, and lower than the FDAs around Wuhan. As for Nanchang (a second-tier city), which differs from the aforementioned cities, the FDAs nearby developed more slowly than Nanchang over the same period. The primary reason for the developmental disparity between Nanchang and its neighboring FDAs is their distance from the city, resulting in less influence from urban development.
Despite the influence of flood-control policies in the FDAs of the YRB (“Several Suggestions on Strengthening the Construction and Management of Flood Storage and Detention Areas” (Issued on 13 June 2006, by the State Council)), the economic development within these areas has still surpassed that of most surrounding regions. This indicates that the implementation of flood control policies in most FDAs may not be entirely stringent, and the inhibitory effect of flood control policies on economic development is not very pronounced, which is contradictory to the original intention of setting up FDAs. In the event of a major flood, FDAs that do not have completed the flood-control structures will suffer significant losses. Figure 10 provided an overview of the distribution of flood control values in the FDAs of the Yangtze River in 2020. FDAs with higher flood control values are mainly distributed on the left of Jingjiang River, in the central part of Dongting Lake, and in the western region of Wuhan. These FDAs have comparatively well-established flood-control structures, and most have been used in historical major floods. Although the gradual construction of upstream Yangtze River reservoirs [50] has significantly reduced flood control pressure in the middle and lower reaches, these FDAs with higher flood control values remain integral to the current flood control system. Figure 11 depicts the changes in flood control values across the FDAs of the YRB from 1995 to 2020. Regions experiencing a rapid decrease in flood control values are primarily situated around Hong Lake and in the northeastern part of Wuhan. These areas, influenced by urban expansion, have witnessed swift economic development, leading to more pronounced increases in losses when flood-control measures are activated.
Table 5 compares the economic development change of the Jingjiang FDA and the Dongxihu FDA. The Jingjiang FDA, deemed of utmost importance, commenced construction in 1952. It has since witnessed the establishment of floodgates and safety engineering, operating consecutively three times during the extensive Yangtze River flood in 1954. This consistent operation has guaranteed the safety of the Jingjiang embankment and obviously reduced potential losses for major cities in the middle and lower reaches. FDAs of this type should be continuously maintained and continue to regulate their industrial structure. On the other hand, some FDAs have a low probability of activation; the Dongxihu FDA in Wuhan, which has an activation standard exceeding a 200-year return period, has not been used since reclamation efforts began in 1957 [51]. However, spurred on by a re-evaluation of the economic role of Dongxihu District in the “Wuhan City General Plan (2020)”, the economic development of this area has accelerated. Between 1995 and 2020 its GDP increased by almost three times, impervious area increased approximately 5-fold, and the population grew by 50%, surpassing the average of other FDAs. Despite there being a designated safety region within the area, it remains unconstructed and lacks the necessary conditions for activation. Flood vulnerability in FDAs has been significantly increased by socio-economic development, which poses new challenges for balancing flood-risk management and regional development [52].
Table 5.
Comparison of the development of the Jingjiang FDA and Dongxihu FDA (based on night-time light-adjusted data [37]).
Therefore, accurately and effectively assessing the flood control and economic values of FDAs can provide precise data sources for basin construction and economic development, particularly in discussions about the retention or elimination of FDAs under current conditions.
4.2. Analysis of Watershed Development and Flood Management
Through comparative analysis of nine comparative areas, which include the YRMUA and its surrounding FDAs, a growing contradiction between economic development and flood mitigation policies in the YRB was identified. Unlike many developed countries where populations can be readily relocated from FDAs [1], a large population resides in the FDAs of the YRB. Residents in these areas are impacted by flood-mitigation policies, whether or not flooding occurs, and therefore should receive some form of compensation.
Our research further reveals that the economic development potential of the FDAs was significantly underestimated at the time of their establishment, particularly the areas around urban areas. The contribution of these areas to urban development far exceeds the average level of the YRMUA. Therefore, in the current circumstances it might be appropriate to reconsider the selection of FDA sites. The FDAs in the YRB were established with the goal of defending against 1954-type floods. With the gradual construction of a large number of comprehensive hydraulic facilities with flood control functions in the upper reaches of the Yangtze River, as well as the completion of the Three Gorges Project, the flood-control capacity in the YRB has been significantly enhanced [53,54].
To provide planning recommendations for the existing FDAs, the simulation results in three flood dispatch scenarios facing 1954-type floods were selected by our experiment. These conditions include using flood-control structures such as reservoirs and dams. Only the activation status of the FDAs was concerned, and the reservoirs and dams were omitted. Two of these simulations included scenarios for the utilization of FDAs (Plan 1 and Plan 2) [55,56], while the remaining simulation designed two flood control schemes (Plan 3 and Plan 4) [53]. Based on Plans 3 and 4, we designed the activation conditions for the FDAs. In our design, we strived to consider both their flood mitigation value and economic value as much as possible. The design principles are as follows:
- 1.
- Determine the total volume of water that needs to be diverted by the FDAs during flood dispatch. Due to geographical reasons, the FDAs in the YRB are divided into four regions. Each region needs to divert a certain amount of floodwater during flood dispatch. It is necessary to ascertain the volume of water that needs to be diverted in each region.
- 2.
- In each region, the FDAs to be activated are selected based on a ranking of their flood control value and the volume of floodwater they can store. The selection of FDAs is performed in descending order of their flood mitigation value.
- 3.
- Among the FDAs selected in the previous step, consider their economic value ranking. If a basin has a lower economic value, it is chosen; otherwise, the process reverts to step 2. Finally, verify whether the total volume of floodwater stored meets the requirements. If it does, these FDAs are selected.
Our operation of the FDAs minimizes economic loss while ensuring flood protection, striving to balance economic values and flood control values. However, current flood dispatch in FDAs rarely considers these factors. The final activation results are presented in Table 6:
Table 6.
Usage of FDAs in the presence of existing flood control conditions against the 1954 flood.
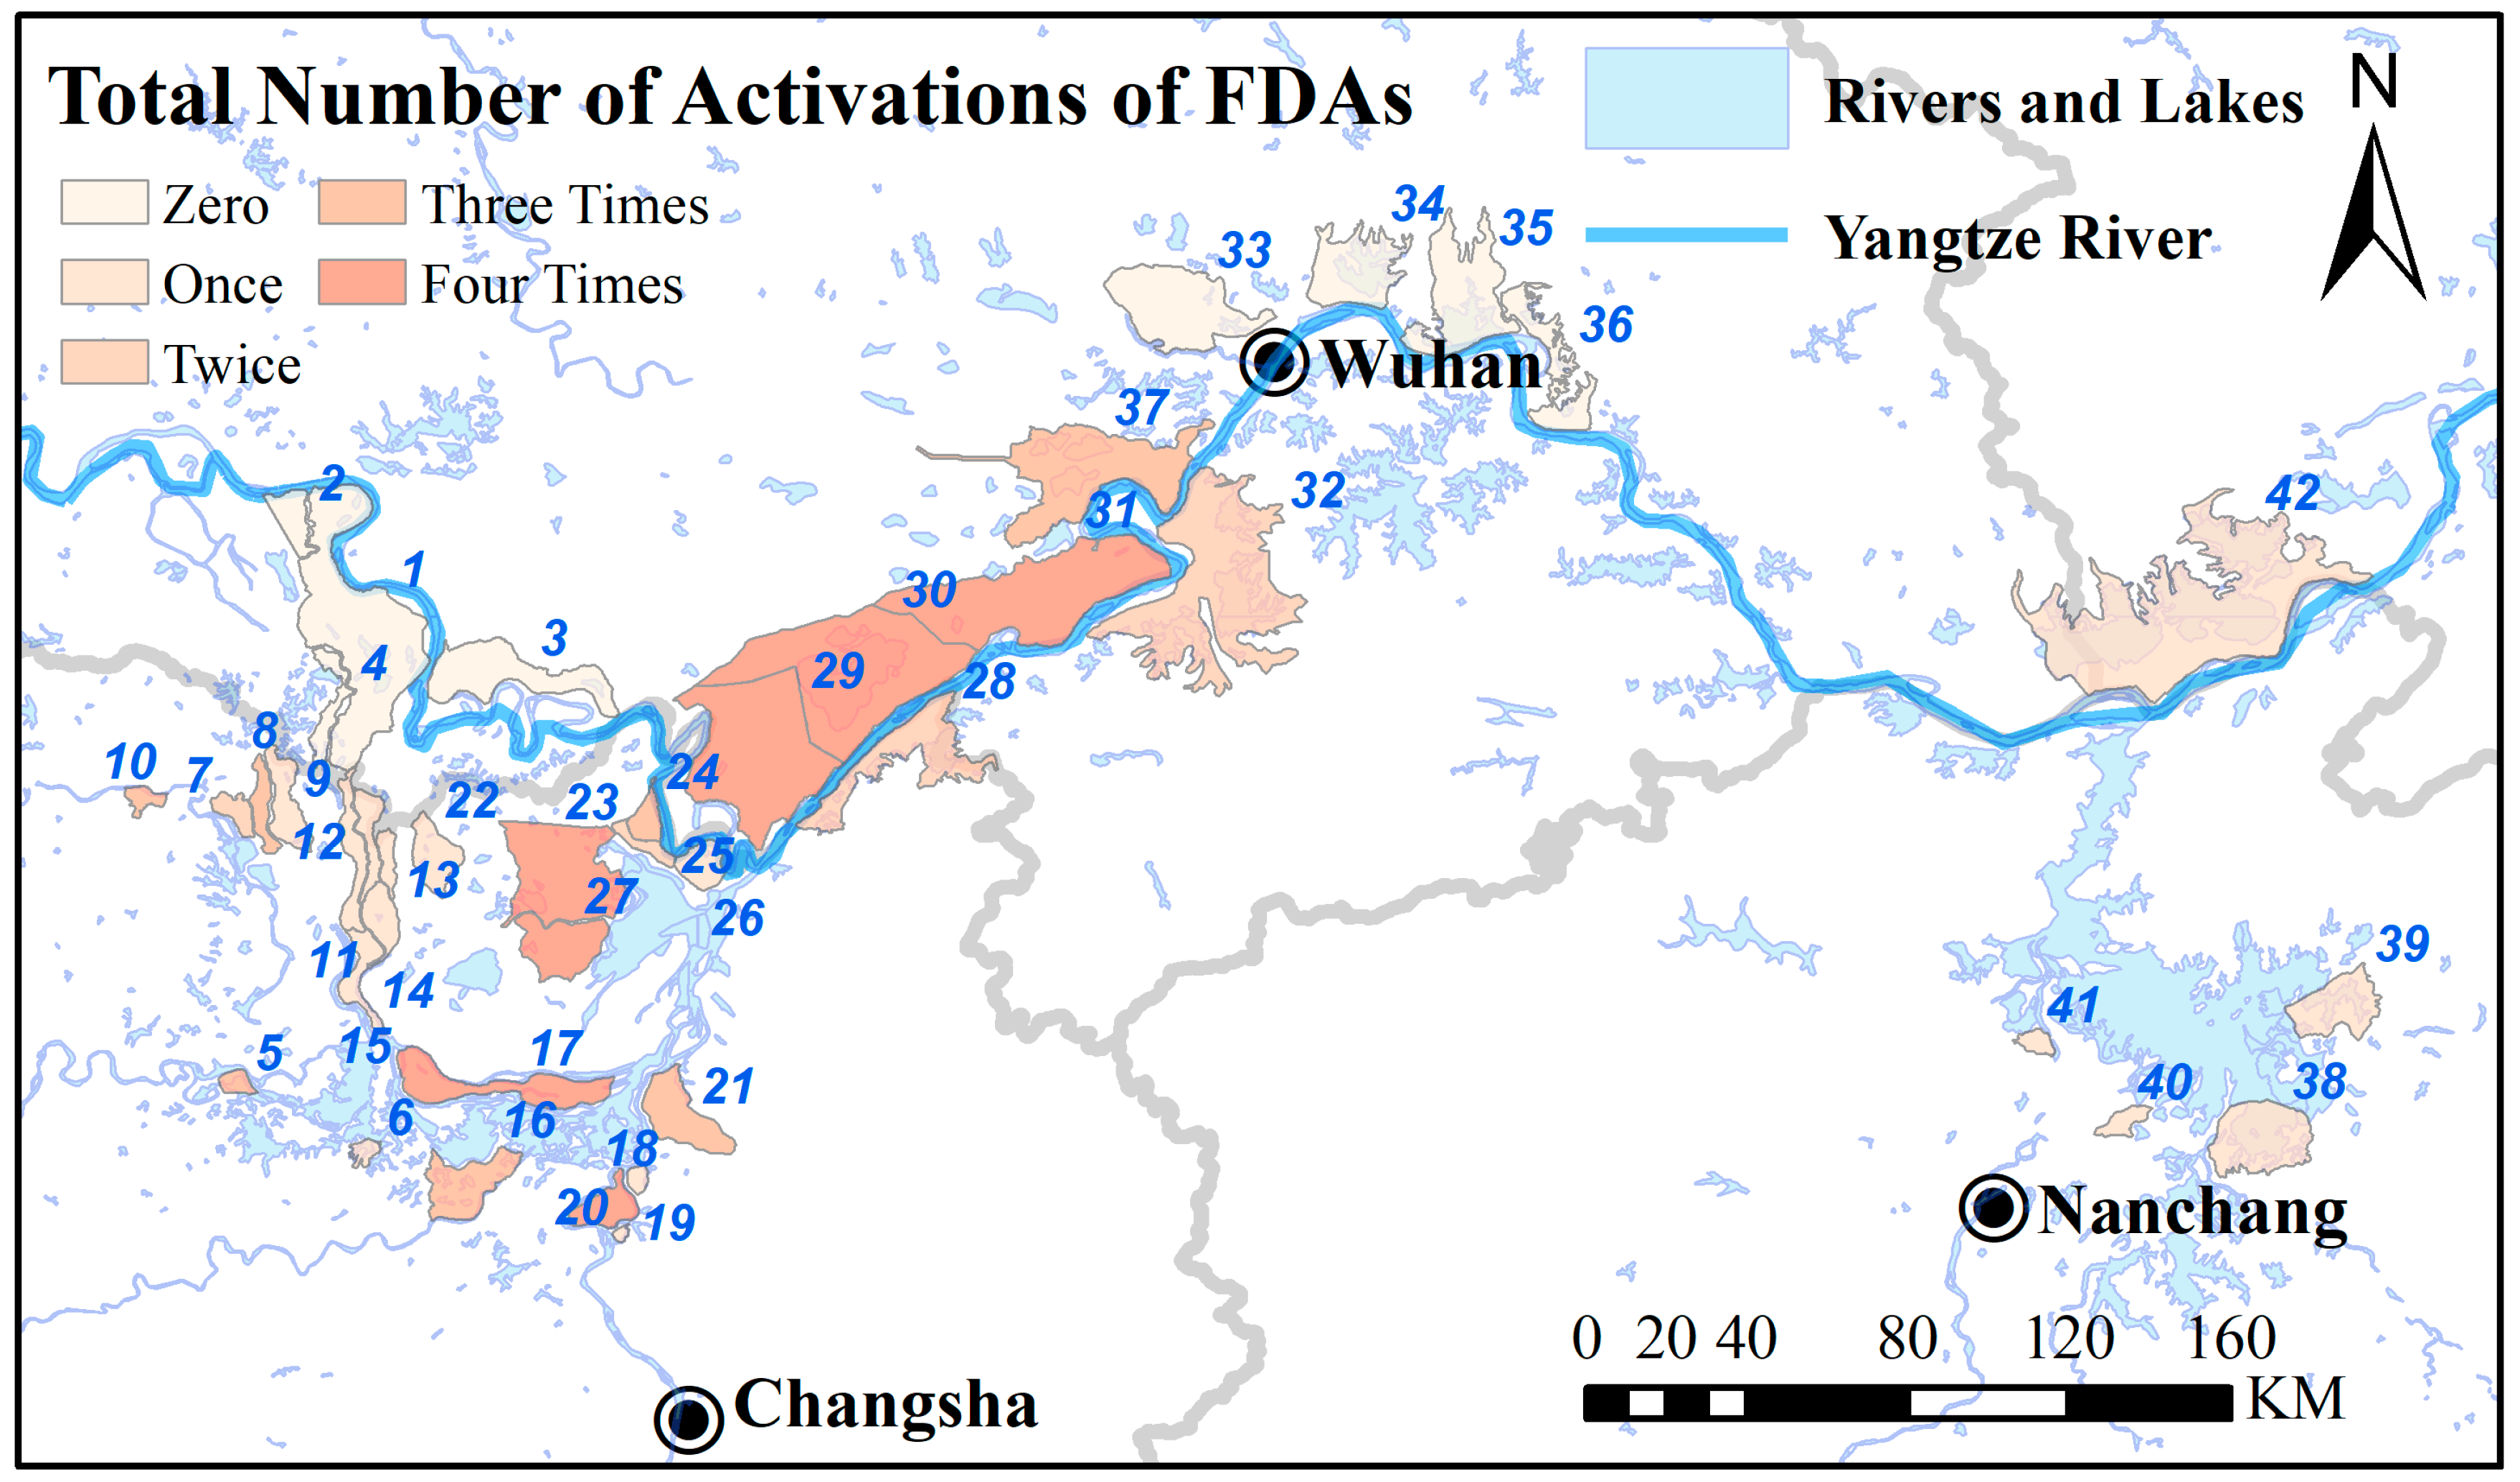
In Figure 12, the total number of activations required for FDAs in four simulated dispatches under existing conditions during a flood similar to the 1954 event is shown. Based on the aforementioned results, we have observed that under current flood control conditions, in the event of a flood similar to that of 1954, effective flood control can be achieved through the combined utilization of embankments, reservoir groups, islands, and FDAs. Some of these FDAs are no longer required. However, due to the impact of human activities and the development along the riverbanks, the flood-carrying capacity of the Yangtze River, from its upper reaches to the middle and lower reaches, as well as in its various tributaries and lakes, has somewhat decreased [30]. The above-mentioned simulations largely did not consider this aspect. In the event of an extraordinary flood, the actual need to utilize FDAs may increase. Consequently, we have chosen to recommend the removal of the flood detention status for three of the FDAs that exhibit the highest economic development potential but relatively limited flood control effectiveness among those that were not utilized in the simulations. Based on our assessments of flood control value and economic value, the prioritization of the removal of FDA labels for the 33—Dongxihu FDA, 36—Baitanhu FDA, and the 2—Woshi FDA has ultimately been chosen by our results. This recommendation is aimed at fostering local economic development.
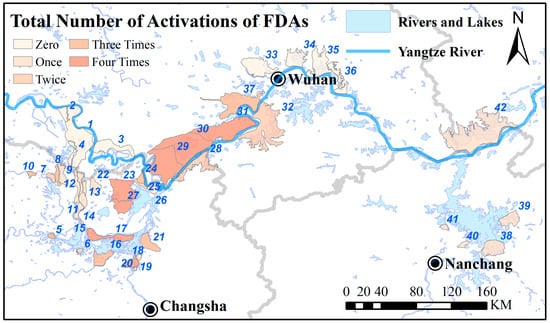
Figure 12.
Utilization of FDAs during the recurrence of the 1954 flood; we represent the FDAs required for activation in the four scheduling simulations on a single map, where the varying shades of different colors indicate the total number of times each FDA needs to be activated across the four simulated dispatches. (The explanation of the numbers can be seen in Figure 1).
During the four simulation scenarios, several FDAs were consistently utilized, including the 29—Honghu West FDA, 30—Honghu Middle FDA, 31—Honghu East FDA, 27—Datonghu East FDA, 18—Chengxi FDA, 23—Qianlianghu FDA, and 17—Gongshuangcha FDA. We recommend strengthening flood-control infrastructure and relocation projects for these areas in preparation for defending against extraordinary floods similar to the one in 1954.
4.3. Limitations and Future Prospects
Despite our evaluation of flood control and economic factors in the FDAs of the YRB and the constructive suggestions we have put forward, there is room for improvement in our experimental results because of data limitations. For instance, we have found slight disparities between the population distribution data we utilized in small regions and the data from national statistical yearbooks during these experiments. This could lead to some degree of deviation in our results. In the future, with more accurate data, the results of our experiment will be modified. Additionally, while we selected parameters with reference to existing research, there still remains a degree of subjectivity. Using a broader set of relevant parameters may enhance the validity of the results. Indeed, the economic development prospects in FDAs, particularly in those near urban areas, present a compelling aspect for examination, and this will be the focus of our forthcoming research [57,58].
Although there are some limitations, a comprehensive analysis of flood control and economic development in the FDAs of the YRB has been provided by our results, offering effective data reference for their construction and development. These findings not only supply effective data sources for policy-making in the FDAs of the YRB, but also offer valuable insights for comprehensive evaluation of economic and flood control within other FDAs or a particular region. Further studies can be conducted based on our research findings, such as selecting suitable FDAs and analyzing their future development scenarios.
Furthermore, the continuous improvement in flood-control measures and the introduction of the concept of sustainable development have promoted the gradual acceptance of these ideas [7]. People have gradually realized the limitations and drawbacks of past management measures. Flood-risk management cannot eliminate all risks, so flood management measures are shifting toward more sustainable strategies. The development of FDAs also needs to move toward sustainability, balancing economic benefits within the area while enhancing flood management resilience.
5. Conclusions
Influenced by urban expansion, the contradictions between economic development and flood-control policies within the FDAs of the YRB are gradually intensifying [59]. In order to explore the role of these FDAs in watershed development and flood management, we analyzed the economic development factors of the YRMUA and the FDAs in the basin. Subsequently, the economic and flood control values of these FDAs were assessed using the AHP–EW–TOPSIS comprehensive evaluation method. Our findings can be summarized as follows:
- 1.
- The lack of alignment between regional policies and the actual development needs at the local level is evident, as indicated by the fact that flood control policies within the FDAs do not significantly hinder their economic development. This deviation from the initial intent behind establishing these areas highlights a notable discrepancy in the understanding and implementing policies.
- 2.
- The considerable underestimation of the economic development potential of FDAs, particularly in areas surrounding cities, underscores a discrepancy with the initial expectations at the time of their establishment. These areas have proven to contribute significantly more to urban development than the average in the YRMUA. Geographical factors introduce notable variations in the economic development levels and rates among various FDAs.
- 3.
- The observed strong correlation between the flood control value indicators and the extent of non-water area inundation during major flood events suggests a potential avenue for further exploration. Future studies could deeply study the subtle relationship between flood control value and inundation rates to enhance our understanding of their interplay.
In conclusion, our study has examined the overall and specific aspects of the economic and flood control factors within the FDAs of the YRB. The findings underscore the need for better alignment between regional policies and local development needs, as well as a more accurate assessment of economic potential within these areas. This study provides valuable data to support policy formulation for these areas, offers insights into other flood-control structures’ assessments, and serves SDG 10.1 and 11.5. Emphasizing the significance enables the prudent utilization of the FDAs, fostering regional sustainable development.
Supplementary Materials
The following supporting information can be downloaded at: https://www.mdpi.com/article/10.3390/ijgi13040122/s1, Table S1: The flood detention areas; Table S2: The changes of proportion of impervious; Table S3: The growth rate of impervious; Table S4: The changes in GDP per unit area in nine comparative regions from 1995 to 2020, measured in ten thousand yuan per square kilometer; Table S5: The changes in GDP growth rate in nine comparative regions from 1995 to 2020; Table S6: The comparison of flood control value distribution of FDA in YRB; Table S7: The change of economic value per unit area in FDA of YRB from 1995 to 2020; Table S8: The validation accuracy of FCV.
Author Contributions
Conceptualization, Siyuan Liao and Chao Wang; methodology, Siyuan Liao and Chao Wang; software, Siyuan Liao; validation, Siyuan Liao; formal analysis, Siyuan Liao; investigation, Siyuan Liao and Wei Wang; resources, Wei Wang and Nengcheng Chen; data curation, Renke Ji; writing—original draft preparation, Siyuan Liao and Nengcheng Chen; writing—review & editing, Chao Wang, Xiang Zhang, Zhifei Wang and Nengcheng Chen; visualization, Siyuan Liao and Chao Wang; supervision, Wei Wang and Nengcheng Chen; project administration, Chao Wang and Nengcheng Chen; funding acquisition, Nengcheng Chen. All authors have read and agreed to the published version of the manuscript.
Funding
This research was funded by the National Key Research and Development Program of China (2023YFC3209101), the National Nature Science Foundation of China Program (No. 41890822), the CRSRI Open Research Program (Program SN: CKWV20231198/KY), Open Fund of Hubei Luojia Laboratory (2201000059), Special Fund of Hubei Luojia Laboratory (220100034), the Open Fund of National Engineering Research Center for Geographic Information System, China University of Geosciences, (Grant No. 2022KFJJ07), Pre-research Project of SongShan Laboratory (YYYY062022001), and the Fundamental Research Funds for the Central Universities, China University of Geosciences (Wuhan).
Data Availability Statement
The data presented in this study are available upon request from the corresponding author.
Conflicts of Interest
The authors declare no conflicts of interest.
References
- Terêncio, D.P.S.; Fernandes, L.F.S.; Cortes, R.M.V.; Moura, J.P.; Pacheco, F.A.L. Flood risk attenuation in critical zones of continental Portugal using sustainable detention basins. Sci. Total Environ. 2020, 721, 137727. [Google Scholar] [CrossRef] [PubMed]
- Bellu, A.; Sanches Fernandes, L.F.; Cortes, R.M.V.; Pacheco, F.A.L. A framework model for the dimensioning and allocation of a detention basin system: The case of a flood-prone mountainous watershed. J. Hydrol. 2016, 533, 567–580. [Google Scholar] [CrossRef]
- Vorogushyn, S.; Lindenschmidt, K.-E.; Kreibich, H.; Apel, H.; Merz, B. Analysis of a detention basin impact on dike failure probabilities and flood risk for a channel-dike-floodplain system along the river Elbe, Germany. J. Hydrol. 2012, 436–437, 120–131. [Google Scholar] [CrossRef]
- Wang, K.; Wang, Z.; Liu, K.; Cheng, L.; Bai, Y.; Jin, G. Optimizing flood diversion siting and its control strategy of detention basins: A case study of the Yangtze River, China. J. Hydrol. 2021, 597, 126201. [Google Scholar] [CrossRef]
- Zhang, X.; Song, Y. Optimization of wetland restoration siting and zoning in flood retention areas of river basins in China: A case study in Mengwa, Huaihe River Basin. J. Hydrol. 2014, 519, 80–93. [Google Scholar] [CrossRef]
- Wang, Y.; Li, N.; Yu, Q.; Wang, J.; Ding, Z.; Han, S. Research on the issues and measures of construction and management of flood storage and detention areas in China. China Flood Drought Manag. 2022, 32, 1–7. [Google Scholar] [CrossRef]
- Wang, L.; Cui, S.; Li, Y.; Huang, H.; Manandhar, B.; Nitivattananon, V.; Fang, X.; Huang, W. A review of the flood management: From flood control to flood resilience. Heliyon 2022, 8, e11763. [Google Scholar] [CrossRef] [PubMed]
- Zhang, J.; Yu, Z.; Yu, T.; Si, J.; Feng, Q.; Cao, S. Transforming flash floods into resources in arid China. Land Use Policy 2018, 76, 746–753. [Google Scholar] [CrossRef]
- Lyu, H.-M.; Xu, Y.-S.; Cheng, W.-C.; Arulrajah, A. Flooding Hazards across Southern China and Prospective Sustainability Measures. Sustainability 2018, 10, 1682. [Google Scholar] [CrossRef]
- Mudashiru, R.B.; Sabtu, N.; Abustan, I.; Balogun, W. Flood hazard mapping methods: A review. J. Hydrol. 2021, 603, 126846. [Google Scholar] [CrossRef]
- Maranzoni, A.; D’Oria, M.; Rizzo, C. Quantitative flood hazard assessment methods: A review. J. Flood Risk Manag. 2023, 16, e12855. [Google Scholar] [CrossRef]
- Qi, W.; Ma, C.; Xu, H.; Chen, Z.; Zhao, K.; Han, H. A review on applications of urban flood models in flood mitigation strategies. Nat. Hazards 2021, 108, 31–62. [Google Scholar] [CrossRef]
- Rahman, M.S.; Di, L. A Systematic Review on Case Studies of Remote-Sensing-Based Flood Crop Loss Assessment. Agriculture 2020, 10, 131. [Google Scholar] [CrossRef]
- Birkinshaw, S.J.; Krivtsov, V. Evaluating the Effect of the Location and Design of Retention Ponds on Flooding in a Peri-Urban River Catchment. Land 2022, 11, 1368. [Google Scholar] [CrossRef]
- Ha, H.; Bui, Q.D.; Nguyen, H.D.; Pham, B.T.; Lai, T.D.; Luu, C. A practical approach to flood hazard, vulnerability, and risk assessing and mapping for Quang Binh province, Vietnam. Environ. Dev. Sustain. 2023, 25, 1101–1130. [Google Scholar] [CrossRef]
- Rözer, V.; Kreibich, H.; Schröter, K.; Müller, M.; Sairam, N.; Doss-Gollin, J.; Lall, U.; Merz, B. Probabilistic Models Significantly Reduce Uncertainty in Hurricane Harvey Pluvial Flood Loss Estimates. Earth’s Future 2019, 7, 384–394. [Google Scholar] [CrossRef]
- Kourtis, I.M.; Tsihrintzis, V.A.; Baltas, E. A robust approach for comparing conventional and sustainable flood mitigation measures in urban basins. J. Environ. Manag. 2020, 269, 110822. [Google Scholar] [CrossRef] [PubMed]
- Meng, Y.; Zhang, H.; Jiang, P.; Guan, X.; Yan, D. Quantitative assessment of safety, society and economy, sustainability benefits from the combined use of reservoirs. J. Clean. Prod. 2021, 324, 129242. [Google Scholar] [CrossRef]
- Zhao, M.; Liu, Y.; Wang, Y.; Chen, Y.; Ding, W. Effectiveness assessment of reservoir projects for flash flood control, water supply and irrigation in Wangmo Basin, China. Sci. Total Environ. 2022, 851, 157918. [Google Scholar] [CrossRef]
- Assaad, R.H.; Assaf, G.; Boufadel, M. Optimizing the maintenance strategies for a network of green infrastructure: An agent-based model for stormwater detention basins. J. Environ. Manag. 2023, 330, 117179. [Google Scholar] [CrossRef]
- Saaty, T.L. A scaling method for priorities in hierarchical structures. J. Math. Psychol. 1977, 15, 234–281. [Google Scholar] [CrossRef]
- Pathan, A.I.; Girish Agnihotri, P.; Said, S.; Patel, D. AHP and TOPSIS based flood risk assessment- a case study of the Navsari City, Gujarat, India. Environ. Monit. Assess. 2022, 194, 509. [Google Scholar] [CrossRef] [PubMed]
- Lyu, H.-M.; Zhou, W.-H.; Shen, S.-L.; Zhou, A.-N. Inundation risk assessment of metro system using AHP and TFN-AHP in Shenzhen. Sustain. Cities Soc. 2020, 56, 102103. [Google Scholar] [CrossRef]
- Dadrasajirlou, Y.; Karami, H.; Mirjalili, S. Using AHP-PROMOTHEE for Selection of Best Low-Impact Development Designs for Urban Flood Mitigation. Water Resour. Manag. 2023, 37, 375–402. [Google Scholar] [CrossRef]
- Liu, Z.; Jiang, Z.; Xu, C.; Cai, G.; Zhan, J. Assessment of provincial waterlogging risk based on entropy weight TOPSIS–PCA method. Nat. Hazards 2021, 108, 1545–1567. [Google Scholar] [CrossRef]
- Ma, S.; Lyu, S.; Zhang, Y. Weighted clustering-based risk assessment on urban rainstorm and flood disaster. Urban Clim. 2021, 39, 100974. [Google Scholar] [CrossRef]
- Song, J.Y.; Chung, E.-S. Robustness, Uncertainty and Sensitivity Analyses of the TOPSIS Method for Quantitative Climate Change Vulnerability: A Case Study of Flood Damage. Water Resour. Manag. 2016, 30, 4751–4771. [Google Scholar] [CrossRef]
- Zhang, H.; Yang, J.; Li, L.; Shen, D.; Wei, G.; Khan, H.u.R.; Dong, S. Measuring the resilience to floods: A comparative analysis of key flood control cities in China. Int. J. Disaster Risk Reduct. 2021, 59, 102248. [Google Scholar] [CrossRef]
- Xu, Z. Binding the Dragon to Catch the Turtle: 70 Years of Flood Control and Disaster Reduction in the Yangtze River; Changjiang Publishing House: Wuhan, China, 2019. [Google Scholar]
- Xia, J.; Chen, J. A new era of flood control strategies from the perspective of managing the 2020 Yangtze River flood. Sci. China Earth Sci. 2021, 64, 1–9. [Google Scholar] [CrossRef]
- Zhong, Z.; Wang, X. Atlas of Flood Storage and Detention Areas in the Yangtze River Basin; Science Press: Beijing, China, 2007. [Google Scholar]
- Yang, J.; Huang, X. The 30 m annual land cover dataset and its dynamics in China from 1990 to 2019. Earth Syst. Sci. Data 2021, 13, 3907–3925. [Google Scholar] [CrossRef]
- ASTER Global Digital Elevation Model V003. Available online: https://lpdaac.usgs.gov/products/astgtmv003/ (accessed on 4 January 2024).
- Pekel, J.-F.; Cottam, A.; Gorelick, N.; Belward, A.S. High-resolution mapping of global surface water and its long-term changes. Nature 2016, 540, 418–422. [Google Scholar] [CrossRef]
- Xu, X. GDP Density Data are from the Kilometre-Grid Data Set of GDP Spatial Distribution of China. 2017. [Google Scholar] [CrossRef]
- Xu, X. Population Density Data are from the Kilometre-Grid Data Set of GDP Spatial Distribution of China. 2017. [Google Scholar] [CrossRef]
- Chen, J.; Gao, M.; Cheng, S.; Hou, W.; Song, M.; Liu, X.; Liu, Y. Global 1 km × 1 km gridded revised real gross domestic product and electricity consumption during 1992–2019 based on calibrated nighttime light data. Sci. Data 2022, 9, 202. [Google Scholar] [CrossRef] [PubMed]
- Peking University. National Main Road Dataset 2000. Available online: https://geodata.pku.edu.cn/ (accessed on 4 January 2024).
- European Commission. Directive 2007/60/EC of the European Parliament and of the Council of 23 October 2007 on the Assessment and Management of Flood Risks. Available online: http://data.europa.eu/eli/dir/2007/60/oj (accessed on 4 January 2024).
- Pham, B.T.; Luu, C.; Phong, T.V.; Nguyen, H.D.; Le, H.V.; Tran, T.Q.; Ta, H.T.; Prakash, I. Flood risk assessment using hybrid artificial intelligence models integrated with multi-criteria decision analysis in Quang Nam Province, Vietnam. J. Hydrol. 2021, 592, 125815. [Google Scholar] [CrossRef]
- Hu, J. The Research of Fast Assessment and Compensation in Exertion Loss of Store Floodwater Area. Master’s Thesis, Hohai University, Nanjing, China, 2005. [Google Scholar]
- Yang, C.; Li, H.; Xu, G.; Xiang, X.; Yang, D. A Measure to the Building Density and Floor Area Ratio of Rural Settlements Based on Da Jiang Unmanned Aerial Vehicle Remote Sensing. Mt. Res. 2019, 37, 144–150. [Google Scholar] [CrossRef]
- Bao, M.; Huang, R. Characteristics of the Interdecadal Variations of Heavy Rain over China in the Last 40 Years. Chin. J. Atmos. Sci. 2006, 30, 1057–1067. [Google Scholar]
- Yuan, X. The Analysis of Spatial and Temporal Evolution Patterns of Urban-Suburb-Countryside in the Middle Yangtze River Basin Urban Agglomeration; Wuhan University: Wuhan, China, 2022. [Google Scholar]
- Liu, Y.; Luo, T.; Liu, Z.; Kong, X.; Li, J.; Tan, R. A comparative analysis of urban and rural construction land use change and driving forces: Implications for urban–rural coordination development in Wuhan, Central China. Habitat Int. 2015, 47, 113–125. [Google Scholar] [CrossRef]
- Feng, Y.; Wang, X.; Du, W.; Liu, J.; Li, Y. Spatiotemporal characteristics and driving forces of urban sprawl in China during 2003–2017. J. Clean. Prod. 2019, 241, 118061. [Google Scholar] [CrossRef]
- Norén, V.; Hedelin, B.; Nyberg, L.; Bishop, K. Flood risk assessment—Practices in flood prone Swedish municipalities. Int. J. Disaster Risk Reduct. 2016, 18, 206–217. [Google Scholar] [CrossRef]
- Ma, M.; Zhao, G.; He, B.; Li, Q.; Dong, H.; Wang, S.; Wang, Z. XGBoost-based method for flash flood risk assessment. J. Hydrol. 2021, 598, 126382. [Google Scholar] [CrossRef]
- Zhang, G.; Zheng, D.; Wu, H.; Wang, J.; Li, S. Assessing the role of high-speed rail in shaping the spatial patterns of urban and rural development: A case of the Middle Reaches of the Yangtze River, China. Sci. Total Environ. 2020, 704, 135399. [Google Scholar] [CrossRef]
- Sun, H.; He, D.; Sui, X.; Chen, Y. Predicting impacts of future climate change and hydropower development towards habitats of native and non-native fishes. Sci. Total Environ. 2020, 707, 135419. [Google Scholar] [CrossRef] [PubMed]
- Wang, J.; Li, N.; Ding, Z.; GUAN, C. Flood risk zoning method in flood storage and detention areas and typical case study. China Flood Drought Manag. 2022, 32, 8–14. [Google Scholar] [CrossRef]
- Thakur, D.A.; Mohanty, M.P. A synergistic approach towards understanding flood risks over coastal multi-hazard environments: Appraisal of bivariate flood risk mapping through flood hazard, and socio-economic-cum-physical vulnerability dimensions. Sci. Total Environ. 2023, 901, 166423. [Google Scholar] [CrossRef] [PubMed]
- Yu, Y.; Liu, Z.; Dong, P.; Lei, X.; You, F.; Yang, Z. Research on reverse order impoundment mode of cascade reservoir flood control system: Case study on upper reaches of Yangtze River. J. Hydrol. 2022, 605, 127348. [Google Scholar] [CrossRef]
- Fang, H.; Han, D.; He, G.; Chen, M. Flood management selections for the Yangtze River midstream after the Three Gorges Project operation. J. Hydrol. 2012, 432–433, 1–11. [Google Scholar] [CrossRef]
- Shan, Y.; Zhongqiong, Y.; Anqiang, L. Study on effects of present upstream flood control system in Changjiang River against 1954 flood. Yangtze River 2018, 49, 9–14+26. [Google Scholar] [CrossRef]
- Xiao, Z.; Yurong, L.; Wenjing, N. Strategy of water projects joint operation program on upper-middle reaches of Changjiang River for controlling 1954 flood under current conditions. Yangtze River 2020, 51, 141–148. [Google Scholar] [CrossRef]
- Zhang, R.; Zhang, X. Spatial–Temporal Differentiation and the Driving Mechanism of Rural Transformation Development in the Yangtze River Economic Belt. Sustainability 2022, 14, 2584. [Google Scholar] [CrossRef]
- Zhang, J.-X.; Cheng, J.-W.; Philbin, S.P.; Ballesteros-Perez, P.; Skitmore, M.; Wang, G. Influencing factors of urban innovation and development: A grounded theory analysis. Environ. Dev. Sustain. 2023, 25, 2079–2104. [Google Scholar] [CrossRef]
- Li, S.; Nadolnyak, D.; Hartarska, V. Agricultural land conversion: Impacts of economic and natural risk factors in a coastal area. Land Use Policy 2019, 80, 380–390. [Google Scholar] [CrossRef]

Disclaimer/Publisher’s Note: The statements, opinions and data contained in all publications are solely those of the individual author(s) and contributor(s) and not of MDPI and/or the editor(s). MDPI and/or the editor(s) disclaim responsibility for any injury to people or property resulting from any ideas, methods, instructions or products referred to in the content. |
© 2024 by the authors. Licensee MDPI, Basel, Switzerland. This article is an open access article distributed under the terms and conditions of the Creative Commons Attribution (CC BY) license (https://creativecommons.org/licenses/by/4.0/).