Article

Spatiotemporal Analysis of Water Body in the Chongming Island Region over the Past Decade Based on the ISUNet Model

1
School of Internet of Things, Nanjing University of Posts and Telecommunications, Nanjing 210023, China
2
Smart Health Big Data Analysis and Location Services Engineering Research Center of Jiangsu Province, Nanjing University of Posts and Telecommunications, Nanjing 210023, China
*
Author to whom correspondence should be addressed.
ISPRS Int. J. Geo-Inf. 2024, 13(4), 134; https://doi.org/10.3390/ijgi13040134
Submission received: 18 February 2024 / Revised: 7 April 2024 / Accepted: 14 April 2024 / Published: 17 April 2024

Abstract

:
Chongming Island and its surrounding areas are highly significant coastal regions in China. However, the regions undergo continuous changes owing to various factors, such as the sedimentation from the Yangtze River, human activities, and tidal movements. Chongming Island is part of the Yangtze River Delta, which is one of the most economically developed regions in China. Studying the water body changes in this area is of great importance for decision making in water resource conservation, coastal resource management, and ecological environmental protection. In this study, we propose an improved ISUNet model by enhancing the skip-connection operations in the traditional UNet architecture. We extracted and analyzed the water bodies in Chongming Island and its surrounding areas from 2013 to 2022, providing a detailed spatiotemporal analysis of the water body area over the years. The results indicate that the water body area in the study area has decreased by 267.8 km2 over the past decade, showing a gradually fluctuating downward trend with an average annual reduction of nearly 27 km2. The analysis suggests that the reduction in the water body area is mainly attributed to sedimentation near river channels and ports, the formation of sandbars owing to channel erosion, and the artificial construction of ports and coastal areas. The influencing factors include human activities and sedimentation from the Yangtze River Estuary. Specifically, human activities such as land reclamation, port construction, and aquaculture play a major role in causing changes in the area.

1. Introduction

With the development of industrialization and urbanization, including the influence of climate change, significant changes are occurring in surface water bodies, and many regions are facing issues of drought and water scarcity. Thus, water conservation has become an urgent priority. For instance, in 2022, Poyang Lake, the largest freshwater lake in China, experienced a phenomenon known as “dry lake”. This phenomenon led to survival challenges for organisms inhabiting the lake and garnered widespread attention domestically and internationally.
Alterations in the size of water bodies result in corresponding changes in the shoreline. These dynamic shoreline changes have a direct impact on marine resources and the ecological environment in coastal areas, potentially leading to ecological degradation. Additionally, human economic activities and transportation are affected [1], along with a range of associated problems. Examples include the degradation of ecosystem services, heightened environmental pollution, scarcity of biological resources, and an increase in the frequency of climate and marine disasters [2,3,4,5,6]. Rapid population growth and coastal development are the primary driving forces of marine habitat degradation. For instance, the addition of concrete structures like seawalls, jetties, and groins can accelerate the erosion and loss of beaches and tidal wetlands [
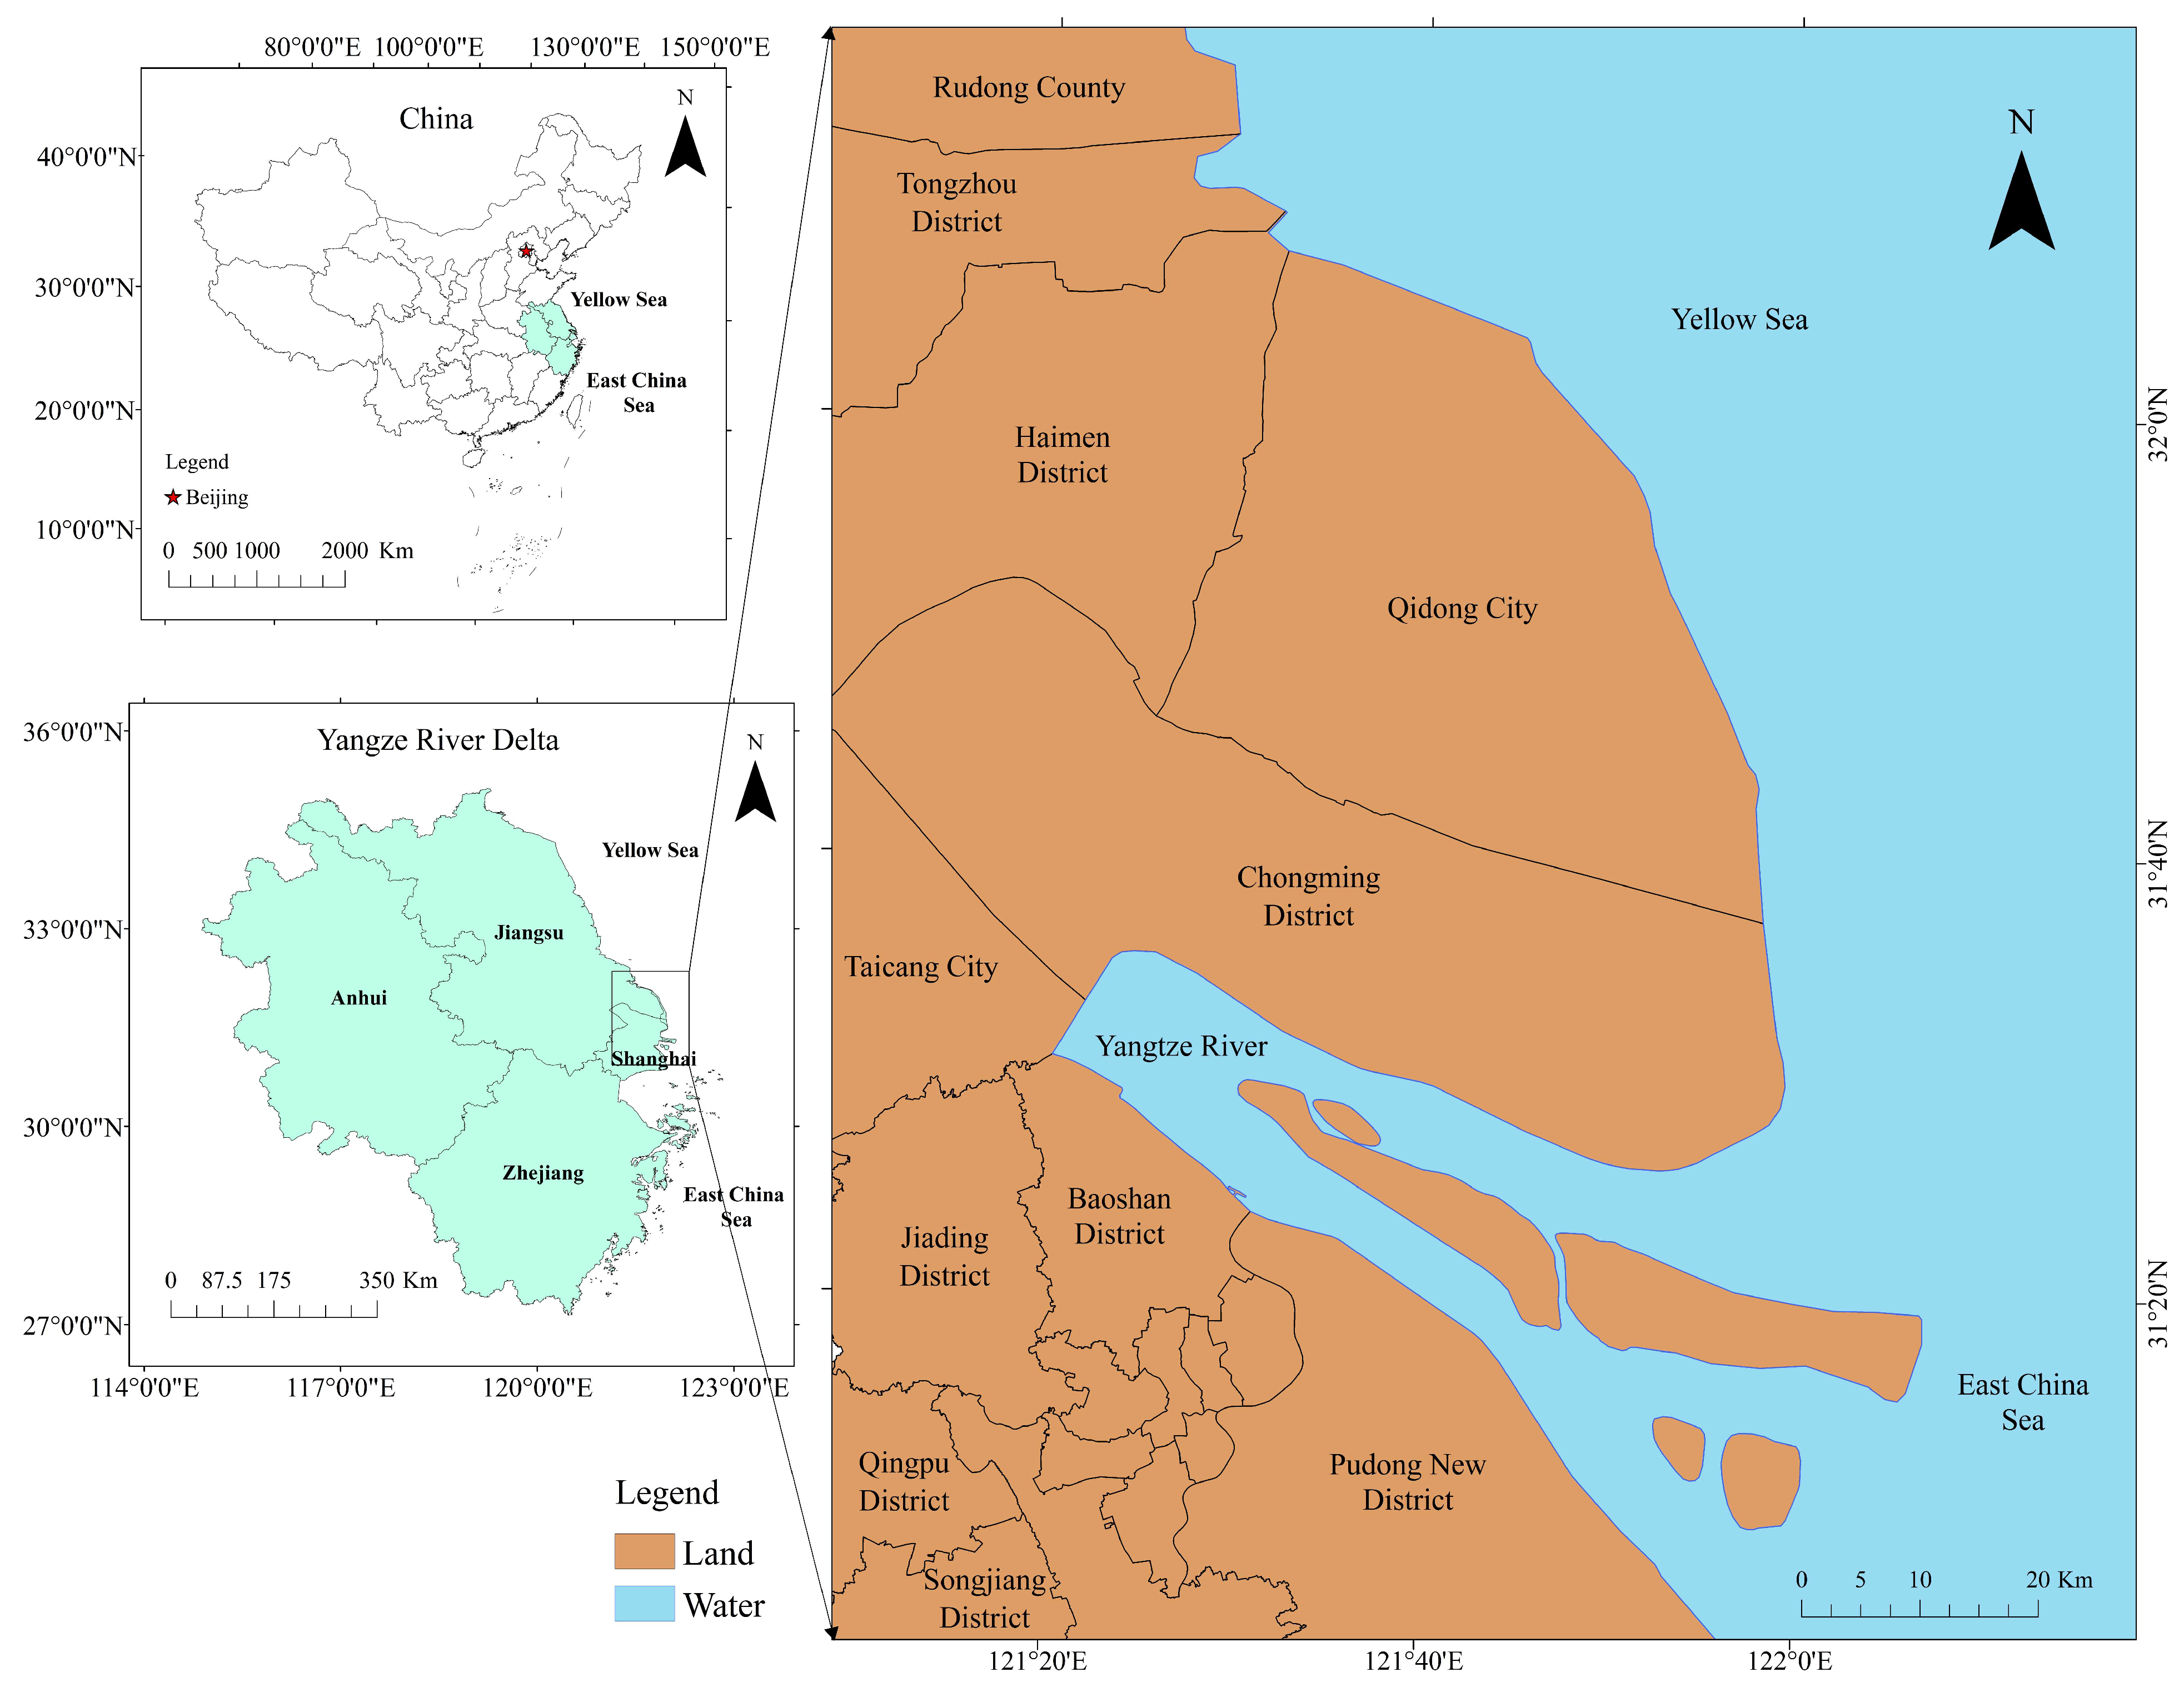
7]. Relevant studies indicate that the area of Chongming Island increased obviously, accompanied by a notable expansion of built-up areas from 1979 to 2009. Most of the expansion area of the island is added to urbanization and rural settlement development, wetland, and the body of water. The temporal evolution of the built-up areas is highly correlated with the population change [8]. Therefore, it is beneficial to support the efficient use of marine resources and promote the development of ecological civilization by studying the dynamic changes of the body of water, which will be a reference for promoting good management of marine resources in China.
Two main methods are used for studying dynamic changes in water bodies using remote sensing images: visual and automatic interpretation. Visual interpretation, although highly accurate with continuous extraction results, is limited to small areas and is subject to operator bias, making this method less efficient. By contrast, automatic interpretation offers timeliness and reusability, making this method the preferred approach for identifying water boundaries and extracting remote sensing information about water bodies [9]. This method enables fast and efficient processing of large remote sensing image datasets, making automatic interpretation the primary focus of current research. Scholars worldwide have extensively studied automatic interpretation methods based on remote sensing images, primarily employing threshold segmentation and remote sensing image classification techniques to extract water body information.

1.1. Water Body Extraction Based on the Threshold Segmentation Method

The threshold segmentation method, commonly used to extract water bodies from images, involves selecting a threshold value of a band or band combination to delineate between water and non-water pixels in an image or images. Compared with the threshold segmentation method, the image classification method generally achieves the purpose of improving the recognition accuracy by improving the structure of the neural network. In the threshold segmentation method, most scholars improve the segmentation effect by modifying and optimizing the bands in the water body index. One widely used index is the normalized difference water index (NDWI G r e e n N i r G r e e n + N i r ), initially proposed by McFeeters et al. [10]. NDWI is a modification of the normalized difference vegetation index (NDVI N i r R N i r + R ) and has gained widespread adoption. For instance, Ghosh et al. [11] utilized satellite images of Thematic Mapper (TM) and Enhanced Thematic Mapper from Landsat satellites. In addition, they applied the improved modified normalized difference water index (MNDWI G r e e n M i r G r e e n + M i r ) algorithm to identify water bodies and land, allowing for the analysis of spatial and temporal variations in the coastal zone of Hatia Island over a specific period. In another study, Yang et al. [12] substituted the green band in NDWI with the first principal component of selected principal component analysis transforms and the blue band (wavelengths ranging from 450 to 520 nm) of ZY-3 multispectral image data. They developed two water indices called the new normalized difference water index 1(NNDWI1 B l u e N i r B l u e + N i r ) and new normalized difference water index 2 (NNDWI2 C o m p o n e n t 1 N i r C o m p o n e n t 1 + N i r ), NNDWI1 is sensitive to turbid water bodies, and NNDWI2 is sensitive to water bodies with spectral information affected by vegetation. Additionally, they employed a shadow detection technique to remove shadows in small areas of the segmentation results. This approach achieved high accuracy in water edge detection and maintained relative stability with changes in the threshold value, resulting in the precise extraction of water bodies.
Feyisa et al. [13] introduced a novel automated water extraction index (AWEI) to mitigate environmental noise effects and enhance the classification accuracy of water bodies. They successfully applied this method to Landsat 5 TM images from various study areas in Denmark, Switzerland, Ethiopia, South Africa, and New Zealand, achieving improved accuracy and robustness in water body extraction. Wang et al. [14] utilized the NDWI and MNDWI to analyze and explore the spatial and temporal variation characteristics of the Ningbo coastline. Viaña-Borja et al. [15] proposed an automatic method for water body index-based shoreline detection in multispectral Landsat images. Their approach demonstrated excellent performance in automatically detecting shorelines, achieving a minimum deviation value of −0.91 m and standard deviations ranging from ±4.7 to ±7.29 m in some cases. Luo et al. [16] devised an automated method for water body extraction by combining the segmentation and classification on whole and local scales, respectively. They fused the hierarchical knowledge of water extraction and set up an iterative algorithm to achieve a gradual approach of the water body’s optimal margin. While this iterative approach improved the results, it was noted that the segmentation and buffering methods may not be entirely sufficient. Xu modified the NDWI to enhance the features of open water bodies in remote sensing images. This modification enables rapid and accurate differentiation between water and non-water features. However, it only detects the presence of water and cannot distinguish between rivers, lakes, or other types of water bodies [17]. In response to the limitations of previous water body extraction methods that rely on single models or solely spectral information, Qiao et al. [18] proposed an adaptive water body extraction method. Their approach combines the NDWI, histogram threshold segmentation, and area growth methods to accurately extract water body information.
Thresholds are typically set as constant values, but the presence of ambient noise, such as shadows, forests, built-up areas, snow, and clouds, makes using a fixed threshold for different environmental regions challenging. Tri Dev Acharya et al. [19] evaluated the effectiveness of commonly used water body-related indices, including NDVI, NDWI, MNDWI, and AWEI, in extracting water bodies from a Landsat 8 scene in Nepal. They found that none of the methods could accurately extract the entire surface water in the scene. This finding highlights the limitations of using fixed thresholds for water body extraction in the presence of environmental noise.

1.2. Water Body Extraction Based on the Image Classification Method

Unlike threshold segmentation, which requires dividing thresholds, remote sensing image classification methods usually extract spatial features of images to achieve classification, mainly including traditional machine learning as well as deep learning, which is a subset of machine learning that excels at processing unstructured data.
Machine learning methods have diverse applications in remote sensing image classification, including road extraction, urban functional area extraction, and target detection. Researchers have conducted numerous studies using machine learning methods to extract information on water bodies. For example, Zeinali et al. [20] studied coastline changes in Chabahar Bay from 1972 to 2014 using the maximum likelihood classification method to extract water bodies from remote sensing images. Possa et al. [21] utilized an SVM classifier with a 95% probability threshold to separate water from land in small reservoirs and estimated partial water areas using probabilistic maps. Zhang et al. [22] employed the decision tree classification method to extract water body information from Operational Land Imager remote sensing data, demonstrating its higher accuracy compared with automatic computer classification methods.
Despite achieving water body information extraction, the aforementioned research methods have some limitations in their algorithms. Threshold-based image segmentation methods are sensitive to image noise, resulting in low extraction accuracy when a minimal grayscale difference exists. Thus, additional methods are necessary to meet extraction requirements. Traditional machine learning image classification methods based on image elements can lead to low classification accuracy and incomplete classification edges, particularly when dealing with complex spectra and fine structures. These problems show that for optical remote sensing images with few bands, high resolution, and data with confusing interclass difference and intraclass difference in features, the key to processing is understanding how to express and learn features efficiently.
Deep learning methods based on neural networks offer advantages over threshold segmentation and traditional machine learning methods. They effectively extract spectral and spatial features through convolutional operations, yielding improved results for water extraction from remote sensing images. The UNet neural network model, proposed by Ronneberger et al. [23] in 2015, is a fully convolutional network that enables image semantic segmentation. Compared with other methods, the UNet neural network model exhibits better performance even with smaller datasets, resulting in more accurate segmentation outcomes, thereby providing new insights for water body extraction from remote sensing images. In 2018, Li et al. [24] proposed DeepUNet, an improved version of UNet, to enhance the accuracy of convolutional neural networks in recognizing water bodies in remotely sensed images. Additionally, Kim et al. [25] employed UNet with a pyramidal pooling layer and achieved a pixel accuracy of 87.61% and an intersection over union (IOU) of 79.52% for four target types, namely buildings, roads, water, and background, using a training dataset of 72,400 and a test dataset of 9600 samples.
In 2022, An and Rui [26] introduced an Improved Lightweight U-Net specifically designed for remote sensing images. This model reduced the number of downsampling layers to accommodate the low resolution of remote sensing images. Additionally, the bottleneck structure was updated to ensure the effective transmission of water feature information within the model. Zhang et al. [27] proposed a hybrid MixFormer architecture called MU-Net by embedding the MixFormer block into UNet. The combination of CNN and MixFormer is used to model the local spatial detail information and global contextual information of the image to improve the ability of the network to capture semantic features of the water body. MU-Net exhibits higher pixel precision and accurate positional information in identifying water bodies. However, it is important to note that the data annotation process for this method is very laborious and time-consuming, while semi-supervised learning can achieve similar performance using only a small amount of labeled data. Li et al. [28] constructed a robust water extraction network called PA-UNet by introducing attention block and pyramid module into the UNet. When applying this method to Sentinel-1 data for water extraction in Dongting Lake and Poyang Lake, the results showed that the proposed framework can realize high-precision, highly efficient automatic water extraction. However, in cold-weather areas, rivers will freeze in winter, and the backscattering intensity of rivers in SAR image is high, so SAR images are not suitable for water extraction during the river icing period.
Most existing studies applying the UNet network for water extraction from remote sensing images focused on clear water bodies in small regional rivers and lakes. However, they do not consider water margins with sediment accumulation and turbid water bodies, such as beach islands and sea inlets. Additionally, the repeated use of maximum pooling operations in the UNet architecture can result in resolution reduction and potential loss of spatial information [29].
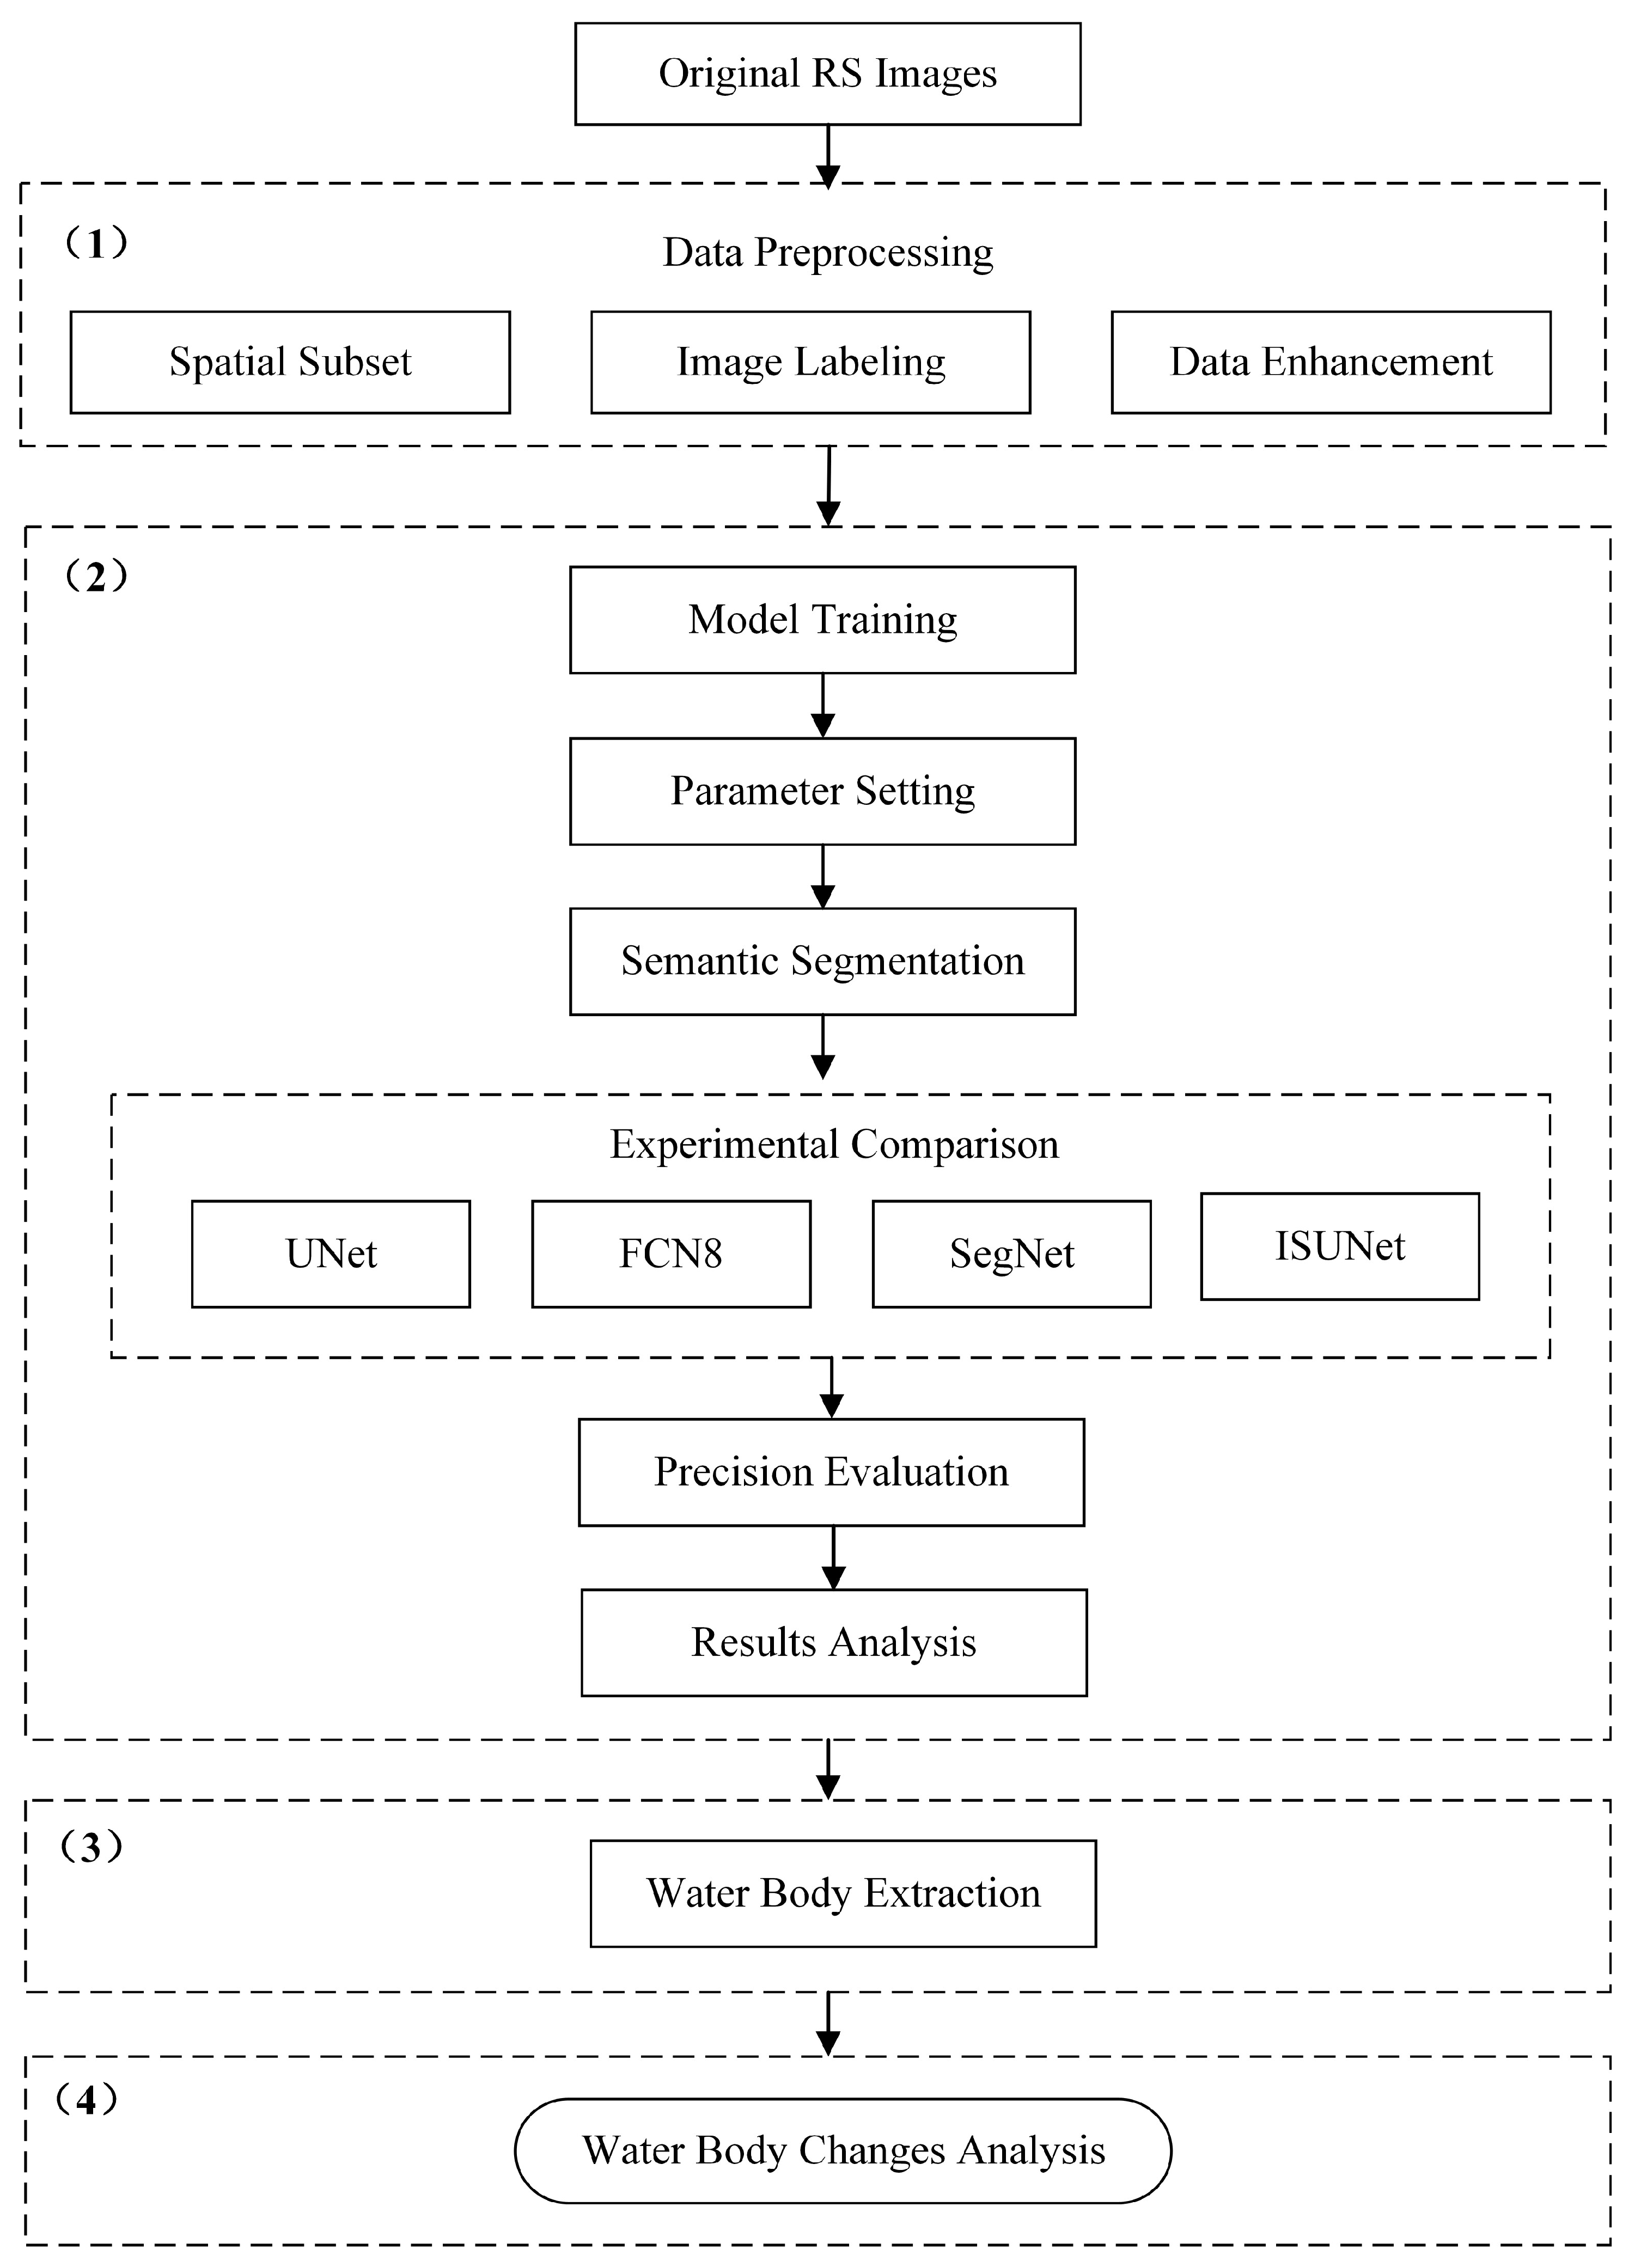
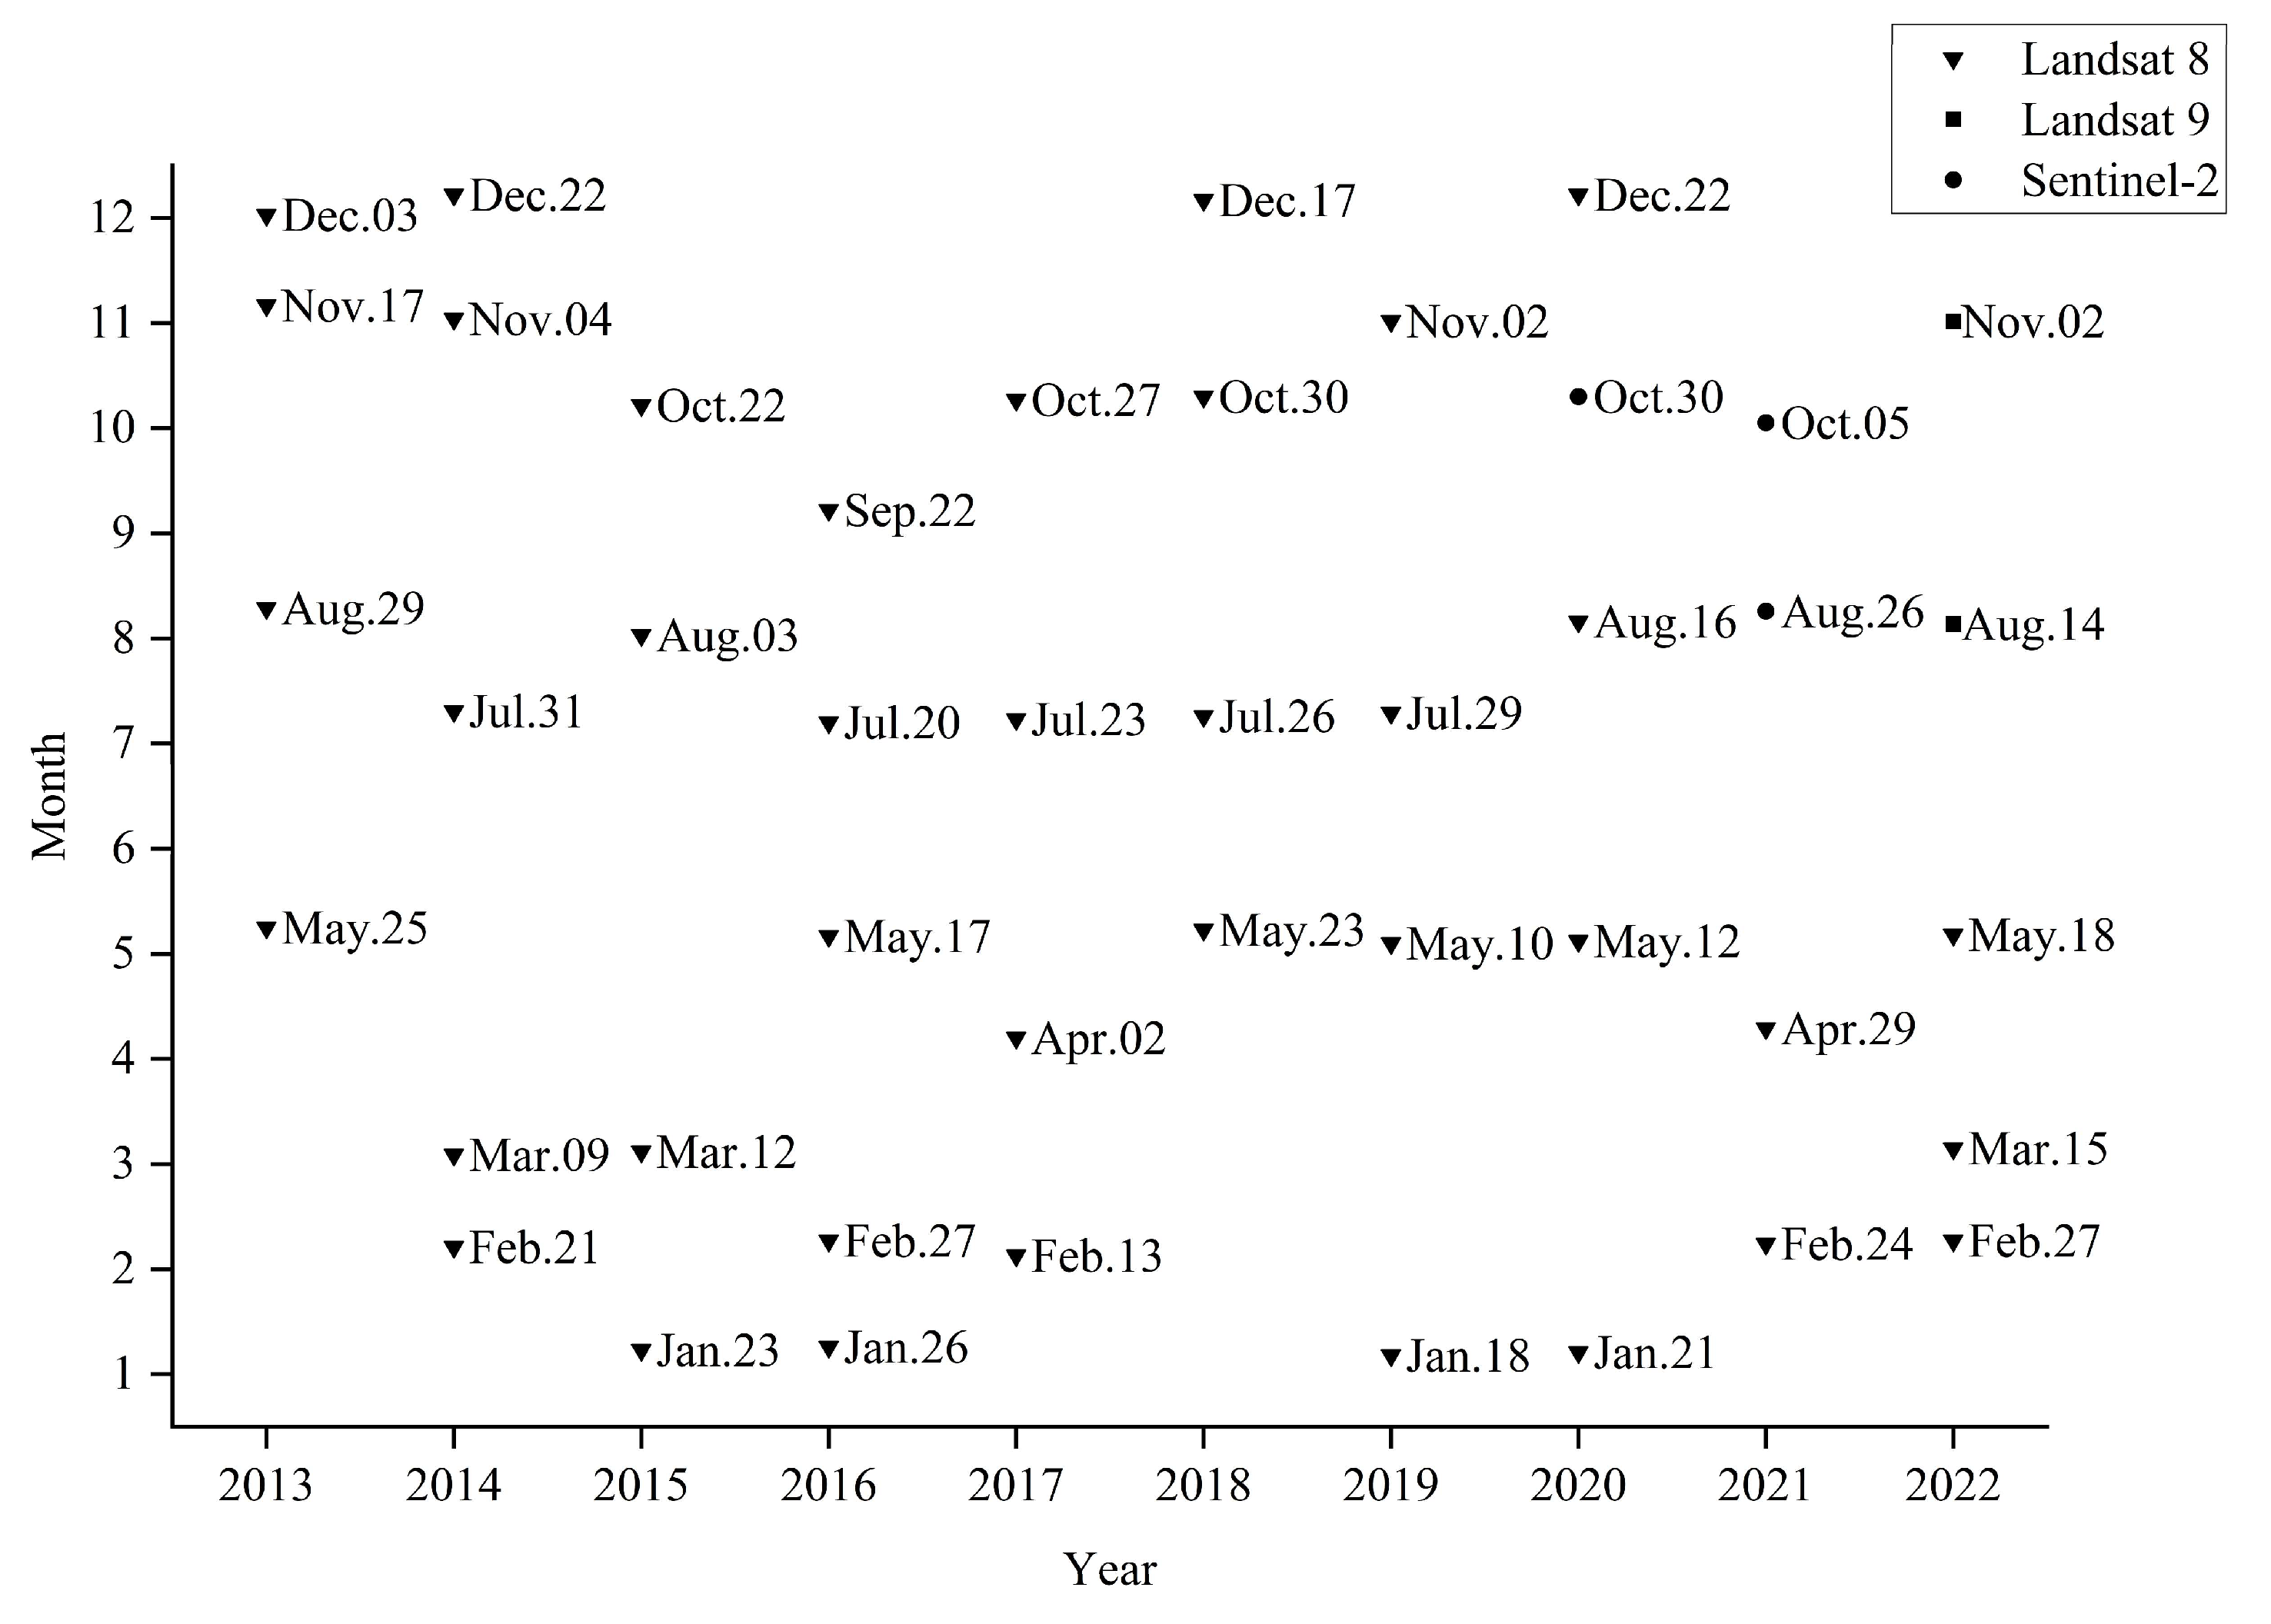
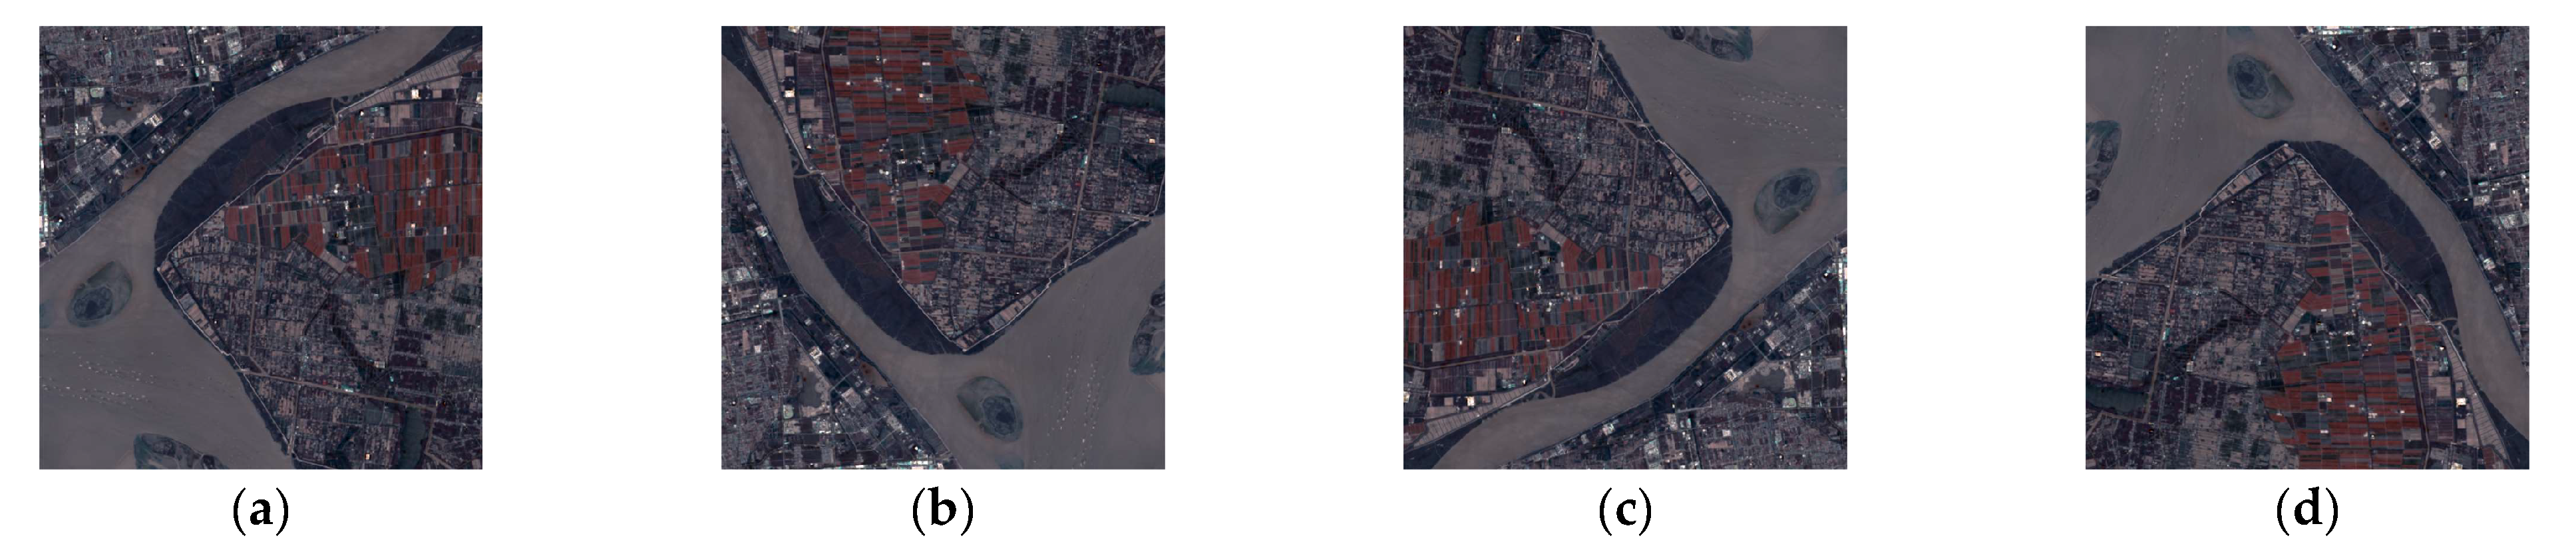
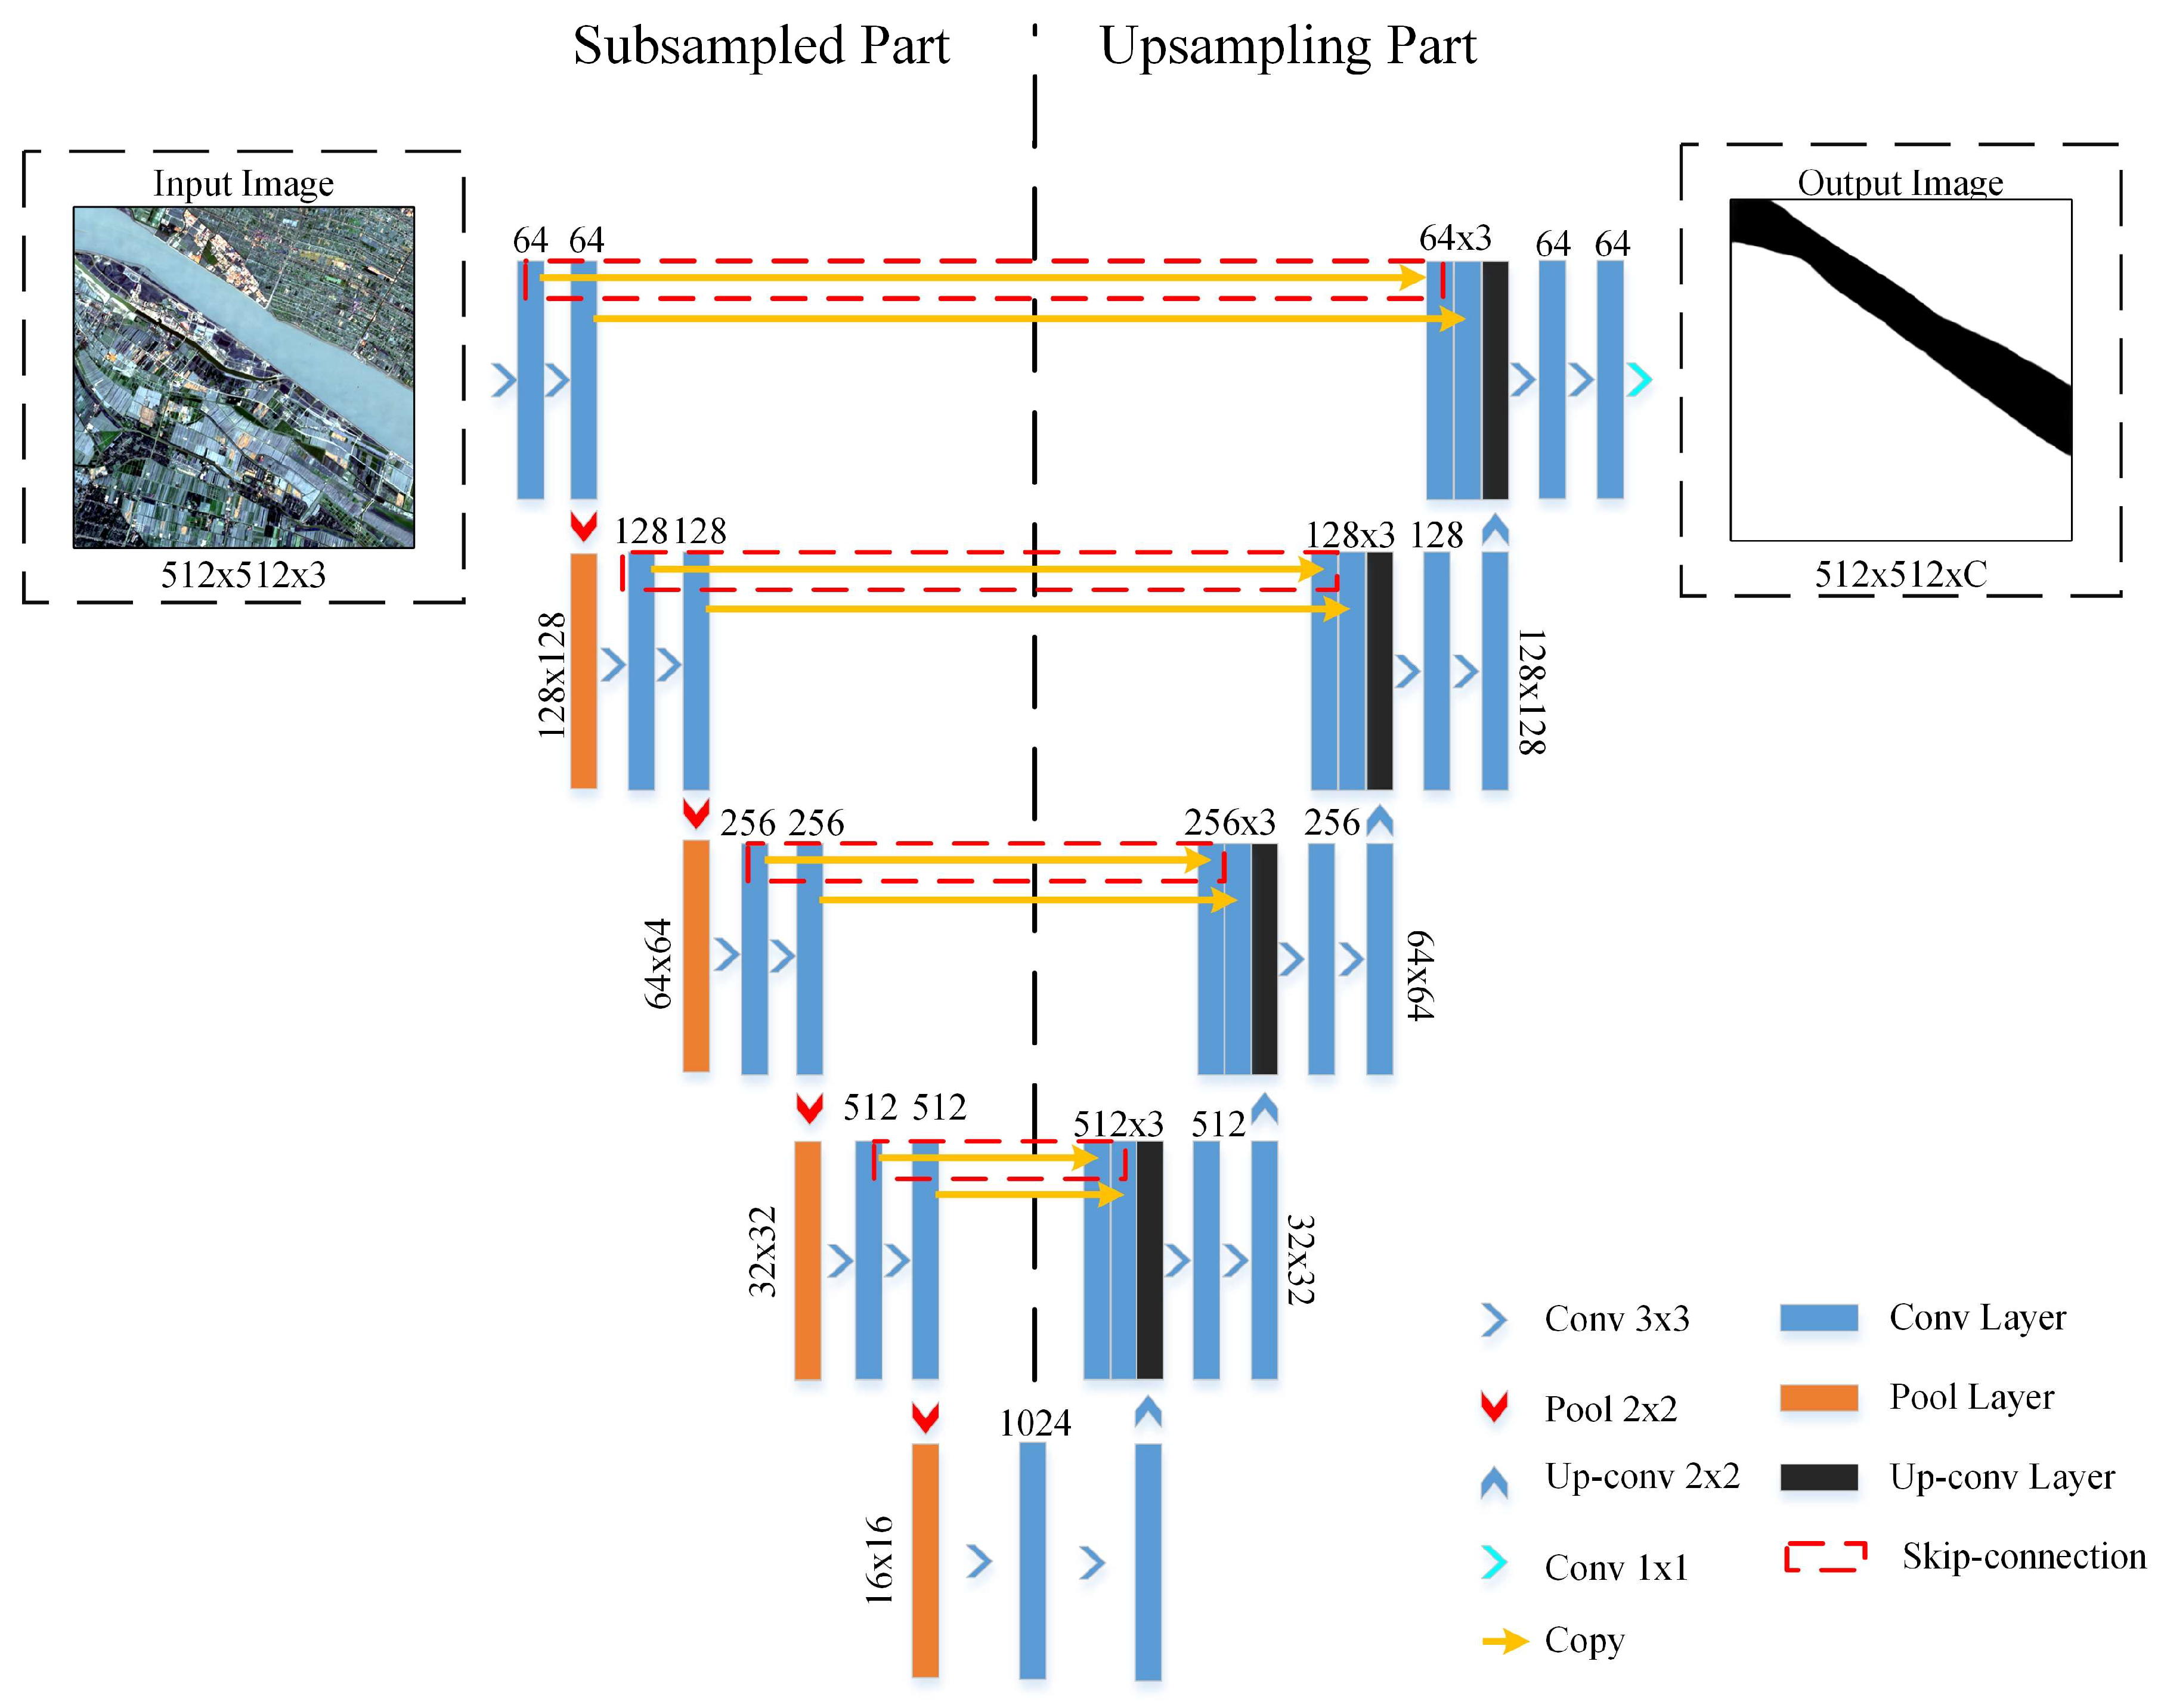
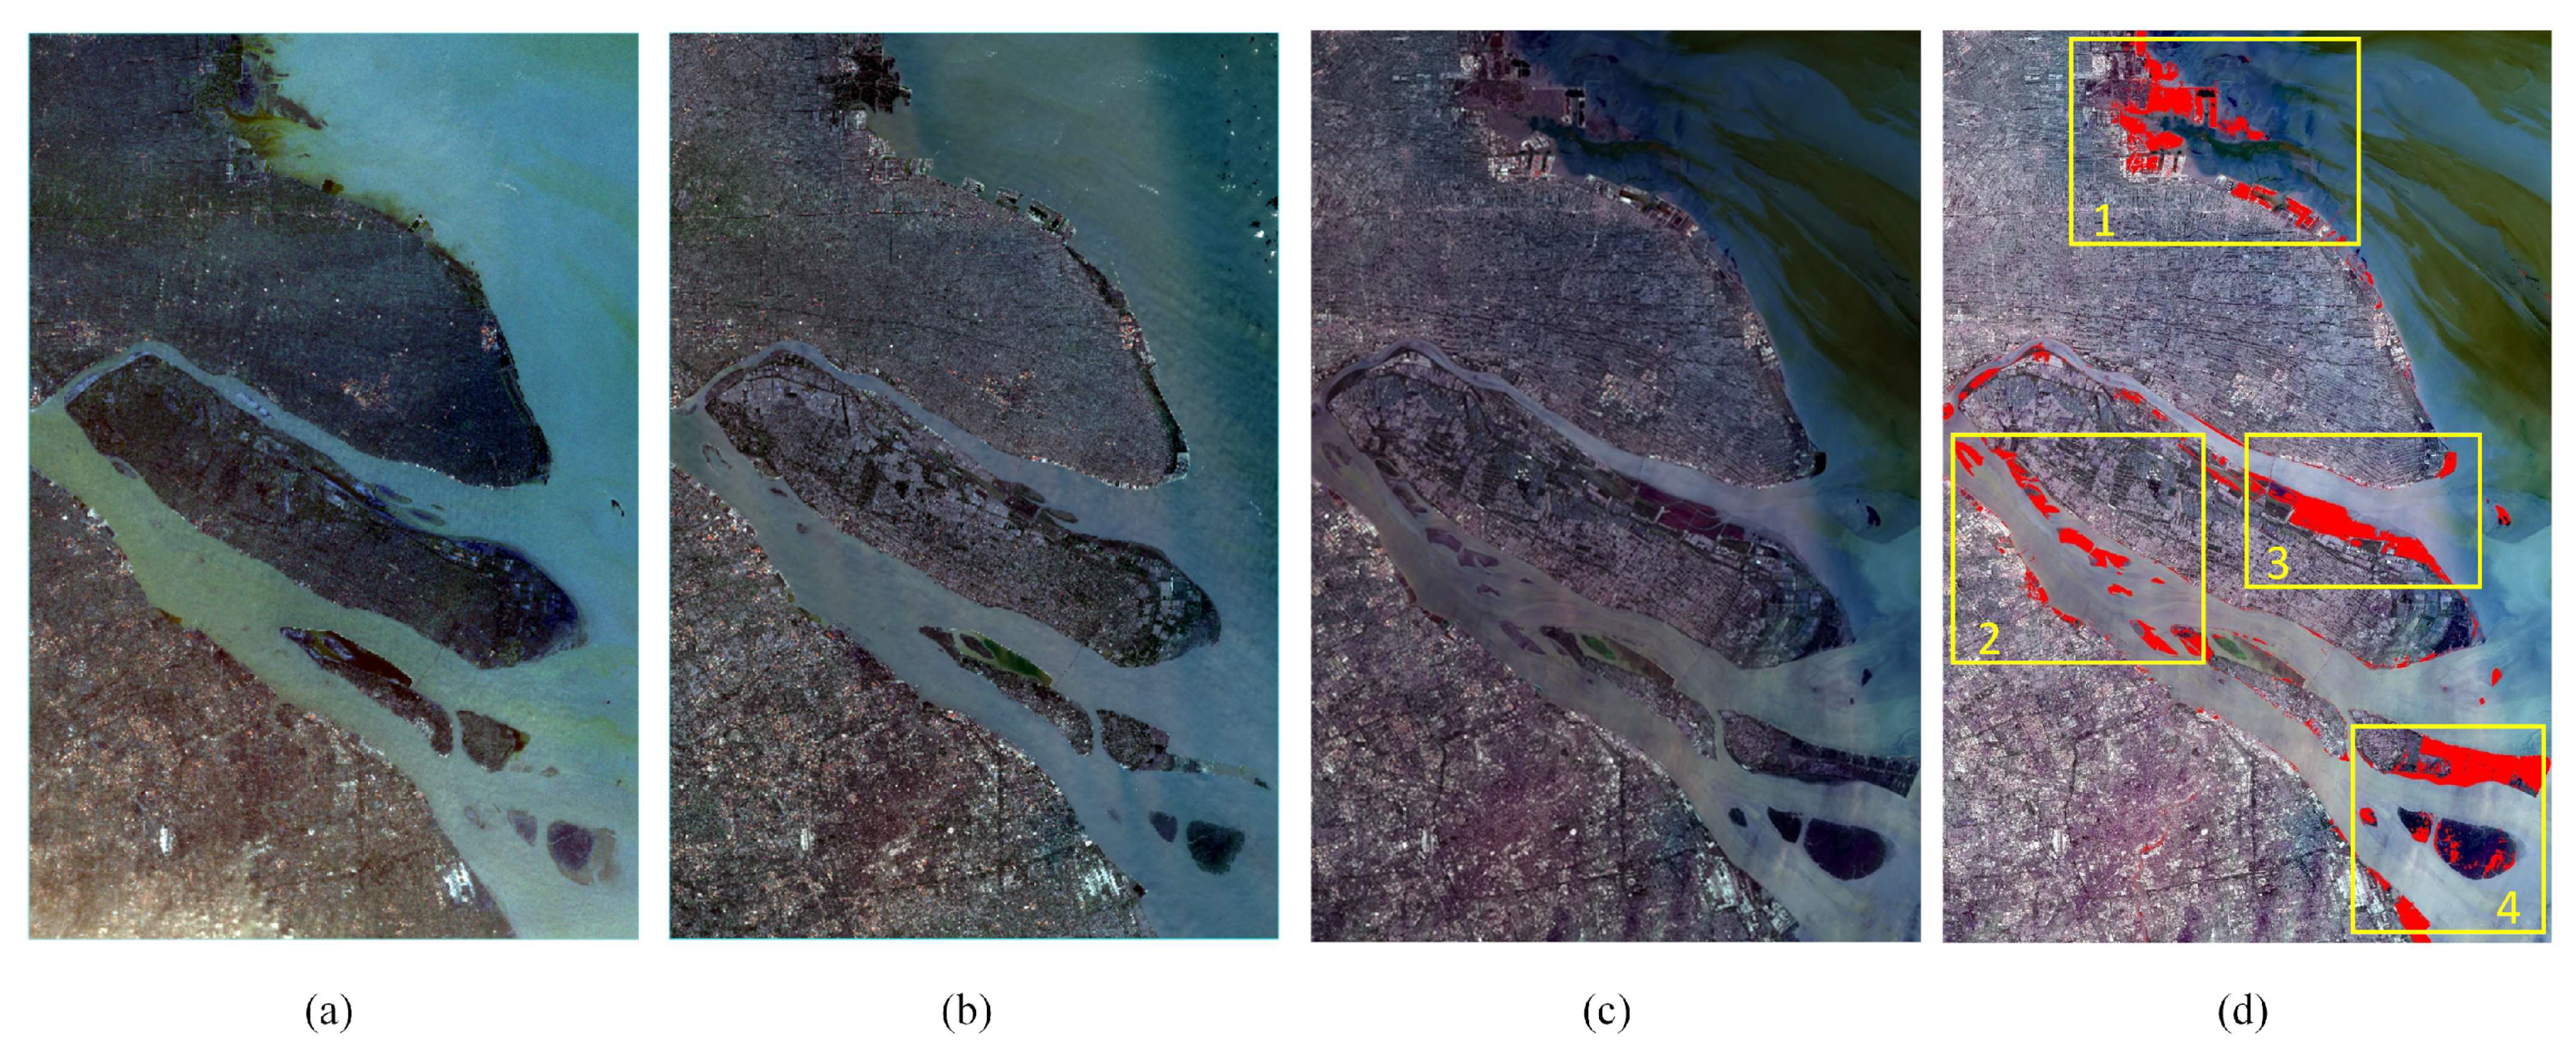
Due to the problem that the traditional UNet network loses spatial information due to multiple convolutions and pooling and is not effective in extracting sandy shores and silty shores, this research modifies the structure of the UNet neural network and applies it to the extraction of turbid water bodies in remote sensing images to mitigate the loss of spatial information caused by pooling operations and to enhance extraction accuracy. Highly precise extraction of water bodies is achieved by enhancing low-dimensional feature information. The improved UNet model incorporates the two-layer feature mapping from the encoding path with the corresponding decoding path, effectively capturing fine-grained details. The dynamic changes in water bodies in Chongming Island and its surrounding areas from 2013 to 2022 are herein extracted and analyzed using this enhanced UNet model.

2. Study Area

The study area encompasses the estuary of the Yangtze River, which includes Chongming Island and its coastal vicinity. The study area extends from Rudong County, Tongzhou District, Haimen District, and Qidong City in Nantong City, Jiangsu Province, to Taicang City in Suzhou City and part of the administrative jurisdiction of Shanghai, including Chongming Island. This area serves as a crucial gateway for the Yangtze River’s connection to the sea and plays a significant role in ocean shipping. Spanning approximately 121°09′ to 122°06′ E and 31°03′ to 32°18′ N, this area hosts numerous ports along its inner channel and is recognized as an important deep-water port in China. Owing to the mutual impact of river water and seawater here, the sediment constantly experiences siltation, resulting in turbid water bodies, forming a complex geomorphology and water environment. The coastal types in this region include not only natural shores such as sandy shores and silty shores but also artificial shores such as harbors, docks, salt fields, and farming areas. Hence, the task of extracting and classifying water bodies in the study area is very challenging. Figure 1 shows the specific geographical extent.

3. Research Method

3.1. Flowchart of the Current Study

The research process began with data preprocessing, including spatial cropping, image annotation, and data enhancement. Following data preprocessing, the research focused on improving the UNet model. The model was trained using a semantic segmentation dataset to extract water bodies, and its performance was compared with other established deep learning models. Subsequently, the improved UNet model was employed to extract water bodies in the study area over the past 10 years. The extracted data were then analyzed to examine changes in water bodies within the study area. Figure 2 presents the workflow of this study.
(1) Conducting data pre-processing operations, including spatial cropping, image annotation, and data enhancement on the original remote sensing images;
(2) Enhancing the UNet network by refining model training and parameter settings: Utilizing semantic segmentation, the improved UNet model was applied to extract water bodies from remote sensing images in the study area. Comparative analysis was performed against baseline models such as SegNet, FCN8, and UNet. Accuracy evaluation was conducted using quantitative metrics such as accuracy, precision, IOU, and F1 score to assess the effectiveness of the improved UNet model in extracting coastal water bodies in Chongming Island and its surrounding areas;
(3) Extracting coastal water bodies in the study area over the past 10 years: Employing ISUNet, remote sensing images from 2013 to 2022 were semantically segmented to identify and extract water bodies and land in Chongming Island and its surrounding areas;
(4) Analyzing the trends of water bodies in Chongming Island and its surrounding areas from 2013 to 2022: We performed spatial and temporal change analysis based on the extracted water bodies to examine the dynamic trends and investigate the underlying reasons for these changes.

3.2. Data Sources

The main data used in this paper were the Landsat 8 C2 L2 (Landsat Collection 2 Level-2) product released by the United States Geological Survey, and the auxiliary data include the Landsat 9 C2 L2 data and Sentinel-2 L2A (Sentinel-2 Level-2A) data, all of which had been radiometrically calibrated, atmospherically corrected, and geometrically corrected [30,31]. Landsat 8 and Landsat 9 satellites are outfitted with the Operational Land Imager (OLI) sensor, designed to capture images across the visible and infrared spectra. This includes visible light ranging from blue to near-infrared as well as two shortwave infrared bands. The Sentinel-2 satellite boasts the Multispectral Imager (MSI) sensor, offering a suite of bands covering visible light, infrared, and shortwave infrared ranges. Together, these sensors provide high-resolution Earth observation data for a variety of applications. To acquire clear remote sensing images of Chongming Island and its surrounding areas, we set a threshold of cloud cover to ensure that the study area was not covered by cloud cover or that a small portion of the study area was covered by cloud cover. Considering the seasonal variations of the water bodies in the study area, the images selected for our study encompassed four seasons of the year: spring (March–May), summer (June–August), autumn (September–November), and winter (December–February). If there were unavailable images in a season, we utilized Landsat 9 and Sentinel-2 satellite images for auxiliary data instead.
A total of 44 scenes were used in this research, including 39 Landsat 8 images, 2 Landsat 9 images, and 3 Sentinel-2 images. The Landsat 9 images were used to supplement the data in summer and winter 2022, and Sentinel-2 image images were used to supplement the data in autumn 2020 and summer and autumn 2021, as there were no available Landsat 8 images during these periods. Figure 3 presents the acquisition dates for these images, which shows that the images were acquired at relatively regular intervals between 2013 and 2022.

3.3. Data Preprocessing

3.3.1. Data Labelling

In this study, 18 data images from 2015 to 2020 were selected for deep learning model training and testing. The remaining data were used to implement automatic extraction of water bodies using the trained deep model, which in turn enabled the analysis of water body changes in Chongming Island and its surrounding areas from 2013 to 2022. A total of 15 images were selected for the training set, covering the period from 2015 to 2020. Three images were selected for the test set, with a time range of 2022. Table 1 shows the details of the training set and test set images.
In this study, Pixel Information Expert (PIE) 6.3 was used to produce semantic segmentation labels for remote sensing images, and the main steps are as follows:
(1)
Obtain the study area image by using the cropping function in PIE software, resulting in an image resolution of 3072 pixels × 4608 pixels;
(2)
Create a vector Shapefile file for labelling. Set the coordinate system to WGS84 and manually label each image sample using visual interpretation, marking the categories of water bodies and land;
(3)
Convert the vector files into raster labels using PIE software, generating raster annotation files;
(4)
Crop the image and label raster files to create the dataset. Images are cropped into smaller sizes (512 pixels × 512 pixels) to avoid memory overflow during model training and optimize feature utilization. The cropping process ensures a balanced sample by adjusting the water body area to occupy 1–99% of the image, preventing images dominated by either land or water bodies. A total of 522 training images and 104 test images were obtained using the above steps to annotate the remote sensing image data, and the resolution of the images was 512 pixels × 512 pixels.

3.3.2. Data Enhancement

This study performed a data enhancement operation before inputting the deep learning model to further enrich the water body recognition dataset, increase the training samples, enhance the robustness of the model, and reduce the sensitivity of the training data. Image rotation is one of the commonly used techniques in data enhancement, which can improve the model’s ability to recognize objects at different angles, increase the diversity of training data, and mitigate overfitting. It makes the model more robust, allowing it to handle objects in real-world images at various orientations [32,33,34]. The specific data enhancement operation used in this study was image rotation: the original image was rotated 90°, 180°, and 270° counterclockwise, as shown in Figure 4. Finally, the data were divided approximately in a 5:1 ratio, resulting in 2088 training set images and 416 test set images, along with their corresponding label data.

3.4. U-Net Improvement

The skip connection is a crucial network structure in deep learning that adds the inputs of one layer directly to the outputs of subsequent layers and then passes them on to the next layer of the network. In the domain of deep learning, the vanishing gradient problem manifests as the gradual attenuation of gradients to near-zero values during the backpropagation process in deep neural networks. This phenomenon arises primarily due to the application of the chain rule and the selection of activation functions. Consequently, it results in the parameters of the shallower network hardly being updated anymore, ultimately rendering the network ineffective for learning [35]. Skip connection can effectively alleviate the vanishing gradient problem during the training process of deep neural networks, making the network easier to train. By introducing skip connections, information can be transmitted through a shorter path, preserving the original information of the input data and avoiding potential information loss that may occur when passing through multiple layers. This not only helps improve the training efficiency of the network but also enables the network to better handle complex tasks, especially in cases where skip connections are needed to capture multi-level features. Furthermore, the concept of skip connections has provided an important theoretical foundation for the design of specialized network structures such as residual networks, which have demonstrated outstanding performance in training deep networks [36,37]. Skip connections play a crucial role in the field of deep learning, holding significant importance in addressing gradient-related challenges during the training of deep networks and enhancing network performance.
This study improves the UNet architecture by strengthening the skip-connection component to enhance the extraction performance of the UNet network in complex coastal water scenarios such as areas with high sediment content, ambiguous land–sea boundaries, beach landforms, artificial coasts, silty coasts, and sandy coasts. Figure 5 shows the resulting model, called ISUNet. The model comprises two main sections: The left side represents the downsampling part, whereas the right side represents the upsampling part. Each layer of the network is composed of various convolutional and pooling layers, with different types and quantities.
During the downsampling process, a repeated structure of two convolutional layers followed by one maximum pooling layer is employed. Each pooling operation reduces the feature map size by half, whereas each convolution operation doubles the number of channels in the feature map. The first layer of the network consists of 64 convolutional kernels, and the number of kernels in each subsequent layer is sequentially multiplied, reaching 1024 in the fifth layer. This architectural design facilitates the capturing of intricate and abstract features as the network goes deeper.
The upsampling process continuously performs the deconvolution operation, which halves the number of channels of the feature map and doubles the size of the feature map. Moreover, the downsampled channels are convolved with the corresponding feature maps of the upsampled channels by employing skip connections, thereby recovering the spatial loss caused by the reduced resolution from the maximum pooling operation. This process allows for the integration of feature information at different scales, providing valuable insights for the upsampling process. The number of convolutional kernels in the sixth layer is 512, and then, the number of convolutional kernels in each layer is multiplied and reduced to 64 in the ninth layer. Moreover, the number of feature maps in each layer is three times 512, 256, 128 and 64 after the skip connection.
The final output layer in the network uses a 1 × 1 convolution kernel to convolve the input feature map. Then, the layer uses a Sigmoid activation function to classify the pixels in the feature map to generate a C-dimensional feature map with the same number of dimensions as the corresponding number of categories while the size of the final output semantic segmentation feature map is reduced to 512 × 512. Additionally, to ensure that the input and output image sizes are consistent, boundary padding is used, with the padding method being “Same” padding.
Compared with the classical UNet network, the ISUNet model introduces improvements in the skip-connection component of each network layer in the decoder part, as indicated by the red dashed box in Figure 5. At each layer of the network’s skip connections, we added one additional layer to each corresponding feature map of the encoding part. This enhancement aims to enhance the low-dimensional spatial information of the image and reduce the loss of spatial information caused by multiple convolution and pooling operations. By doing so, the model can capture additional feature information from the image and achieve better segmentation results. The study area in this research exhibits complex feature information and a variable environment. The remote sensing images contain limited low-dimensional detail information in the feature map after multiple downsampling layers. This limitation results in poor image segmentation accuracy, particularly in the detailed areas. Therefore, augmenting the low-dimensional feature information of the image can improve the accuracy and completeness of segmentation results, particularly in the detailed regions.

4. Experiment

4.1. Recommendation Baselines

The performance of the proposed method ISUNet was compared with the following popular baseline methods:
  • FCN8: FCN is one of the pioneering neural network architectures designed for image segmentation [38]. In traditional convolutional neural networks, the presence of fully connected layers imposes fixed input–output dimensions. FCN, by eliminating fully connected layers and replacing them with convolutional layers, allows for arbitrary input image sizes and generates corresponding output sizes. FCN8 is a variant of FCN that employs upsampling and skip connections to enhance segmentation accuracy, thereby facilitating a better understanding of the image;
  • SegNet: SegNet is an image segmentation architecture developed by the University of Cambridge, U.K. It combines an encoder–decoder structure, where the encoder part extracts image features, and the decoder part maps these features back to the original image size. Unlike FCN, SegNet utilizes index-max pooling in the decoder. These indices are stored by the encoder to ensure correct feature mapping during upsampling in the decoder [39];
  • UNet: UNet is a neural network architecture for image segmentation, proposed by researchers from the University of Freiburg, Germany [23]. Its unique encoder–decoder structure, coupled with the introduction of skip connections, enables it to excel in capturing both local and global contextual information, thus achieving precise segmentation results.

4.2. Experiment Results

Accuracy evaluation was performed using the test set and compared with FCN8, SegNet, UNet, and other models for analysis. The average value of 10 experiments was taken. The evaluation and visualization results are as shown in Table 2 and Figure 6.
As shown in Table 2, ISUNet achieved advantages over FCN8, SegNet, and UNet models in terms of evaluation metrics such as accuracy, precision, IOU, and F1 score. This result indicates that the model has great coastal water body recognition ability. Although ISUNet’s evaluation indexes did not achieve great improvement in numerical value, the visual results in Figure 6 clearly demonstrate that ISUNet exhibited a more pronounced extraction of details in the task of water body extraction compared to the FCN8, SegNet, and UNet models. The improved ISUNet model can recognize the detailed features of artificial coasts and water bodies well, and the extracted results are more continuous and complete. Collectively, SegNet, FCN8, UNet, and ISUNet models can recognize water bodies with accuracies from low to high.

4.3. Visual Interpretation

Visual interpretation is a remote sensing image interpretation method based on observation and analysis by the human eye, in which surface objects are identified and classified through visual interpretation of remote sensing images by professional interpreters. Visual interpretation can deal with complex features and scenes, intuitively analyze and interpret remote sensing images, and provide a high level of semantic understanding and detailed interpretation of spatial information. To verify the accuracy and reliability of the deep learning model, visual interpretation, as a traditional method for land cover classification, still has an irreplaceable role. In this way, we further introduced the visual interpretation method to validate the recognition results.
We conducted visual interpretation of images from the spring season from 2013 to 2022 and counted the area of water bodies in these images. To quantify the differences between our method and the visual interpretation results, we employed the metrics of area absolute error and area relative error to evaluate the recognition results of ISUNet. The area absolute error and area relative error are calculated as follows:
Area   Absolute   Error = Area V i s u a l   I n t e r p r e t a t i o n Area ISUnet
Area   Relative   Error = Area V i s u a l   I n t e r p r e t a t i o n Area ISUnet 1 2 Area V i s u a l   I n t e r p r e t a t i o n + Area ISUnet × 100 %
where AreaVisual Interpretation represents the recognition results of visual interpretation, and AreaISUnet represents the recognition results of ISUNet.
Based on Formulas (1) and (2), the validation metrics are as shown in Table 3.
Table 3 shows that the maximum absolute error is 43.811 km2, with a minimum of 9.647 km2. Additionally, the maximum relative error is 0.879%, and the minimum is 0.192%. The overall difference between the recognition results of the ISUNet model and the visual interpretation results is relatively very small, and the ISUNet model has an acceptable level of prediction error. The process of visual interpretation provides a thorough understanding of ISUNet’s prediction results, reflecting the extent to which they correspond to the actual situations. This validation method provides an intuitive understanding of the model results and verifies the reliability of ISUNet in executing water body recognition tasks.

5. Analysis of Water and Land Changes in Chongming Island and Its Surrounding Areas Based on ISUNet

5.1. Image Water Body Extraction

The ISUNet model was applied to perform semantic segmentation on remote sensing images of Chongming Island and its surrounding areas in Shanghai, China. This study focuses on the extraction of water bodies to analyze changes in their areas over the past 10 years, from 2013 to 2022. Table 4 presents the extraction results of three representative satellite images in 2014, 2018, and 2022. The table includes the original satellite images and their corresponding water body extraction results.
The PIE software was utilized to quantitatively count the number of water body pixels in each image segmentation map and calculate the corresponding water body area. This analysis allows for a quantitative assessment of the changing trend of water bodies in Chongming Island and its surrounding areas. Figure 7 shows the results of this analysis, including the change situation and trend of water bodies.
In Figure 7, the water body area values range from a maximum of 5458.2741 km2 to a minimum of 4646.8224 km2. The values do not exhibit a linear decrease and show small fluctuations at different time points, possibly because of factors such as tidal action and weather changes. Regarding the seasonal trend of water body changes, the water body area in the study area tends to increase after spring and peaks in summer before declining. Such changes are related to the monsoon season in the middle and lower reaches of the Yangtze River in China, which usually occurs in the summer and is a special climatic phenomenon under the influence of the monsoon. In monsoon season, it is mainly characterized by continuous cloudy rains, high humidity, and high precipitation. Chongming Island belongs to the lower reaches of the Yangtze River; therefore, the area of the water body rises during the summer season. From the annual trend of water body changes shown in Figure 7, the water body area showed a continuous decline from 2013 to 2018 and experienced a slight increase in 2019, followed by another decline. However, the data overall indicate a decreasing trend in the water body area of the study area from 2013 to 2022. Throughout the 10 years, there was a decrease of approximately 267.8 km2, corresponding to an average annual decline of nearly 27 km2.

5.2. Analysis of Change Regions

This study compares and analyses the segmentation results of water bodies in Chongming Island and its surrounding areas between 2013 and 2022, aiming to understand the specific regional changes. Figure 8 illustrates the areas where water bodies have transformed, with the red areas indicating the conversion from water bodies to land. Due to the minimal conversion from land to water bodies, this is not indicated in Figure 8.
Between 2013 and 2022, notable changes occurred in the study area, primarily concentrated within four major regions demarcated by yellow rectangular boxes in the figure. Area 1 exhibited more artificial coasts, whereas area 2 mainly comprised sand islands formed as a result of sediment impact. Area 3 predominantly consisted of silt-forming land, and area 4 primarily encompassed artificial polders with some sediment siltation. Additionally, the presence of small artificial shores along both coastlines played a pivotal role in the reduction of water bodies and the subsequent expansion of land in the study area.
Based on Figure 8, the changes are concentrated in specific areas, such as the estuary center, riverbanks, and islands within the water. Notably, the transformation of small islands in the lower right corner of Figure 8d stands out prominently.
Combining the satellite raw remote sensing images in 2013 and 2022 from Figure 8b,c and analyzing the changing area in Figure 8d, the changing area in the estuary center is mainly the small islands formed by the impact of sediment carried by the Yangtze River mouth. The two banks of the river channel are mainly caused by human construction of artificial shore and other shore-building activities. The change of the island area in the lower right corner of Figure 8d is also evidently caused by the continuous accumulation of silt at the shore.

5.3. Comparison with JRC Yearly Water Classification History

In this section, our surface water results were compared with the European Commission’s Joint Research Centre (JRC) Yearly Water Classification History (v1.4) [40]. The JRC Global Surface Water (GSW) is a global database for remote sensing monitoring of water bodies established by the European Commission’s JRC. This dataset utilizes remote sensing technology to provide high-resolution information on the distribution and changes of water bodies worldwide from 1984 to 2021. It encompasses accurate identification of water bodies such as rivers, lakes, and reservoirs. It offers crucial data support for fields including water resource management, environmental protection, and climate research. The JRC water body dataset has a long time series and global coverage, which allows us to compare and validate the research results in different regions and at different time scales. The spatial and temporal consistency can be assessed by comparing the results of this research with those of the JRC water body datasets.
The JRC Yearly Water Classification History (v1.4) dataset covers the temporal distribution from 1984 to 2021. We acquired the JRC yearly water dataset for the study area spanning from 2013 to 2021 on the Google Earth Engine platform. The changing trend of the water bodies in this research and the JRC dataset both depict a similar decreasing trend from 2013 to 2021 in the study area, as shown in Figure 9. The expert system approach used in the JRC water body dataset relies on traditional rules and manually designed features for water body identification. This approach can provide reliable results to a certain extent but requires significant time and resources to update knowledge and experience. In contrast, the ISUNet model achieves water body identification by automatically learning features and patterns. This data-driven approach is not only better able to adapt to different scenarios and environmental changes but also able to continuously optimize the performance of the model as it receives new data. The deep learning approaches offer a higher degree of automation with guaranteed recognition accuracy.

6. Discussion

With the continuous expansion of the economy, there is a growing emphasis on the preservation of the ecological environment and the construction of ecological civilization to achieve sustainable development [41]. The pursuit of harmonious coexistence between humans and nature has become a top priority. In alignment with this vision, the nation has established the goal of becoming a prominent maritime nation [42]. Consequently, the detection, monitoring, and analysis of changes in coastal water bodies hold significant practical importance. As a crucial maritime area in China, Chongming Island and its surrounding areas are of immense significance in extracting, monitoring, and analyzing the dynamic changes in the coastal water bodies within this area [43].
Traditional methods for water extent extraction, such as threshold segmentation and image classification [44], often lack spatial information and fail to capture detailed features. Hence, we propose an enhancement to the traditional UNet model by increasing the number of connected low-dimensional feature mappings in the skip-connection [36] part to address this limitation. This modified architecture, called ISUNet, effectively utilizes spatial and texture information, improving the accuracy and completeness of water body segmentation. ISUNet achieves more precise and detailed water extraction results compared with conventional methods by incorporating multi-dimensional edge features.

6.1. Analysis of Recognition Results

Landsat 8 satellite images captured on 29 August 2013 were utilized to evaluate the models’ migration and generalization ability and their suitability for extracting water bodies in Chongming Island and its surrounding areas. These images were not included in the training and test sets. A comparative analysis was conducted using several models, including SegNet, FCN8, UNet, and ISUNet. Table 5 and Table 6 show the resulting images and evaluation generated by each model.
The ISUNet model demonstrates superior performance compared with FCN8, SegNet, UNet, and other models in the extraction of artificial shores, effectively capturing the intricate features of artificial shores and water bodies. However, its heightened sensitivity may result in the incorrect classification of areas with subtle variations in light and dark as water bodies. SegNet exhibits better accuracy in identifying sandy shores and successfully detects small islands formed by sediment impact compared with the other models. Conversely, the FCN8 model shows inadequate performance in recognizing silty shores, leading to incomplete and fragmented outcomes. Meanwhile, SegNet performs slightly better than the others but still lacks continuity and graph integrity. Among them, UNet and ISUNet models exhibit relatively better performance, but the UNet model tends to classify a larger area as land, whereas ISUNet offers an overall better recognition effect than UNet. In summary, ISUNet outperforms FCN8, SegNet, UNet, and other models in extracting coastal water bodies, particularly in recognizing silty coasts with higher sediment content and more detailed information about artificial coasts.
We ran the ISUNet model on a server (Intel(R) Xeon(R) Gold 6240 CPU @ 2.60 GHz) with the acceleration of GeForce RTX 2080 Ti GPU. The SegNet model demonstrated the fastest training time, completing in 6 h, 23 min, and 38 s, as shown in Table 5. While SegNet is the quickest among the four models, the recognition results indicate that it loses some crucial details during the water body extraction process. This is evident in the recognition result corresponding to “Silty shore”, as shown in Table 5. However, high-precision recognition is crucial for many applications, especially in cases where an accurate measurement of water body locations is required [45]. After incorporating skip connections, the ISUNet model’s runtime was 10 h, 00 min, and 51 s, which is only 1 h, 53 min, and 43 s longer than UNet. It is still of the same order of magnitude as UNet. Furthermore, compared with the traditional UNet, ISUNet successfully extracts finer details of smaller water bodies in small islands with complex artificial coastlines.

6.2. Analysis of Reasons for Change

Based on Figure 7, it is evident that the overall water area in the study region is showing a declining trend. The water body area in the study area showed a continuous decreasing trend between 2013 and 2018 and continued to decrease after a rebound in 2019. As the Yangtze River Delta region enters the rainy season in June, the study area receives heavy rainfall, and the water level starts to rise; therefore, the water body in the study area shows an increasing trend after each spring as shown in Figure 7. In Figure 8, significant conversion of water bodies to land are visible in the central estuary, along the banks of the river channel, and within the waterborne islands. Due to the silt carried by the Yangtze River at its mouth, a small island formed in the center of estuary. The changes in the water bodies along the banks of the river channel are caused by human activities such as the construction of artificial coasts and other shore-building activities. Additionally, a small island also formed due to the continuous accumulation of sediment along the coastline, as shown in the bottom right corner of Figure 8d. Hence, it can be concluded that the decrease in the water body area in Chongming Island and its surrounding areas from 2013 to 2022 can be attributed to the combined effects of natural environmental factors and human activities [8,43,46,47]. The natural environmental impact is primarily a result of the substantial sediment carried by the Yangtze River, leading to sediment deposition and accumulation within the river channel. Human activities, including extensive land reclamation projects and the construction of harbors, have also played a significant role in this decline. Notably, the study area has a long history of land reclamation, with multiple projects implemented since the establishment of the state.
This study mainly covers two regions: the Chongming Island area in Shanghai and southern Jiangsu Province. The Chongming Island area has a long history of reclamation and land reclamation and has increased its land area through reclamation in the last decade. Hengsha Island is one of the major areas in Shanghai where land reclamation has been carried out. The southern part of Jiangsu province, which accounts for a quarter of the country’s mudflat area, has also increased its land area through artificial and port-building initiatives. The Nantong municipal government released the “Outline of Nantong Coastal Mudflat Reclamation and Development and Utilization Plan 2010–2020” in 2010. From the 2010 imagery of the study area, region #1 did not undergo significant land expansion at that period, as shown in Figure 8a. The rapid increase in land area in region #1 in Figure 8d is mainly because of Nantong’s reclamation plan and the construction of a port to build an artificial coast.
Artificial reclamation and land reclamation have increased the land area and eased the contradiction between humans and land. They have also given impetus to economic development in the short term. However, from the long-term development perspective, large-scale and disorderly artificial land reclamation will also bring ecological and environmental problems. Examples include the reduction of wetland areas, the destruction of species diversity, the weakening of seawater’s self-cleaning ability to trigger red tide, the reduction of the “marine forest” mangroves, and other adverse effects. Therefore, for the sake of national ecological civilization and sustainable development, the State Council issued the Notice on Strengthening the Protection of Coastal Wetlands and Strictly Controlling Reclamation in 2018, which no longer approves reclamation-related projects except for some special purposes and major national strategies.

6.3. Limitations and Future Prospects

In comparison to other baseline network models, ISUNet demonstrates superior performance in recognizing coastal water bodies, particularly in environments with rich, detailed information and higher sediment content, such as silty and artificial shores. ISUNet effectively extracts spatial detail features from images. Furthermore, the analysis of ISUNet’s extraction results on the water bodies of Chongming Island and its surrounding areas indicates its successful application in the task of identifying and extracting coastal water bodies.
Although the ISUNet model achieved certain advantages in the qualitative and quantitative evaluation of coastal water body extraction, some shortcomings still exist in this study, mainly in the following aspects:
(1)
Despite achieving better results than other models, the ISUNet model has certain limitations. The increased number of connected low-dimensional feature maps not only enhances image low-dimensional feature information but also increases computational complexity. Consequently, longer training times are required. Future work should focus on refining the model to achieve a lightweight and efficient architecture;
(2)
This study solely applied the ISUNet model to extract water bodies in the coastal area of the Yangtze estuary. Future research should explore the broad applicability of the ISUNet method, particularly in extracting coastal water bodies in different regions of China;
(3)
Additionally, this study examines a time scale of only 10 years. Conducting analyses over longer periods, such as 20, 30, or 40 years, would provide a comprehensive understanding of sea–land changes in the coastal region of the Yangtze River Estuary. Such an approach would enable a deep exploration of long-term coastal evolution processes and mechanisms.

7. Conclusions

In this study, an ISUNet model with a great turbid water extraction effect is proposed by improving the UNet model. We compared the proposed model with SegNet, FCN8, and UNet models, conducting a comprehensive evaluation of the ISUNet network’s performance. We also analyzed its effectiveness in extracting water bodies in Chongming Island and its surrounding areas. The results indicate that the ISUNet network excels in recognizing coastal water bodies, especially for silty coasts and artificial coasts that contain more detailed information and higher sediment content. The ISUNet demonstrates a superior ability in capturing spatial details from images and outperforms the baseline models in terms of graphical integrity and continuity.
The model was then applied to analyze the spatial and temporal changes in the water body area from 2013 to 2022 in Chongming Island and its surrounding areas. The analysis included assessing the changes in the area, identifying specific change areas, and determining the causes of these changes. The results demonstrate a gradual fluctuation and decrease in the water body area over the past decade, with a total reduction of 267.8 km2 and an average annual decrease of nearly 27 km2. The study highlights that the diminished water body area primarily results from silt deposition near the river port, the impact of the river’s central flow leading to the formation of sandbars, and the artificial construction of the port coastline. Human activities such as artificial reclamation, port construction, and sea farming, along with the sediment impact in the Yangtze estuary, are identified as the main influencing factors for the area changes in the region.
This study highlights the rapid decline in the water body area in Chongming Island and its surrounding areas, which poses environmental concerns such as reduced wetland area, ecosystem disruption, and loss of species diversity. Consequently, the government and relevant authorities must prioritize the development of ecological civilization and implement effective policies to safeguard the coastal environment. The study recommends the following measures to effectively mitigate these challenges: establishing ecological protection zones and implementing stringent regulations for land reclamation projects, adopting a scientifically planned industrial layout to promote sustainable tourism and other industries, and constructing water conservancy projects to effectively manage and mitigate the impact of sediment from the Yangtze River.

Author Contributions

Conceptualization, Lizhi Miao and Xinkai Feng; methodology, Lizhi Miao and Yanhui Ren; software, Yanhui Ren and Xinkai Feng; validation, Yanhui Ren and Xinkai Feng; formal analysis, Lijun Yang; investigation, Yanhui Ren and Xinkai Feng; resources, Xinkai Feng; data curation, Yamei Deng and Tian Hang; writing—original draft preparation, Lizhi Miao and Yanhui Ren; writing—review and editing, Lizhi Miao, Yanhui Ren, and Xinkai Feng. All authors have read and agreed to the published version of the manuscript.

Funding

This research was funded by the University-Industry Collaborative Education Program of China (Grant No. 202102245033), and Postgraduate Research & Practice Innovation Program of Jiangsu Province (Grant No. KYCX23_1068).

Data Availability Statement

The Landsat 8 and Landsat 9 data presented in the study are openly available in United States Geological Survey at https://earthexplorer.usgs.gov/; Sentinel-2 data presented in this study are openly and freely available at https://scihub.copernicus.eu/.

Acknowledgments

The authors would like to thank China Center for Resources Satellite Data and Application for providing GF-3 images, and EU Copernicus Program for providing the Sentinel-2 optical data. We also thank the editors and reviewers for their constructive comments.

Conflicts of Interest

The authors declare no conflicts of interest.

References

  1. Hu, X.; Qin, Z.; Wang, J.; Su, G. Coastline extraction on remote sensing image using Gaussian process classification. In Proceedings of the 2015 International Conference on Electromechanical Control Technology and Transportation, Zhuhai, China, 31 October–1 November 2015; pp. 392–395. [Google Scholar]
  2. Skilodimou, H.; Livaditis, G.; Bathrellos, G.; Verikiou-Papaspiridakou, E. Investigating the flooding events of the urban regions of Glyfada and Voula, Attica, Greece: A contribution to Urban Geomorphology. Geogr. Ann. Ser. A Phys. Geogr. 2003, 85, 197–204. [Google Scholar] [CrossRef]
  3. Li, J.; Ye, M.; Pu, R.; Liu, Y.; Guo, Q.; Feng, B.; Huang, R.; He, G. Spatiotemporal change patterns of coastlines in Zhejiang Province, China, over the last twenty-five years. Sustainability 2018, 10, 477. [Google Scholar] [CrossRef]
  4. Sala, E.; Mayorga, J.; Bradley, D.; Cabral, R.B.; Atwood, T.B.; Auber, A.; Cheung, W.; Costello, C.; Ferretti, F.; Friedlander, A.M. Protecting the global ocean for biodiversity, food and climate. Nature 2021, 592, 397–402. [Google Scholar] [CrossRef] [PubMed]
  5. Skilodimou, H.D.; Antoniou, V.; Bathrellos, G.D.; Tsami, E. Mapping of coastline changes in Athens Riviera over the past 76 year’s measurements. Water 2021, 13, 2135. [Google Scholar] [CrossRef]
  6. Li, K.; Zhang, L.; Chen, B.; Zuo, J.; Yang, F.; Li, L. Analysis of China’s Coastline Changes during 1990–2020. Remote Sens. 2023, 15, 981. [Google Scholar] [CrossRef]
  7. Gittman, R.K.; Fodrie, F.J.; Popowich, A.M.; Keller, D.A.; Bruno, J.F.; Currin, C.A.; Peterson, C.H.; Piehler, M.F. Engineering away our natural defenses: An analysis of shoreline hardening in the US. Front. Ecol. Environ. 2015, 13, 301–307. [Google Scholar] [CrossRef] [PubMed]
  8. Shen, G.; Sarris, A.; Huang, X. Remote sensing monitoring and analysis of expansion characteristics of Chongming Island in Shanghai, China. In Proceedings of the 2013 Second International Conference on Agro-Geoinformatics (Agro-Geoinformatics), Fairfax, VA, USA, 12–16 August 2013; pp. 556–561. [Google Scholar]
  9. Dai, C.; Howat, I.M.; Larour, E.; Husby, E. Coastline extraction from repeat high resolution satellite imagery. Remote Sens. Environ. 2019, 229, 260–270. [Google Scholar] [CrossRef]
  10. McFeeters, S.K. The use of the Normalized Difference Water Index (NDWI) in the delineation of open water features. Int. J. Remote Sens. 1996, 17, 1425–1432. [Google Scholar] [CrossRef]
  11. Ghosh, M.K.; Kumar, L.; Roy, C. Monitoring the coastline change of Hatiya Island in Bangladesh using remote sensing techniques. ISPRS J. Photogramm. Remote Sens. 2015, 101, 137–144. [Google Scholar] [CrossRef]
  12. Yang, F.; Guo, J.; Tan, H.; Wang, J. Automated extraction of urban water bodies from ZY-3 multi-spectral imagery. Water 2017, 9, 144. [Google Scholar] [CrossRef]
  13. Feyisa, G.L.; Meilby, H.; Fensholt, R.; Proud, S.R. Automated Water Extraction Index: A new technique for surface water mapping using Landsat imagery. Remote Sens. Environ. 2014, 140, 23–35. [Google Scholar] [CrossRef]
  14. Wang, X.; Liu, Y.; Ling, F.; Liu, Y.; Fang, F. Spatio-temporal change detection of Ningbo coastline using Landsat time-series images during 1976–2015. ISPRS Int. J. Geo-Inf. 2017, 6, 68. [Google Scholar] [CrossRef]
  15. Viaña-Borja, S.P.; Ortega-Sánchez, M. Automatic methodology to detect the coastline from Landsat images with a new water index assessed on three different Spanish Mediterranean deltas. Remote Sens. 2019, 11, 2186. [Google Scholar] [CrossRef]
  16. Luo, J.; Sheng, Y.; Shen, Z.; Li, J.; Gao, L. Automatic and high-precise extraction for water information from multispectral images with the step-by-step iterative transformation mechanism. J. Remote Sens. 2009, 13, 610–615. [Google Scholar]
  17. Xu, H. Modification of normalised difference water index (NDWI) to enhance open water features in remotely sensed imagery. Int. J. Remote Sens. 2006, 27, 3025–3033. [Google Scholar] [CrossRef]
  18. Qiao, C.; Luo, J.; Sheng, Y.; Shen, Z.; Zhu, Z.; Ming, D. An adaptive water extraction method from remote sensing image based on NDWI. J. Indian Soc. Remote Sens. 2012, 40, 421–433. [Google Scholar] [CrossRef]
  19. Acharya, T.D.; Subedi, A.; Lee, D.H. Evaluation of water indices for surface water extraction in a Landsat 8 scene of Nepal. Sensors 2018, 18, 2580. [Google Scholar] [CrossRef]
  20. Zeinali, S.; Dehghani, M.; Rastegar, M.; Mojarrad, M. Detecting shoreline changes in Chabahar Bay by processing satellite images. Sci. Iran. 2017, 24, 1802–1809. [Google Scholar] [CrossRef]
  21. Possa, E.M.; Maillard, P. Precise Delineation of Small Water Bodies from Sentinel-1 Data Using Support Vector Machine Classification. Can. J. Remote Sens. 2018, 44, 1–12. [Google Scholar] [CrossRef]
  22. Zhang, H.; Wang, D.; Gao, Y.; Gong, W. A study of extraction method of mountain surface water based on OLI data and decision tree method. Eng. Surv. Mapp. 2017, 26, 45. [Google Scholar]
  23. Ronneberger, O.; Fischer, P.; Brox, T. U-net: Convolutional networks for biomedical image segmentation. In Proceedings of the Medical Image Computing and Computer-Assisted Intervention–MICCAI 2015: 18th International Conference, Munich, Germany, 5–9 October 2015; Proceedings, Part III 18. pp. 234–241. [Google Scholar]
  24. Li, R.; Liu, W.; Yang, L.; Sun, S.; Hu, W.; Zhang, F.; Li, W. DeepUNet: A deep fully convolutional network for pixel-level sea-land segmentation. IEEE J. Sel. Top. Appl. Earth Obs. Remote Sens. 2018, 11, 3954–3962. [Google Scholar] [CrossRef]
  25. Kim, J.H.; Lee, H.; Hong, S.J.; Kim, S.; Park, J.; Hwang, J.Y.; Choi, J.P. Objects segmentation from high-resolution aerial images using U-Net with pyramid pooling layers. IEEE Geosci. Remote Sens. Lett. 2018, 16, 115–119. [Google Scholar] [CrossRef]
  26. An, S.; Rui, X. A High-Precision Water Body Extraction Method Based on Improved Lightweight U-Net. Remote Sens. 2022, 14, 4127. [Google Scholar] [CrossRef]
  27. Zhang, Y.; Lu, H.; Ma, G.; Zhao, H.; Xie, D.; Geng, S.; Tian, W.; Sian, K.T.C.L.K. MU-Net: Embedding MixFormer into Unet to Extract Water Bodies from Remote Sensing Images. Remote Sens. 2023, 15, 3559. [Google Scholar] [CrossRef]
  28. Li, J.; Wang, C.; Xu, L.; Wu, F.; Zhang, H.; Zhang, B. Multitemporal Water Extraction of Dongting Lake and Poyang Lake Based on an Automatic Water Extraction and Dynamic Monitoring Framework. Remote Sens. 2021, 13, 865. [Google Scholar] [CrossRef]
  29. He, H.; Huang, X.; Li, H.; Ni, L.; Wang, X.; Chen, C.; Liu, Z. Water body extraction of high resolution remote sensing image based on improved U-Net network. J. Geo-Inf. Sci. 2020, 22, 2010–2022. [Google Scholar]
  30. Schläpfer, D.; Richter, R.; Hueni, A. Recent developments in operational atmospheric and radiometric correction of hyperspectral imagery. In Proceedings of the 6th EARSeL SIG IS Workshop, Tel Aviv, Israel, 16–19 March 2009; pp. 16–19. [Google Scholar]
  31. Dave, C.P.; Joshi, R.; Srivastava, S. A survey on geometric correction of satellite imagery. Int. J. Comput. Appl. 2015, 116, 24–27. [Google Scholar]
  32. Yan, Y.; Tan, Z.; Su, N. A Data Augmentation Strategy Based on Simulated Samples for Ship Detection in RGB Remote Sensing Images. ISPRS Int. J. Geo-Inf. 2019, 8, 276. [Google Scholar] [CrossRef]
  33. Taylor, L.; Nitschke, G. Improving deep learning with generic data augmentation. In Proceedings of the 2018 IEEE Symposium Series on Computational Intelligence (SSCI), Bangalore, India, 18–21 November 2018; pp. 1542–1547. [Google Scholar]
  34. Krell, M.M.; Kim, S.K. Rotational data augmentation for electroencephalographic data. In Proceedings of the 2017 39th Annual International Conference of the IEEE Engineering in Medicine and Biology Society (EMBC), Jeju Island, Republic of Korea, 11–15 July 2017; pp. 471–474. [Google Scholar]
  35. Hochreiter, S. The vanishing gradient problem during learning recurrent neural nets and problem solutions. Int. J. Uncertain. Fuzziness Knowl.-Based Syst. 1998, 6, 107–116. [Google Scholar] [CrossRef]
  36. Yamanaka, J.; Kuwashima, S.; Kurita, T. Fast and accurate image super resolution by deep CNN with skip connection and network in network. In Proceedings of the Neural Information Processing: 24th International Conference, ICONIP 2017, Guangzhou, China, 14–18 November 2017; Proceedings, Part II 24. pp. 217–225. [Google Scholar]
  37. Drozdzal, M.; Vorontsov, E.; Chartrand, G.; Kadoury, S.; Pal, C. The importance of skip connections in biomedical image segmentation. In Proceedings of the International Workshop on Deep Learning in Medical Image Analysis, International Workshop on Large-Scale Annotation of Biomedical Data and Expert Label Synthesis, Athens, Greece, 21 October 2016; pp. 179–187. [Google Scholar]
  38. Long, J.; Shelhamer, E.; Darrell, T. Fully convolutional networks for semantic segmentation. In Proceedings of the IEEE Conference on Computer Vision and Pattern Recognition, San Francisco, CA, USA, 18–20 June 1996; pp. 3431–3440. [Google Scholar]
  39. Badrinarayanan, V.; Kendall, A.; Cipolla, R. Segnet: A deep convolutional encoder-decoder architecture for image segmentation. IEEE Trans. Pattern Anal. Mach. Intell. 2017, 39, 2481–2495. [Google Scholar] [CrossRef]
  40. Pekel, J.-F.; Cottam, A.; Gorelick, N.; Belward, A.S. High-resolution mapping of global surface water and its long-term changes. Nature 2016, 540, 418–422. [Google Scholar] [CrossRef] [PubMed]
  41. Wang, C. Ecological Civilization is the Chinese Wisdom and Chinese Plan for Sustainable Development. In Beautiful China: 70 Years Since 1949 and 70 People’s Views on Eco-Civilization Construction; Springer: Berlin/Heidelberg, Germany, 2021; pp. 449–460. [Google Scholar]
  42. Muller, D.G. China as a Maritime Power; Routledge: London, UK, 2019. [Google Scholar]
  43. Wang, H.; Xu, D.; Zhang, D.; Pu, Y.; Luan, Z. Shoreline Dynamics of Chongming Island and Driving Factor Analysis Based on Landsat Images. Remote Sens. 2022, 14, 3305. [Google Scholar] [CrossRef]
  44. Li, J.; Ma, R.; Cao, Z.; Xue, K.; Xiong, J.; Hu, M.; Feng, X. Satellite Detection of Surface Water Extent: A Review of Methodology. Water 2022, 14, 1148. [Google Scholar] [CrossRef]
  45. Dellepiane, S.; De Laurentiis, R.; Giordano, F. Coastline extraction from SAR images and a method for the evaluation of the coastline precision. Pattern Recognit. Lett. 2004, 25, 1461–1470. [Google Scholar] [CrossRef]
  46. Shen, G.; Ibrahim Abdoul, N.; Zhu, Y.; Wang, Z.; Gong, J. Remote sensing of urban growth and landscape pattern changes in response to the expansion of Chongming Island in Shanghai, China. Geocarto Int. 2017, 32, 488–502. [Google Scholar] [CrossRef]
  47. Shilun, Y. A study of coastal morphodynamics on the muddy islands in the Changjiang River estuary. J. Coast. Res. 1999, 15, 32–44. [Google Scholar]
Figure 1. Schematic of the study area.
Ijgi 13 00134 g001
Figure 2. Flowchart of the current study.
Ijgi 13 00134 g002
Figure 3. Distribution of image collection dates.
Ijgi 13 00134 g003
Figure 4. Schematic diagram of the rotated image. (a) Original image; (b) rotated 90°; (c) rotated 180°; (d) rotated 270°.
Ijgi 13 00134 g004
Figure 5. Structure of the ISUNet model.
Ijgi 13 00134 g005
Figure 6. Results of visualization of each model (The locations of the red circle show the extraction of the detailed features by each model).
Ijgi 13 00134 g006aIjgi 13 00134 g006b
Figure 7. Changing trend of water body area in the study area from 2013 to 2022.
Ijgi 13 00134 g007
Figure 8. Results of the analysis of water body changes in 2013 and 2022. (a): Satellite observation images in 2010.05.01; (b): Satellite observation images in 2013.05.25; (c): Satellite observation images in 2022.05.18; (d): Comparison of Water Body Change Areas between 2013 and 2022. (The numbers 1, 2, 3, 4 represent the serial numbers of areas where notable changes have occurred.)
Ijgi 13 00134 g008
Figure 9. Comparison of changing trends in this research and JRC dataset.
Ijgi 13 00134 g009
Table 1. Satellite image collection date for the training and test sets.
Data TypesImage Collection Date
Training sets23 January 2015
12 March 2015
3 August 2015
26 January 2016
27 February 2016
20 May 2016
13 February 2017
23 July 2017
23 May 2018
17 December 2018
18 January 2019
10 May 2019
29 May 2019
21 January 2020
12 May 2020
Test sets27 February 2022
15 March 2022
18 May 2022
Table 2. Results of evaluation indexes of each model.
AccuracyPrecisionIOUF1 Score
FCN80.98140.98130.94630.9713
SegNet0.97170.97170.92150.9562
UNet0.98300.98300.94350.9714
ISUNet0.98360.98370.94790.9723
Table 3. Visual interpretation validation results.
YearArea Absolute Error (km2)Area Relative Error
201339.5650.741%
201426.1270.500%
201535.1680.661%
201640.1440.786%
20179.6470.192%
201825.2070.497%
20195.1250.099%
202010.3370.222%
202112.9750.257%
202243.8110.879%
Table 4. Extraction results for water bodies in the study area in 2014, 2018, and 2022 (The red boxes show locations where significant changes have occurred in the study area).
Imaging Date4 November 201423 March 201818 May 2022
Original imageIjgi 13 00134 i001Ijgi 13 00134 i002Ijgi 13 00134 i003
Identification resultsIjgi 13 00134 i004Ijgi 13 00134 i005Ijgi 13 00134 i006
Table 5. Comparison of water edge identification results of different methods for the three types of typical coasts in each model study area.
Artificial ShoreSandy ShoreSilty ShoreTraining Runtime
Original imageIjgi 13 00134 i007Ijgi 13 00134 i008Ijgi 13 00134 i009
FCN8Ijgi 13 00134 i010Ijgi 13 00134 i011Ijgi 13 00134 i0129 h 07 min 56 s
SegNetIjgi 13 00134 i013Ijgi 13 00134 i014Ijgi 13 00134 i0156 h 23 min 38 s
UNetIjgi 13 00134 i016Ijgi 13 00134 i017Ijgi 13 00134 i0188 h 07 min 08 s
ISUNetIjgi 13 00134 i019Ijgi 13 00134 i020Ijgi 13 00134 i02110 h 00 min 51 s
Table 6. Results of evaluation indexes of each model based on the 2013 imagery.
AccuracyPrecisionRecallF1 Score
FCN80.94360.92860.99230.9519
SegNet0.95590.95630.98320.9615
UNet0.96780.95140.99050.9710
ISUNet0.96880.95230.99320.9723
Disclaimer/Publisher’s Note: The statements, opinions and data contained in all publications are solely those of the individual author(s) and contributor(s) and not of MDPI and/or the editor(s). MDPI and/or the editor(s) disclaim responsibility for any injury to people or property resulting from any ideas, methods, instructions or products referred to in the content.

