Article

Analysing the Spatio-Temporal Variations of Urban Street Summer Solar Radiation through Historical Street View Images: A Case Study of Shanghai, China

1
School of Architecture, Tianjin University, Tianjin 300072, China
2
School of Architecture, Harbin Institute of Technology, Shenzhen, Shenzhen 518055, China
*
Author to whom correspondence should be addressed.
These authors contributed equally to this work and should be considered co-first author.
ISPRS Int. J. Geo-Inf. 2024, 13(6), 190; https://doi.org/10.3390/ijgi13060190
Submission received: 7 May 2024 / Revised: 4 June 2024 / Accepted: 5 June 2024 / Published: 7 June 2024

Abstract

:
Understanding solar radiation in urban street spaces is crucial for comprehending residents’ environmental experiences and enhancing their quality of life. However, existing studies rarely focus on the patterns of urban street solar radiation over time and across different urban and suburban areas. In this study, street view images from the summers of 2013 and 2019 in Shanghai were used to calculate solar radiation in urban street spaces. The results show a general decrease in street solar radiation in 2019 compared to 2013, with an average drop of 12.34%. The decrease was most significant in October (13.47%) and least in May (11.71%). In terms of solar radiation data gathered from street view sampling points, 76.57% showed a decrease, while 23.43% showed an increase. Spatially, solar radiation decreased by 79.66% for every additional 1.5 km from the city centre. In summary, solar radiation generally shows a decreasing trend, with significant variations between different areas. These findings are vitally important for guiding urban planning, optimising green infrastructure, and enhancing the urban ecological environment, further promoting sustainable urban development and improving residents’ quality of life.

1. Introduction

The process of urbanisation facilitates rapid changes in cities within a short period, and the study of changes in the built environment of streets and related elements has increasingly attracted attention [1]. The streets of a city not only connect the physical components of the built environment but also permeate the daily activities and life scenes of urban residents [2]. Urban streets serve as carriers of natural spaces in the city, providing residents with venues for various activities, socialising, and leisure [3]. Solar radiation in streets, as a key factor, significantly impacts the urban climate, energy consumption, and residents’ quality of life. The level of solar radiation in the urban street environment directly affects individual outdoor activity levels and the utilisation of urban spaces [4,5,6,7]. Moreover, due to its many influencing factors, the urban street environment often creates unique microclimates, which directly affect both the thermal comfort of the street environment and the solar radiation in urban streets [8]. Therefore, assessing solar radiation changes in urban streets based on the built environment plays a significant role in enhancing the urban environment and the quality of life for residents.
In summer, poor urban street thermal environments can have a significant negative impact on outdoor activities and the efficiency of outdoor work for city residents. Excessively cold outdoor urban environments can inconvenience city dwellers, while strong solar radiation in summer can greatly limit their outdoor activities [7,9]. Research indicates that approximately one-fifth of natural disasters in the United States each year are caused by extreme high temperatures [10]. In the context of global warming, many cities are expected to experience more severe extreme high-temperature environments, which could lead to more serious natural disasters and consequences. One important environmental parameter affecting the thermal comfort of urban streets is the amount of solar radiation entering them [9,11]. However, the effect of solar radiation on pedestrian thermal perception differs between summer and winter. In winter, pedestrians prefer to be exposed to sunlight [5,9], but in summer, solar radiation is often considered uncomfortable, directly affecting pedestrians’ experiences on urban streets in summer. This is particularly important in countries and cities located in cold and temperate zones [6]. As urbanisation and urban planning progress, humanising urban spaces has become a focus, making the reduction of summer solar radiation in urban street design increasingly significant.
Solar radiation refers to the energy emitted from the sun in the form of electromagnetic waves that radiate onto the Earth [12]. This radiant energy is fundamental for all weather systems and biological survival on Earth, playing a crucial role in maintaining the Earth’s surface temperature and lighting conditions. Solar radiation primarily consists of direct radiation and scattered radiation. Direct radiation is the radiation that reaches the Earth’s surface directly from the sun, without being significantly scattered or absorbed by the atmosphere. Scattered radiation, on the other hand, occurs as sunlight passes through the Earth’s atmosphere and is scattered by atmospheric particles such as gas molecules, water droplets, and dust, thereby changing the direction of light propagation. These two forms of radiation together determine the total amount of solar radiation received at the Earth’s surface, thereby affecting the temperature of the surface and the adjacent air and forming specific microclimatic conditions.
The impact of solar radiation on urban microclimates is multifaceted and complex. An urban microclimate refers to the climate variation within a city, as compared to the surrounding suburbs, over a small area. This variation is primarily caused by factors such as the city’s architectural layout, materials, the degree of vegetation cover, and human activities [13]. As one of the key natural factors affecting urban microclimates, the influence of solar radiation is mainly manifested in the following aspects: Urban Heat Island Effect: In cities, a large number of buildings and artificial surfaces (such as concrete and asphalt) absorb and store solar radiation energy, resulting in higher temperatures in urban areas than in surrounding rural areas. This temperature difference not only affects the comfort of urban residents but also increases the energy consumption and air conditioning load of the city [14]. Surface and Air Temperature: On sunny days, the ground absorbs solar radiation and heats up, which, through heat conduction and convection, heats the air, leading to an increase in temperature. The uneven distribution of solar radiation also leads to temperature differences between different areas within the city [15]. Human Comfort and Outdoor Activities: The intensity of solar radiation directly affects the thermal comfort of urban residents and their choices of outdoor activities. In summer, strong solar radiation may cause the outdoor environment to overheat, reducing the comfort and willingness of people to engage in outdoor activities. In winter, suitable solar radiation can increase the frequency of outdoor space usage, improving people’s comfort [16]. Regulatory Role of Green Infrastructure: Urban green infrastructure, such as parks, green belts, and rooftop gardens, can regulate the effects of solar radiation by providing shade and through the transpiration of plants, thereby reducing surface temperatures, alleviating the urban heat island effect, and improving the urban microclimate. Furthermore, suitable greenery arrangements can optimise the utilisation of solar radiation, providing a more comfortable outdoor environment for the city [17].
However, due to the complex mechanisms between solar radiation and urban development [18], there remains a significant research gap. Firstly, previous studies on urban solar radiation have focused on measurements in special or key areas [19], with little attention given to the imbalances in development within and outside cities. Secondly, discussions and observations of the characteristic distribution of solar radiation in urban streets are often limited to the same temporal cross-section [20]. However, street view images possess temporal attributes, satisfying the basic conditions for discussing multidimensional temporal cross-sections [21]. Relying solely on remote sensing data to simulate solar radiation in urban street canyons is challenging due to its specificity in modelling direct solar radiation to the ground. Moreover, street view images are captured from the perspective of the street, simulating the first-person view of a pedestrian. Thirdly, many urban models overly simplify the spatial geometric morphology within urban street canyons [8], often excluding the canopy of street trees, leading to an inability to incorporate the impact of urban street canyon spatial geometry on direct solar radiation and the thermal environment into calculations. To address these research gaps, we propose three research questions based on measurements of solar radiation changes in urban streets and the distribution inside and outside cities.
  • How can the distribution of urban street solar radiation over different temporal cross-sections be calculated using urban street view images from different years?
  • What is the overall trend of changes in urban street solar radiation over time?
  • Does the variation in urban street solar radiation in the inner and outer parts of a city exhibit consistency?
To address these research questions and explore the spatio-temporal distribution of urban street solar radiation, this study employed an analytical framework based on multi-year street view data. Firstly, the street view data underwent preprocessing to select images that met the specified criteria. Then, using deep learning for the semantic segmentation of fisheye street view images, solar radiation was calculated by overlaying the solar trajectory. Finally, the temporal and spatial characteristics of solar radiation were analysed and discussed. The changes in Shanghai were analysed as a case study. Another major contribution of this research is the proposal of a new method for efficiently exploring the spatio-temporal distribution of solar radiation using multi-year street view data.

2. Background and Related Works

2.1. Time Series Street View Research

Using street view images for urban space assessment is a popular method currently. Street view images offer a unique perspective of pedestrian activities, characterised by their wide coverage and detailed spatial acquisition. They have been employed in studies of urban environments and phenomena at various scales [22]. Street view images are typically processed using datasets from autonomous vehicle driving, as they share similar application scenarios in identifying built environment objects on roads. Examples include the ADE20K dataset [23] or the Cityscapes dataset [24].
Street view imagery is utilised for interpreting urban phenomena. It allows for a comprehensive assessment of green metrics in cities, such as the structure and quantity of urban greenery, through the detailed distribution of trees, shrubs, and herbs identified within the images. This imagery provides constructive suggestions for urban greening projects [25]. When combined with computerised object detection technologies, street view imagery also finds multifaceted applications in measuring the sky, including assessing sky openness [26], calculating the solar reflectivity of building façades [27], and measuring solar radiation. Additionally, street view imagery is extensively used in identifying economic indices [28,29] and traffic conditions [30,31], and in conjunction with other data types.
Street view data collected over multiple years can record the physical environment of city streets at different times, which is instrumental in providing strong reference points for urban planning and policy-making [32]. Secondly, by comparing street view data from different years, one can directly observe changes in city streets in terms of functional layout [33], green coverage [34], gentrification processes [35], and seasonal variations [36]. This reveals the evolutionary characteristics of streets during urban development and factors influencing urban renewal. Comparing street environments before and after policy implementation aids in understanding the effectiveness and sustainability of these policies, and offers valuable suggestions for policy optimisation [37]. Multi-year street view data can also reveal spatial differences and evolutionary processes in solar radiation across different areas, helping to identify priority areas for urban street planning and providing a basis for targeted environmental interventions by urban planning and management departments.

2.2. Solar Radiation in Urban Areas

Solar radiation in urban areas is primarily discussed in terms of spatial distribution, influencing factors, and trends. Some studies focus on the spatial distribution characteristics of urban solar radiation, such as the impact of high-rise buildings, green coverage, and urban morphology. Research indicates that direct solar radiation in urban streets is often influenced by the tree cover ratio, geometric features of the streets, and the urban street network [5,6,8,38]. Streets with a higher height-to-width ratio typically have more shaded areas and a better thermal environment in the summer. The solar radiation received by urban streets is also affected by the spatial arrangement of surrounding buildings and the orientation of urban street canyons. Streets oriented east–west tend to receive more solar radiation, as their direction aligns with the direct angle of the sun. The orientation of the streets also influences the shading effect of trees on either side [39]. However, east–west-aligned street trees can provide better cooling effects in the microclimate of urban street canyons [40]. These findings highlight the regulatory role of urban street greening on the microclimate of urban street canyons. Despite the impact of the vertical structure of green vegetation in urban street canyons on solar radiation intake, this aspect cannot be reflected in remote sensing data [41]. Therefore, choosing appropriate data sources and technical methods for the efficient simulation and calculation of solar radiation is crucial.

2.3. Solar Radiation Simulation and Calculation

With technological advancements, researchers have proposed and developed various methods and tools to calculate solar radiation levels within street canyon networks. Numerical simulation models can reflect changes in spatial heterogeneity [42]. Models based on Computational Fluid Dynamics (CFD) software like FLUENT are widely used to study the urban climate and solar radiation levels [43]. Repeated simulations of urban areas, including complex built environments (comprising buildings, vegetation, and public infrastructure), require a higher computational power and longer analysis time. Due to high demands on computer performance and computational costs, CFD models are difficult for non-experts to use or apply in large-scale urban models [44]. Calculating based on remote sensing imagery is a classical method, computing canopy coverage, vegetation indices, etc., to explain the microclimate regulation role of urban street canyons. However, this only reflects the remote sensing imagery at a certain time and cannot simulate the solar radiation values influenced by complex street tree canopy structures and precise solar trajectories. With the prevalence of high-resolution digital model data, accurately simulating solar radiation in street canyons has become possible. Yet, these digital urban models often do not include the tree canopy layer.
Matzarakis et al. employed ground-based hemispherical images, in conjunction with onsite measurements, to precisely gauge solar radiation and thermal environments within urban street canyons [45]. This demonstrated that ground-based hemispherical images are a valuable supplemental data source when simulating and measuring solar radiation in urban street canyons. The use of these images allows for a more accurate consideration of the angle of solar incidence. Building on this, Li utilised urban street view images to measure solar radiation [46]. Another study measured the potential for photovoltaic power generation in city roads through street view images [47]. Traditional urban space solar radiation calculations primarily rely on manual surveys of small-scale spaces. Although these surveys achieve a high degree of accuracy, they are inefficient [16]. Utilising street view image data can effectively address this issue. This is because street view data are widely distributed in the majority of cities around the world, making it possible for researchers to analyse urban solar radiation on a large scale using street view images [47].
In summary, despite previous studies employing various methods to measure solar radiation, including street view data, there remains a gap in understanding the long-term variations in solar radiation in urban streets over multiple summers. Typically, research on solar radiation has focused on changes at the city-wide scale, overlooking the spatial differences between urban centres and suburbs. Therefore, this study integrates deep learning methods with the unique availability of large-scale street view data from the same locations over different time periods, to conduct a spatio-temporal analysis of a long-term solar radiation simulation and calculation in urban streets.

3. Methodology

3.1. Study Area and Data

This study selects the central urban area of Shanghai as the research area (Figure 1). Shanghai is an important Chinese city for finance, culture, and international openness. According to the data from China’s seventh national census, the total population of Shanghai is approximately 24.87 million. The central urban area is a highly developed region of Shanghai, accounting for more than half of the total population. The study area is located within the Shanghai Outer Ring Road, covering a land area of 664 square kilometres. This region is characterised by a diverse range of street canyon types, from the skyscrapers of the financial district to preserved traditional residential buildings. Shanghai has a subtropical monsoon climate, with an average annual temperature of 17.6 °C, 1885.9 h of sunshine, and 1173.4 mm of precipitation. Summers are typically very hot, with average temperatures exceeding 17.5 °C from May to October. The spatial variation of street canyon types and the relatively high summer temperatures make Shanghai an excellent case study area for examining changes in solar radiation.
The datasets used in this study include road network data, street view data, and solar position data. The road network data are downloaded from OpenStreetMap (OSM), extracting the road network of the central urban area of Shanghai. Subsequently, we generated 71,546 sampling points along the streets, with a distance of 50 metres between two neighbouring points (Figure 1). Then, using the coordinates of these sampling points, we downloaded metadata from the Baidu website [46]. We screened all the sampling points for the historical collection time and season. The filtering criteria were as follows: 1. Data from both 2013 and 2019 are available. 2. The data collection time is between May and October. A total of 33,626 sampling points met these two conditions. For more information about Baidu Street View (BSV), please refer to the next section.

3.2. Multi-Year Street View Data Collection and Seasonal Filtering

In this study, in order to collect historical street view data for specific years, the process is divided into several steps. The first step is to download Shanghai’s road network through OSM and generate sampling points at 50 m intervals (Figure 1c).
The second step is to access the metadata of the point on the Baidu server through the latitude and longitude coordinates of the sampling points. The metadata contain more than ten types of information for the coordinates. The metadata used in this study mainly include the following types: ID (unique index number of the street view image), TimeLine (all historical data information existing for the coordinates), and MoveDir (the angle between the camera’s forward direction and the northern direction when shooting). This is a BSV metadata example located at (longitude: 121.4953441, latitude: 31.2398195).
Metadata of BSV panorama
{“ID”: “09000300121905211356019738P”,
“MoveDir”: “65.649”,
“TimeLine”: [
{“ID”:”09000300121905211356019738P”,”IsCurrent”:1,”Time”:”day”,”TimeDir”:”“,”TimeLine”:”201905”,”Year”:”2019”},
{“ID”:”09000300121709121417093205B”,”IsCurrent”:0,”Time”:”day”,”TimeDir”:”obsolete”,”TimeLine”:”201709”,”Year”:”2017”},
{“ID”:”09000300001504110442569601A”,”IsCurrent”:0,”Time”:”day”,”TimeDir”:”obsolete”,”TimeLine”:”201504”,”Year”:”2015”},
{“ID”:”01000300001310131324599685J”,”IsCurrent”:0,”Time”:”day”,”TimeDir”:”obsolete”,”TimeLine”:”201310”,”Year”:”2013”}]}
In the third step, we collected all historical information and metadata for 71,546 street view points. This comprised a total of 214,377 data entries, which we analysed using the Pandas library to compile statistics on the historical information of these street views (Table 1). The statistical analysis revealed that large-scale data updates were conducted by the map providers in 2013, 2015, 2017, and 2019. Due to the defoliation of trees in winter and the reduced impact of solar radiation intensity on pedestrians’ subjective perception, we confined the time variable to data collected from May to October during the summer, excluding the winter period. Therefore, we excluded the year 2015. As we aimed to examine the trend of solar radiation over an extended period, we also excluded the year 2017. Finally, we selected street view points that had data from both 2013 and 2019, resulting in a total of 33,626 eligible sampling points.
Step four, use the unique ID obtained in the previous step to fill in the URL for server access. Obtain the left and right halves of the panoramic image, both with a resolution of 512 × 512 pixels (Figure 2a). In the script we developed, stitching the left and right halves of the panoramic image together yields a complete street view panoramic image.

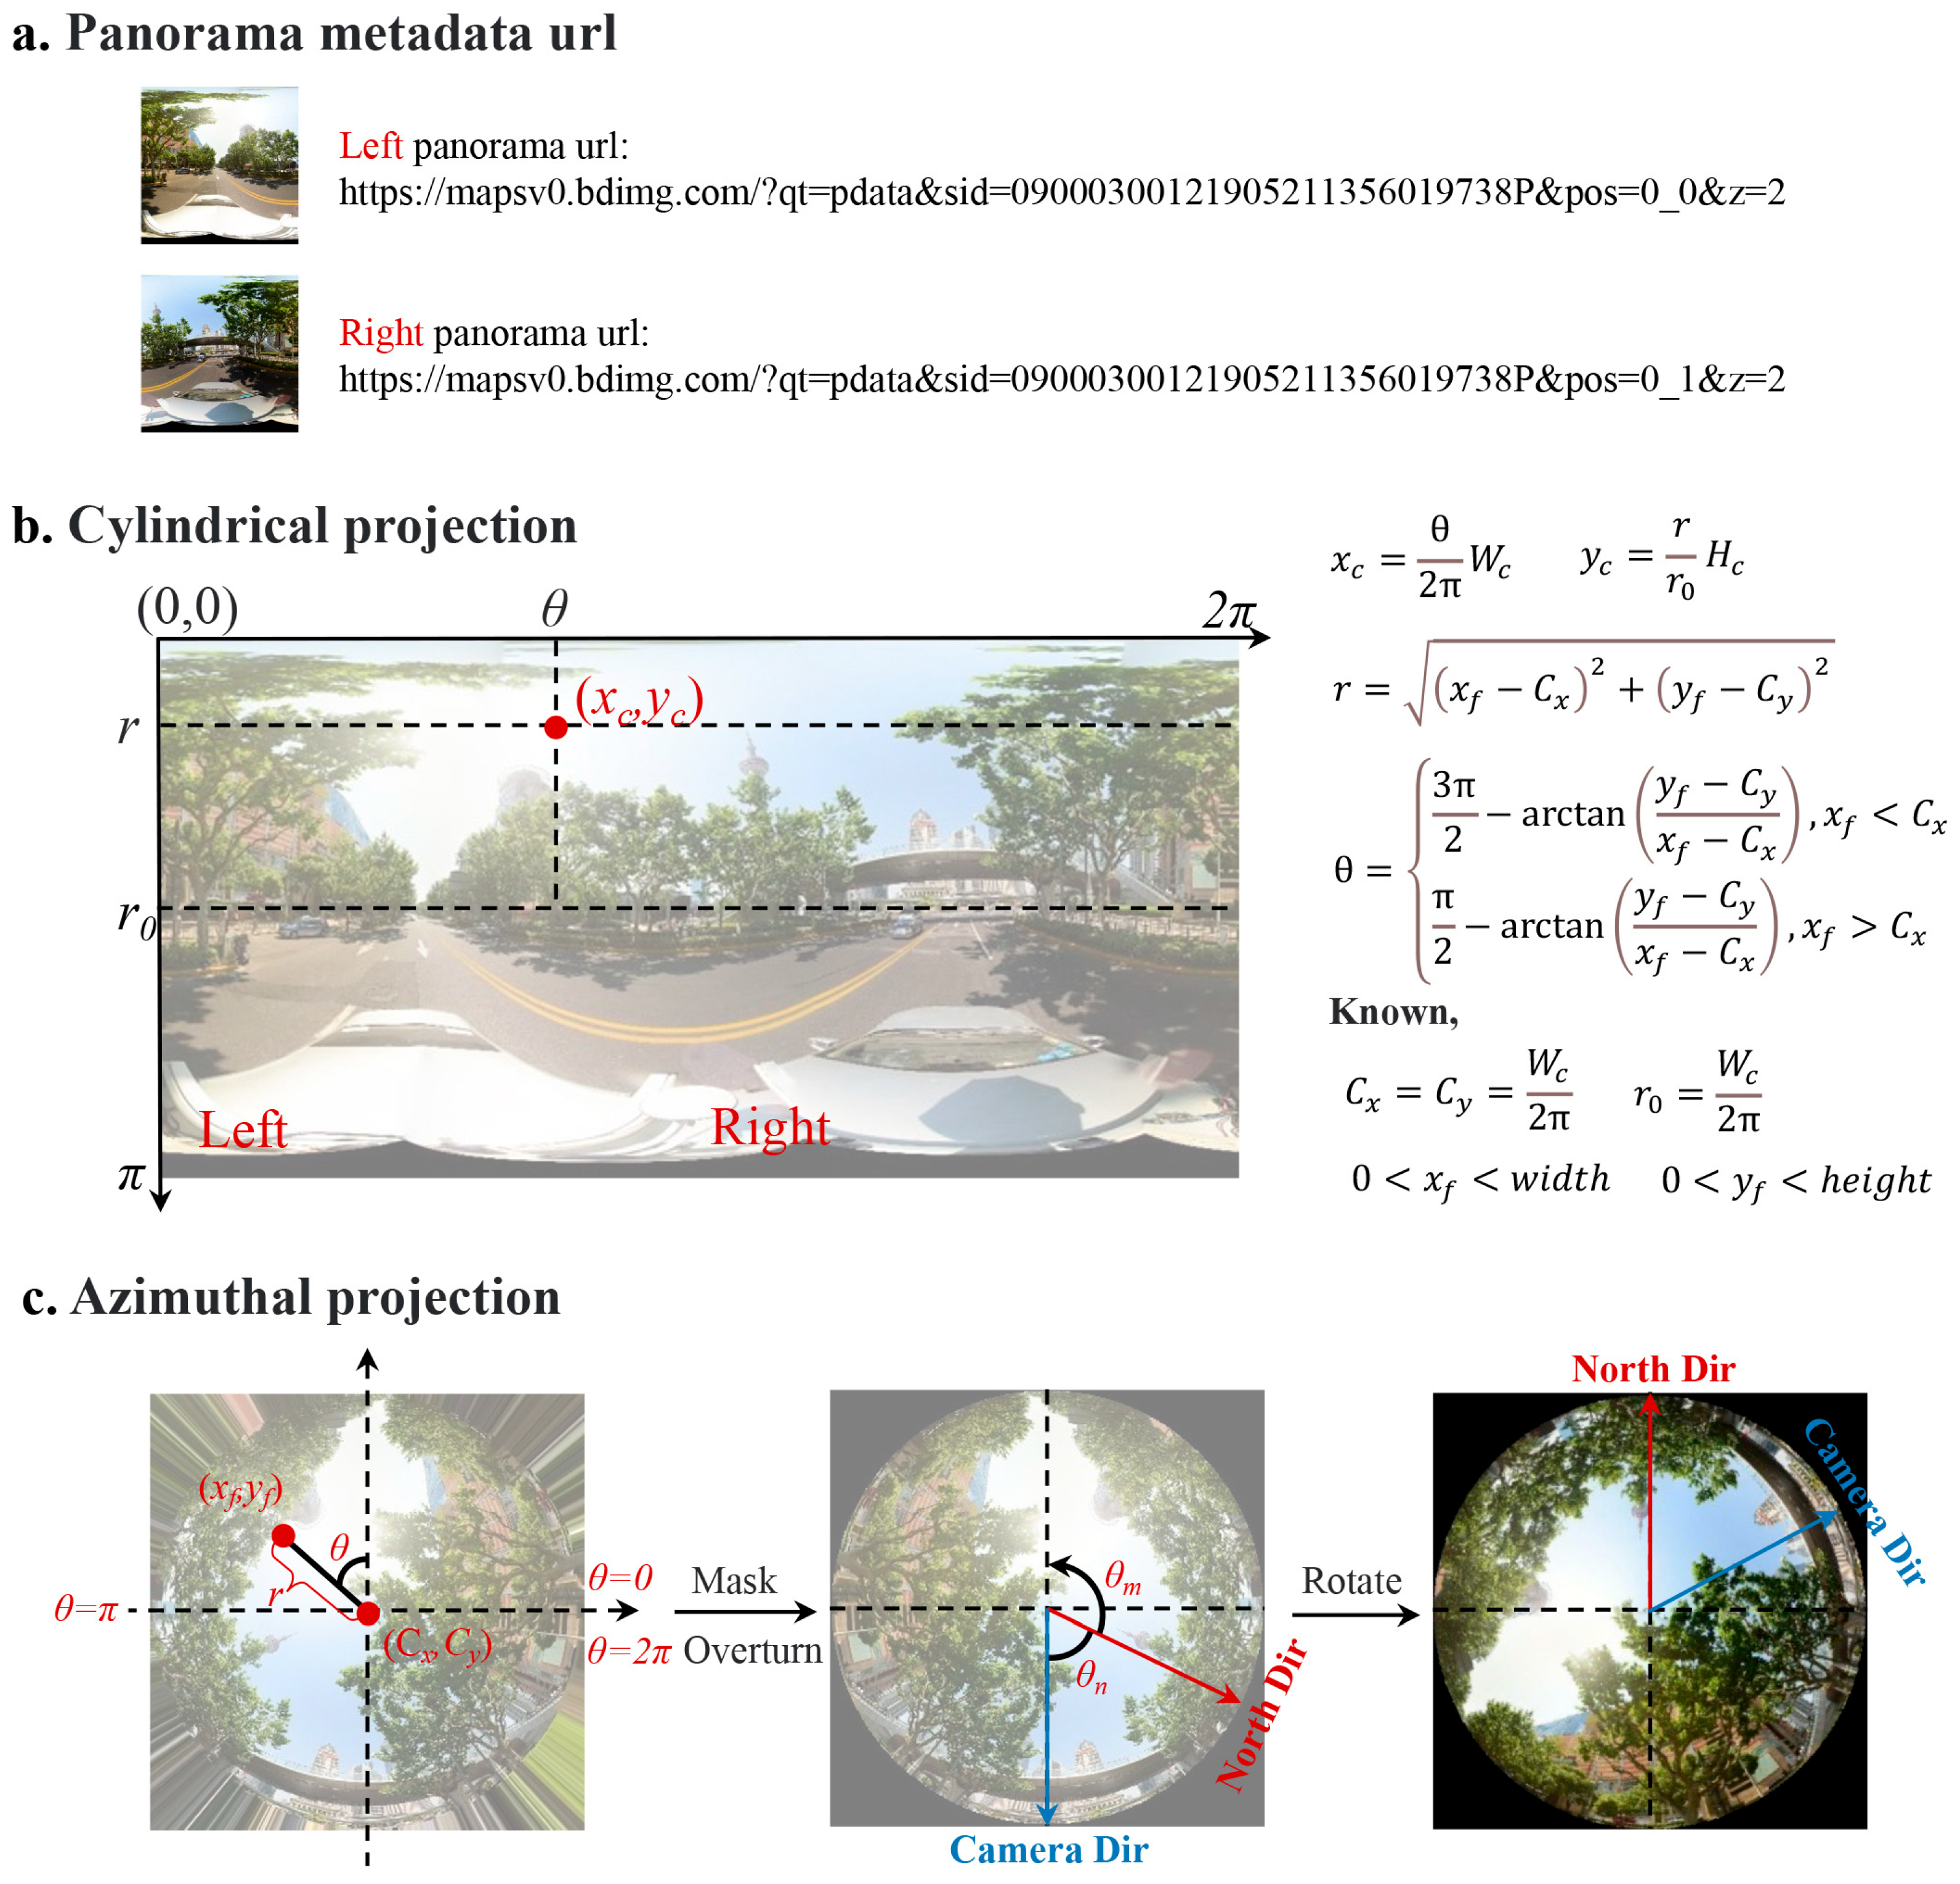
3.3. Fisheye Image Generation and Azimuthal Rotation

After filtering the street view sampling points by season and year, panoramic street view images are collected through metadata (Figure 2a). In this study, we convert these BSV panoramic images from equirectangular cylindrical projection to equidistant azimuthal projection to create fisheye images [46]. The mathematical model for the conversion is detailed in Figure 2b. Wc and Hc represent the width and height of the panoramic image, so the radius of the fisheye image, r0, is Wc/, and the width and height of the fisheye image are Wc/π. Thus, the centre of the fisheye image (Cx, Cy) is calculated using Equation (1). For any pixel position (xf, yf) in the fisheye image, the corresponding pixel position (xc, yc) in the panoramic image can be obtained through calculation using Equation (2).
C x = C y = W c 2 π
x c = θ 2 π W c   y c = r r 0 H c
For any point in the fisheye image, the angle θ between the coordinates and the starting position, and the radius r from the centre, can be calculated using Equations (3) and (4).
θ = 3 π 2 arctan y f C y x f C x , x f < C x π 2 arctan y f C y x f C x , x f > C x
r = x f C x 2 + y f C y 2
The aforementioned mathematical model is used to transform street view panoramic images into fisheye images. However, panoramic images are entirely in the format of left vehicle rear and right vehicle front, so the generated fisheye images do not have their top side facing north in the actual geographical space. Therefore, it is necessary to use the angle between the camera and the north side when taking pictures, as collected in the metadata. The rotation angle is calculated using Equation (5). The OpenCV tool is used for image processing and rotation, with a consistent counterclockwise rotation applied. The fisheye image is rotated, so that its top side faces north in the geographical space (Figure 2c).
θ m = 180 θ n , θ n 180 540 θ n , θ n > 180
In Formula (5), θn represents the MoveDir derived from the BSV panoramic metadata, while θm is the angle calculated for rotating the image counterclockwise using OpenCV, as shown in Figure 2c. This alignment allows the rotated fisheye image to share the same coordinate system with the sun path projection on a two-dimensional plane. Consequently, it becomes feasible to overlay the sun path with the fisheye image, facilitating the calculation of solar radiation in this study.

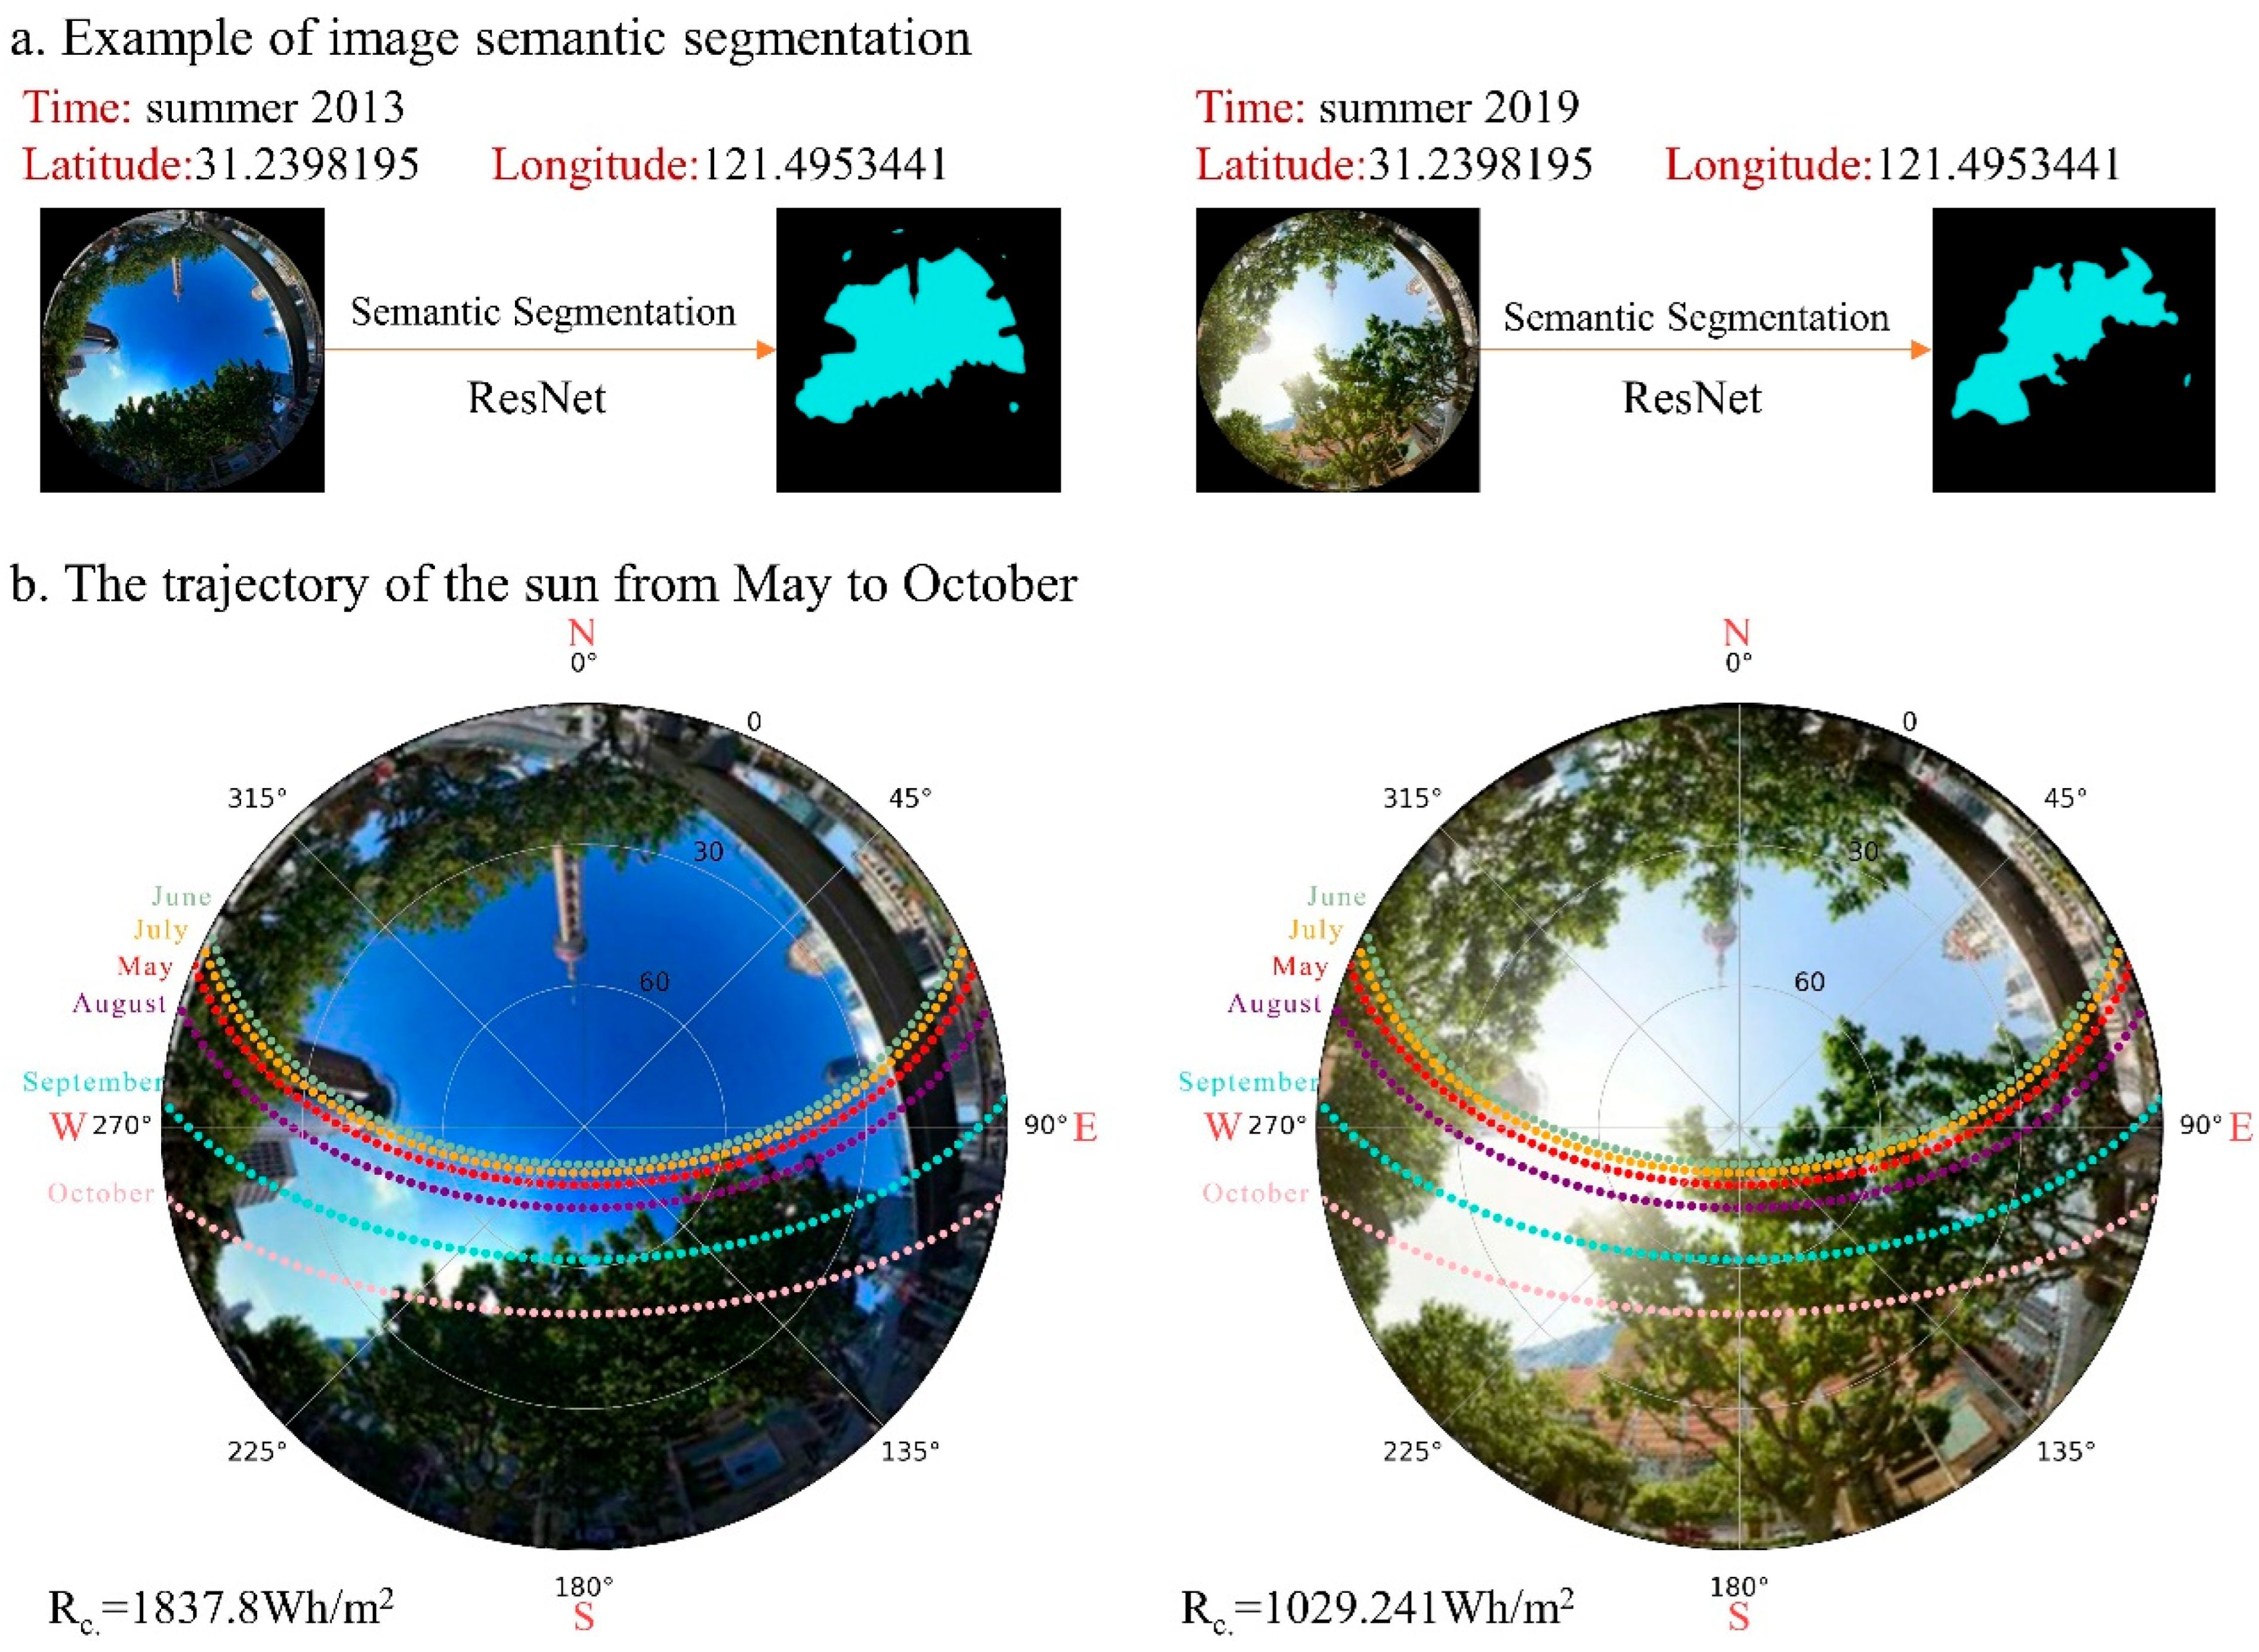
3.4. Calculating Solar Radiation over Many Years through Street Views

In the sweltering summer streets of urban canyons, street trees and buildings are the primary means of providing shade for pedestrians. As cities develop, buildings, being artificial structures, remain largely unchanged over an extended period, barring instances of demolition or new construction. Therefore, in the summer, the shade provided by trees becomes the most significant factor influencing the study of the radiant environment. By providing specific geographic coordinates (longitude and latitude), it is possible to calculate the precise movement path of the sun at any given moment. Subsequently, overlaying this data with a fisheye lens map allows for the calculation of the solar radiation ratio and its variations.
Calculating solar radiation requires considering the proportion of the sky in a fisheye image. Previous studies have employed threshold segmentation methods or machine learning approaches to identify differences in pixel colour between plants and the sky. With the development of deep learning, the use of mature image semantic segmentation technology can more accurately evaluate the proportion of the sky in fisheye images. We employed a pre-trained deep learning model based on the ResNet neural network architecture [23] (Figure 3a). Specifically, this architecture introduced the concept of residual structures, which significantly mitigates the issue of training difficulties in deep neural networks. This architecture is a classic network structure in image semantic segmentation tasks and is fully capable of meeting the accuracy requirements of this study. It should be noted that deep learning methods are only used for image semantic segmentation and cannot be directly applied to evaluate solar radiation.
Using Pysolar, the position of the sun can be precisely calculated based on geographical coordinates and time. As the sun changes position over the course of a day, its movement trajectory can be overlaid with a fisheye diagram to measure the duration of solar radiation. Figure 3b displays the sun’s movement trajectory for 2013 and 2019. The time frame is from May to October, on the 15th of each month. The movement trajectory is recorded every 10 min. If the sun is not in the sky area of the fisheye diagram, sunlight will be obstructed by plants and buildings. Our study is based on ideal conditions of clear weather without cloud cover, although there is a discrepancy with actual weather conditions. Nevertheless, this method of measuring solar radiation can provide scientific guidance for urban planning.
Solar radiation consists of direct radiation and diffuse radiation [48,49]. Based on fisheye images generated from BSV panoramas, reasonable predictions of solar radiation in urban streets can be made [50]. Therefore, in this study, we used fisheye image data from sampling points of two different years to calculate street radiation. For direct radiation, the calculation is based on the proportion of the intersection between the solar path and the sky pixels in the fisheye images. The calculation process can be expressed by Equation (6), where h1 is the sunrise time, h2 is the sunset time, θh represents the solar zenith angle at time h, and Bh indicates whether the sun is obscured at time h, represented by the Boolean values 0 or 1.
P D = h = h 1 h 2 B h cos θ h h = h 1 h 2 cos θ h
Diffuse radiation is a form of solar radiation scattered in the atmosphere. The amount of diffuse radiation can be estimated through the distribution of shading obstacles and diffuse sky [50]. Assuming that diffuse radiation is uniformly distributed in the sky, the sky is divided into 8 × 16 sky sectors to create a sky map. The proportion of diffuse radiation reaching the ground can be predicted using Equation (7), where Ga,z is the proportion of visible sky obtained from image semantic segmentation; θa,z,2 and θa,z,1 are the boundary zenith angles of the sky sector; and θz is the solar zenith angle at the centroid of the sky sector.
P F = a = 0 15 z = 0 7 G a , z cos θ a , z , 2 cos θ a , z , 1 cos θ z 16
The total radiation for the streets can be calculated by adding the total direct solar radiation and the total scattered solar radiation [51]. The total direct solar radiation Raddi and the total diffuse solar radiation Raddif in Equation (8) are collected from ground station data. These data come from the National Solar Radiation Database (http://www.nrel.gov/rredc/). The average daily direct radiation and diffuse radiation in Shanghai from 1 May to 31 October 2013, were found to be 3602.597826 Wh/m2 and 2591.847826 Wh/m2, respectively. From 1 May to 31 October 2019, the average daily direct radiation and diffuse radiation were 3180.038043 Wh/m2 and 2516.869565 Wh/m2, respectively.
R m o n t h = P D R a d d i + P F R a d d i f
In the final analysis of solar radiation, we calculate the average total solar radiation from May to October, represented respectively as Rmay and Roct. For thermal comfort, the five-month average radiation index is denoted as Rc (Equation (9)).
R c = R M a y + R J u n . + R J u l . + R A u g . + R S e p . + R O c t . 6

4. Results

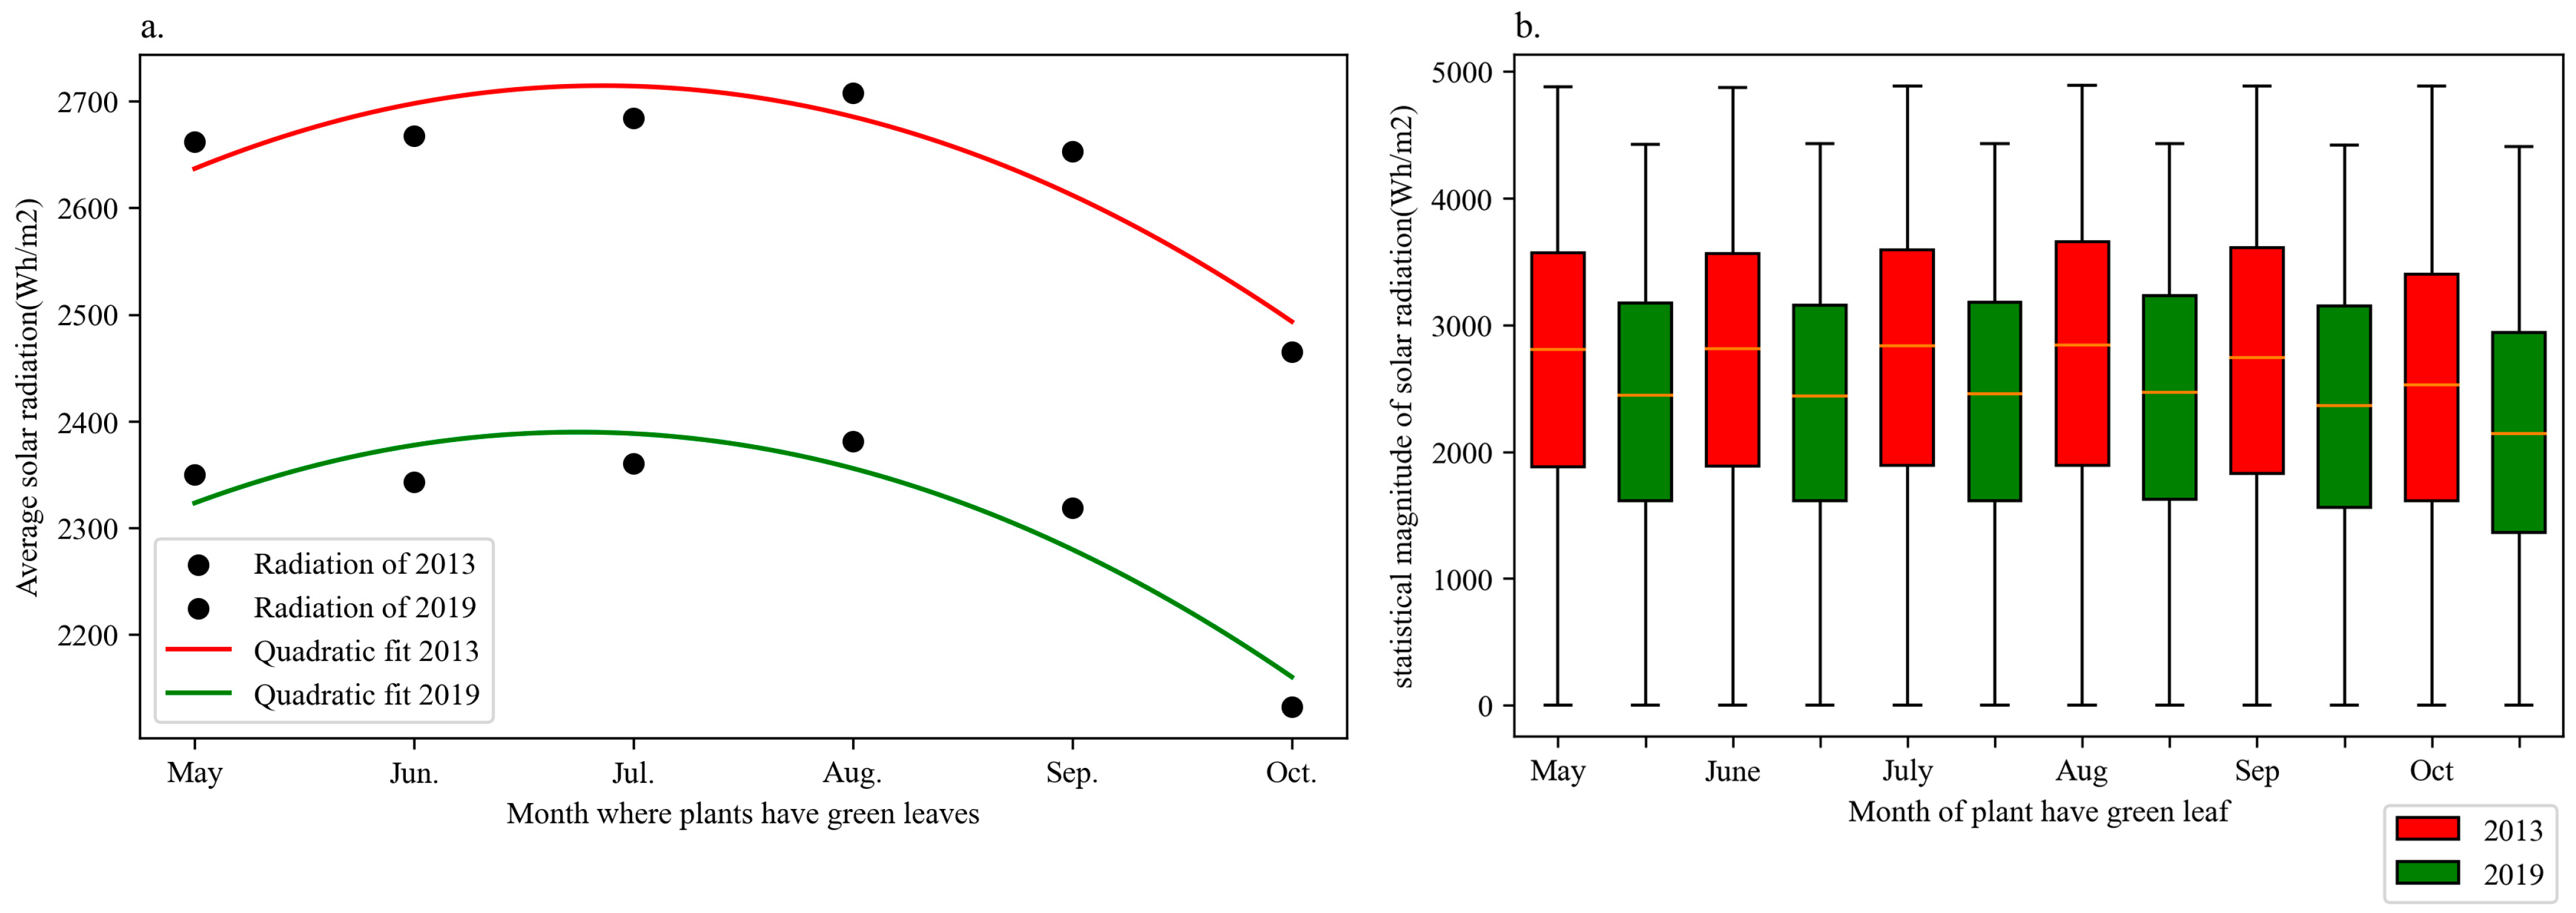
4.1. Distribution and Trend of Solar Radiation over Time

Table 2 describes the distribution characteristics of solar radiation data in Shanghai for the years 2013 and 2019. Overall, the level of solar radiation in 2019 decreased by 12.34% compared to 2013. The greatest decrease occurred in October, with a reduction of 13.47%, while the smallest decrease was in May, at 11.71%. Kurtosis (kurt) in the table is a statistical measure used to describe the shape of the distribution of solar radiation data. Kurtosis measures the peakedness of the data distribution, assisting in understanding the distribution characteristics of solar radiation in a given month. The study results show that the kurtosis values for both 2013 and 2019 are negative, indicating that the distribution of solar radiation data for these years is flatter compared to a normal distribution, suggesting a lower degree of peakedness. This may imply significant variability in solar radiation, with considerable differences in radiation levels at different locations and times. A statistical analysis of street view sampling points reveals that the number of locations with reduced solar radiation is 25,749, accounting for 76.57% of the total, while the number of locations with increased radiation is 7877, representing 23.43% of the total. These data distribution characteristics indicate an overall decreasing trend in solar radiation. This information is also useful for understanding the variations in solar radiation distribution across different areas and times within the city.
Figure 4 displays the changing trends of solar radiation in different years. In Figure 4a, we have plotted the curve fitting the changing trends of solar radiation for two years. The R2 value for 2013 is 0.8593, and the R2 value for 2019 is 0.8642. These values indicate that our curve has a high degree of accuracy when fitting solar radiation. We have used the calculated data to draw box plots of radiation levels for each month in the two years in Figure 4b. It can be observed that the overall solar radiation in 2019 is lower than in 2013. From May to October, the average solar radiation in 2013 gradually increases, reaches a peak, and then starts to decrease. Similarly, the average solar radiation in 2019 also exhibits a similar trend, but at a lower overall level.

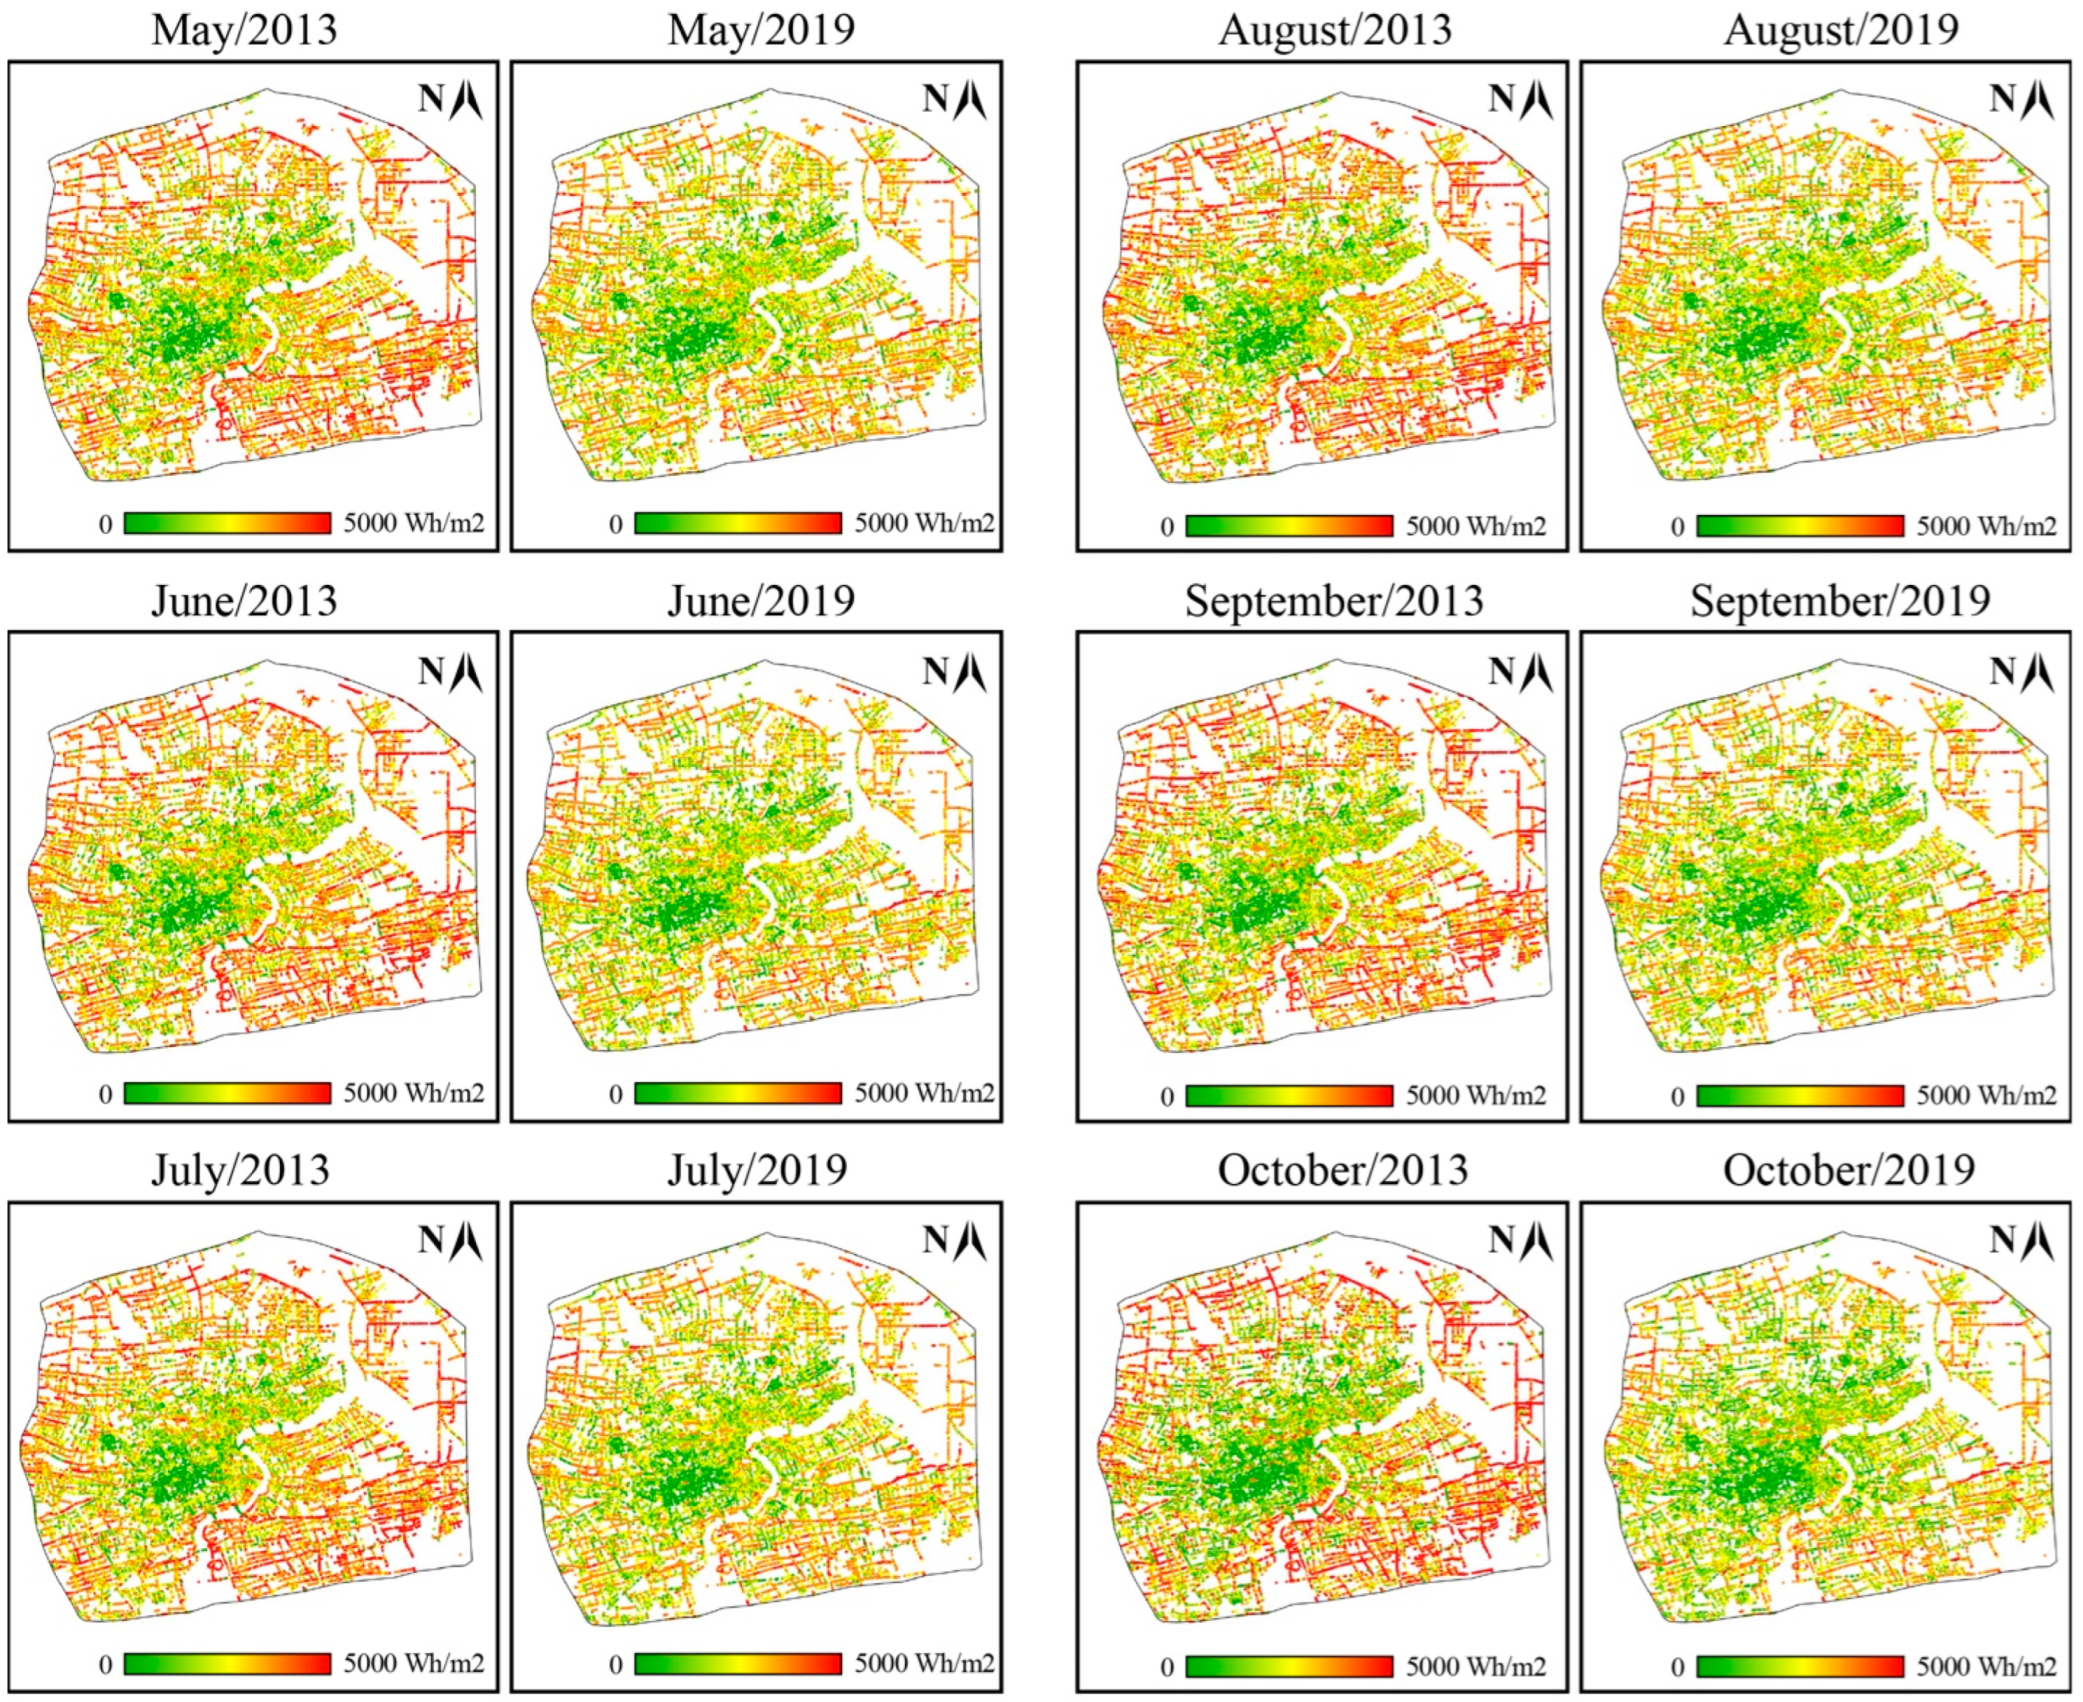
4.2. Distribution of Solar Radiation in Geographic Space

In Figure 5, we have plotted a comparison of solar radiation between May and October in the years 2013 and 2019. To ensure an intuitive comparison of geographical visualisation, we have used the same data-partitioning intervals. All value ranges are from 0 Wh/m2 to 5000 Wh/m2. As a result, we can observe that there is a varying degree of reduction in solar radiation during different months in both summer years. The average monthly reduction in summer is 325.713 Wh/m2, with September experiencing the highest reduction of 334.431 Wh/m2 and May the lowest reduction of 311.722 Wh/m2.
In terms of geographical spatial distribution, within the same temporal cross-section, the amount of solar radiation in urban central areas is typically less than that in regions outside the study area. This is due to the high-rise buildings in city centres blocking sunlight, further reducing the duration of direct radiation received by the surrounding streets. Across two temporal cross-sections, the reduction in solar radiation is more significant and apparent in Pudong, located in the southeast, compared to Baoshan, Putuo, and Jiading in the northwest. This is attributed to Pudong being a key area for urban development, receiving more financial investment and undergoing more rapid infrastructural development. Consequently, planting more trees has enhanced the shading effect on the streets. In contrast, the solar radiation in central urban areas like Yangpu, Hongkou, Jing’an, Huangpu, and Xuhui has not significantly decreased. This is because these central districts, being prioritised for development, have not seen substantial changes in their established urban architecture and vegetation growth.

4.3. Distribution and Trend of Solar Radiation Variations in Geography

We calculated the solar radiation in the urban space for both years and then calculated the difference in solar radiation at each street view collection point. In Figure 6a, we analyse the change data of solar radiation during the geographical visualisation process. The results show that the closer one is to the urban outskirts, the more likely it is that solar radiation will decrease. However, in the city centre areas, there may even be cases where solar radiation increases.
In Figure 6b, we have quantified and visualised the differences in solar radiation. The number of street view points with reduced solar radiation is represented in green, while the number of street view points with increased solar radiation is represented in red. Since there are more green street view points than red ones, it indicates that areas with decreased solar radiation outnumber those with increased solar radiation in the overall collection of street view points. We found that the overall distribution of the difference in solar radiation scores is normally distributed, in line with the fundamentals of statistics. To intuitively compare the results, we reversed the direction of the y-axis for the reduction in solar radiation and displayed it with a cool colour scheme. The results show that the decrease in solar radiation is mainly concentrated between 0 Wh/m2 and −2000 Wh/m2, while the increase in solar radiation is concentrated between 0 Wh/m2 and 1000 Wh/m2. Although there are areas in the city where solar radiation has increased, the proportion of reduced solar radiation is greater. The overall solar radiation in the city is decreasing, and the vegetation shading and infrastructure construction in this city are relatively rapid, with significant changes.
What of the spatial distribution of solar radiation in Shanghai? Inspired by the results of the solar radiation difference, we became interested in the change pattern of radiation intensity from the inner to the outer city. Is the reduction in solar radiation greater in the inner city or the outer city? Taking our selected research area as an example, we used the geometric centre of all the street view collection points as the centre of the circles and drew 13 concentric circles with a 1.5-km interval. The innermost circle has a radius of 1.5 km, and the radius of each subsequent circle increases by 1.5 km. We aggregated and averaged the solar radiation difference scores within the concentric circles to discover the spatial changes in solar radiation within the inner and outer city. In Figure 7, we draw a demonstration diagram. This demonstration diagram can cover most of the city’s street view collection points.
In Figure 8a, we can compare the mean solar radiation of each ring. Overall, except for the innermost 1.5 km, the mean solar radiation in the remaining rings in 2019 is lower than that in 2013. This indicates that the decrease in urban solar radiation has a linear consistency in both the inner and outer urban spaces. This reflects the city’s construction strategy during these six years, with the greening and shading effect being stronger in rings closer to the outer city. This also reflects the city’s historical development process as a highly modernised inner city, currently undergoing an expansion phase from the central area outwards.
We have depicted in Figure 8b the variances in solar radiation across different urban zones, illustrating the trend of solar radiation from the inner to the outer city. The X-axis represents the distance from the inner to the outer city, while the Y-axis indicates the difference in solar radiation between two years. A regression line was drawn based on these two observed values, correlating the independent and dependent variables. However, the confidence band reveals a deceleration in the reduction trend of solar radiation in the last five urban zones. The slope of this line is −41.51, with an intercept of −52.11. Thus, in comparison to the solar radiation variation within a 1.5 km radius of the city centre, for every additional 1.5 km spread outward, the solar radiation decreases by an additional 79.66%. The results indicate that, as the distance from the city centre increases, the reduction effect on street-level solar radiation also intensifies.

5. Discussion

5.1. Interannual Differences in Street View Data and Data Quality

In our research, we employed street view images from different years to assist in understanding the potential limitations and impacts of the data. When collecting street view images from various years, we used the same resolution of 1024 × 512 pixels. The street views from both years were all panoramic images, facilitating their conversion into fisheye images for analysis without the need to consider the angle of capture. This ensured the uniformity of data quality. We were unable to obtain street view data from specific months at will, as the timing of the data collection by map service providers is beyond our control. Therefore, we relaxed the time constraints, limiting the collection period to May through October. This approach guaranteed that the tree growth cycle was not in the leaf-falling stage. The method we employed for analysis involved converting panoramic images into fisheye images, with the most significant natural influencing factors being changes in plant growth and the consequent sky obstruction. These also became the main factors affecting shadow and solar radiation. Due to the consistency of the street view data, our analytical method was able to accommodate these interannual differences.
Interannual variations in street view data could also potentially have a certain impact. For example, despite the use of images with the same pixel resolution and panoramic images that do not differentiate angles, different models of panoramic cameras used in different years might result in inconsistencies in image white balance and colour temperature processing. This could lead to varying degrees of processing precision by deep learning networks in predictions across different datasets. Another example is the difference in leaf growth seasons for plants; leaves may grow differently in different months, which could inevitably have a slight impact on measurements of solar radiation. These issues could be addressed in the future by waiting for map service providers to offer more consistent data sources, as well as through improvements in data preprocessing steps and other solutions.

5.2. Summary of the Phenomenon and Implications for Development Policy

This study aims to explore the spatial distribution and trends of solar radiation in urban areas. Our results reveal that, in terms of temporal distribution, the overall average solar radiation on streets in 2019 decreased by 12.34% compared to 2013. The greatest decrease occurred in October, at 13.47%, while the smallest decrease was in May, at 11.71%. A statistical analysis of street view sampling points indicates that the quantity of locations experiencing reduced solar radiation was 76.57%, while those with increased radiation accounted for 23.43%. Spatially, for every additional 1.5 km distance from the city centre, solar radiation decreased by 79.66%. Hence, over time, solar radiation generally shows a decreasing trend, and the variations in solar radiation in urban streets differ significantly between regions. Furthermore, the Pudong area in the southeast, a key urban development zone, exhibited a more pronounced decrease in solar radiation, which is associated with its economic investment and the pace of infrastructure construction. The decline in solar radiation was more evident in the urban periphery, whereas the central urban area even experienced an increase in solar radiation. By analysing the differences in solar radiation across various distance bands, we found a negative correlation between the distance from the city centre and the level of reduction in solar radiation. However, in the last five distance bands, the trend of decreasing urban solar radiation showed signs of slowing down.
This study reveals the spatio-temporal relationship between urban spatial development and solar radiation. This provides useful insights for the practice of urban development policies.
  • Urban development policies need to emphasise the balance between greening and infrastructure construction. The shading effect of greenery can lower urban temperatures and alleviate the urban heat island effect. However, tree canopies may also hinder ventilation and contribute to the accumulation of emissions, affecting quality of life. We recommend rationally planning urban ventilation corridors, considering the impact of ventilation coefficients on cooling. Therefore, in the process of urban planning and development, it is crucial to consider the relationship between urban buildings, infrastructure, and greenery, and to correctly select parameters such as the location and spacing of trees, in order to maintain both the ecological environment and the comfort of human living conditions.
  • Urban planning should fully consider the impact of solar radiation on renewable energy. With the development of cities and the growth of populations, the demand for energy is continuously increasing. Therefore, improving the utilisation rate of renewable energy is particularly important. By rationally arranging road solar photovoltaic power generation facilities to charge electric vehicles in transit, solar energy resources can be fully utilised, thereby enhancing the efficiency of solar energy use [47]. Additionally, the research findings have a certain reference value for architectural design and the selection of building materials. Based on the identification results, it is possible to provide early warnings for the energy consumption of buildings in specific areas, thereby achieving the goals of energy conservation and emission reduction.
  • The practice of urban development policies should emphasise the coordination of internal and external urban development. The research results indicate that the reduction in solar radiation increases with the distance from the city centre, suggesting a potential imbalance between internal and external urban development. Therefore, policymakers should focus on the coordinated development of internal and external areas, rationally allocating urban resources and infrastructure. By reducing the solar radiation in city centres, the heat island effect can be mitigated, achieving overall sustainable urban development. The research results hold significant theoretical and practical value for guiding urban planning and construction, optimising urban infrastructure, and promoting sustainable urban development.
  • Considering the specific applications of solar radiation in urban streets, solar radiation impacts not only the overall energy consumption and environmental temperature of cities but also directly influences residents’ comfort and the conduct of outdoor activities. High-intensity solar radiation can lead to excessively high street temperatures, affecting pedestrians’ comfort and health, and may even restrict the duration and frequency of outdoor activities. To address these issues, urban planning should consider the reasonable layout of shading facilities in street design, such as tree canopies, awnings, and pavilions, to reduce areas directly exposed to sunlight. Additionally, studying the heating effects of solar radiation on different materials can guide the selection of appropriate building and paving materials to lower street temperatures. Furthermore, optimising the spacing and orientation of buildings can enhance urban ventilation and lighting conditions, thereby improving the outdoor activity environment. These measures can not only improve the quality of life for residents but also promote the sustainable development of cities.

5.3. The Scientific Contribution of the Practical Approach

On a technical level, this study utilises the trajectory of the sun and deep learning technology to calculate street-level solar radiation, significantly enhancing the efficiency of solar radiation computation. From a data perspective, by calculating street solar radiation using street view images from different years, this research methodology helps to reveal the trend of solar radiation changes during the urban development process. This approach can uncover the speed and scale of urban development, and further contribute to the discussion of impacts in aspects of urban planning, photovoltaic power generation, and improvements in the urban thermal environment. Methodologically, the research employs an equidistant concentric circle analysis method to study the pattern of changes in urban solar radiation across different-distance zones. Through the analysis of concentric circle solar radiation variation statistics, centred on downtown Shanghai, it reveals a consistent linearity in the reduction in solar radiation from the inner city to the suburbs, reflecting the historical development process of urban expansion from the central area outward. Analytically, the study combines solar radiation with Geographic Information Systems (GIS) to achieve a spatial visualisation of solar radiation differences. This visualisation technique aids in more intuitively presenting the geographical distribution characteristics and changing patterns of solar radiation, enabling researchers and decision-makers to more easily comprehend the actual situation of urban spatial perception.
Finally, by comparing radiation differences across different geographic areas, we can identify issues and shortcomings in urban development, providing strong support for optimising urban planning and enhancing the quality of life for residents. Therefore, this study’s practical method makes significant scientific contributions in the field of urban science, offering new perspectives and methodologies for studying urban spatial radiation and aiding in advancing urban science research.

5.4. Research Limitations

This study has certain limitations, and we aim to propose solutions for these constraints. Firstly, the research only examines two points in time: 2013 and 2019. This may not fully capture the long-term trends of urban solar radiation. Although the framework proposed in this study is limited by the street view data collection periods, it is possible to seek alternatives such as using multi-source data from remote sensing to calculate the long-term trends of solar radiation. Secondly, this study only explores the case of Shanghai and does not consider other cities, which may limit the applicability of the research findings to other urban areas. Future solutions could involve expanding the study to include more cities to test the generalisability of the results. Lastly, while this study reveals trends in urban spatial solar radiation changes, it is necessary to further investigate the specific causes behind these changes and their impact on the urban ecological environment. Future related research could combine analyses of urban historical development policies and infrastructure construction processes to provide a deeper interpretation of the changing trends.
In future research, we could also consider introducing more factors related to urban development, such as population density, traffic flow, and types of land cover, to reveal their interactions with urban solar radiation. Additionally, we could attempt to use more complex mathematical models and machine learning methods to improve the accuracy of predictions regarding changes in urban solar radiation. This would bring a more comprehensive and in-depth understanding to the field of urban science and offer strong support for sustainable urban development.

6. Conclusions

Solar radiation in urban streets is a significant characteristic of urban space, substantially impacting human welfare and urban development. However, previous studies have predominantly evaluated solar radiation from a unified time snapshot or a holistic urban perspective, focusing on its characteristics [15,52,53]. The temporal and spatial variations of street-level solar radiation have not been adequately addressed. Street view images can record a continuous sequence of changes in streets from a pedestrian’s perspective. This feature has not been fully utilised in the computation of solar radiation. In this study, we investigated the temporal and spatial changes of solar radiation within a city, based on street view images from the same location at different times. Specifically, this allowed us to reveal the characteristics of solar radiation distribution across different time dimensions. The results showed a consistent pattern of decreased solar radiation in urban spaces, with a linear increase from inner to outer city areas, reflecting urban construction strategies over these six years. The outskirts of Shanghai showed stronger effects of greenery shading, indicative of Shanghai’s status as a highly modernised inner city undergoing expansion from the central area outwards.
This work leverages a plethora of street-level images to observe variations in solar radiation across a city, offering decision-makers a free and efficient method to capture urban changes and predict future solar radiation. We believe this approach has great potential for extension to other urban studies, providing longer-term planning guidance and predictions for cities in different types and stages of development. This will also aid researchers in understanding patterns of urban evolution, contributing to sustainable urban design and planning.

Author Contributions

Conceptualization, Longhao Zhang; Methodology, Lei Wang and Longhao Zhang; Software, Longhao Zhang; Validation, Jie He; Resources, Jie He; Writing—original draft, Lei Wang; Writing—review & editing, Lei Wang and Longhao Zhang; Visualization, Lei Wang; Project administration, Jie He; Funding acquisition, Jie He. All authors have read and agreed to the published version of the manuscript.

Funding

This research was funded by the Research Initiative Fund for Newly Introduced Talents of Harbin Institute of Technology, Shenzhen. 2023–2025 grant number (#ZX20230488).

Institutional Review Board Statement

Not applicable.

Informed Consent Statement

Not applicable.

Data Availability Statement

To facilitate the reproducibility of the research results and the dissemination of this innovative method, all source data used in the study can be found at: https://github.com/LandscapeWL/SHAPClab_SolarRadiation_SpatiotemporalChanges (accessed on 21 May 2023).

Acknowledgments

The authors would like to thank the editors and the anonymous reviewer whose constructive comments will help to improve the presentation of this paper.

Conflicts of Interest

The authors declare no conflict of interest.

References

  1. Han, X.; Wang, L.; Seo, S.H.; He, J.; Jung, T. Measuring Perceived Psychological Stress in Urban Built Environments Using Google Street View and Deep Learning. Front. Public Health 2022, 10, 891736. [Google Scholar] [CrossRef]
  2. Sallis, J.F.; Glanz, K. The Role of Built Environments in Physical Activity, Eating, and Obesity in Childhood. Future Child. 2006, 16, 89–108. [Google Scholar] [CrossRef]
  3. Zakariya, K.; Harun, N.Z.; Mansor, M. Place Meaning of the Historic Square as Tourism Attraction and Community Leisure Space. Procedia—Soc. Behav. Sci. 2015, 202, 477–486. [Google Scholar] [CrossRef]
  4. Huang, K.-T.; Lin, T.-P.; Lien, H.-C. Investigating Thermal Comfort and User Behaviors in Outdoor Spaces: A Seasonal and Spatial Perspective. Adv. Meteorol. 2015, 2015, 423508. [Google Scholar] [CrossRef]
  5. Hwang, R.-L.; Lin, T.-P.; Matzarakis, A. Seasonal Effects of Urban Street Shading on Long-Term Outdoor Thermal Comfort. Build. Environ. 2011, 46, 863–870. [Google Scholar] [CrossRef]
  6. Lin, T.-P.; Tsai, K.-T.; Liao, C.-C.; Huang, Y.-C. Effects of Thermal Comfort and Adaptation on Park Attendance Regarding Different Shading Levels and Activity Types. Build. Environ. 2013, 59, 599–611. [Google Scholar] [CrossRef]
  7. Jin, Y.; Kang, J.; Jin, H.; Zhao, J. Analysis of Thermal Environment of Open Community Streets in Winter in Northern China. Energy Procedia 2017, 134, 423–431. [Google Scholar] [CrossRef]
  8. Carrasco-Hernandez, R.; Smedley, A.R.; Webb, A.R. Using Urban Canyon Geometries Obtained from Google Street View for Atmospheric Studies: Potential Applications in the Calculation of Street Level Total Shortwave Irradiances. Energy Build. 2015, 86, 340–348. [Google Scholar] [CrossRef]
  9. Kurazumi, Y.; Kondo, E.; Ishii, J.; Sakoi, T.; Fukagawa, K.; Bolashikov, Z.D.; Tsuchikawa, T.; Matsubara, N.; Horikoshi, T. Effect of the Environmental Stimuli upon the Human Body in Winter Outdoor Thermal Environment. J. Environ. Public Health 2013, 2013, 418742. [Google Scholar] [CrossRef]
  10. Borden, K.A.; Cutter, S.L. Spatial Patterns of Natural Hazards Mortality in the United States. Int. J. Health Geogr 2008, 7, 64. [Google Scholar] [CrossRef]
  11. Hodder, S.G.; Parsons, K. The Effects of Solar Radiation on Thermal Comfort. Int. J. Biometeorol. 2006, 51, 233–250. [Google Scholar] [CrossRef]
  12. Wang, Y.; Zhang, J.; Trentmann, J.; Fiedler, S.; Yang, S.; Sanchez-Lorenzo, A.; Tanaka, K.; Yuan, W.; Wild, M. Observations and Implications of Diurnal Climatology and Trends in Direct and Diffuse Solar Radiation Over China. JGR Atmos. 2022, 127, e2022JD036769. [Google Scholar] [CrossRef]
  13. Li, J.; Mao, Y.; Ouyang, J.; Zheng, S. A Review of Urban Microclimate Research Based on CiteSpace and VOSviewer Analysis. IJERPH 2022, 19, 4741. [Google Scholar] [CrossRef]
  14. Zhou, Y.; An, N.; Yao, J. Characteristics, Progress and Trends of Urban Microclimate Research: A Systematic Literature Review and Bibliometric Analysis. Buildings 2022, 12, 877. [Google Scholar] [CrossRef]
  15. Kawakubo, S.; Arata, S.; Demizu, Y.; Kamata, T.; Narumi, D.; Asawa, T.; Ihara, T. Visualization of Urban Roadway Surface Temperature by Applying Deep Learning to Infrared Images from Mobile Measurements. Sustain. Cities Soc. 2023, 99, 104991. [Google Scholar] [CrossRef]
  16. Krüger, E.L.; Minella, F.O.; Rasia, F. Impact of Urban Geometry on Outdoor Thermal Comfort and Air Quality from Field Measurements in Curitiba, Brazil. Build. Environ. 2011, 46, 621–634. [Google Scholar] [CrossRef]
  17. Lembrechts, J.J. Microclimate Alters the Picture. Nat. Clim. Chang. 2023, 13, 423–424. [Google Scholar] [CrossRef]
  18. Li, X. Investigating the Spatial Distribution of Resident’s Outdoor Heat Exposure across Neighborhoods of Philadelphia, Pennsylvania Using Urban Microclimate Modeling. Sustain. Cities Soc. 2021, 72, 103066. [Google Scholar] [CrossRef]
  19. Acuña Paz Y Miño, J.; Duport, N.; Beckers, B. Pixel-by-Pixel Rectification of Urban Perspective Thermography. Remote Sens. Environ. 2021, 266, 112689. [Google Scholar] [CrossRef]
  20. Kim, E.-S.; Yun, S.-H.; Park, C.-Y.; Heo, H.-K.; Lee, D.-K. Estimation of Mean Radiant Temperature in Urban Canyons Using Google Street View: A Case Study on Seoul. Remote Sens. 2022, 14, 260. [Google Scholar] [CrossRef]
  21. Liang, X.; Zhao, T.; Biljecki, F. Revealing Spatio-Temporal Evolution of Urban Visual Environments with Street View Imagery. Landsc. Urban Plan. 2023, 237, 104802. [Google Scholar] [CrossRef]
  22. Kang, Y.; Zhang, F.; Gao, S.; Lin, H.; Liu, Y. A Review of Urban Physical Environment Sensing Using Street View Imagery in Public Health Studies. Ann. GIS 2020, 26, 261–275. [Google Scholar] [CrossRef]
  23. Zhou, B.; Zhao, H.; Puig, X.; Xiao, T.; Fidler, S.; Barriuso, A.; Torralba, A. Semantic Understanding of Scenes through the ADE20K Dataset. Int. J. Comput. Vis. 2018, 127, 302–321. [Google Scholar] [CrossRef]
  24. Cordts, M.; Omran, M.; Ramos, S.; Rehfeld, T.; Enzweiler, M.; Benenson, R.; Franke, U.; Roth, S.; Schiele, B. The Cityscapes Dataset for Semantic Urban Scene Understanding. In Proceedings of the 2016 IEEE Conference on Computer Vision and Pattern Recognition (CVPR), Las Vegas, NV, USA, 27–30 June 2016; pp. 3213–3223. [Google Scholar]
  25. Zhu, H.; Nan, X.; Yang, F.; Bao, Z. Utilizing the Green View Index to Improve the Urban Street Greenery Index System: A Statistical Study Using Road Patterns and Vegetation Structures as Entry Points. Landsc. Urban Plan. 2023, 237, 104780. [Google Scholar] [CrossRef]
  26. Xia, Y.; Yabuki, N.; Fukuda, T. Sky View Factor Estimation from Street View Images Based on Semantic Segmentation. Urban Clim. 2021, 40, 100999. [Google Scholar] [CrossRef]
  27. Zhu, H.; Gu, Z. A Method of Estimating the Spatiotemporal Distribution of Reflected Sunlight from Glass Curtain Walls in High-Rise Business Districts Using Street-View Panoramas. Sustain. Cities Soc. 2022, 79, 103671. [Google Scholar] [CrossRef]
  28. Kim, S.; Woo, A. Streetscape and Business Survival: Examining the Impact of Walkable Environments on the Survival of Restaurant Businesses in Commercial Areas Based on Street View Images. J. Transp. Geogr. 2022, 105, 103480. [Google Scholar] [CrossRef]
  29. Liu, Y.; Liu, Y. Detecting the City-Scale Spatial Pattern of the Urban Informal Sector by Using the Street View Images: A Street Vendor Massive Investigation Case. Cities 2022, 131, 103959. [Google Scholar] [CrossRef]
  30. Campbell, A.; Both, A.; Sun, Q. Detecting and Mapping Traffic Signs from Google Street View Images Using Deep Learning and GIS. Comput. Environ. Urban Syst. 2019, 77, 101350. [Google Scholar] [CrossRef]
  31. Guan, F.; Fang, Z.; Zhang, X.; Zhong, H.; Zhang, J.; Huang, H. Using Street-View Panoramas to Model the Decision-Making Complexity of Road Intersections Based on the Passing Branches during Navigation. Comput. Environ. Urban Syst. 2023, 103, 101975. [Google Scholar] [CrossRef]
  32. Tang, J.; Long, Y. Measuring Visual Quality of Street Space and Its Temporal Variation: Methodology and Its Application in the Hutong Area in Beijing. Landsc. Urban Plan. 2019, 191, 103436. [Google Scholar] [CrossRef]
  33. Naik, N.; Kominers, S.D.; Raskar, R.; Glaeser, E.L.; Hidalgo, C.A. Computer Vision Uncovers Predictors of Physical Urban Change. Proc. Natl. Acad. Sci. USA 2017, 114, 7571–7576. [Google Scholar] [CrossRef] [PubMed]
  34. Yu, X.; Her, Y.; Huo, W.; Chen, G.; Qi, W. Spatio-Temporal Monitoring of Urban Street-Side Vegetation Greenery Using Baidu Street View Images. Urban For. Urban Green. 2022, 73, 127617. [Google Scholar] [CrossRef]
  35. Thackway, W.; Ng, M.; Lee, C.-L.; Pettit, C. Implementing a Deep-Learning Model Using Google Street View to Combine Social and Physical Indicators of Gentrification. Comput. Environ. Urban Syst. 2023, 102, 101970. [Google Scholar] [CrossRef]
  36. Han, Y.; Zhong, T.; Yeh, A.G.O.; Zhong, X.; Chen, M.; Lü, G. Mapping Seasonal Changes of Street Greenery Using Multi-Temporal Street-View Images. Sustain. Cities Soc. 2023, 92, 104498. [Google Scholar] [CrossRef]
  37. Li, X. Examining the Spatial Distribution and Temporal Change of the Green View Index in New York City Using Google Street View Images and Deep Learning. Environ. Plan. B Urban Anal. City Sci. 2021, 48, 2039–2054. [Google Scholar] [CrossRef]
  38. Johansson, E. Influence of Urban Geometry on Outdoor Thermal Comfort in a Hot Dry Climate: A Study in Fez, Morocco. Build. Environ. 2006, 41, 1326–1338. [Google Scholar] [CrossRef]
  39. Zhang, Y.; Du, X.; Shi, Y. Effects of Street Canyon Design on Pedestrian Thermal Comfort in the Hot-Humid Area of China. Int. J. Biometeorol. 2017, 61, 1421–1432. [Google Scholar] [CrossRef] [PubMed]
  40. Sanusi, R.; Johnstone, D.; May, P.; Livesley, S.J. Street Orientation and Side of the Street Greatly Influence the Microclimatic Benefits Street Trees Can Provide in Summer. J. Environ. Qual. 2016, 45, 167–174. [Google Scholar] [CrossRef] [PubMed]
  41. Li, X.; Ratti, C.; Seiferling, I. Quantifying the Shade Provision of Street Trees in Urban Landscape: A Case Study in Boston, USA, Using Google Street View. Landsc. Urban Plan. 2018, 169, 81–91. [Google Scholar] [CrossRef]
  42. Gál, C.V.; Kántor, N. Modeling Mean Radiant Temperature in Outdoor Spaces, A Comparative Numerical Simulation and Validation Study. Urban Clim. 2020, 32, 100571. [Google Scholar] [CrossRef]
  43. Blocken, B. Computational Fluid Dynamics for Urban Physics: Importance, Scales, Possibilities, Limitations and Ten Tips and Tricks towards Accurate and Reliable Simulations. Build. Environ. 2015, 91, 219–245. [Google Scholar] [CrossRef]
  44. Mirzaei, P.A. CFD Modeling of Micro and Urban Climates: Problems to Be Solved in the New Decade. Sustain. Cities Soc. 2021, 69, 102839. [Google Scholar] [CrossRef]
  45. Matzarakis, A.; Rutz, F.; Mayer, H. Modelling Radiation Fluxes in Simple and Complex Environments: Basics of the RayMan Model. Int. J. Biometeorol. 2010, 54, 131–139. [Google Scholar] [CrossRef] [PubMed]
  46. Li, X.; Ratti, C. Mapping the Spatio-Temporal Distribution of Solar Radiation within Street Canyons of Boston Using Google Street View Panoramas and Building Height Model. Landsc. Urban Plan. 2019, 191, 103387. [Google Scholar] [CrossRef]
  47. Liu, Z. Towards Feasibility of Photovoltaic Road for Urban Traffic-Solar Energy Estimation Using Street View Image. J. Clean. Prod. 2019, 16, 303–318. [Google Scholar] [CrossRef]
  48. Anderson, M.C. Studies of the Woodland Light Climate: I. The Photographic Computation of Light Conditions. J. Ecol. 1964, 52, 27–41. [Google Scholar] [CrossRef]
  49. Fu, P.; Rich, P.M. A Geometric Solar Radiation Model with Applications in Agriculture and Forestry. Comput. Electron. Agric. 2002, 37, 25–35. [Google Scholar] [CrossRef]
  50. Rich, P.M. A Manual for Analysis of Hemispherical Canopy Photography; Los Alamos National Lab. (LANL): Los Alamos, NM, USA, 1989. [Google Scholar]
  51. Richards, D.R.; Edwards, P.J. Quantifying Street Tree Regulating Ecosystem Services Using Google Street View. Ecol. Indic. 2017, 77, 31–40. [Google Scholar] [CrossRef]
  52. Gapski, N.H.; Marinoski, D.L.; Melo, A.P.; Guths, S. Impact of Urban Surfaces’ Solar Reflectance on Air Temperature and Radiation Flux. Sustain. Cities Soc. 2023, 96, 104645. [Google Scholar] [CrossRef]
  53. Zhong, T.; Zhang, K.; Chen, M.; Wang, Y.; Zhu, R.; Zhang, Z.; Zhou, Z.; Qian, Z.; Lv, G.; Yan, J. Assessment of Solar Photovoltaic Potentials on Urban Noise Barriers Using Street-View Imagery. Renew. Energy 2021, 168, 181–194. [Google Scholar] [CrossRef]
Figure 1. Study area. (a) Map of China; (b) map of Shanghai; (c) study area and Street View points.
Ijgi 13 00190 g001
Figure 2. Using BSV panorama for azimuth fisheye view. (a) An example of a panorama metadata url, (b) a cylindrical BSV panorama, (c) the generated fisheye image based on the geometrical transform model, adjusted to generate the correct-orientation fisheye image.
Ijgi 13 00190 g002
Figure 3. Fisheye diagrams are used to calculate solar radiation and thermal comfort.
Ijgi 13 00190 g003
Figure 4. Changing trends of solar radiation in the same months of different years. (a). Variation trend of solar radiation; (b). Monthly solar radiation statistics.
Ijgi 13 00190 g004
Figure 5. Spatial distribution of solar radiation during May to October in summer 2013 and 2019.
Ijgi 13 00190 g005
Figure 6. Geographic spatial distribution and trend of solar radiation changes in two years.
Ijgi 13 00190 g006
Figure 7. A statistical diagram of solar radiation changes, with concentric circles centred on the city centre of Shanghai. Using the centre of the study area’s shape as the midpoint, 13 concentric circles with incremental radii of 1.5 km are drawn. For each concentric circle area, the solar radiation amounts in the urban space are summarised and averaged.
Ijgi 13 00190 g007
Figure 8. Solar radiation change trends. (a) Bar chart of solar radiation amounts at different distances from city centre; (b) line chart of solar radiation changes at different distances from city centre.
Ijgi 13 00190 g008
Table 1. Statistical analysis of temporal distribution of Baidu Street View data in Shanghai’s central urban area.
Year/
Month
JanuaryFebruaryMarchAprilMayJuneJulyAugustSeptemberOctoberNovemberDecemberSum
2013NoneNoneNoneNoneNoneNone24684245737427,2344425145,747
201458NoneNone16936811NoneNoneNone48NoneNone654
20157072659719,8133025NoneNoneNoneNoneNoneNoneNone35,69772,204
20162732336None40NoneNoneNoneNoneNoneNoneNone73115
2017NoneNoneNone170263699780518,44012,856550468841,502
20192141NoneNoneNone44,892352420NoneNoneNoneNone650,583
20202015539283403None12None4511
2021NoneNoneNoneNoneNoneNoneNone133201None37
2022NoneNoneNoneNoneNoneNone8312NoneNoneNone23
Table 2. Data distribution of solar radiation in different years (Wh/m2).
MayJuneJulyAugustSeptemberOctober
2013mean2661.779752667.533642684.581752708.042792653.125832463.95974
2019mean2350.058142342.775862360.063972381.186632318.694782131.96764
2013s.d.1128.868781131.303041139.676611155.92941160.507521164.3949
2019s.d.1024.756421022.51021030.354251043.91751047.220881040.27745
2013kurt−0.6259977−0.5966435−0.6104043−0.6692987−0.7131662−0.8040673
2019kurt−0.7172593−0.698126−0.7063111−0.7448844−0.7546643−0.8028
Disclaimer/Publisher’s Note: The statements, opinions and data contained in all publications are solely those of the individual author(s) and contributor(s) and not of MDPI and/or the editor(s). MDPI and/or the editor(s) disclaim responsibility for any injury to people or property resulting from any ideas, methods, instructions or products referred to in the content.

