Abstract
To achieve the goals of “carbon peaking and carbon neutrality”, this paper puts forward the connotation and measurement method for the carbon emission intensity of urban industrial land and conducts an empirical study with the Yangtze River Economic Belt (YREB) as an example. We defined the carbon intensity of urban industrial land as the industrial carbon emissions per unit area of land, which is a spatial mapping of urban industrial economic development and carbon spillover and a key indicator for urban and territorial spatial planning oriented towards the “dual carbon” goal. Findings: The carbon emission density of industrial land in the YREB varied greatly between cities and exhibited significant positive spatial autocorrelation. In addition, the geographical pattern and spatio-temporal evolution model of the urban industrial land carbon emission density had a very complex driving mechanism, and different factors had significant synergistic effects. Therefore, it is suggested that while striving towards the goal of “dual carbon”, the government should incorporate the carbon emission density indicator of urban industrial land into the urban and territorial spatial planning system, and based on the threshold of the medium suitable density, they should design differentiated management policies according to concrete urban policies and encourage cooperation among cities to jointly promote carbon emission management of urban industrial land. In policy design, emphasis should also be placed on highlighting the interactive effects of foreign direct investment, fiscal expenditure, and the number of patent authorizations as well as constructing a combination of policies centered around them to better leverage the impacts of globalization, government intervention, and innovation.
1. Introduction
1.1. Research Background
More and more governments, scholars, and businesses are now beginning to take notice of global warming caused by greenhouse gas emissions. Land-use change, as a principal element influencing global climate change and the carbon cycle, alters natural carbon processes at the surface and also affects the rate of the carbon cycle by changing the intensity of human energy consumption. The industrial sector is one of the most important sources of carbon emissions, and there is a close link between the spatial layout of industrial land and the types of industries and carbon emission density [1]. Therefore, it is a growing concern that strict control and the adjustment of land-use structures, especially strengthening the management of carbon emissions from industrial land use, can effectively mitigate global climate change. The World Cities Report 2022: Envisaging the Future of Cities, published by UN Habitat, stresses managing urban density in the context of multiple urban challenges as a key challenge for sustainable urban construction in the future. From the history of urban construction in China and abroad, it has been found that density has not only been applied to the measurement of urban form, but has also gradually evolved into an important starting point for dealing with urban problems, controlling urban form, and regulating the relationship between man and land in different periods [2,3]. Therefore, density research has outstanding theoretical and practical significance for urban construction management, and it is also the core proposition related to the sustainable construction of cities in the future.
Urban planning and land spatial planning, as the government’s public intervention on the built environment, aim to ensure space supply, protect public interests, and overcome market failure. For urban and land spatial planning, density is an important indicator for measuring the coordination of land resource allocation, urbanization level, and spatial development quality [4,5]. Carbon emission density refers to the carbon emissions per unit land. As a new key indicator in urban and land spatial planning, the carbon intensity reflects the spatial evolution of cities and their regions in terms of land-use intensity, the level of economic development, and urban construction, serving as an index that represents how much of the city’s “dual carbon” goal is achieved. The change in the carbon emission density of urban industrial land, in essence, is the result of the continuous inflow and outflow of urban industrial resources and enterprise clusters, employed population and human capital, industry and innovation capital, and other factors. It is accompanied by changes in the population density, employment density, economic density, and building density in urban spaces. Therefore, an empirical study on the geographical pattern, evolutionary pattern, and driving mechanism of carbon density of industrial land in urban agglomerations based on the spatial measurement model will provide key evidence and information for urban planning and territorial spatial planning to serve the goal of “carbon peaking and carbon neutrality”, with a great theoretical and practical value.
1.2. Literature Review
The carbon emission density of industrial land is an emerging tool to measure the relationship between the scale of industrial carbon emissions and the area of industrial land occupied. Therefore, the literature review needs to take into account the research results on carbon emissions of land use and industrial development and use the ideas and methodological innovations from urban and territorial spatial densities, such as population density and building density.
1.2.1. Land Use and Carbon Emissions
Carbon emissions come from a variety of sources, with carbon emissions from land use ranking second after fossil fuel consumption. Economic development leads to changes in land use and has a significant impact on the carbon cycle in nature. Therefore, an in-depth analysis of the relationship between land-use carbon emissions and economic growth is of great significance to the scientific development of energy conservation and emission reduction programs, and it is also the key to promoting regional carbon neutrality as well as the sustainable development of the society [6]. Since the 1970s, an increasing number of scholars have been involved in research on land-use carbon emissions, summarized into the following areas and features: research related to land-use carbon sources and sinks from the perspective of the carbon cycle in terrestrial ecosystems, mainly dealing with the accounting of land-use carbon stocks and fluxes and their influencing factors [7,8]; correlation analysis of the relationship between carbon emissions and economic growth or factors of production based on land carbon emissions using econometric methods such as the gray correlation model [9], the coupled coordination degree model [10], and the decoupling model [11]; and research related to low-carbon development policies for land use under the “dual carbon” goal, that is, to portray the evolution models of land-use carbon emissions through methods such as spatial autocorrelation and cold–hot spot analysis and to further propose their policy implications. For example, Sidorczuk-Pietraszko [12] studied the spatial differences in household carbon intensities between different regions in Poland by means of exponential decomposition analysis (IDA); Rong [13] also found that there is an obvious spatial correlation between land-use carbon emissions in Chinese provinces, and thus suggested that China should strengthen the inter-provincial cooperation in order to achieve an overall emission reduction across the country.
1.2.2. Carbon Emissions from Industries
The industrial sector, as an important source of carbon emissions from human activities, shoulders the important responsibility of energy conservation and emission reduction, and it faces the important and urgent task of how to control and reduce carbon emissions while pursuing the high-quality development of industry and promote the mutual harmonization of economic development and resources and the environment. As a result, the study of industrial carbon emissions has become a hot topic. At present, the research on industry-related carbon emissions mainly focuses on the following three areas: The first is the research on carbon emission measurement and energy conservation and emission reduction in specific industrial sectors or industries, including the communications and transportation industry [14,15], tourism [16], agriculture [17], services [18], and construction [19], with topics involving carbon emission measurement and prediction methodology, influencing factors, spatio-temporal analysis, and the link between carbon emissions and economic development. The second is the research on the influencing factors of industrial carbon emissions, including the energy structure, industrial structure, economic output, population size, energy intensity, urbanization rate, technological progress, and foreign trade and is mostly based on index decomposition analysis, structural decomposition analysis, IPAT or STIRPAT models, and other econometrics and regression analysis methods [20,21]. The third is the research on industrial carbon transfer, carbon leakage, implied carbon emissions, and the differential responsibility for carbon reduction. With the evolution of regional economic development patterns, inter-regional industrial transfers have become more frequent, producing different environmental effects on the transferring places. In this context, some scholars have carried out research on the scale calculation, influencing factors, and mechanism of industrial carbon transfer and analyzed the relevance of industrial carbon emissions and its transmission network characteristics along the industrial chain [22]. Research on the differential responsibility for carbon emission reductions has mainly centered on the “polluter pays” principle, from which the principles of “responsibility within national territories” and “producer burden of pollution” have been derived [23]. Depending on the principles of “producer burden of pollution” and “consumer burden of pollution”, scholars have put forward new principles such as “common sharing between importing and exporting countries” [12], “common sharing between producers and consumers” [13], and “common sharing between upstream and downstream of the industrial chain” according to different research objects [24,25].
1.2.3. Urban and Territorial Spatial Density
In human civilizations, cities are spatial carriers where factors such as population, resources, technology, and information are highly concentrated, and density, as a visual representation of the degree of spatial concentration of these factors, has become a key indicator for understanding the efficiency of the distribution of the various factors in cities and their spatial formations in a complex mega-system. Since the emergence of urban planning and territorial spatial planning, attention has been paid to the study of urban density, mainly on the following areas: The first is the research on the urban density measurement indicators and evaluation mechanism. Urban density research originated from population density analysis [26] and then expanded to building density [27], economic density [28], environmental density [29], employment density [30], land density [31], and road network density [32]. The second is the research on the spatio-temporal differentiation of urban density. Leveraging the exploratory spatial data analysis, Theil coefficient, coefficient of variation, Markov chain, kernel density estimation, and other models, it explores and empirically analyzes the laws of spatial differentiation, dynamic evolution, and spatio-temporal evolution of urban density at different scales [33,34]. The third is research on the interaction between urban density and other factors. It analyzes the impact of urban density on the economic efficiency, technological innovation, and land-use patterns and intensities. For example, Hong [35] found that when the urban population size is less than 1 million, increasing the urban density promotes carbon emission reduction; on the contrary, it will lead to more carbon emissions. Lee [36] and Li [37] analyzed the impact of urban morphology—particularly population density and building density—on household carbon emissions and household electricity consumption. It also explores the driving factors and mechanisms of the dynamic evolution and spatio-temporal evolution of urban density, revealing the key influencing factors and their pathways of action. For example, using geographically weighted regression models and Baidu heat maps, Zhang [38] found, in a case study of Wuhan, that residential workplaces, education levels, and the quality of urban landscapes are key indicators of real-time urban human activity density. Of note, the carbon emission density shares a similar concept with the population density, characterized by spatial clustering and mobility. Therefore, we can define the carbon intensity of industrial land as the ratio of the carbon emissions from the production of industrial enterprises, as well as the carbon emissions from the liquidity of the business and product transportation, to the area of industrial land. The measurement of carbon emissions and industrial land use is not limited to narrowly defined production processes and carriers but includes supporting links such as transportation and productive services [39].
1.3. Research Gap
In general, scholars have conducted in-depth analyses on land use and carbon emissions, industrial carbon emissions, and urban density, providing valuable references for this study. However, there are still some vulnerable spots, which are mainly as follows:
First, industrial development, land use, and carbon emissions are closely related, but existing studies generally separate the three to specifically study carbon emissions from industrial development or land use without incorporating them into a unified research framework. Simply calculating the carbon emissions of the industry without taking other factors into account often fails to provide a comprehensive understanding of the industry’s carbon emissions, leading to the unsatisfactory implementation of carbon emission management policies for industrial land. With the factor of “land area occupied by industrial activity space” taken, the implementation of industrial carbon emissions to the land, focusing on the industrial carbon emission scale to the industrial carbon emission density, so as to organically integrate land use, industrial development and carbon emission management will be of great value to the policy design of energy conservation and emission reduction, industrial development, and land use under the “dual carbon” goal.
Second, most of the existing studies regard the study area as a separate entity and rarely discuss the spatial effect of carbon emission density from the perspective of geography and spatial interaction. No spatial econometric model has been selected for the regression analysis, which affects the accuracy of the results and conclusions. Cities and regions constitute an open system where information and resources flow and are exchanged constantly between cities or regions, and spatial elements tend to overflow. The first law of geography states that things that are closer in space are more dependent on each other; that is, the spatial autocorrelation of the attribute values is more significant. Wu [40] and Dong [41] have conducted exploratory research on carbon emission density, but it should be noted there are weaknesses in their studies. The former focused on the carbon intensity of agricultural land rather than industrial land, and its analytical results and conclusions are more applicable to rural planning than to urban and land spatial planning. The latter used the extended Kaya constant equation and the log-mean Divisia index model rather than a spatial econometric model and failed to capture the impact of spatial effects.
1.4. Research Question
The objective of this paper is to discuss the following issues: First, in the dimensions of urban planning and territorial spatial planning disciplines, what is the connotation and value of the concept of carbon emission density of industrial land, and how can it be measured quantitatively? Second, what are the regular characteristics of the geographical pattern and spatio-temporal evolution model of carbon emission density of industrial land? Third, what are the factors and how do they affect the carbon emission intensity of industrial land? This article takes the YREB as an example to empirically analyze the above issues through spatial econometric models, aiming to provide key information and a basis for dual-carbon-goal-oriented urban industrial planning and national spatial planning.
2. Materials and Methods
2.1. Study Area
The YREB is home to 11 provincial administrative regions, including Jiangsu, Zhejiang, Anhui, Jiangxi, Hubei, Hunan, Sichuan, Yunnan, Guizhou, Shanghai, and Chongqing, and the administrative units of this study area include 110 cities. In the study area, 16 autonomous prefectural regions and 3 provincial counties were excluded due to a significant amount of missing data or poor data quality, the former being Enshi in Hubei, Xiangxi in Hunan, Aba in Sichuan, Ganzi in Sichuan, Liangshan in Sichuan, Qianxinan in Guizhou, Qiandongnan in Guizhou, Qiannan in Guizhou, Chuxiong in Yunnan, Honghe in Yunnan, Wenshan in Yunnan, Xishuangbanna in Yunnan, Dali in Yunnan, Dehong in Yunnan, Nujiang in Yunnan, and Diqing in Yunnan and the latter being Xiantao, Qianjiang, and Tianmen in Hubei (Figure 1).
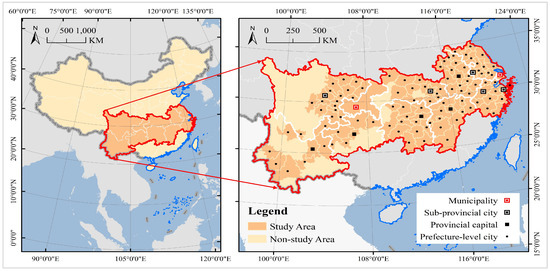
Figure 1.
Study area.
The YREB is a major strategic space for regional development at the national level, alongside the Beijing–Tianjin–Hebei region, the Guangdong–Hong Kong–Macao Greater Bay Area, and the Yellow River Basin, with a good industrial base and urban construction. The YREB plays a crucial role in the construction of China’s new plan and is highly representative in both global industrial clusters and urban agglomerations. The Chinese central government put forward the Outline of the YREB Development Plan in 2016, as well as the Implementation Plan for the Development of the YREB under the 14th Five-Year Plan and the Opinions on Several Policy Measures to Further Promote the High-Quality Development of the YREB in 2021 and 2023. All these documents call for industry transformation and green development in the YREB, the synergistic promotion of ecological environmental protection, and sustainable economic development, so as to build a beautiful China model, where human beings and nature coexist in harmony. The YREB accounts for up to 40% of the country’s population size and economic output and more than one-third of its carbon dioxide emissions. Therefore, strengthening the carbon emission management of industrial land for the high-quality green development of the YREB has become a key issue that needs to be solved urgently.
2.2. Research Methods
2.2.1. Carbon Emission Density of Industrial Land (CEDIL)
The concept of density has its origins in physics and is a measure of mass in a given volume, measured by dividing the mass of an object by its volume. Sociology, economics, geography, ecology, and urban and territorial spatial planning have drawn on the physical concept of density to introduce the concepts of population density, economic density, species density, and urban density, all using area instead of volume in the measurement of these emerging concepts. Drawing on the measurements of emerging concepts such as population density and economic density, this study proposes the concept of carbon intensity, which is measured by dividing the total amount of carbon emissions in a given area by its area. In particular, the carbon intensity of industrial land use is equal to the total industrial carbon emissions of each city divided by the total area of industrial land use, in tons per square kilometer. With to represent the total industrial land area (square kilometer) of the th city in the study area and to represent the total industrial carbon emissions of the th city, the carbon intensity () of the industrial land is calculated as follows:
stands for carbon emissions per unit of industrial land area, which is a relative concept compared to the absolute concept of total carbon emissions and represents the average carbon emissions from industrial land within a city. Carbon intensity and carbon emissions per capita are also common relative concepts, with the former referring to the total carbon emissions of a region divided by its GDP and the latter referring to the total carbon emissions of a region divided by its population. Total carbon emissions, carbon intensity, and per capita carbon emissions are commonly used indicators in urban and territorial spatial planning; however, they have a major drawback: weak correlation with land. Urban and territorial spatial planning manages the land and the elements it carries (population, buildings, businesses, etc.), and density control, especially density zoning, is a key tool for planning. Notably, the carbon intensity is further mapped by integrating both land and carbon emissions into a spatial zoning scheme for carbon intensity. Therefore, is more advantageous than the indicators carbon emission scale, intensity, and per capita emissions and is more applicable to the preparation and management of urban and territorial spatial planning.
2.2.2. Boston Consulting Group (BCG) Matrix
The Boston Matrix originated in the field of corporate development strategy analysis and is a good method for quantitatively measuring the development trends of a company’s business or product market. By integrating two indicators, such as the relative share and growth rate of a business or products, it is possible to select the most appropriate company plan from among four types of alternative development strategies (star, gazelle, cow, and dog) [42]. With the average growth rate (growth rate, ) from 2010 to 2020 to represent the trend of change in the time dimension, and the relative share (relative share, ) in 2020 to quantitatively measure the regional ecological niche of each city from a spatial perspective, the Boston Matrix enables the quantitative portrayal of the spatio-temporal evolutionary pattern of CEDIL in the YREB. and represent the carbon emission density of industrial land in the th city in the end and base periods, respectively, and represents the maximum value in the study area at the end. and are calculated using the following equation [43]:
The median values of and were used as thresholds in this study, because they can eliminate artificial interference in the analyzed results and provide a more balanced classification scheme. According to the classification results based on the spatiotemporal evolution model, the 110 cities in the YREB are classified into four types, with high-carbon and high-growth cities (HCHG cities) representing the and of the YREB , which are greater than the median, indicating a very bad state. Low-carbon and low-growth cities (LCLG cities) represent the and of the YREB and are less than the median, indicating a desirable state. High-carbon and low-growth cities (HCLG cities) show that the of the YREB is less than the median, while the is greater than the median, with a positive trend from bad to desirable conditions. Low-carbon and high-growth cities (LCHG cities) present a for the YREB that is greater than the median, while the is less than the median, with a tendency to change from desirable to bad conditions.
2.2.3. Global Moran’s Index and Cold–Hot Spot Analysis
Spatial effect detection is a prerequisite for the scientific selection of regression analysis models, and if the dependent variable has strong spatial autocorrelation and heterogeneity, the spatial measurement model is selected to have a higher accuracy than the traditional statistical regression model. In this study, we use Moran’s I to quantify the global autocorrelation of the total industrial land area, total industrial carbon emissions, industrial land carbon emission density, and their spatiotemporal evolution models. Zero is a key threshold for measuring spatial autocorrelation properties, where values greater than zero represent positive autocorrelation. The maximum and minimum values of the Moran index are 1 and −1, respectively, with a larger absolute value indicating stronger spatial correlation. To further visualize the local spatial pattern of spatial autocorrelation, this study uses the cold–hot spot analysis tool and introduces the index to identify the areas where high and low values are clustered. With as the spatial weight matrix, 1 representing spatial adjacency, and 0 representing spatial disjacency, and are calculated as follows [44,45]:
2.2.4. Geodetector
Geodetector is the most commonly used spatial econometric model. Its main advantage is that it can measure the driving effect of a single factor and analyze the correlations between different factors. We employed Geodetector to analyze the driving mechanism of the carbon emission intensity of industrial land, quantifying the influences of measurement factors, pathways, and interactions [46]. Firstly, we discretized the source data of the independent variable (). During the research process, the quantile method using Python was employed to divide the 110 cities in the study area into multiple zones and form multiple zoning schemes. Secondly, we overlayed the geographical distribution pattern of the dependent variable with the independent variable zoning scheme and analyzed the similarity between the two as measured using Geodetector and characterized by the q-index. Thirdly, we took the scenario with the largest q-index as the final calculation for each factor and conducted the impact analysis of the different factors. It should be noted that the maximum value of the q-index is 1, with larger values representing a stronger single-factor influence or dual-factor interaction. For example, for the driving factors and , q() and q(∩) represent their single-factor driving force and dual-factor interaction, while Min(q(), q()), Max(q(), q()), q() + q()) represent the minimum, maximum, and sum of their single-factor driving forces. In the analysis of the interaction, the interactions were classified into five types by analyzing the dual-factor interaction in comparison with the maximum value of the one-factor interaction effect, the minimum value, and the sum of the two [47]. When q(∩) < Min(q(), q()) and Min(q(), q()) < q(∩) < Max(q()), q()), it is determined that the interaction between the driving factors and is nonlinear weakened and single nonlinear weakened, respectively. It indicates that there is antagonism between the two, and it is necessary to avoid the combination of the two in the future policy design. When q (∩) > Max(q(), q()) and q(∩) > q() + q(), it is determined that the interaction is of bifactor enhancement and non-linear enhancement, respectively. It indicates that the two are synergistic, and it is necessary to encourage the combination of the two in the future policy design. When q(∩) = q() + q(), it signifies that two factors are independent of each other and that factors can be freely combined with other factors during the policy design [48,49]. The following is the calculation formula for the relevant parameters [50]:
where represents the number of partitions in the discretization result of the independent variable data (the value range is an integer from 2 to 10), represents the number of cities in partition h, N = 110, represents the variance of the dependent variable in partition h, represents the variance of the dependent variable in the YREB study area, and SSW and SST represent partition variance and total variance, respectively.
2.3. Indicator Selection and Data Source
The geographical pattern of carbon emission density of urban industrial land and its change is a complex process, affected by the combined effect of economic scale, industrial structure and industrialization level, government intervention, degree of opening up, scientific and technological levels, and other factors. Based on the research experiences of related scholars, we chose the gross domestic product (GDP) to represent the impact of the scale effect of the urban economy in this paper [51,52], the proportion of the tertiary industry (PTI) and per capita GDP (PCGDP) to represent the industrial structure and the industrialization process [53,54], the fiscal expenditure (FE) to represent the impact of government intervention [55], the international trade goods export (ITGE) and foreign direct investment (FDI) to represent the influence of openness to the outside world and the degree of globalization [56], and the number of patent authorizations (NPA) to represent the impact of innovation [57]. It is notable that the distribution and evolution of carbon density come close to the natural environment, especially the geomorphology [58], but they are not included in the analytical framework of this paper due to the lack of the necessary complete data.
Urban industrial carbon emission data came from the China City CO2 Emissions Dataset, released by the China City Greenhouse Gas Working Group (CCG) on its website. CCG is an urban greenhouse gas research and cooperation platform initiated and organized by the Center for Climate Change and Environmental Policy Research of the Academy of Environmental Planning of the Ministry of Ecology and Environment (MEP), established in June 2017. It regularly releases long time-series, full-caliber, and full-coverage data on greenhouse gas emissions from Chinese cities. The industrial carbon emission list covers carbon emissions from the ore, chemical, metal, and electronics industries, as well as carbon emissions related to the production and use of other products, including industrial energy consumption and industrial process emissions. The data on urban industrial land use came from the China Urban Construction Statistical Yearbook, released by the Ministry of Housing and Urban-Rural Development, which provides statistical data on urban construction land use over a long time series and across all land types. Urban industrial land is defined as land used for independently established factories, workshops, handicraft workshops, production sites for construction and installation, and slag (ash) discharge sites. There are three classes of industrial land according to the degree of disturbance to the residential and public environment, the degree of pollution, and the degree of safety hazards. And some cities, to meet the demand for the transformation and upgrading of traditional industries into a high-tech, synergistic production space, combined production space, and headquarters economy, have allocated land for new industries integrating research and development, creativity, design, pilot testing, non-polluting production, and other innovative industrial functions and their ancillary services to industrial land as well. The impact factor data came from the China Urban Statistical Yearbook and were released by the Department of Urban Socio-economic Survey of the National Bureau of Statistics (Appendix A).
3. Results
3.1. Geographical Pattern Analysis
3.1.1. Industrial Carbon Emissions
From 2010 to 2020, the city with the highest industrial carbon emissions in the YREB shifted from Shanghai to Suzhou-JS, with a decrease from 190.77 million to 143.67 million tons. Huangshan has been the city with the smallest industrial carbon emissions, with a decrease from 620,000 to 260,000 tons. Different from the decreasing trend of the maximum and minimum values, the average and median industrial carbon emissions in the YREB both increased to a certain extent, from 24.6636 and 17.2250 tons to 26.5923 and 20.3150 million tons, respectively. It should be noted that the coefficient of variation of industrial carbon emissions in the YREB decreased from 1.20 to 0.99, much higher than 0.36, showing high spatial heterogeneity despite the decline [59] (Table 1).

Table 1.
Descriptive statistics on ICE, UIL, and CEDIL in the YREB.
The geographic distribution pattern of industrial carbon emissions in the YREB was visualized through quartile spatial clustering analysis using GIS software(ArcGIS 10.4 produced by Esri company). It was found that in 2010, high-carbon cities formed four agglomerations in the Yangtze River Delta (YRD) city cluster, Chengdu–Chongqing city cluster, and southern Hunan, including Shanghai, Suzhou-JS, Chongqing, Ningbo, Wuxi, Wuhan, Nanjing, Xuzhou, Qujing, Bijie, and Liupanshui. However, low-carbon cities were agglomerated in western Yunnan, Anhui, and northern Sichuan, including Lu’an, Bozhou, Ya’an, Ziyang, Lincang, Baoshan, Nanchong, Fuzhou, Suining, Suizhou, Bazhong, Zhangjiajie, and Huangshan. The geographical distribution patterns of high-carbon cities showed that in 2020, the YRD urban cluster rapidly expanded to northern Jiangsu, and the carbon emissions of cities in central Zhejiang decreased rapidly; the Chengdu–Chongqing urban cluster was connected to the northern Hubei, with cities such as Shiyan and Xiangyang having transformed from low-carbon cities to high-carbon cities. Most of the high-carbon cities in Hunan, Yunnan, and Guizhou were transformed into low-carbon cities. In 2020, low-carbon cities were mainly found in the peripheral areas of provinces, especially in their border areas, including southwestern Yunnan, the northeast of Sichuan, the west and south of Hunan, the Yunnan–Sichuan–Guizhou border area, and the Jiangsu–Zhejiang–Anhui border area (Figure 2).
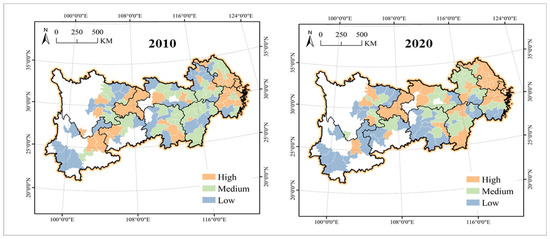
Figure 2.
The geographical pattern of ICE in the YREB.
3.1.2. Urban Industrial Land
From 2010 to 2020, Shanghai remained the largest user of industrial land in the YREB, despite a decrease from 739 to 538 km2. The city with the smallest industrial land use changed from Tongren to Pu’er, increasing from 0.14 to 0.49. The average and median industrial land in the YREB showed some growth, from 31.61 and 15.26 to 37.06 and 22.50 km2, respectively. The coefficient of variation of industrial land in cities in the YREB decreased from 2.41 to 1.74 from 2010 to 2020, showing a spatial heterogeneity trend consistent with industrial carbon emissions, but with a higher degree of spatial differentiation (Table 1).
Most of the cities with a high value of industrial land in 2010 were clustered in the YRD, while Chongqing and the Yunnan–Guizhou border area were also the centers of industrial land clustering in the region, including Shanghai, Chongqing, Nanjing, Suzhou-JS, Wuhan, Ningbo, Chengdu, Kunming, Hefei, Hangzhou, and Wuxi. Cities with low industrial land value were mostly in Yunnan, southwestern Hunan, and northern Sichuan, including Huaihua, Lishui, Yibin, Shaoyang, Ya’an, Yingtan, Pu’er, Yuxi, Zhaotong, Baoshan, Zhangjiajie, Lijiang, Bazhong, Lincang, and Tongren. During the 2010–2020 period, the YREB pushed hard for industrial structure adjustment and upgrading, and Shanghai even proposed a development strategy based on resource reduction, prompting major changes in the distribution pattern of urban industrial land. Most of the cities with a high value of industrial land in 2020 were concentrated in the border areas of Sichuan, Yunnan, and Guizhou, including Shanghai, Chongqing, Wuhan, Chengdu, Ningbo, Nanjing, Suzhou-JS, Hangzhou, Changzhou, Hefei, and Nantong. Most of the low-value cities with industrial land were clustered in the northern Jiangsu–Anhui border area and the Chengdu–Chongqing urban cluster, including Dazhou, Zhaotong, Shaoyang, Yuxi, Lishui, Liupanshui, Ezhou, Ziyang, Zhangjiajie, Huaihua, Lijiang, Baoshan, Bazhong, Lincang, and Pu’er (Figure 2). Of note, the comparison between Figure 2 and Figure 3 shows that the distribution pattern of industrial carbon emissions is inconsistent with the industrial land in the YREB, and there is a large spatial mismatch between the two. The results of the independent analysis separating the two do not well reveal the real condition of carbon emissions from industrial land.

Figure 3.
The geographical pattern of UIL in the YREB.
3.1.3. Carbon Emission Density of Industrial Land
From 2010 to 2020, the city with the largest industrial carbon emission density in the YREB changed from Tongren to Pu’er, with the value decreasing from 59.71 to 16.55 million tons/km2. Huangshan remained the city with the lowest industrial carbon emissions, dropping from 104,400 to 24,700 tons/km2. The average industrial carbon emission density in the YREB decreased from 2.0165 to 1.5706 million tons/km2, while the median increased from 918,700 to 970,800 tons/km2. It should be noted that the variation coefficient of industrial carbon emission density in the YREB decreased from 2.86 to 1.48, and the spatial heterogeneity level was much higher than that of industrial carbon emission and industrial land use (Table 1).
Most of the cities with a high carbon emission intensity of industrial land use in 2010 were concentrated in the YRD urban cluster, including Tongren, Bijie, Qujing, Yuxi, Lijiang, Lincang, Yibin, Liupanshui, Loudi, Shaoyang, Yichun, Huanggang, Neijiang, and Huainan. High-value cities in 2020 shifted from the east to the central and western regions, mostly concentrated in the border areas of Yunnan and southwestern Hunan, as well as Yunnan and Guizhou, including Pu’er, Liupanshui, Yuxi, Ezhou, Qujing, Loudi, Bijie, Dazhou, Leshan, Baoshan, Shangrao, Chizhou, Wenzhou, Lincang, and Huainan. In 2010, the low-carbon intensity cities of industrial land use were mainly in west–central Yunnan and Hunan, the border areas of Yunnan, Guizhou, Sichuan, and Chongqing, and central Jiangxi (and expanding to Anhui and Zhejiang), including Shiyan, Zigong, Bengbu, Suqian, Yancheng, Lianyungang, Bozhou, Nanchang, Chengdu, Shanghai, Ziyang, Fuzhou, Hefei, Lu’an, Suining, Nanchong, Suizhou, and Huangshan. Most of the low-value cities in 2020 were concentrated in the Chengdu–Chongqing urban area, with a relative concentration in the fringes of western Anhui and northern Hubei, including Xiangyang, Luzhou, Lu’an, Guiyang, Kunming, Deyang, Wuhan, Hangzhou, Shanghai, Shiyan, Nanchang, Suqian, Chengdu, Zigong, Suining, Nanchong, Suizhou, and Huangshan (Figure 4).

Figure 4.
The geographical pattern of CEDIL in the YREB.
3.2. Spatiotemporal Evolution Model Analysis
From the perspective of industrial carbon emissions, the median relative share and growth rate were 0.14 and 12.46%, respectively. The classification based on these as thresholds showed that high-carbon and high-growth cities (HCHG cities) were mostly in the lower and middle reaches of the YREB, including Nanjing, Changzhou, Lianyungang, Yancheng, Yangzhou, Zhenjiang, Wenzhou, Jiaxing, Huzhou, Shaoxing, Hefei, Wuhu, Xuancheng, Jiujiang, Ganzhou, Yichun, and Shangrao. Low-carbon and low-growth cities (LCLG cities) developed into three agglomerations in eastern Sichuan, northwestern Hubei, and the border area of Hunan and Jiangxi provinces, including Suqian, Lishui, Huangshan, Fuyang, Pingxiang, Ji’an, Shiyan, Xiangyang, Xiaogan, Huanggang, Suizhou, Changsha, and Zhuzhou. High-carbon and low-growth cities (HCLG cities) were concentrated in the central part of Zhejiang, southern Jiangsu, the border areas of Yunnan and Guizhou, Chongqing, and its neighboring areas, including Wuxi, Xuzhou, Suzhou, Nantong, Huai’an, Ningbo, Quzhou, Huaibei, and Anqing. Low-carbon and high-growth cities (LCHG cities) were scattered in distribution except for some that were concentrated only in the southwest of Yunnan, including Zhoushan, Bengbu, Suzhou, Lu’an, Bozhou, Nanchang, Jingdezhen, Yingtan, Fuzhou, Jingzhou, Xianning, Shaoyang, Zhangjiajie, Yiyang, and Yongzhou (Figure 5).
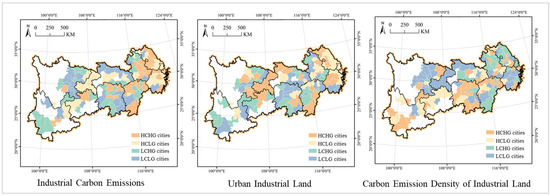
Figure 5.
The spatio-temporal evolution model of ICE, UIL, and CEDIL in the YREB.
From the perspective of urban industrial land, the median relative share and growth rate were 0.04% and 35.82%. The classification based on these as thresholds showed that most of the high-carbon and high-growth cities (HCHG cities) were concentrated in the Chengdu–Chongqing urban cluster, including Xuzhou, Changzhou, Lianyungang, Yangzhou, Zhenjiang, Suqian, Hangzhou, Shaoxing, Jinhua, Quzhou, Tongling, Chuzhou, Nanchang, Ganzhou, Fuzhou, Wuhan, Shiyan, and Xiangyang. Low-carbon and low-growth cities (LCLG cities) were in the middle reaches of the YREB, especially in the central region of Jiangxi, including Wenzhou, Zhoushan, Lishui, Huainan, Huaibei, Suzhou, Lu’an, Chizhou, Pingxiang, Xinyu, Shangrao, Ezhou, and Jingmen. Most of the high-carbon and low-growth cities (HCLG cities) were clustered in the YRD, especially in the Jiangsu and Anhui provinces, including Shanghai, Huai’an, Nanjing, Ningbo, Wuxi, Nantong, Jiaxing, Huzhou, Yancheng, Hefei, and Wuhu. Low-carbon and high-growth cities (LCHG cities) were scattered in the provincial fringe areas, including Huangshan, Fuyang, Bozhou, Xuancheng, Yingtan, Ji’an, Yichun, Xiaogan, Suizhou, Shaoyang, Zhangjiajie, Yongzhou, Guangyuan, Suining, and Neijiang (Figure 5).
From the perspective of carbon emission density of industrial land, the median relative share and growth rate were 0.06 and −15.78%, respectively. The classification based on these as the thresholds showed that high-carbon and high-growth cities (HCHG cities) were mostly concentrated in the middle and upper reaches of the YREB, including Jingmen, Xianning, Xiangtan, Yueyang, Changde, Yiyang, Chenzhou, Yongzhou, Huaihua, Loudi, Panzhihua, Leshan, Dazhou, Bazhong, Liupanshui, Yuxi, Baoshan, and Zhaotong. Low-carbon and low-growth cities (LCLG cities) were mostly concentrated in the Chengdu–Chongqing urban cluster and the central part of Zhejiang, including Changzhou, Nantong, Suqian, Hangzhou, Ningbo, Shaoxing, Jinhua, Lishui, Anqing, Huangshan, and Fuyang. High-carbon and low-growth cities (HCLG cities) were in the north of Guizhou, including Yichun, Huangshi, Xiaogan, Huanggang, Shaoyang, Neijiang, Guang’an, Zunyi, Anshun, Bijie, Tongren, and Qujing. Low-carbon and high-growth cities (LCHG cities) were mostly clustered in the southeast of Anhui, Jiangsu, and Jiangxi, including Nanjing, Lianyungang, Huai’an, Yancheng, Yangzhou, Huzhou, Hefei, Bengbu, Chuzhou, Lu’an, Bozhou, and Jingdezhen (Figure 5).
3.3. Driving Mechanism Analysis
3.3.1. Spatial Effects Detection
Table 2 shows that Moran’s I is greater than zero for all indicators, indicating that the geographic patterns and spatial and temporal evolution patterns of industrial carbon emissions, industrial land use, and industrial carbon intensity in the YREB are in significant positive spatial autocorrelation. The spatio-temporal evolution patterns of industrial carbon emissions from 2010 to 2020 and the geographic patterns of industrial carbon emissions in 2010 and 2020 showed a high autocorrelation index. From the industrial carbon perspective, the hot spots in 2010 and 2020 were concentrated in the Shanghai metropolitan area, with a shrinking spatial scope. In 2010, most of the cold spot cities were in eastern Sichuan and southwestern Yunnan, and in 2020, the cold spot cities expanded significantly, covering most of the YREB. They formed a large agglomeration in the middle reaches of the Yangtze River, centered on Hunan and Jiangxi, and extended into the lower reaches in western Anhui and southern Zhejiang. In addition, they formed a second agglomeration in the upper reaches of the Yangtze River, centered in Yunnan, Sichuan, and Guizhou and extending into southwestern Yunnan. The hot spots of the spatio-temporal evolution pattern from 2010 to 2020 were concentrated in the border area of Jiangsu province, Anhui province, and Zhejiang province (around Nanjing metropolitan area), while the cold spots formed three small clusters in eastern Sichuan, northern Hubei, and southern Hunan. The spatial pattern of “center-periphery” is formed by sub-cold and cold spots and sub-hot and hot spots in combination. It is worth noting that the sub-hot spots expanded in a beaded pattern by leaps to the middle and upper reaches of the Yangtze River region, forming a spatial structure of core-edge circles (Figure 6).
Table 2.
Spatial autocorrelation analysis on ICE, UIL, and CEDIL in the YREB.
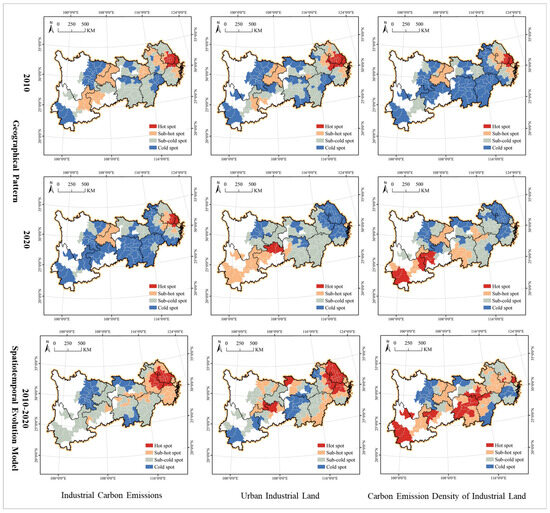
Figure 6.
The spatial effect of ICE, UIL, and CEDIL in the YREB.
According to the industrial land use, hot and sub-hot cities in 2010 were relatively concentrated in the lower reaches of the YREB, especially in the border areas of Jiangsu, Zhejiang, and Anhui. There were hot spot clusters formed in 2020, and most of the sub-hot spot cities were distributed in Yunnan, with hot spots and sub-hot spots concentrated in the upper reaches of the YREB. Cold spot cities in 2010 were scattered, forming small clusters only in eastern Sichuan. Cold spot cities were mostly concentrated in the YRD urban cluster in 2020, while sub-cold spots were mostly concentrated in the middle reaches of the YREB and extended upward to the Chengdu–Chongqing urban cluster. The spatial pattern of hot and cold spots was characterized by an upstream and downstream gradient rather than a circle-edge structure. Most of the hot spot cities in the evolution model of urban industrial land use from 2010 to 2020 were concentrated in the YRD urban cluster, especially in Jiangsu province, while the cold spots were relatively concentrated in Jiangxi and Yunnan provinces (Figure 6).
In terms of the carbon intensity of industrial land use, the hot spots in 2010 were fewer and located in and around the Shanghai metropolitan area, while the sub-hot spots were spread out in their neighboring areas. The hot spots and sub-hot spots shifted from the lower to the upper YREB in 2020, mostly concentrated in Yunnan and its border area with Guizhou, with a slight increase in the number of hot cities. Cold spots in 2010 covered most areas and were mostly concentrated in the middle reaches of the Yangtze River, centered in Jiangxi and Hunan, extending upstream to northern Guizhou and eastern Sichuan and downstream to western Anhui and the southwest corner of Zhejiang. Cold spot cities in 2020 shrank significantly, mostly concentrated in the YRD urban cluster, with a small number concentrated in eastern Sichuan. Most of the hot spots in the spatio-temporal evolution model from 2010 to 2020 were concentrated in Hunan in the middle reaches of the Yangtze River, with a small part in the upper reaches in Yunnan and the sub-hot cities distributed in their periphery. There were few cold spots, mostly in eastern Sichuan, with a few in the central part of Zhejiang and southeastern Jiangxi.
3.3.2. Single Factor Driving Force
In terms of the geographic pattern, the FDI and FE showed the strongest influence on the carbon emission intensity of industrial land as key factors. The NPA, ITGE, PCGDP, and GDP were not less influential, and they were important factors. The PTI had a weak and not statistically significant influence as an auxiliary factor. In terms of spatio-temporal evolution patterns, the FE and NPA had the strongest influence on the carbon emission density of industrial land as key factors. The ITGE, PCGDP, FDI, and GDP had comparable influences as important factors. The PTI had the lowest influence as an auxiliary factor. Of note is that the FDI was not statistically significant, and both the PCGDP and GDP were not significant (Table 3). To sum up, there were significant differences in the influences of different factors on the carbon emission density of industrial land. From a similarity perspective, the FE was a key factor common to both geographic and spatio-temporal evolution patterns, while the NPA, FE, ITGE, and GDP were important factors, and the PTI was an auxiliary factor common to them. From the perspective of differences, the PCGDP and FDI had more significant influence on the geographical pattern than spatio-temporal evolution, while the PTI was just the opposite. In addition, most factors, including the PCGDP, FE, ITGE, and FDI, showed greater influence on the geographical pattern than the spatio-temporal evolution pattern. The PTI was the opposite of them, while the influence of the GDP and NPA on both remained stable overall.
Table 3.
The impact of single factors on the geographical pattern and spatiotemporal evolution pattern of CEDIL in the YREB.
3.3.3. Multifactor Interaction Effect
Regarding the interaction type, most of the factor pairs were of nonlinear enhancement, with a few of bifactor enhancement, and there was a significant synergy between different factors. This suggests that the current pattern and change in the carbon emission density of industrial land is the result of a combination of factors. That is, different factors reinforce each other, and each factor has a significant direct impact on the carbon emission density. The additive effects produced by the interaction of different factors cannot be ignored. For geographical patterns, there was a large number of factor pairs of bifactor enhancement, including GDP and ITGE, GDP and FDI, GDP and NPA, PCGDP and ITGE, ITGE and FDI, ITGE and NPA, and NPA and FDI. However, for spatiotemporal evolution patterns, there was a very small number of factor pairs, only NPA and GDP and NPA and ITGE (Table 4 and Table 5). In terms of interaction intensity, FE and FDI showed the strongest interaction on geographic pattern, followed by FE and ITGE and FE and GDP showing significant interactions, with a comprehensive force exceeding 0.8 or even 0.9, far higher than other factor pairs, considered as super-factor pairs. FE and NPA, PCGDP and FE, PCGDP and FDI, PCGDP and NPA, PTI and FE, and PTI and FDI also showed high levels of interaction and should therefore be taken into account together in future policy designs. Multifactor pairs showed weaker interactions on spatio-temporal evolutionary patterns than geographic patterns, with FE and FDI, FDI and PCGDP, PCGDP and FE, and PTI and FE leading the way in the interacting force, which can be considered as super-factor pairs. It is important to note that NPA and PCGDP, NPA and FE, NPA and FDI, and GDP and PCGDP also showed non-weak interaction forces, and they are factor combination options that should not be ignored in the policy design. Overall, multifactor interactions are dominated by nonlinear enhancements with significant synergistic effects, and more and more super-factor pairs are emerging. In particular, the interaction of FDI, FE, and NPA with other factors showed a leading advantage, and they are the factors that should be emphasized and prioritized during the portfolio policy design.
Table 4.
The multifactor interaction effect on the geographical pattern of CEDIL in the YREB.
Table 5.
The multifactor interaction effect on the spatio-temporal evolution pattern of CEDIL in the YREB.
4. Discussion
The analysis shows that there is not a synchronous linear relationship between industrial land and its carbon emissions. Introducing the concept of carbon emission intensity can well reveal the coupling relationship between the two, while better meeting the needs of enabling carbon peaking and carbon neutrality through spatial planning. The comparison of Figure 2, Figure 3 and Figure 4 shows a large difference between industrial carbon emissions, industrial land use, and industrial land carbon emission density. For example, in 2020, Shanghai was the city with the largest industrial land use in the Yangtze River Economic Belt, but it was not the city with the highest carbon emissions. Instead, Suzhou had the highest carbon emissions, and Pu’er had the largest carbon emission density. The difference is universal, not an exception. For example, in the YRD city cluster, except Shanghai, all other cities have a high level of industrial land use, generally a medium or low level of industrial carbon emissions, and low or medium level of carbon emission densities. These three are not only different in their current patterns, but also increasingly in their evolution. For example, the evolution of industrial carbon emissions, industrial land use, and industrial land carbon intensity in Lincang present LCHG, LCLG, and HCHG patterns, respectively, completely differently. This result suggests that for the goal of carbon peaking and carbon neutrality, it is not enough to limit spatial planning to industrial land and the management of carbon emission scale, and a new concept of carbon emission density needs is needed.
The analysis shows that there is a significant spatial difference in the carbon emission density of industrial land in the YREB, with strong correlations between neighboring cities, and the evolution of density emerges in different patterns, including HCHG, HCLG, LCHG, and LCLG. Additionally, the spatial pattern and evolutionary pattern of carbon emission density of industrial land is the result of the joint action of factors. The FDI and FE play a key role in shaping spatial patterns, while the FE and NPA are key factors influencing evolution patterns. Different factors interact with each other to amplify their effects, so the final determination of the force of the factors should take into account rather than the direct force of a single factor, as well as the influence of the association between other factors, especially the strong interaction of the FE and FDI with other factors. It provides a scientific basis for combining strategies in the policy design.
Urban density gained attention as a major issue for cities after the Industrial Revolution [60]. To alleviate the problems of dirtiness and overcrowding in Western industrial cities, scholars from the early 20th century to the 1960s developed two schools of thought in the study urban density: decentralization and centralization [61]. The former, represented by Howard’s Garden City, created the idea of low density, while the latter, represented by Corbusier’s Radiant City, created the idea of high density by advocating higher building heights, more green space, and increased road widths. In the face of challenges such as suburban sprawl, inner-city decay, and urban disease, the 1970s and 1990s saw the rise of “new urbanism”, “smart growth”, and “compact city” concepts, with higher densities dominating urban development [62]. City governments hope to address urban disease by promoting the rebirth and revitalization of urban centers through high-density development, mixed-use land use, and transit-oriented development to conserve land and reduce energy consumption [63]. Since the beginning of the 21st century, scholars have begun to pay attention to and gradually attach importance to the negative effects of high-density urban development, such as traffic congestion caused by excessive high-density urban development, the declining living environment quality, insufficient green space, and serious air pollution [64]. Based on the value trade-off between “economy, environment and people” and the historical reflections on the development of cities with low and high densities, the inverted U-shaped relationship between urban density and urban development benefits has gradually become the consensus of academia and industry [65].
Carbon emission density is an important dimension of urban density, and based on the results of the above analysis, we believe that it is also consistent with parabolic theory. That is, the carbon emission density increases gradually in the early stage and begins to decrease after reaching a peak (critical value). Both too high and too low carbon emission densities pose problems for the sustainability of urban industrial land use, with a medium density being superior to high and low densities [66,67]. Medium-suitable density can balance the weaknesses of both high density and low density to maximize the economic, environmental, and human benefits of urban industrial land management. There are two possible reasons for the low carbon emission density of industrial land. First, the small scale of industrial carbon emissions as a molecule indicates a high level of development of greening and low carbonization of the industrial system. Significantly, for Chinese cities at the current stage, the excessive pursuit of low carbonization or even zero carbonization in industrial development implies high development costs and prices, which goes against the healthy development of industries and cities. Second, the large size of industrial land use as the denominator indicates extensive industrial land development. The non-intensive use of industrial land will lead to a waste of land resources, as well as increased transportation costs, high construction costs of supporting facilities and low interest rates. On the contrary, a high carbon emission density in industrial land may also lead to two unhealthy situations. On the one hand, the large scale of industrial carbon emissions as a numerator indicates that high-emission, high-energy-consumption, and high-pollution industrial sectors account for a high proportion of the industrial system, hindering industrial upgrading and high-quality urban development. On the other hand, the small size of industrial land use as the denominator indicates that the supply of industrial land resources is insufficient. In this context, enterprises can only seek to meet the demand by increasing the land plot ratio, and therefore, they put up high-rise buildings in large quantities, boosting the cost of development.
It is important to note that the medium density is not a specific and fixed number but a dynamic range, and the upper and lower limits may not be exactly the same across regions and cities (Figure 7a). The values at the two ends of the medium density can be determined in single-city sample studies using a time-series analysis; in large multi-city sample studies, they need to be obtained using regional comparative analysis. In addition to observing the pattern of change in the carbon intensity, the determination of values should also take into account the local development characteristics and stage needs of the study area. In addition, zoning can be traced back to the theory of locality and is a common tool for spatial planning of cities and territories [68]. It is of great value to quantitatively draw the carbon emission density planning zoning of urban industrial land and design and implement differentiated management policies under the goal of “carbon neutral carbon peak” for controlling the carbon emissions of urban industrial land. For specific study areas, their internal members can be divided into several planning zonings using quantile spatial clustering analysis, and the government needs to focus on ultra-high or ultra-low density urban governance. It should be noted that the number of members in different zonings should be in an olive-shaped structure of “small at both ends and large in the middle”, and if, on the contrary, there is a dumbbell-shaped structure of being “large at both ends and small in the middle”, it indicates unreasonable planning zoning of the carbon emission density of industrial land (Figure 7a). In the process of introducing the concept and algorithm of carbon density into spatial planning, planners need to pay attention to the differences between planning systems of different countries and regions, as well as the regional characteristics of different study areas, especially the industrial supporting features (transportation, logistics, and other productive services) [69].

Figure 7.
The functional relationship between carbon emission density and combined benefits of urban industrial land. (a) Carbon emission density benefit curve; (b) Carbon emission density zoning map.
The greatest contribution of this paper is to put forward the concept and measurement method of urban industrial land carbon emission density and discuss its connotation and application value from the theoretical level. Many studies in the past have discussed the relationship between urban density and carbon emissions [70,71]. For example, Norman and Ishii argued that the medium density is most conducive to reducing carbon emissions [72,73]. However, the variable used in these studies was total carbon emissions rather than density. From the previous analysis, it can be seen that total carbon emissions and density are two completely different concepts, and their geographical patterns and spatio-temporal evolution also have significant differences. In traditional studies, we pay more attention to the scale and intensity of carbon emissions (the relationship with economy) while neglecting the connection between carbon emissions and space (i.e., carbon emission density). Spatial planning requires us to find and solve problems from the perspective of space. The carbon emission scale and intensity indicators do not match the needs of spatial planning, while the carbon emission density solves the problem. To a certain extent, proposing the concept of carbon emission density and its measurement method and establishing the direct relationship between carbon emissions and space is of great academic innovation for spatial planning research. Therefore, the design of policies based on total carbon emissions alone is incomplete, as the insufficient consideration of carbon intensity is likely to cause failure in urban land-use planning under the “dual-carbon” goal. The introduction of spatial econometric modeling to improve the accuracy of the analytical results and conclusions is another marginal contribution of this paper. The industrial carbon emissions, urban industrial land, and carbon emission density of industrial land all have significant spatial effects, while most of the past studies chose linear regression and other traditional statistical models, ignoring the influence of spatial heterogeneity and autocorrelation on variables and their relationships.
As mentioned earlier, medium densities are more suitable for sustainable urban development than high and low densities, and therefore, carbon emission control on the YREB industrial sites should focus on both the low- and high-density ends. The identification of interval thresholds for medium density is a prerequisite for policy design. According to the numerical distribution structure of carbon emission density of industrial land in the YREB in 2020 and the balance of the number of members of different zoning schemes (small at both ends, large in the middle), the suggestion is to set the upper threshold to 1.5 million tons/km2 and the lower threshold to 500,000 tons/km2. Therefore, the proportion of 28.18%, 42.73%, and 29.09% of high-, medium-, and low-density cities in the YREB suggests that the distribution structure conforms to the “olive shape”, which is reasonable (Figure 8).
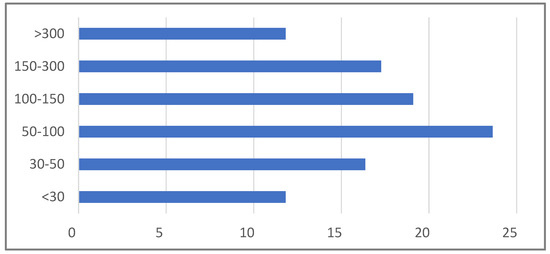
Figure 8.
Threshold selection of CEDIL in the YREB.
For low-density cities including Nantong, Bozhou, Lishui, Bengbu, Jingzhou, Chongqing, Ya’an, Ziyang, Fuyang, Zhuzhou, Mianyang, Hefei, Shaoxing, and Xiangyang, they are faced up with a low-density spread of industrial land (Table 6). They need to be guided by the concept of compact cities and smart growth in the future to moderately control the spread and expansion of industrial land, coupled with industrial upgrading and transformation, to gradually increase the carbon emission density of industrial land. In particular, Chengdu, Zigong, Suining, Nanchong, Suizhou, and Huangshan have excessively low carbon densities, and they urgently need to control the spread of low densities on industrial land. In addition, low-density cities should be active in participating in the regional carbon emission trading for industrial land and enhance their capacity for sustainable development through inter-city ecological compensation transfers.
Table 6.
The planning zoning of CEDIL in the YREB.
For high-density cities including Zhoushan, Tongling, Bazhong, Huanggang, Jingmen, Xuzhou, Maanshan, Lijiang, and Tongren, they are characterized by high energy consumption and high emissions in industry types (Table 6). Therefore, the focus in the future is to increase the transformation of industrial structure and build a safe and clean energy system. Notably, Pu’er, Liupanshui, Yuxi, Ezhou, and Qujing have excessively high carbon intensities, especially Pu’er, which, as a tourist city, should push the low-carbon transformation of existing industries. For high-density cities, priority should be given to adjusting the land-use structure, promoting low-carbon and zero carbonization transformation of industrial space, and quickly building a circular economic system and spatial pattern. The influence of human economic behaviors on regional carbon emissions is to a large extent based on the changes to the way industries are spatially planned, with land use as the carrier. Meanwhile, they should also vigorously develop eco-industries and green services and promote the gradual utilization of energy between industries while reducing fossil energy consumption.
In addition, we suggest that all cities in the YREB include the carbon emission density of industrial land in their land transfer standards to strengthen their direct control over carbon emissions. The current criteria for the granting of industrial land in the YREB cities focuses mainly on economic efficiency and is not sufficiently responsive to “dual-carbon” objectives. For example, the policy provided in the “Standard Land” Control Indicators for Industrial Land in Mianyang City takes the intensity of fixed assets investment (104 yuan/mu), the average output value per mu (104 yuan/mu), the average tax per mu (104 yuan/mu), and the plot ratio of industrial land as mandatory indicators, and it has no environmental constraints related to carbon emissions. Therefore, it is recommended that all cities incorporate the density and total amount of carbon emissions from industrial land into land transfer standards and management policies as soon as possible, as a binding indicator for the selection of urban industries and structural optimization, so as to promote the low carbonization of the industrial system and economic development.
It is worth to note that close cooperation between different cities in the YREB has been established, and as a world-class urban agglomeration, the YREB is closely linked to other cities around the world [74]. And the analysis above shows that the carbon emission density of industrial land in the YREB shows significant spatial heterogeneity and autocorrelation. Therefore, it is necessary to develop policies to promote carbon peaking and carbon neutrality in an orderly manner based on the differences in the carbon emission densities of industrial land in different cities and to emphasize collaboration between different cities in achieving the goals, including carbon emission trading between internal cities and exchange and cooperation between external cities. Regional cooperation to promote the low-carbon transformation of industrial structure is to fully leverage the comparative advantages of each region under the constraint of carbon emission density, promote inter-regional industrial transfer and integrated development, jointly cultivate innovative and green industries, and optimize the combination of production and innovation factors in a larger spatial range.
In the end, we suggest that all cities in the YREB should highlight the synergy among multiple factors in designing policy systems and organically combine the policies to strengthen the indirect management of carbon emissions. For example, the FDI, FE, and NPA, as super-interacting factors, have a leading advantage in interacting with other factors, and significantly amplify their influence on the carbon emission intensity of industrial land. Therefore, for globalization, government intervention, and technological innovation represented by the FDI, FE, and NPA [75,76], it is necessary to design dedicated supporting policies, and more importantly, to highlight their combined relationship with related policies such as investment density, urban planning, and plot ratio control to optimize management performance [77,78].
5. Conclusions
Industry is one of the largest sources of carbon emissions, and the management of carbon emissions from industrial land is a key part to achieve the goal of “double carbon”. This study conducted an empirical research based on the 2010–2020 carbon emission dataset of urban industrial land use in the YREB and proposed the concept of carbon emission density of urban industrial land use and its measurement method from the perspective of urban and territorial spatial planning. The findings are as follows:
First, the geographic patterns of industrial carbon emissions, urban industrial land, and carbon emission density of industrial land did not agree with their spatio-temporal evolution. The management of industrial land under the goal of “carbon neutrality and carbon peaking” is incomplete if it is only concerned with the total amount of carbon emissions, and it is necessary to incorporate the carbon emission intensity of industrial land into the control system as soon as possible. Second, the carbon emission density of urban industrial land showed significant spatial heterogeneity, with large differences between different cities. This suggests that the design of carbon emission intensity control systems for industrial land use needs to be city specific, with differentiated management policies for different zonings. Third, the carbon emission intensity of urban industrial land showed significant positive spatial autocorrelation. This demonstrates the need to strengthen intercity cooperation in carbon intensity management, with a focus on pushing spatial synergy in the upper, middle, and lower reaches of the YREB, especially in urban clusters, metropolitan areas, and interprovincial border areas. Fourth, the geographical pattern and spatio-temporal evolution model of urban industrial land carbon emission density had a very complex driving mechanism, with prominent features of diversification and ranking of influencing factors, and significant interaction effects among multiple factors. Therefore, in the scheme design of the control system, the influence of key factors should be emphasized, and attention should be paid to the coordination of multiple factors to realize the “organic combination of policies”.
It should be noted that due to the difficulty of data quantification and the limitation of data availability, we neglected the empirical analysis of single-city cases at the micro-scale in this study when analyzing the geographic pattern, spatial, and temporal evolutionary patterns of carbon emission intensity of the YREB’s multi-city industrial land at the macro-scale, as well as its spatial effects and driving mechanisms. Additionally, the dynamics of carbon reduction capacity are closely related to national, local, and urban strategies, but they have not been empirically analyzed due to the lack of suitable quantitative indicators.
Author Contributions
Conceptualization, Min Lai and Fei Xie; methodology, Min Lai, Sidong Zhao and Qipeng Zhang; software, Shuaibing Zhang and Qipeng Zhang; validation, Min Lai, Shuaibing Zhang and Qipeng Zhang; formal analysis, Min Lai, Sidong Zhao and Fei Xie; investigation, Fei Xie, Shuaibing Zhang and Qipeng Zhang; resources, Min Lai and Fei Xie; data curation, Shuaibing Zhang and Qipeng Zhang; writing—original draft preparation, Fei Xie, Shuaibing Zhang and Qipeng Zhang; writing—review and editing, Min Lai and Sidong Zhao; visualization, Shuaibing Zhang and Qipeng Zhang; supervision, Min Lai; project administration, Fei Xie; funding acquisition, Min Lai and Fei Xie. All authors have read and agreed to the published version of the manuscript.
Funding
This research was funded by the Guangdong Provincial Philosophy and Social Science Planning Project (GD24CYJ51) and the Open Research Project of the Research Center for University-City Integration Development (2024KF006). This work was funded by a new round of first-class disciplines (statistics) of Guangxi.
Data Availability Statement
The land data is sourced from the Statistical Yearbook of Urban Construction published by the Ministry of Housing and Urban Rural Development of the People’s Republic of China, while the carbon emission data is sourced from the China City Greenhouse Gas Working Group’s dataset on carbon dioxide emissions from Chinese cities (http://www.cityghg.com/toCauses?id=4, 2 November 2023), the remaining data is sourced from the China Urban Statistical Yearbook published by the National Bureau of Statistics.
Acknowledgments
Thank you to Kaixu Zhao, Weiwei Li and all the reviewers for their contributions and assistance in the process of improving the paper.
Conflicts of Interest
The authors declare no conflicts of interest.
Appendix A. Normalized Data on Industrial Land, Carbon Emissions, and Its Density
| Urban Industrial Land | Industrial Carbon Emissions | Carbon Emission Density | ||||
| 2010 | 2020 | 2010 | 2020 | 2010 | 2020 | |
| Shanghai | 0.0703 | 0.0461 | 0.2126 | 0.1319 | 0.0012 | 0.0015 |
| Nanjing | 0.0295 | 0.0314 | 0.0465 | 0.0310 | 0.0022 | 0.0042 |
| Wuxi | 0.0298 | 0.0256 | 0.0163 | 0.0176 | 0.0064 | 0.0061 |
| Xuzhou | 0.0290 | 0.0288 | 0.0101 | 0.0123 | 0.0101 | 0.0097 |
| Changzhou | 0.0134 | 0.0162 | 0.0118 | 0.0221 | 0.0040 | 0.0030 |
| Suzhou-JS | 0.0514 | 0.0491 | 0.0451 | 0.0305 | 0.0040 | 0.0067 |
| Nantong | 0.0145 | 0.0124 | 0.0162 | 0.0179 | 0.0031 | 0.0029 |
| Lianyungang | 0.0044 | 0.0109 | 0.0098 | 0.0128 | 0.0016 | 0.0036 |
| Huai’an | 0.0073 | 0.0073 | 0.0133 | 0.0086 | 0.0019 | 0.0035 |
| Yancheng | 0.0039 | 0.0096 | 0.0083 | 0.0093 | 0.0016 | 0.0043 |
| Yangzhou | 0.0098 | 0.0124 | 0.0080 | 0.0097 | 0.0043 | 0.0053 |
| Zhenjiang | 0.0125 | 0.0188 | 0.0103 | 0.0131 | 0.0043 | 0.0060 |
| Taizhou-JS | 0.0080 | 0.0114 | 0.0082 | 0.0084 | 0.0034 | 0.0056 |
| Suqian | 0.0023 | 0.0021 | 0.0047 | 0.0075 | 0.0017 | 0.0012 |
| Hangzhou | 0.0152 | 0.0108 | 0.0183 | 0.0303 | 0.0029 | 0.0015 |
| Ningbo | 0.0360 | 0.0265 | 0.0358 | 0.0326 | 0.0035 | 0.0034 |
| Wenzhou | 0.0080 | 0.0086 | 0.0100 | 0.0019 | 0.0028 | 0.0191 |
| Jiaxing | 0.0115 | 0.0127 | 0.0079 | 0.0085 | 0.0051 | 0.0062 |
| Huzhou | 0.0091 | 0.0105 | 0.0101 | 0.0078 | 0.0032 | 0.0056 |
| Shaoxing | 0.0075 | 0.0087 | 0.0080 | 0.0164 | 0.0033 | 0.0022 |
| Jinhua | 0.0104 | 0.0074 | 0.0046 | 0.0062 | 0.0079 | 0.0050 |
| Quzhou | 0.0099 | 0.0102 | 0.0053 | 0.0071 | 0.0065 | 0.0060 |
| Zhoushan | 0.0015 | 0.0046 | 0.0021 | 0.0015 | 0.0024 | 0.0123 |
| Taizhou-ZJ | 0.0094 | 0.0093 | 0.0133 | 0.0072 | 0.0025 | 0.0053 |
| Lishui | 0.0012 | 0.0007 | 0.0010 | 0.0011 | 0.0043 | 0.0027 |
| Hefei | 0.0055 | 0.0116 | 0.0189 | 0.0214 | 0.0010 | 0.0023 |
| Wuhu | 0.0102 | 0.0196 | 0.0080 | 0.0056 | 0.0045 | 0.0146 |
| Bengbu | 0.0033 | 0.0042 | 0.0061 | 0.0065 | 0.0019 | 0.0027 |
| Huainan | 0.0168 | 0.0176 | 0.0045 | 0.0046 | 0.0132 | 0.0159 |
| Maanshan | 0.0134 | 0.0204 | 0.0092 | 0.0088 | 0.0051 | 0.0096 |
| Huaibei | 0.0179 | 0.0098 | 0.0055 | 0.0048 | 0.0115 | 0.0085 |
| Tongling | 0.0086 | 0.0162 | 0.0027 | 0.0059 | 0.0113 | 0.0114 |
| Anqing | 0.0077 | 0.0070 | 0.0069 | 0.0076 | 0.0039 | 0.0038 |
| Huangshan | 0.0002 | 0.0001 | 0.0017 | 0.0026 | 0.0005 | 0.0001 |
| Chuzhou | 0.0031 | 0.0070 | 0.0056 | 0.0074 | 0.0019 | 0.0039 |
| Fuyang | 0.0036 | 0.0029 | 0.0026 | 0.0051 | 0.0049 | 0.0024 |
| Suzhou-AH | 0.0030 | 0.0054 | 0.0038 | 0.0040 | 0.0028 | 0.0057 |
| Lu’an | 0.0010 | 0.0015 | 0.0035 | 0.0033 | 0.0010 | 0.0019 |
| Bozhou | 0.0010 | 0.0024 | 0.0023 | 0.0036 | 0.0015 | 0.0027 |
| Chizhou | 0.0045 | 0.0073 | 0.0015 | 0.0015 | 0.0104 | 0.0198 |
| Xuancheng | 0.0069 | 0.0074 | 0.0030 | 0.0044 | 0.0081 | 0.0070 |
| Nanchang | 0.0038 | 0.0048 | 0.0108 | 0.0150 | 0.0012 | 0.0013 |
| Jingdezhen | 0.0033 | 0.0051 | 0.0054 | 0.0063 | 0.0021 | 0.0034 |
| Pingxiang | 0.0063 | 0.0066 | 0.0022 | 0.0021 | 0.0101 | 0.0128 |
| Jiujiang | 0.0081 | 0.0152 | 0.0067 | 0.0076 | 0.0042 | 0.0083 |
| Xinyu | 0.0096 | 0.0084 | 0.0032 | 0.0022 | 0.0106 | 0.0158 |
| Yingtan | 0.0018 | 0.0026 | 0.0008 | 0.0024 | 0.0078 | 0.0046 |
| Ganzhou | 0.0039 | 0.0076 | 0.0043 | 0.0084 | 0.0032 | 0.0038 |
| Ji’an | 0.0038 | 0.0038 | 0.0021 | 0.0038 | 0.0062 | 0.0042 |
| Yichun | 0.0080 | 0.0107 | 0.0020 | 0.0031 | 0.0138 | 0.0145 |
| Fuzhou | 0.0006 | 0.0040 | 0.0019 | 0.0057 | 0.0010 | 0.0030 |
| Shangrao | 0.0059 | 0.0073 | 0.0016 | 0.0015 | 0.0127 | 0.0199 |
| Wuhan | 0.0295 | 0.0192 | 0.0445 | 0.0535 | 0.0023 | 0.0015 |
| Huangshi | 0.0136 | 0.0121 | 0.0056 | 0.0060 | 0.0086 | 0.0084 |
| Shiyan | 0.0028 | 0.0029 | 0.0052 | 0.0083 | 0.0019 | 0.0014 |
| Yichang | 0.0092 | 0.0093 | 0.0091 | 0.0097 | 0.0035 | 0.0040 |
| Xiangyang | 0.0071 | 0.0068 | 0.0077 | 0.0128 | 0.0032 | 0.0022 |
| Ezhou | 0.0081 | 0.0073 | 0.0037 | 0.0009 | 0.0077 | 0.0320 |
| Jingmen | 0.0076 | 0.0077 | 0.0036 | 0.0031 | 0.0076 | 0.0103 |
| Xiaogan | 0.0056 | 0.0057 | 0.0018 | 0.0035 | 0.0112 | 0.0068 |
| Jingzhou | 0.0029 | 0.0035 | 0.0047 | 0.0054 | 0.0022 | 0.0027 |
| Huanggang | 0.0061 | 0.0039 | 0.0016 | 0.0015 | 0.0137 | 0.0105 |
| Xianning | 0.0032 | 0.0065 | 0.0037 | 0.0036 | 0.0030 | 0.0076 |
| Suizhou | 0.0004 | 0.0004 | 0.0026 | 0.0054 | 0.0005 | 0.0003 |
| Changsha | 0.0072 | 0.0047 | 0.0087 | 0.0057 | 0.0029 | 0.0034 |
| Zhuzhou | 0.0069 | 0.0050 | 0.0068 | 0.0088 | 0.0036 | 0.0024 |
| Xiangtan | 0.0066 | 0.0126 | 0.0089 | 0.0078 | 0.0026 | 0.0067 |
| Hengyang | 0.0122 | 0.0054 | 0.0062 | 0.0073 | 0.0069 | 0.0031 |
| Shaoyang | 0.0041 | 0.0045 | 0.0010 | 0.0012 | 0.0148 | 0.0157 |
| Yueyang | 0.0064 | 0.0081 | 0.0049 | 0.0049 | 0.0045 | 0.0068 |
| Changde | 0.0052 | 0.0073 | 0.0054 | 0.0045 | 0.0034 | 0.0068 |
| Zhangjiajie | 0.0003 | 0.0006 | 0.0003 | 0.0007 | 0.0040 | 0.0033 |
| Yiyang | 0.0029 | 0.0041 | 0.0037 | 0.0023 | 0.0027 | 0.0073 |
| Chenzhou | 0.0101 | 0.0055 | 0.0073 | 0.0017 | 0.0049 | 0.0134 |
| Yongzhou | 0.0019 | 0.0040 | 0.0017 | 0.0020 | 0.0038 | 0.0084 |
| Huaihua | 0.0030 | 0.0016 | 0.0014 | 0.0005 | 0.0073 | 0.0125 |
| Loudi | 0.0133 | 0.0175 | 0.0029 | 0.0029 | 0.0164 | 0.0246 |
| Chongqing | 0.0504 | 0.0462 | 0.0578 | 0.0734 | 0.0031 | 0.0026 |
| Chengdu | 0.0088 | 0.0069 | 0.0259 | 0.0347 | 0.0012 | 0.0008 |
| Zigong | 0.0032 | 0.0014 | 0.0059 | 0.0072 | 0.0019 | 0.0008 |
| Panzhihua | 0.0095 | 0.0088 | 0.0070 | 0.0058 | 0.0048 | 0.0063 |
| Luzhou | 0.0056 | 0.0034 | 0.0041 | 0.0068 | 0.0049 | 0.0021 |
| Deyang | 0.0044 | 0.0024 | 0.0046 | 0.0061 | 0.0034 | 0.0016 |
| Mianyang | 0.0058 | 0.0043 | 0.0078 | 0.0079 | 0.0026 | 0.0023 |
| Guangyuan | 0.0020 | 0.0028 | 0.0017 | 0.0029 | 0.0041 | 0.0041 |
| Suining | 0.0005 | 0.0006 | 0.0022 | 0.0033 | 0.0008 | 0.0007 |
| Neijiang | 0.0076 | 0.0069 | 0.0020 | 0.0042 | 0.0134 | 0.0069 |
| Leshan | 0.0095 | 0.0107 | 0.0031 | 0.0022 | 0.0109 | 0.0201 |
| Nanchong | 0.0007 | 0.0006 | 0.0033 | 0.0058 | 0.0007 | 0.0005 |
| Meishan | 0.0034 | 0.0023 | 0.0016 | 0.0018 | 0.0075 | 0.0053 |
| Yibin | 0.0060 | 0.0060 | 0.0010 | 0.0080 | 0.0215 | 0.0031 |
| Guang’an | 0.0061 | 0.0060 | 0.0016 | 0.0030 | 0.0130 | 0.0084 |
| Dazhou | 0.0098 | 0.0071 | 0.0033 | 0.0014 | 0.0105 | 0.0206 |
| Ya’an | 0.0009 | 0.0014 | 0.0008 | 0.0023 | 0.0039 | 0.0026 |
| Bazhong | 0.0004 | 0.0012 | 0.0002 | 0.0004 | 0.0072 | 0.0113 |
| Ziyang | 0.0008 | 0.0005 | 0.0027 | 0.0008 | 0.0011 | 0.0026 |
| Guiyang | 0.0073 | 0.0066 | 0.0093 | 0.0147 | 0.0028 | 0.0018 |
| Liupanshui | 0.0216 | 0.0210 | 0.0043 | 0.0010 | 0.0176 | 0.0911 |
| Zunyi | 0.0074 | 0.0092 | 0.0023 | 0.0061 | 0.0113 | 0.0063 |
| Anshun | 0.0033 | 0.0040 | 0.0014 | 0.0028 | 0.0079 | 0.0059 |
| Bijie | 0.0250 | 0.0169 | 0.0020 | 0.0030 | 0.0450 | 0.0237 |
| Tongren | 0.0031 | 0.0039 | 0.0000 | 0.0019 | 0.2692 | 0.0087 |
| Kunming | 0.0156 | 0.0060 | 0.0211 | 0.0140 | 0.0026 | 0.0018 |
| Qujing | 0.0272 | 0.0169 | 0.0026 | 0.0024 | 0.0362 | 0.0295 |
| Yuxi | 0.0049 | 0.0090 | 0.0006 | 0.0011 | 0.0301 | 0.0332 |
| Baoshan | 0.0007 | 0.0022 | 0.0004 | 0.0005 | 0.0073 | 0.0199 |
| Zhaotong | 0.0013 | 0.0046 | 0.0006 | 0.0013 | 0.0084 | 0.0153 |
| Lijiang | 0.0018 | 0.0011 | 0.0003 | 0.0005 | 0.0226 | 0.0088 |
| Pu’er | 0.0011 | 0.0028 | 0.0007 | 0.0001 | 0.0059 | 0.0958 |
| Lincang | 0.0007 | 0.0018 | 0.0001 | 0.0004 | 0.0225 | 0.0171 |
References
- Zhou, S.Y.; Li, W.; Lu, Z.G.; Lu, Z.Y. A technical framework for integrating carbon emission peaking factors into the industrial green transformation planning of a city cluster in China. J. Clean. Prod. 2022, 344, 131091. [Google Scholar] [CrossRef]
- Coluzzi, R.; Bianchini, L.; Egidi, G.; Cudlin, P.; Imbrenda, V.; Salvati, L.; Lanfredi, M. Density matters? Settlement expansion and land degradation in Peri-urban and rural districts of Italy. Environ. Impact Assess. Rev. 2022, 92, 106703. [Google Scholar] [CrossRef]
- Grosvenor, M.; O’Neill, P. The Density Debate in Urban Research: An Alternative Approach to Representing Urban Structure and Form. Geogr. Res. 2014, 52, 442–458. [Google Scholar] [CrossRef]
- Claassens, J.; Koomen, E.; Rouwendal, J. Urban density and spatial planning: The unforeseen impacts of Dutch devolution. PLoS ONE 2020, 15, e0240738. [Google Scholar] [CrossRef] [PubMed]
- Yeh, A.G.O.; Li, X. A cellular automata model to simulate development density for urban planning. Environ. Plan. B-Plan. Des. 2002, 29, 431–450. [Google Scholar] [CrossRef]
- Shen, X.Z.; Huang, L.; Zhu, J.; Gao, J.J. Relationship between land use carbon emission and economic growth based on GIS. Arab. J. Geosci. 2021, 14, 457. [Google Scholar] [CrossRef]
- Robinson, D.T.; Zhang, J.X.; MacDonald, D.; Samson, C. Estimating Settlement carbon stock and density using an inventory approach and quantifying their variation by land use and parcel size. Urban For. Urban Green. 2023, 82, 127878. [Google Scholar] [CrossRef]
- Grassi, G.; Conchedda, G.; Federici, S.; Vinas, R.A.; Korosuo, A.; Melo, J.; Rossi, S.; Sandker, M.; Somogyi, Z.; Vizzarri, M.; et al. Carbon fluxes from land 2000–2020: Bringing clarity to countries’ reporting. Earth Syst. Sci. Data 2022, 14, 4643–4666. [Google Scholar] [CrossRef]
- Rehman, E.; Rehman, S. Modeling the nexus between carbon emissions, urbanization, population growth, energy consumption, and economic development in Asia: Evidence from grey relational analysis. Energy Rep. 2022, 8, 5430–5442. [Google Scholar] [CrossRef]
- Huang, W.; Li, J.X. The Coupling Relationship Between Urbanization and Carbon Emissions from Land Use in Ningxia. Front. Environ. Sci. 2022, 10, 927798. [Google Scholar] [CrossRef]
- Li, M.C.; Liu, H.M.; Yu, S.K.; Wang, J.S.; Miao, Y.; Wang, C.X. Estimating the Decoupling between Net Carbon Emissions and Construction Land and Its Driving Factors: Evidence from Shandong Province, China. Int. J. Environ. Res. Public Health 2022, 19, 8910. [Google Scholar] [CrossRef]
- Sidorczuk-Pietraszko, E. Spatial Differences in Carbon Intensity in Polish Households. Energies 2020, 13, 3108. [Google Scholar] [CrossRef]
- Rong, T.Q.; Zhang, P.Y.; Zhu, H.R.; Jiang, L.; Li, Y.Y.; Liu, Z.Y. Spatial correlation evolution and prediction scenario of land use carbon emissions in China. Ecol. Inform. 2022, 71, 101802. [Google Scholar] [CrossRef]
- Sun, Y.P.; Kamran, H.W.; Razzaq, A.; Qadri, F.S.; Suksatan, W. Dynamic and causality linkages from transportation services and tourism development to economic growth and carbon emissions: New insights from Quantile ARDL approach. Integr. Environ. Assess. Manag. 2022, 18, 1272–1287. [Google Scholar] [CrossRef]
- Russo, F.; Rindone, C.; Panuccio, P. External interactions for a third-generation port: From urban sustainable planning to research developments. Int. J. Transp. Dev. Integr. 2022, 3, 253–270. Available online: https://www.iieta.org/journals/ijtdi/paper/10.2495/EI-V6-N3-253-270 (accessed on 15 May 2024).
- Xiong, G.B.; Deng, J.H.; Ding, B.G. Characteristics, decoupling effect, and driving factors of regional tourism’s carbon emissions in China. Environ. Sci. Pollut. Res. 2022, 29, 47082–47093. [Google Scholar] [CrossRef]
- Tang, Y.; Chen, M.H. Impact Mechanism and Effect of Agricultural Land Transfer on Agricultural Carbon Emissions in China: Evidence from Mediating Effect Test and Panel Threshold Regression Model. Sustainability 2022, 14, 13014. [Google Scholar] [CrossRef]
- Wang, X.X.; He, A.Z.; Zhao, J. Regional disparity and dynamic evolution of carbon emission reduction maturity in China’s service industry. J. Clean. Prod. 2020, 244, 118926. [Google Scholar] [CrossRef]
- Zhang, P.; Hu, J.; Zhao, K.; Chen, H.; Zhao, S.; Li, W. Dynamics and Decoupling Analysis of Carbon Emissions from Construction Industry in China. Buildings 2022, 12, 257. [Google Scholar] [CrossRef]
- Kara, F.; Bas, T.; Talu, N.H.T.; Alola, A.A. Investigating the carbon emission aspects of agricultural land utilization in Turkey. Integr. Environ. Assess. Manag. 2021, 18, 988–996. [Google Scholar] [CrossRef] [PubMed]
- Rasheed, R.; Tahir, F.; Afzaal, M.; Ahmad, S.R. Decomposition analytics of carbon emissions by cement manufacturing—A way forward towards carbon neutrality in a developing country. Environ. Sci. Pollut. Res. 2022, 29, 49429–49438. [Google Scholar] [CrossRef]
- Li, M.; Li, Q.; Wang, Y.A.; Chen, W. Spatial path and determinants of carbon transfer in the process of inter industrial transfer in China. Environ. Impact Assess. Rev. 2022, 95, 106810. [Google Scholar] [CrossRef]
- Malik, A.; Lan, J. The role of outsourcing in driving global carbon emissions. Econ. Syst. Res. 2016, 28, 168–182. [Google Scholar] [CrossRef]
- Liu, X.; Zhang, Y.C.; Wang, Q.W. Drivers of global carbon emission changes: A heterogeneity perspective of decomposition and attribution analysis. Front. Environ. Sci. 2023, 10, 1062500. [Google Scholar] [CrossRef]
- Xu, D.X.; Zhang, Y.; Li, Y.G.; Wang, X.J.; Yang, Z.F. Path analysis for carbon transfers embodied in China’s international trade and policy implications for mitigation targets. J. Clean. Prod. 2022, 334, 130207. [Google Scholar] [CrossRef]
- Tikoudis, I.; Farrow, K.; Mebiame, R.M.; Oueslati, W. Beyond average population density: Measuring sprawl with density-allocation indicators. Land Use Policy 2022, 112, 105832. [Google Scholar] [CrossRef]
- Cetin, M.; Adiguzel, F.; Gungor, S.; Kaya, E.; Sancar, M.C. Evaluation of thermal climatic region areas in terms of building density in urban management and planning for Burdur, Turkey. Air Qual. Atmos. Health 2019, 12, 1103–1112. [Google Scholar] [CrossRef]
- Henderson, J.V.; Nigmatulina, D.; Kriticos, S. Measuring urban economic density. J. Urban Econ. 2021, 125, 103188. [Google Scholar] [CrossRef]
- Perumal, A.; Timmons, D. Contextual Density and US Automotive CO2 Emissions across the Rural-Urban Continuum. Int. Reg. Sci. Rev. 2017, 40, 590–615. [Google Scholar] [CrossRef]
- Moghadam, A.S.; Soltani, A.; Parolin, B.; Alidadi, M. Analysing the space-time dynamics of urban structure change using employment density and distribution data. Cities 2018, 81, 203–213. [Google Scholar] [CrossRef]
- Keeratikasikorn, C. A comparative study on four major cities in Northeastern Thailand using urban land density function. Geo-Spat. Inf. Sci. 2018, 21, 93–101. [Google Scholar] [CrossRef]
- Cowie, C.T.; Ding, D.; Rolfe, M.I.; Mayne, D.J.; Jalaludin, B.; Bauman, A.; Morgan, G.G. Neighbourhood walkability, road density and socio-economic status in Sydney, Australia. Environ. Health 2016, 15, 58. [Google Scholar] [CrossRef]
- Zhang, P.; Kohli, D.; Sun, Q.Q.; Zhang, Y.X.; Liu, S.X.; Sun, D.F. Remote sensing modeling of urban density dynamics across 36 major cities in China: Fresh insights from hierarchical urbanized space. Landsc. Urban Plan. 2020, 203, 103896. [Google Scholar] [CrossRef]
- Li, J.G.; Li, J.W.; Yuan, Y.Z.; Li, G.F. Spatiotemporal distribution characteristics and mechanism analysis of urban population density: A case of Xi’an, Shaanxi, China. Cities 2019, 86, 62–70. [Google Scholar] [CrossRef]
- Hong, S.F.; Hui, E.C.M.; Lin, Y.Y. Relationships between carbon emissions and urban population size and density, based on geo-urban scaling analysis: A multi-carbon source empirical study. Urban Clim. 2022, 46, 101337. [Google Scholar] [CrossRef]
- Lee, S.; Lee, B. The influence of urban form on GHG emissions in the US household sector. Energy Policy 2014, 68, 534–549. [Google Scholar] [CrossRef]
- Li, C.S.; Song, Y.; Kaza, N. Urban form and household electricity consumption: A multilevel study. Energy Build. 2018, 158, 181–193. [Google Scholar] [CrossRef]
- Zhang, Z.; Xiao, Y.X.; Luo, X.; Zhou, M. Urban human activity density spatiotemporal variations and the relationship with geographical factors: An exploratory Baidu heatmaps-based analysis of Wuhan, China. Growth Chang. 2020, 51, 505–529. [Google Scholar] [CrossRef]
- Russo, F.; Rindone, C. Smart City for Sustainable Development: Applied Processes from SUMP to MaaS at European Level. Appl. Sci. 2023, 13, 1773. [Google Scholar] [CrossRef]
- Wu, H.Y.; Yan, W.Q.; Zheng, X.J.; Zhou, L.; Ma, J.S.; Liu, L.; Meng, Y. Carbon-Emission Density of Crop Production in China: Spatiotemporal Characteristics, Regional Disparities, and Convergence. Agriculture 2023, 13, 951. [Google Scholar] [CrossRef]
- Dong, F.; Li, J.Y.; Zhang, Y.J.; Wang, Y. Drivers Analysis of CO2 Emissions from the Perspective of Carbon Density: The Case of Shandong Province, China. Int. J. Environ. Res. Public Health 2018, 15, 1762. [Google Scholar] [CrossRef]
- Kaya, M.C.; Persson, L. A Theory of Gazelle Growth: Competition, Venture Capital Finance and Policy. N. Am. J. Econ. Financ. 2020, 50, 101019. [Google Scholar] [CrossRef]
- Zhang, P.; Chen, H.; Zhao, K.; Zhao, S.; Li, W. Dynamics, Risk and Management Performance of Urban Real Estate Inventory in Yangtze River Delta. Buildings 2022, 12, 2140. [Google Scholar] [CrossRef]
- Zhao, S.; Zhao, K.; Yan, Y.; Zhu, K.; Guan, C. Spatio-Temporal Evolution Characteristics and Influencing Factors of Urban Service-Industry Land in China. Land 2022, 11, 13. [Google Scholar] [CrossRef]
- Li, W.; Zhang, P.; Zhao, K.; Chen, H.; Zhao, S. The Evolution Model of and Factors Influencing Digital Villages: Evidence from Guangxi, China. Agriculture 2023, 13, 659. [Google Scholar] [CrossRef]
- Ren, J.M.; Zheng, C.R.Y.; Guo, F.Y.; Zhao, H.B.; Ma, S.; Cheng, Y. Spatial Differentiation of Digital Rural Development and Influencing Factors in the Yellow River Basin, China. Int. J. Environ. Res. Public Health 2022, 19, 16111. [Google Scholar] [CrossRef]
- Ma, Y.; Zhang, P.; Zhao, K.; Zhou, Y.; Zhao, S. A Dynamic Performance and Differentiation Management Policy for Urban Construction Land Use Change in Gansu, China. Land 2022, 11, 942. [Google Scholar] [CrossRef]
- Zhao, S.; Zhang, C.; Qi, J. The Key Factors Driving the Development of New Towns by Mother Cities and Regions: Evidence from China. ISPRS Int. J. Geo-Inf. 2021, 10, 223. [Google Scholar] [CrossRef]
- Zhao, S.; Li, W.; Zhao, K.; Zhang, P. Change Characteristics and Multilevel Influencing Factors of Real Estate Inventory—Case Studies from 35 Key Cities in China. Land 2021, 10, 928. [Google Scholar] [CrossRef]
- Wang, J.F.; Hu, Y. Environmental health risk detection with GeogDetector. Environ. Model. Softw. 2012, 33, 114–115. [Google Scholar] [CrossRef]
- Li, L.; Zhao, K.; Wang, X.; Zhao, S.; Liu, X.; Li, W. Spatio-Temporal Evolution and Driving Mechanism of Urbanization in Small Cities: Case Study from Guangxi. Land 2022, 11, 415. [Google Scholar] [CrossRef]
- Zhao, S.; Yan, Y.; Han, J. Industrial Land Change in Chinese Silk Road Cities and Its Influence on Environments. Land 2021, 10, 806. [Google Scholar] [CrossRef]
- Chen, H.; Zhao, S.; Zhang, P.; Zhou, Y.; Li, K. Dynamics and Driving Mechanism of Real Estate in China’s Small Cities: A Case Study of Gansu Province. Buildings 2022, 12, 1512. [Google Scholar] [CrossRef]
- Yang, X.; Li, W.; Zhang, P.; Chen, H.; Lai, M.; Zhao, S. The Dynamics and Driving Mechanisms of Rural Revitalization in Western China. Agriculture 2023, 13, 1448. [Google Scholar] [CrossRef]
- Dehdar, F.; Silva, N.; Fuinhas, J.A.; Koengkan, M.; Nazeer, N. The Impact of Technology and Government Policies on OECD Carbon Dioxide Emissions. Energies 2022, 15, 8486. [Google Scholar] [CrossRef]
- Li, W.; Wang, M.; Zhao, S. The Spatio-Temporal Dynamics, Driving Mechanism, and Management Strategies for International Students in China under the Background of the Belt and Road Initiatives. ISPRS Int. J. Geo-Inf. 2023, 12, 405. [Google Scholar] [CrossRef]
- Liang, S.; Zhao, J.F.; He, S.M.; Xu, Q.Q.; Ma, X. Spatial econometric analysis of carbon emission intensity in Chinese provinces from the perspective of innovation-driven. Environ. Sci. Pollut. Res. 2019, 26, 13878–13895. [Google Scholar] [CrossRef]
- Li, C.S.; Song, Y.; Kaza, N.; Burghardt, R. Explaining Spatial Variations in Residential Energy Usage Intensity in Chicago: The Role of Urban Form and Geomorphometry. J. Plan. Educ. Res. 2019, 43, 317–331. [Google Scholar] [CrossRef]
- Zhang, P.; Li, W.; Zhao, K.; Zhao, S. Spatial Pattern and Driving Mechanism of Urban–Rural Income Gap in Gansu Province of China. Land 2021, 10, 1002. Available online: https://www.mdpi.com/2073-445X/10/10/1002 (accessed on 15 May 2024).
- Whittemore, A.H.; BenDor, T.K. Rhetorical Framing in Planning: An Empirical Investigation of How Planners Discuss Density. J. Plan. Educ. Res. 2021, 41, 48–61. [Google Scholar] [CrossRef]
- Hooper, M. Flatulence, Filth, and Urban Form: Do Primes for Hygiene Influence Perceptions of Urban Density? J. Plan. Educ. Res. 2022, 42, 185–198. [Google Scholar] [CrossRef]
- Herdt, T.; Jonkman, A.R. The acceptance of density: Conflicts of public and private interests in public debate on urban densification. Cities 2023, 140, 104451. [Google Scholar] [CrossRef]
- Moos, M. The Velocity of Density: Can We Build More Sustainable Cities Fast Enough? Sustainability 2017, 9, 2326. [Google Scholar] [CrossRef]
- Schorcht, M.; Jehling, M.; Kruger, T. Where are cities under pressure?—An indicator for measuring the impact of building changes on urban density. Ecol. Indic. 2023, 149, 110142. [Google Scholar] [CrossRef]
- Tabasi, S.F.; Rafizadeh, H.R.; Garmaroudi, A.A.; Banihashemi, S. Optimizing urban layouts through computational generative design: Density distribution and shape optimization. Archit. Eng. Des. Manag. 2023. [Google Scholar] [CrossRef]
- Fan, F.; Dai, S.Z.; Yang, B.; Ke, H.Q. Urban density, directed technological change, and carbon intensity: An empirical study based on Chinese cities. Technol. Soc. 2023, 72, 102151. [Google Scholar] [CrossRef]
- Hong, A.Y.; Chakrabarti, S. Compact living or policy inaction? Effects of urban density and lockdown on the Covid-19 outbreak in the US. Urban Stud. 2022, 60, 1588–1609. [Google Scholar] [CrossRef]
- Baics, G.; Meisterlin, L. Zoning Before Zoning: Land Use and Density in Mid-Nineteenth-Century New York City. Ann. Am. Assoc. Geogr. 2016, 106, 1152–1175. [Google Scholar] [CrossRef]
- Cirianni, F.; Panuccio, P.; Rindone, C. A Comparison of Urban Planning Systems Between the UK And Italy: Commercial Development and City Logistic Plan. Urban Transp. XIX 2013, 130, 785–797. [Google Scholar] [CrossRef]
- Ma, M.Y.; Rozema, J.; Gianoli, A.; Zhang, W.S. The Impacts of City Size and Density on CO2 Emissions: Evidence from the Yangtze River Delta Urban Agglomeration. Appl. Spat. Anal. Policy 2022, 15, 529–555. [Google Scholar] [CrossRef]
- Yi, Y.C.; Wang, Y.J.; Li, Y.Q.; Qi, J. Impact of urban density on carbon emissions in China. Appl. Econ. 2021, 53, 6153–6165. [Google Scholar] [CrossRef]
- Norman, J.; MacLean, H.L.; Kennedy, C.A. Comparing high and low residential density: Life-cycle analysis of energy use and greenhouse gas emissions. J. Urban Plan. Dev. 2006, 132, 10–21. [Google Scholar] [CrossRef]
- Ishii, S.; Tabushi, S.; Aramaki, T.; Hanaki, K. Impact of future urban form on the potential to reduce greenhouse gas emissions from residential, commercial and public buildings in Utsunomiya, Japan. Energy Policy 2010, 38, 4888–4896. [Google Scholar] [CrossRef]
- Derudder, B.; Feng, X.; Shen, W.; Shao, R.; Taylor, P.J. Connections between Asian and European World Cities: Measurement, Analysis, and Evaluation. Land 2022, 11, 1574. [Google Scholar] [CrossRef]
- Wang, Q.Z.; Zhang, Q. Foreign Direct Investment and Carbon Emission Efficiency: The Role of Direct and Indirect Channels. Sustainability 2022, 14, 13484. [Google Scholar] [CrossRef]
- Wang, M.Q.; Zhang, L.Y.; Su, X.; Lei, Y.; Shen, Q.; Wei, W.; Wang, M.H. Assessing the technology impact for industry carbon density reduction in China based on C (3) IAM-Tice. Nat. Hazards 2019, 99, 1455–1468. [Google Scholar] [CrossRef]
- Ghadami, M.; Dittmann, A.; Safarrad, T. Lack of Spatial Approach in Urban Density Policies: The Case of the Master Plan of Tehran. Sustainability 2020, 12, 7285. [Google Scholar] [CrossRef]
- Chokhachian, A.; Perini, K.; Giulini, S.; Auer, T. Urban performance and density: Generative study on interdependencies of urban form and environmental measures. Sustain. Cities Soc. 2020, 53, 101952. [Google Scholar] [CrossRef]

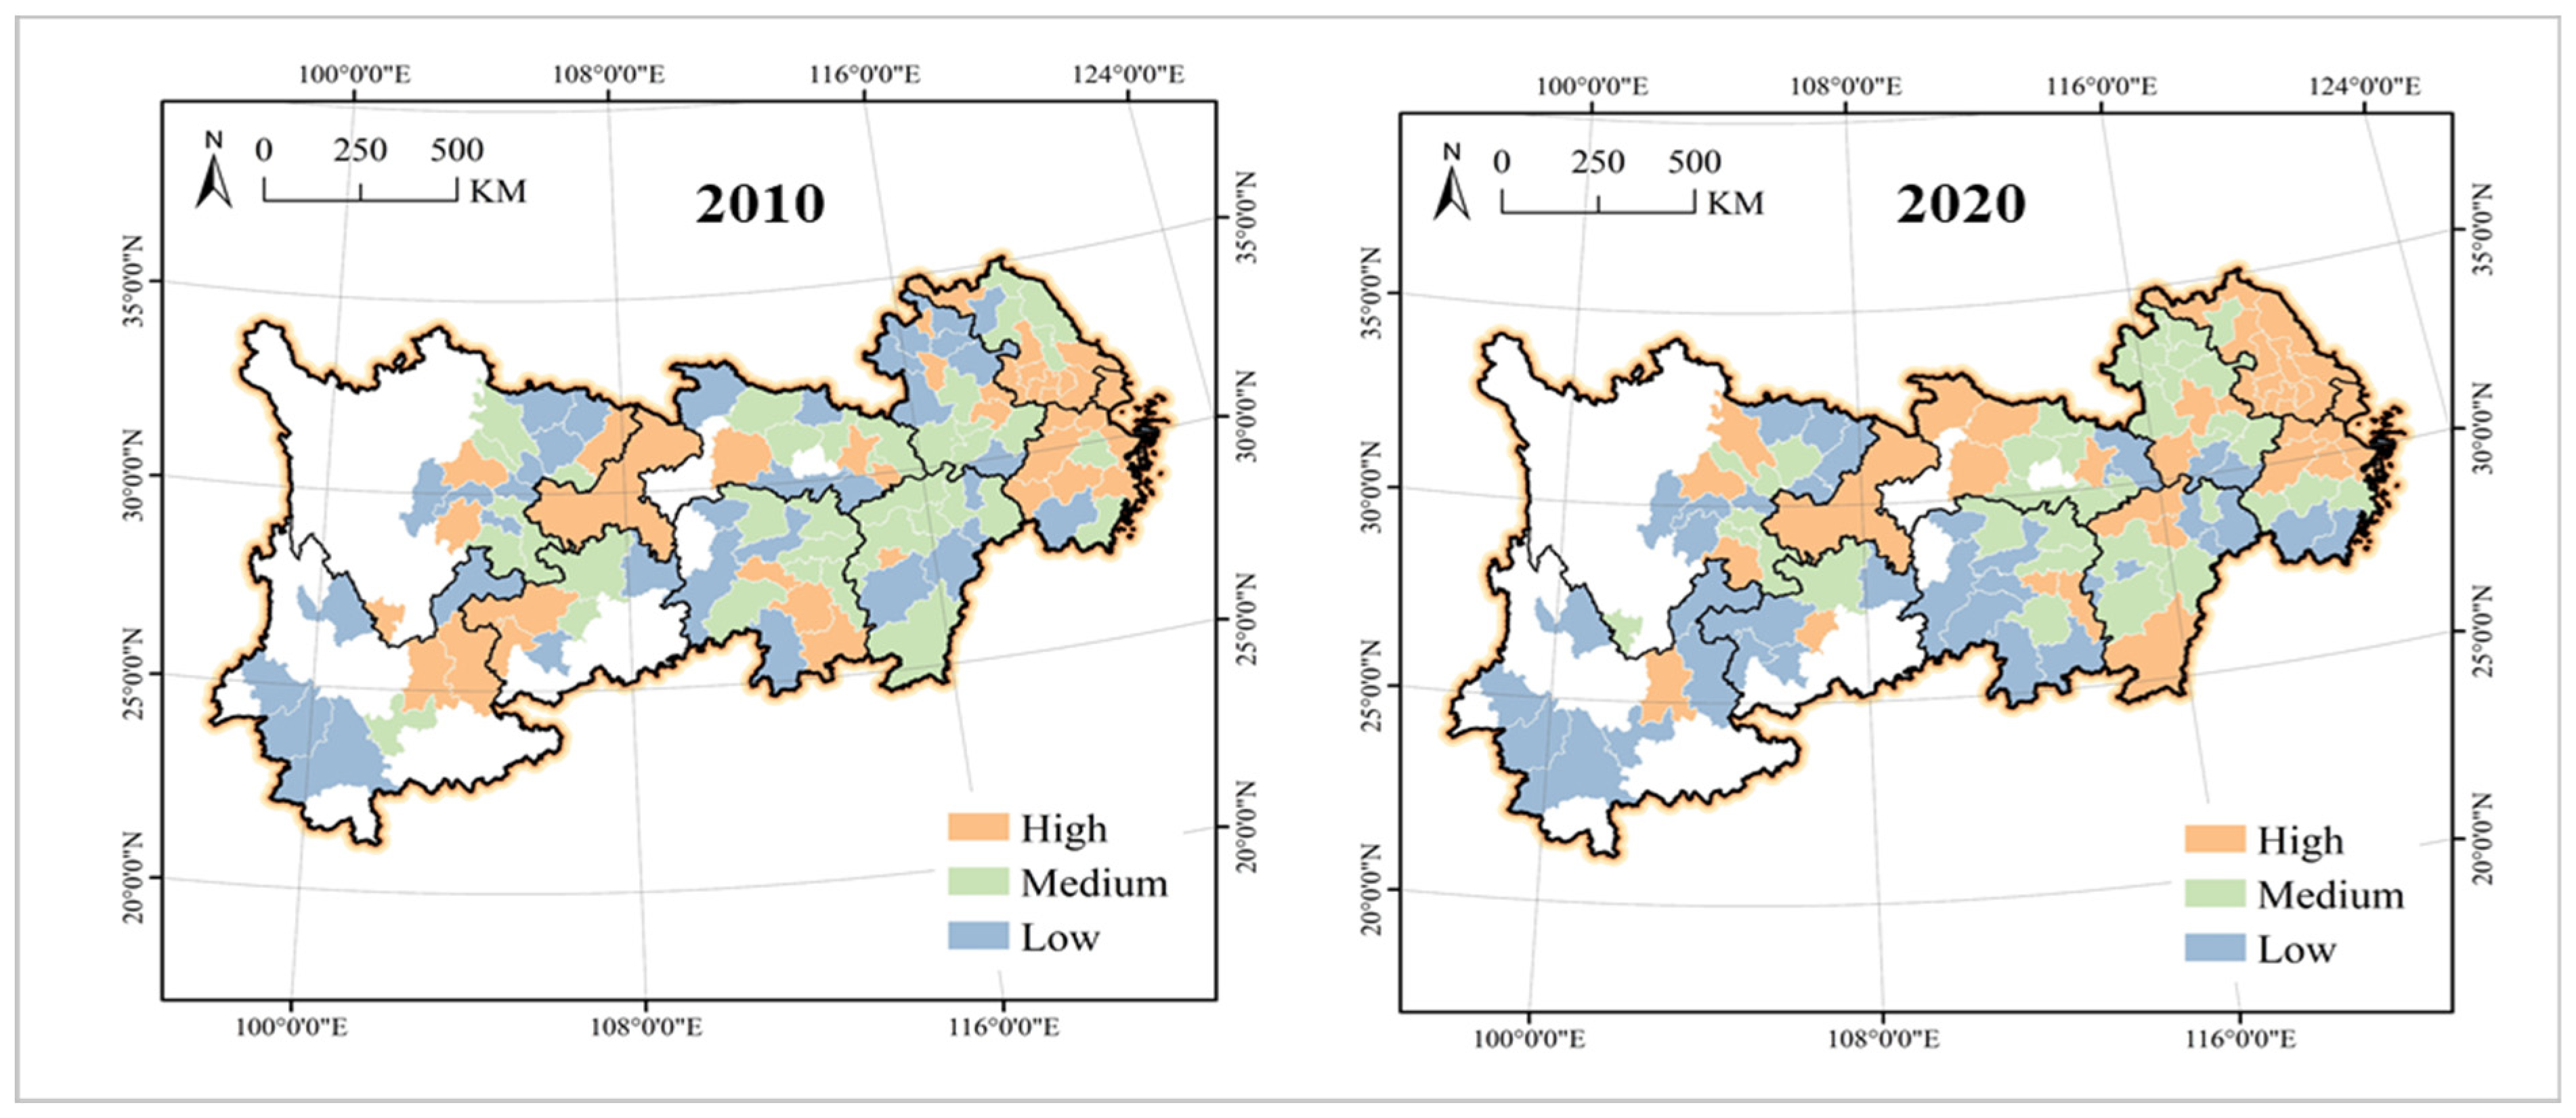
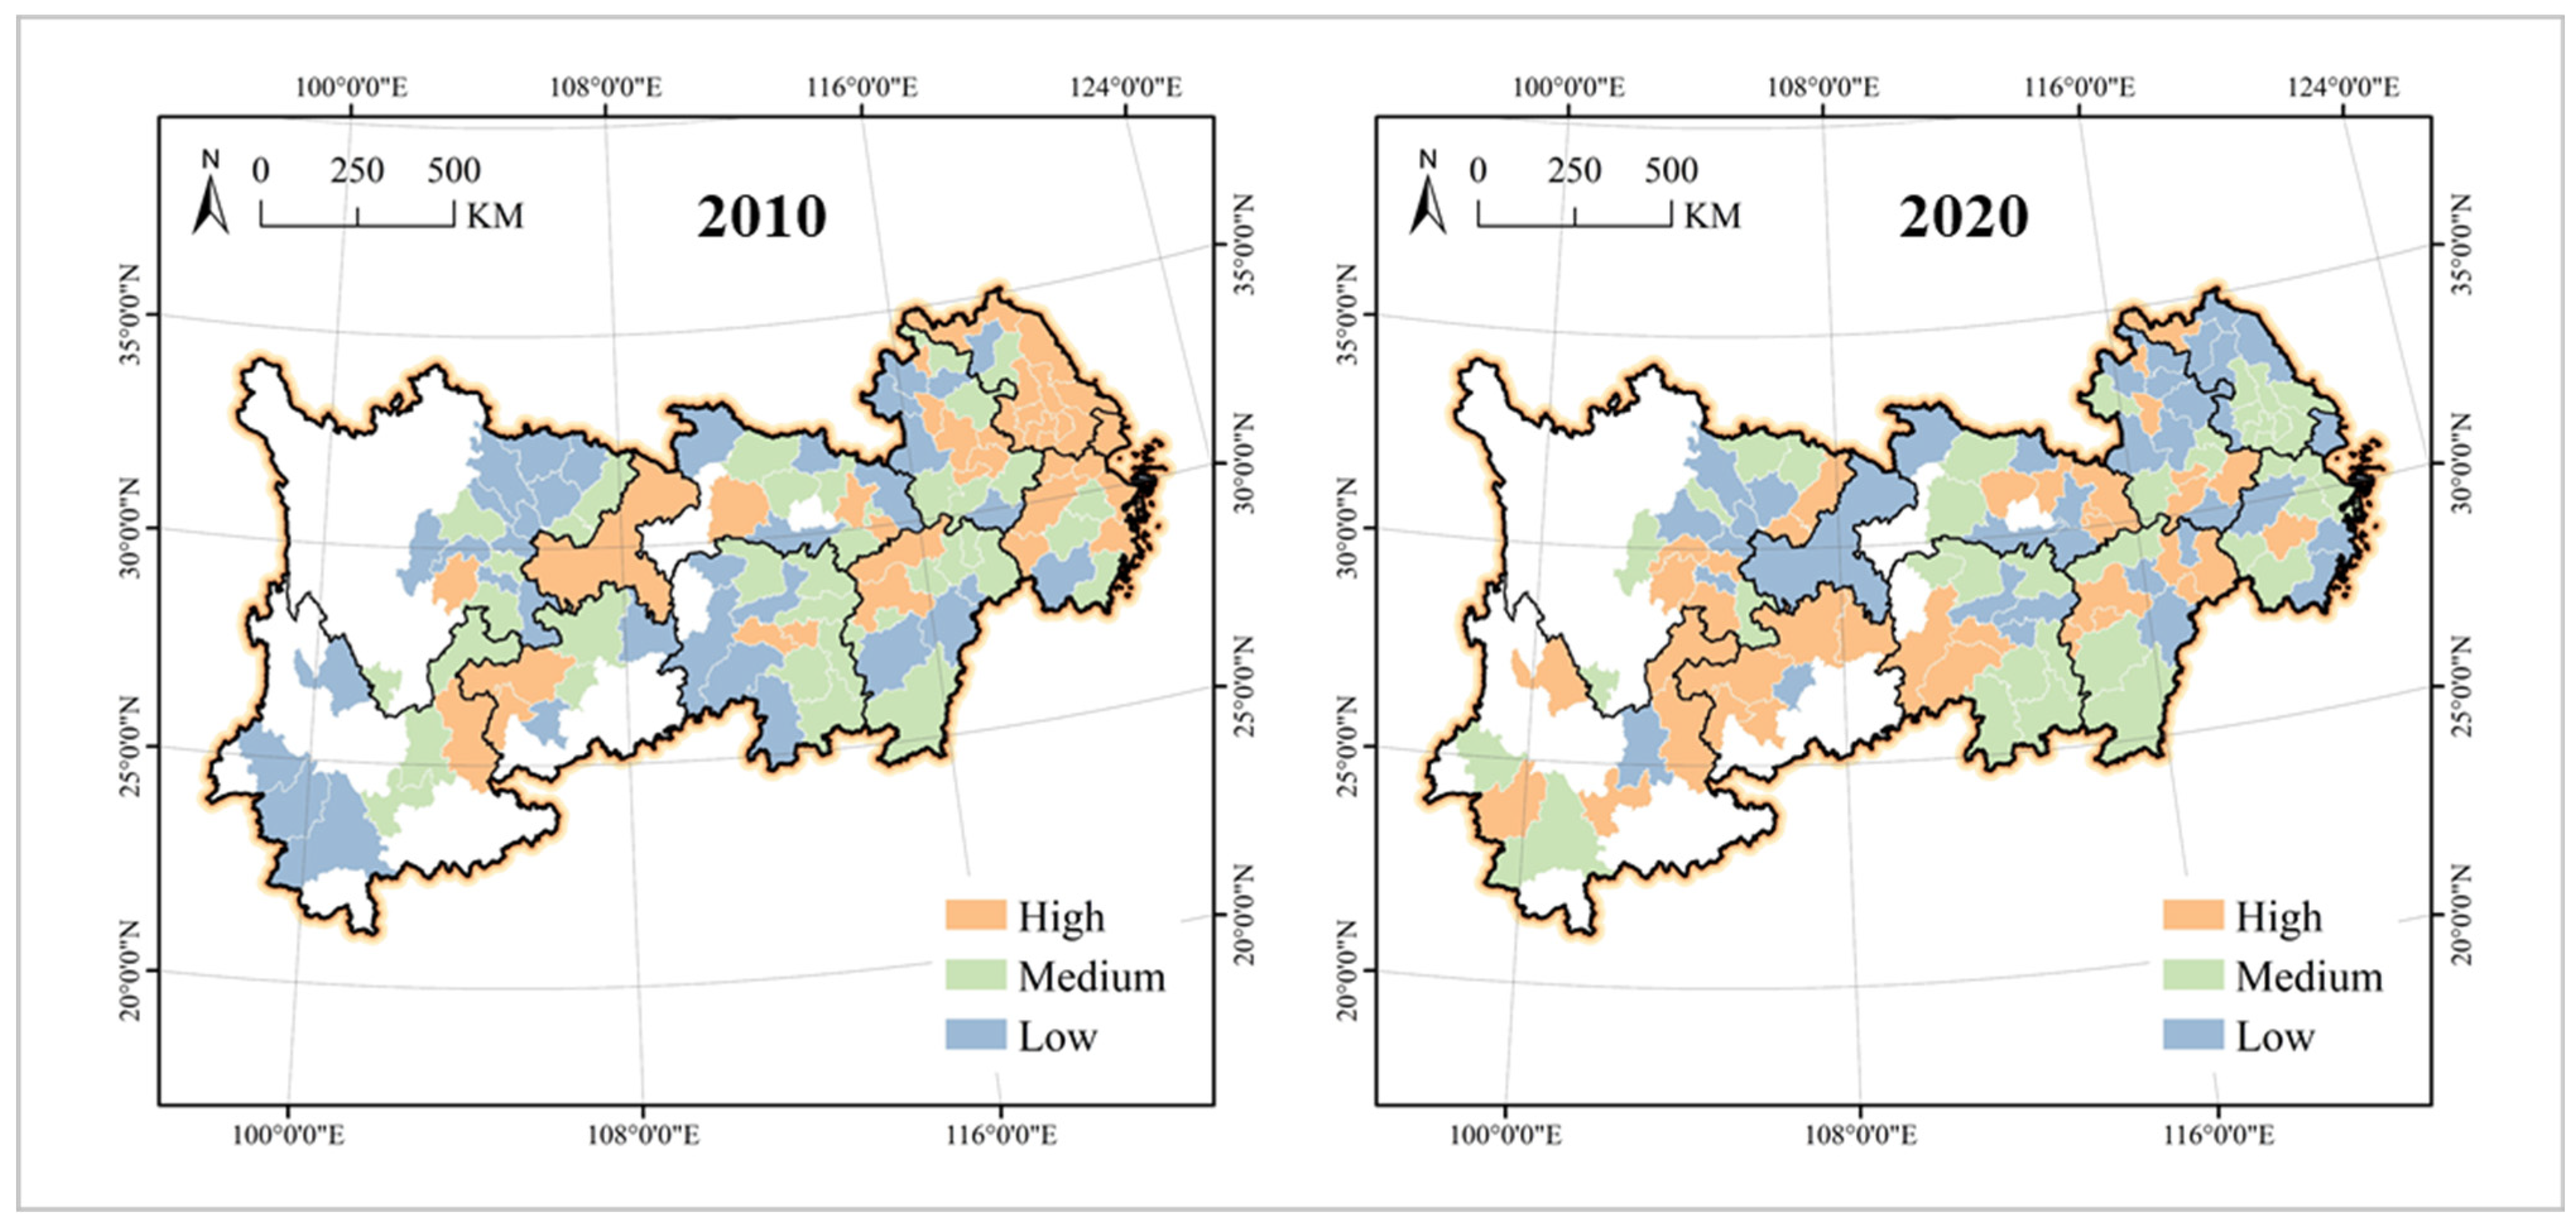
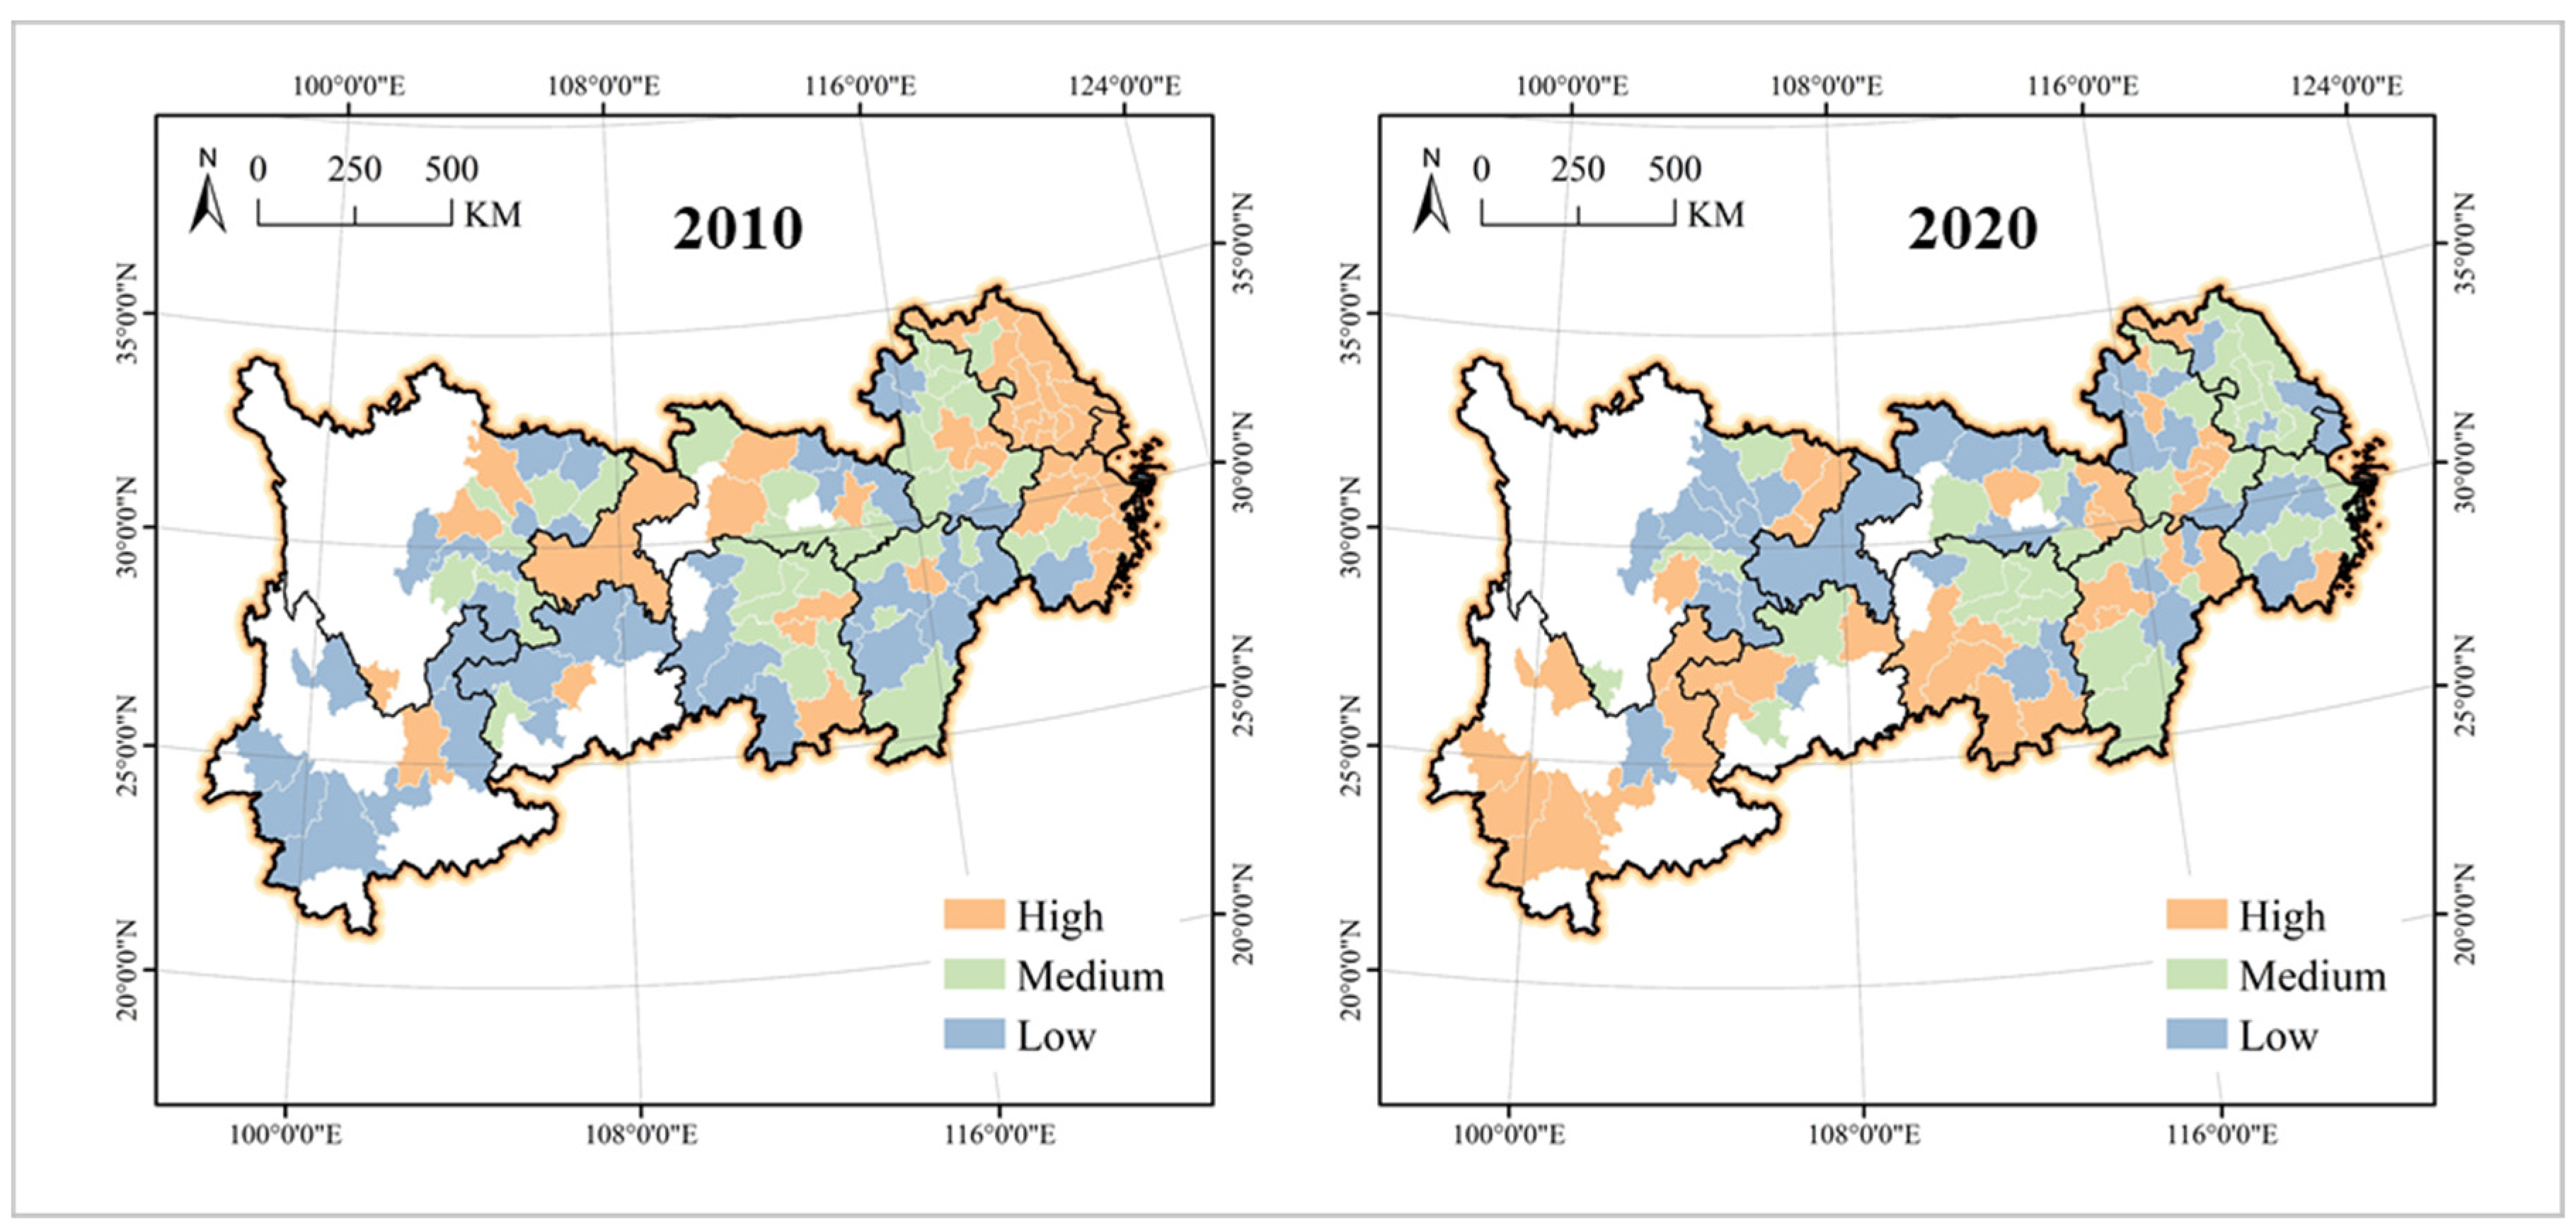
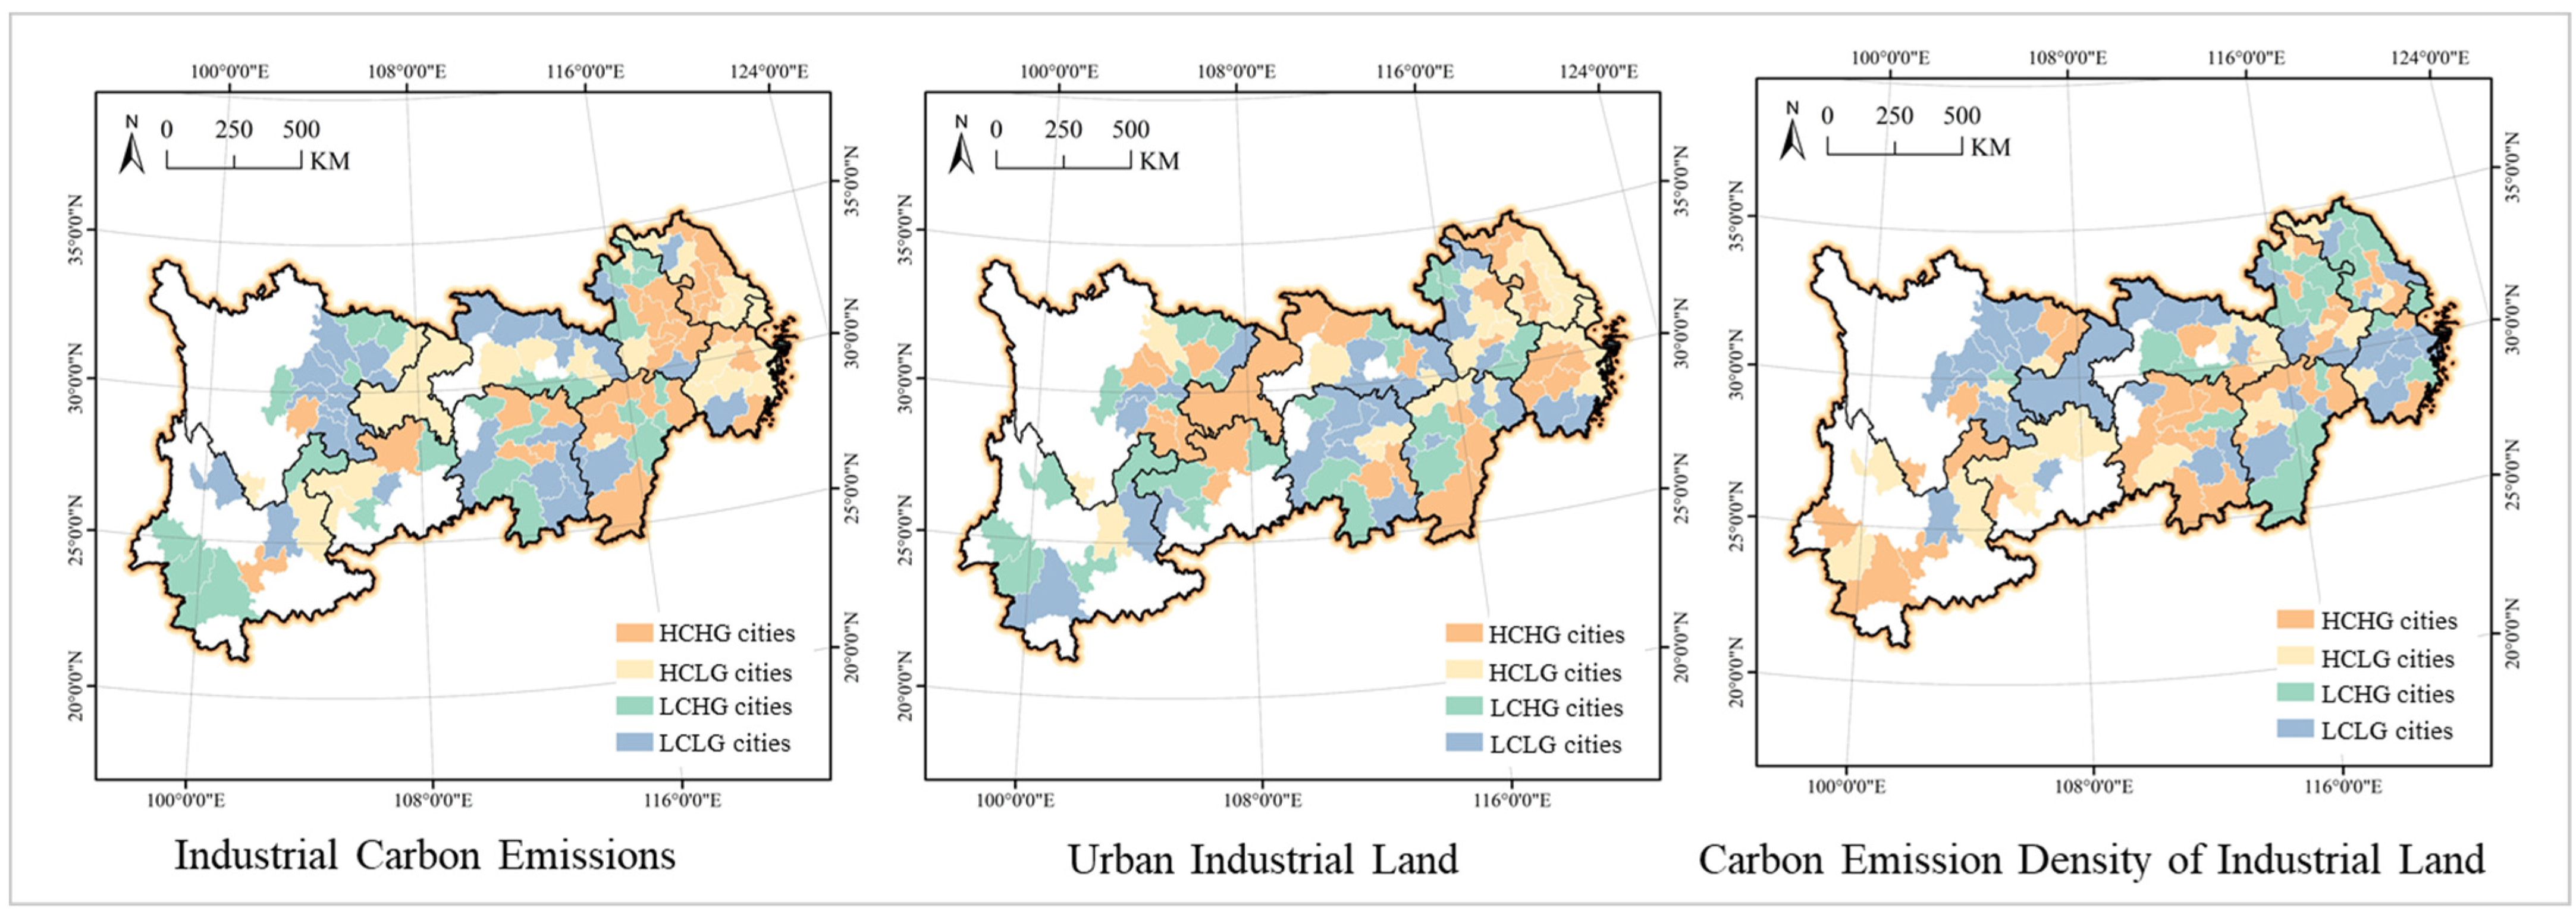
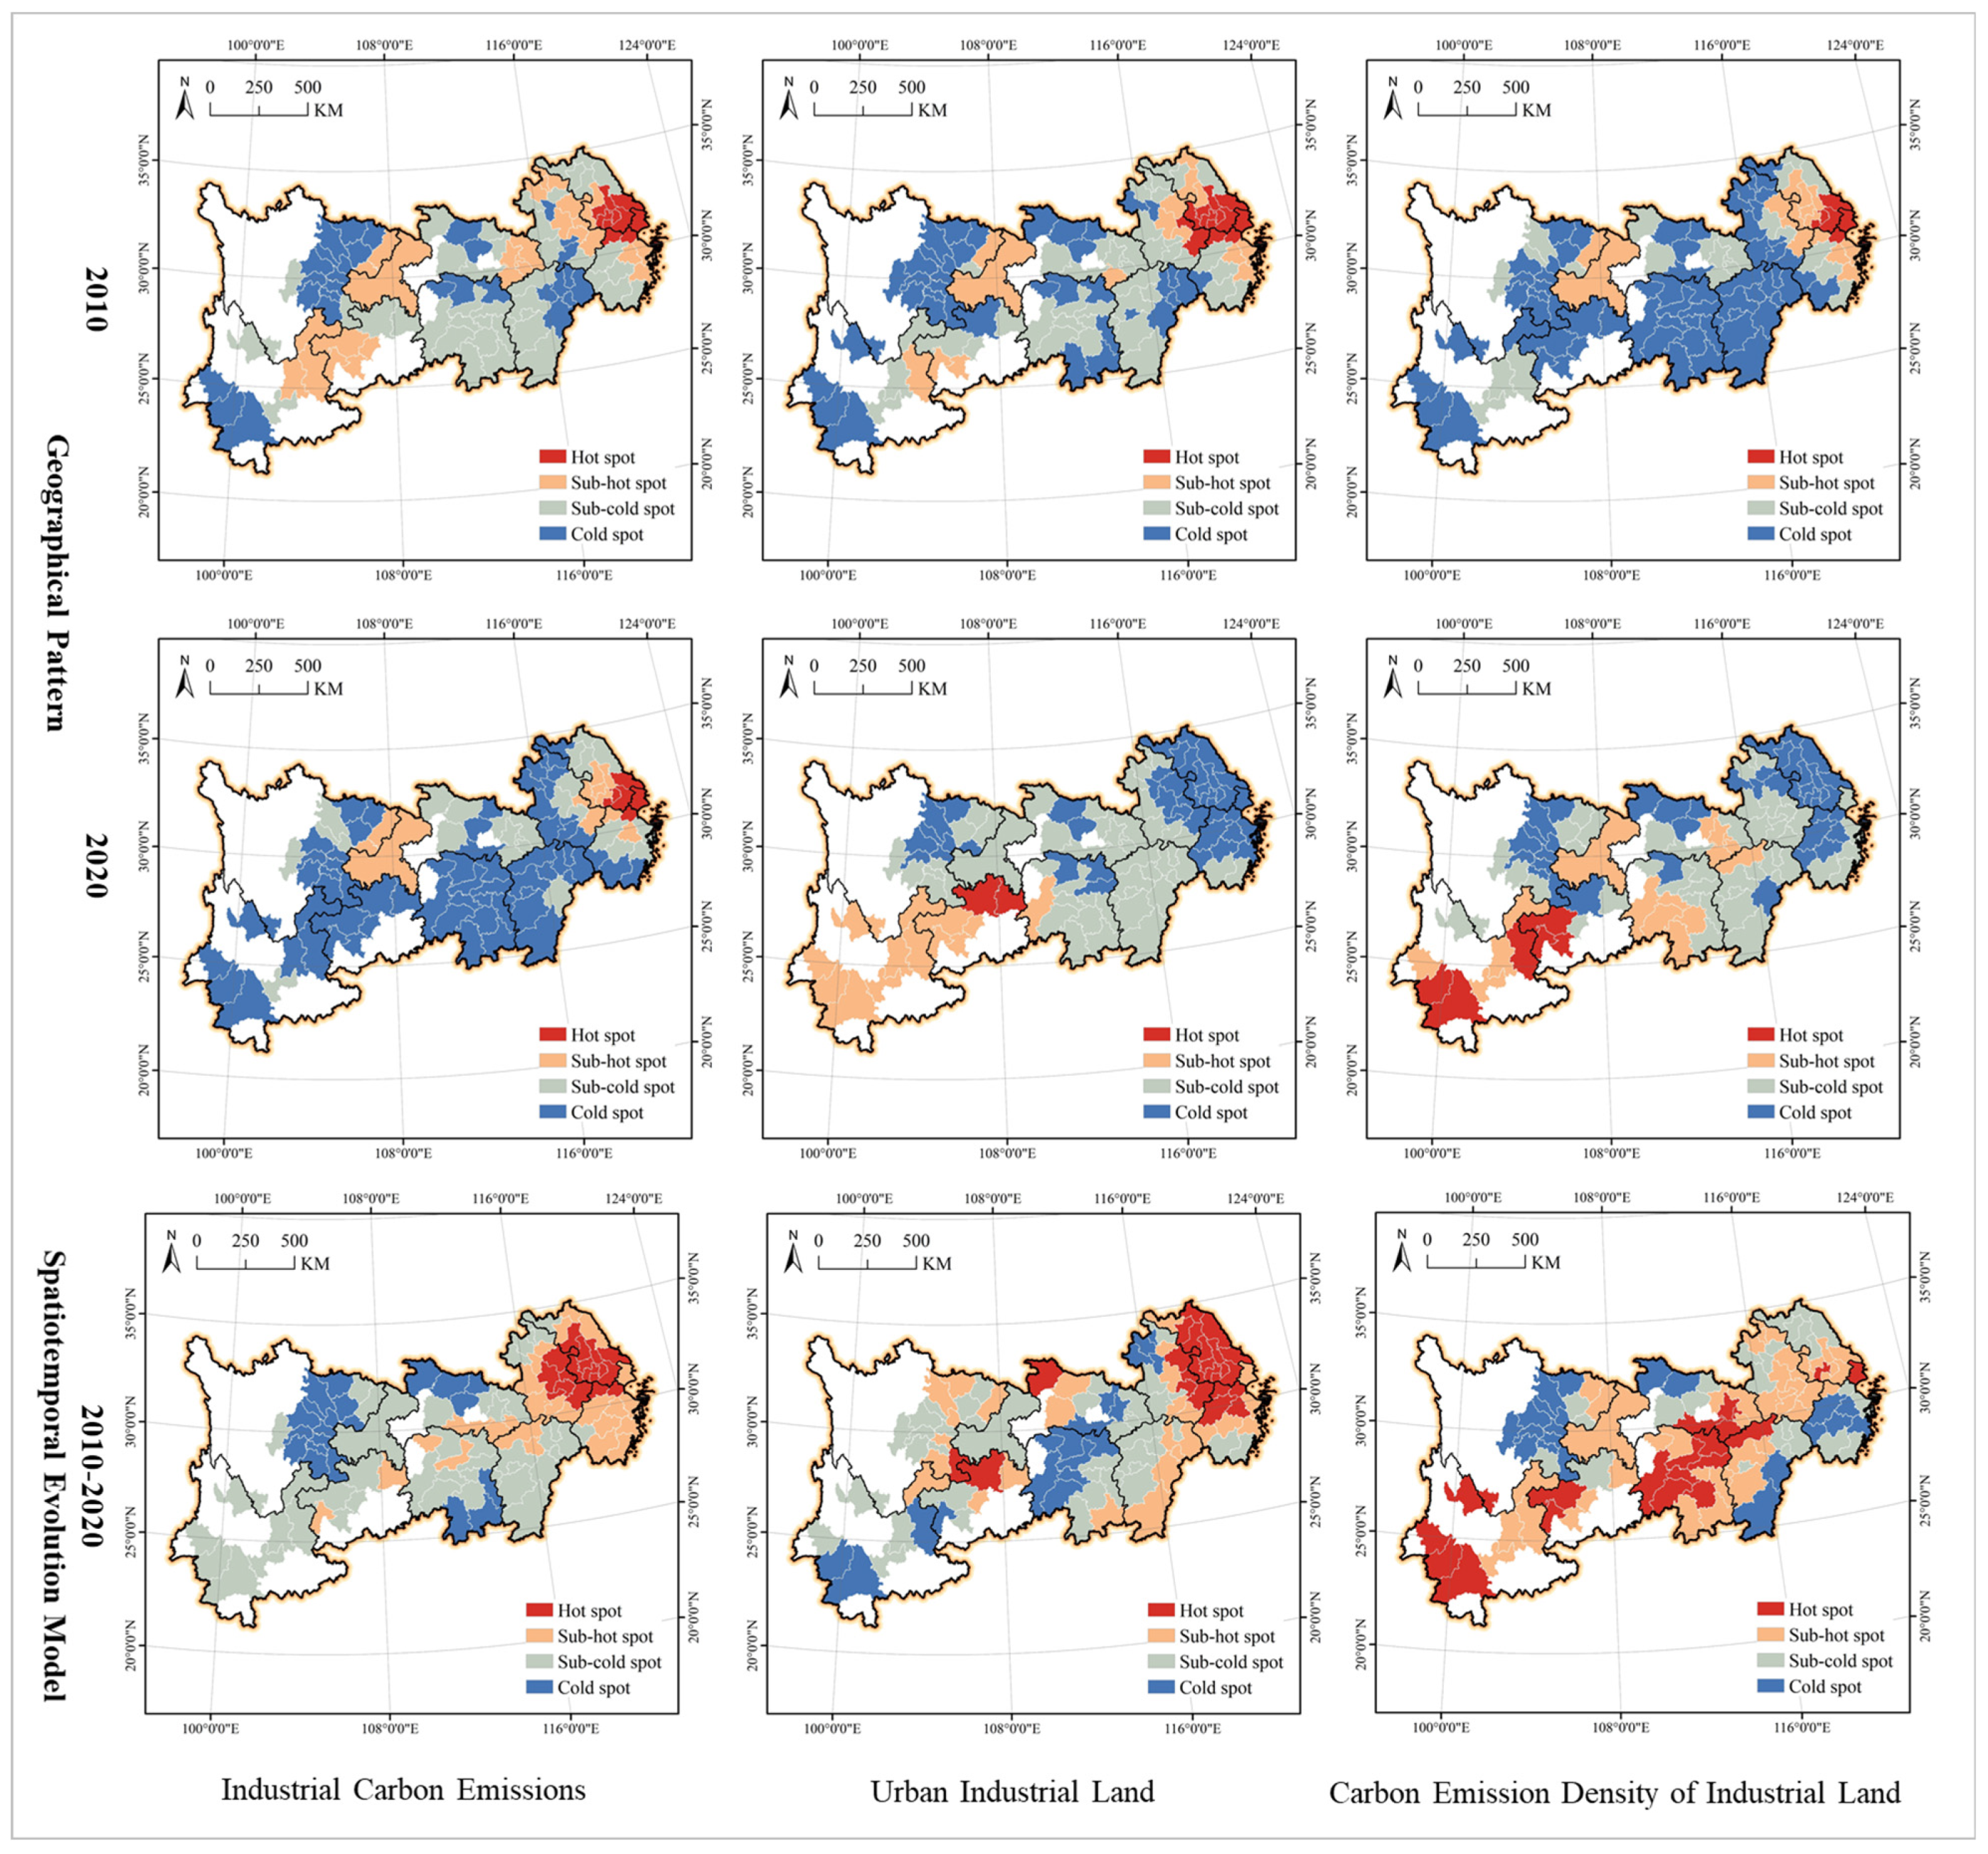
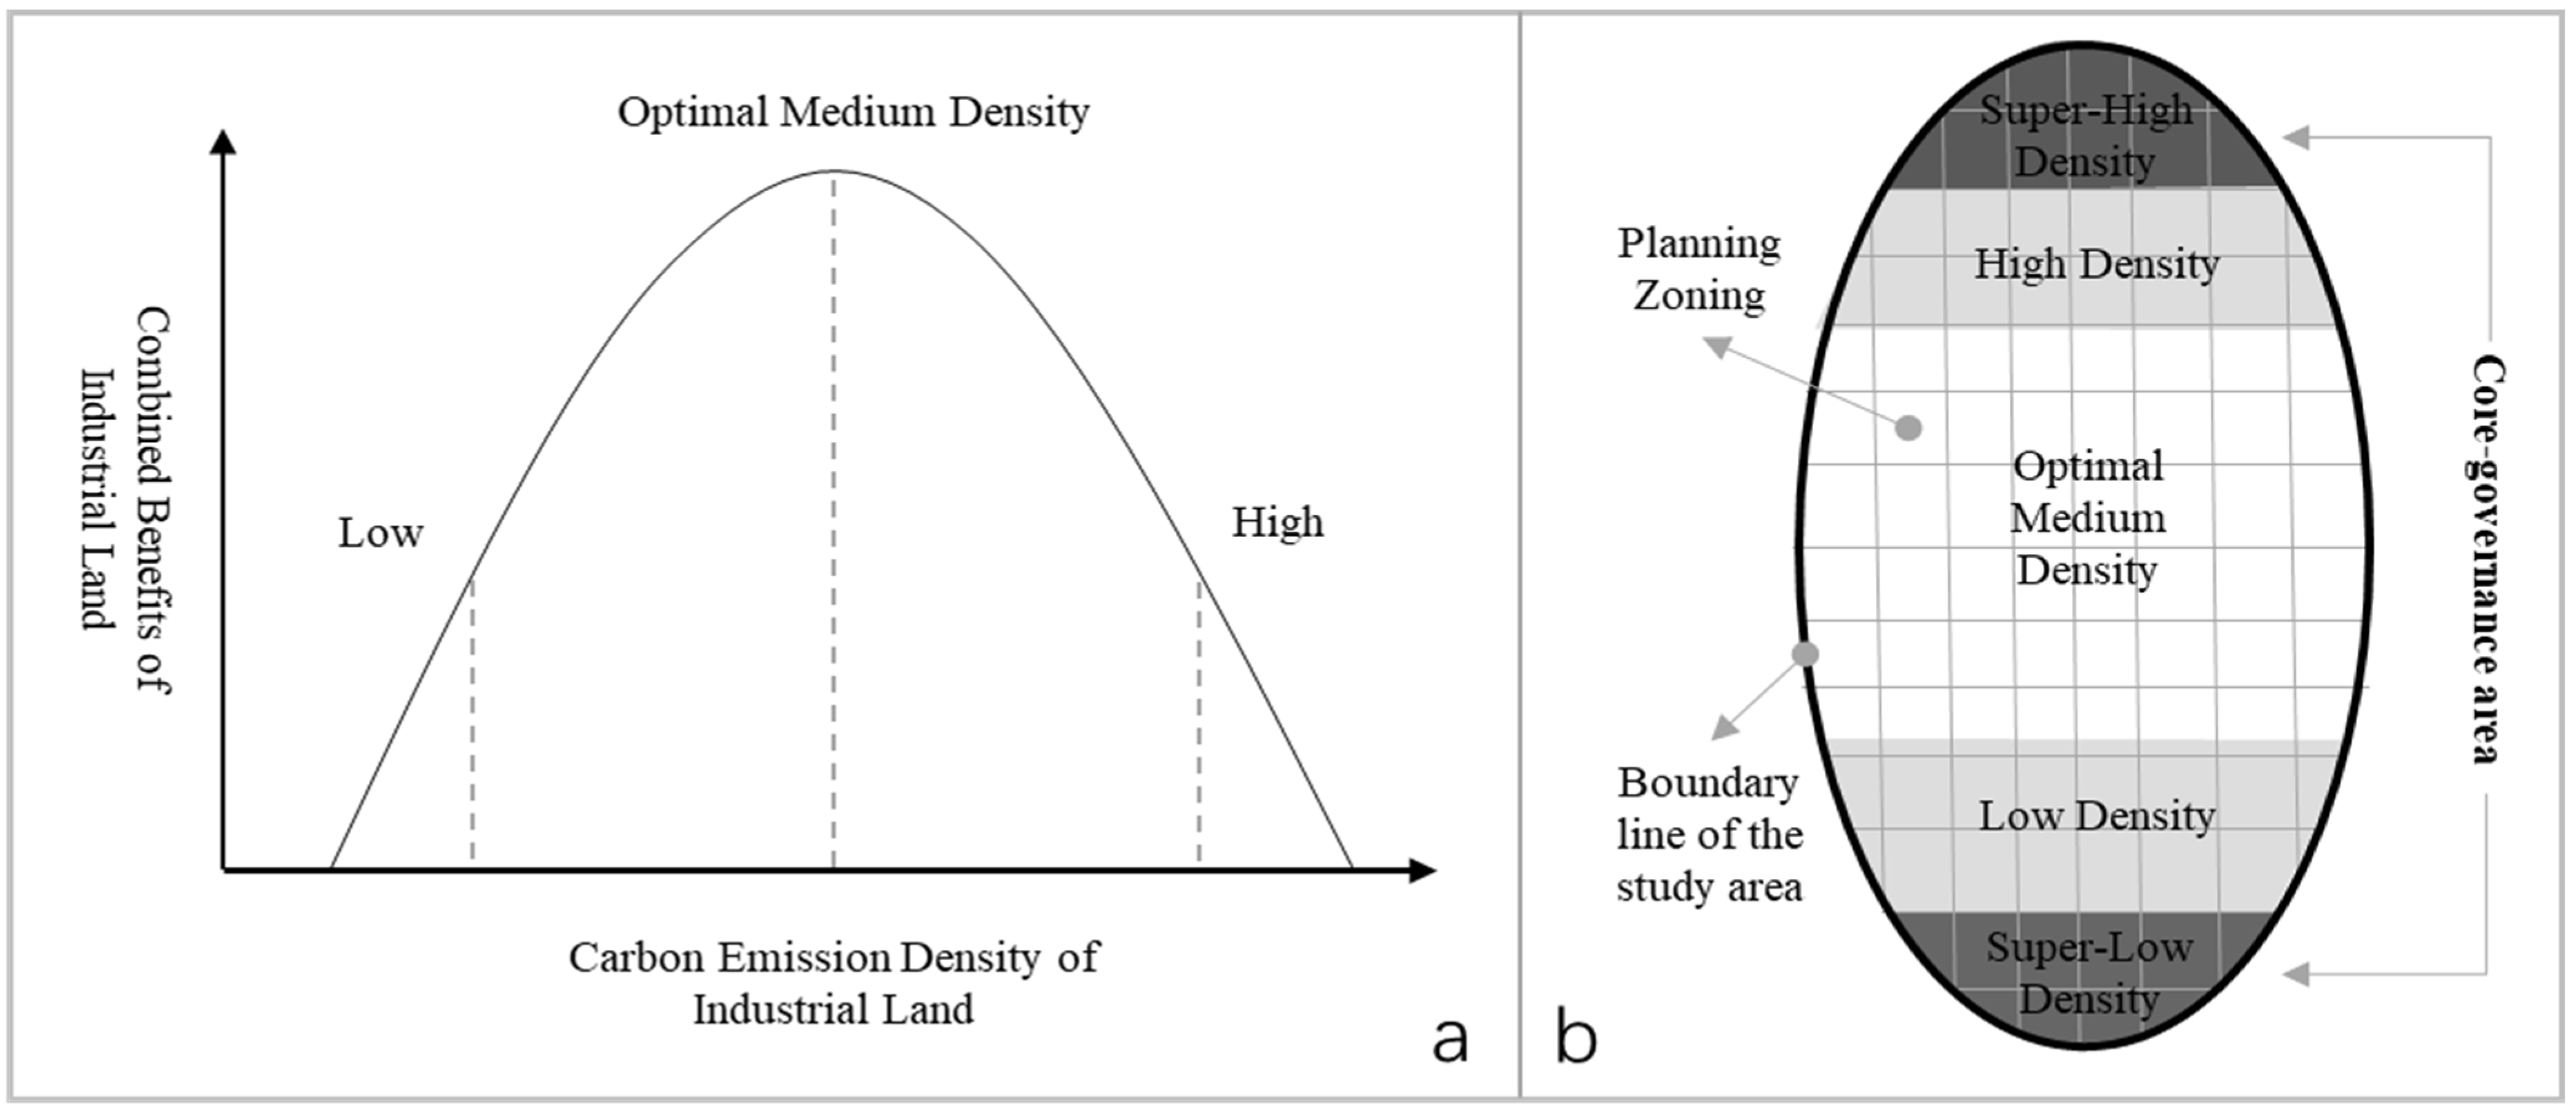
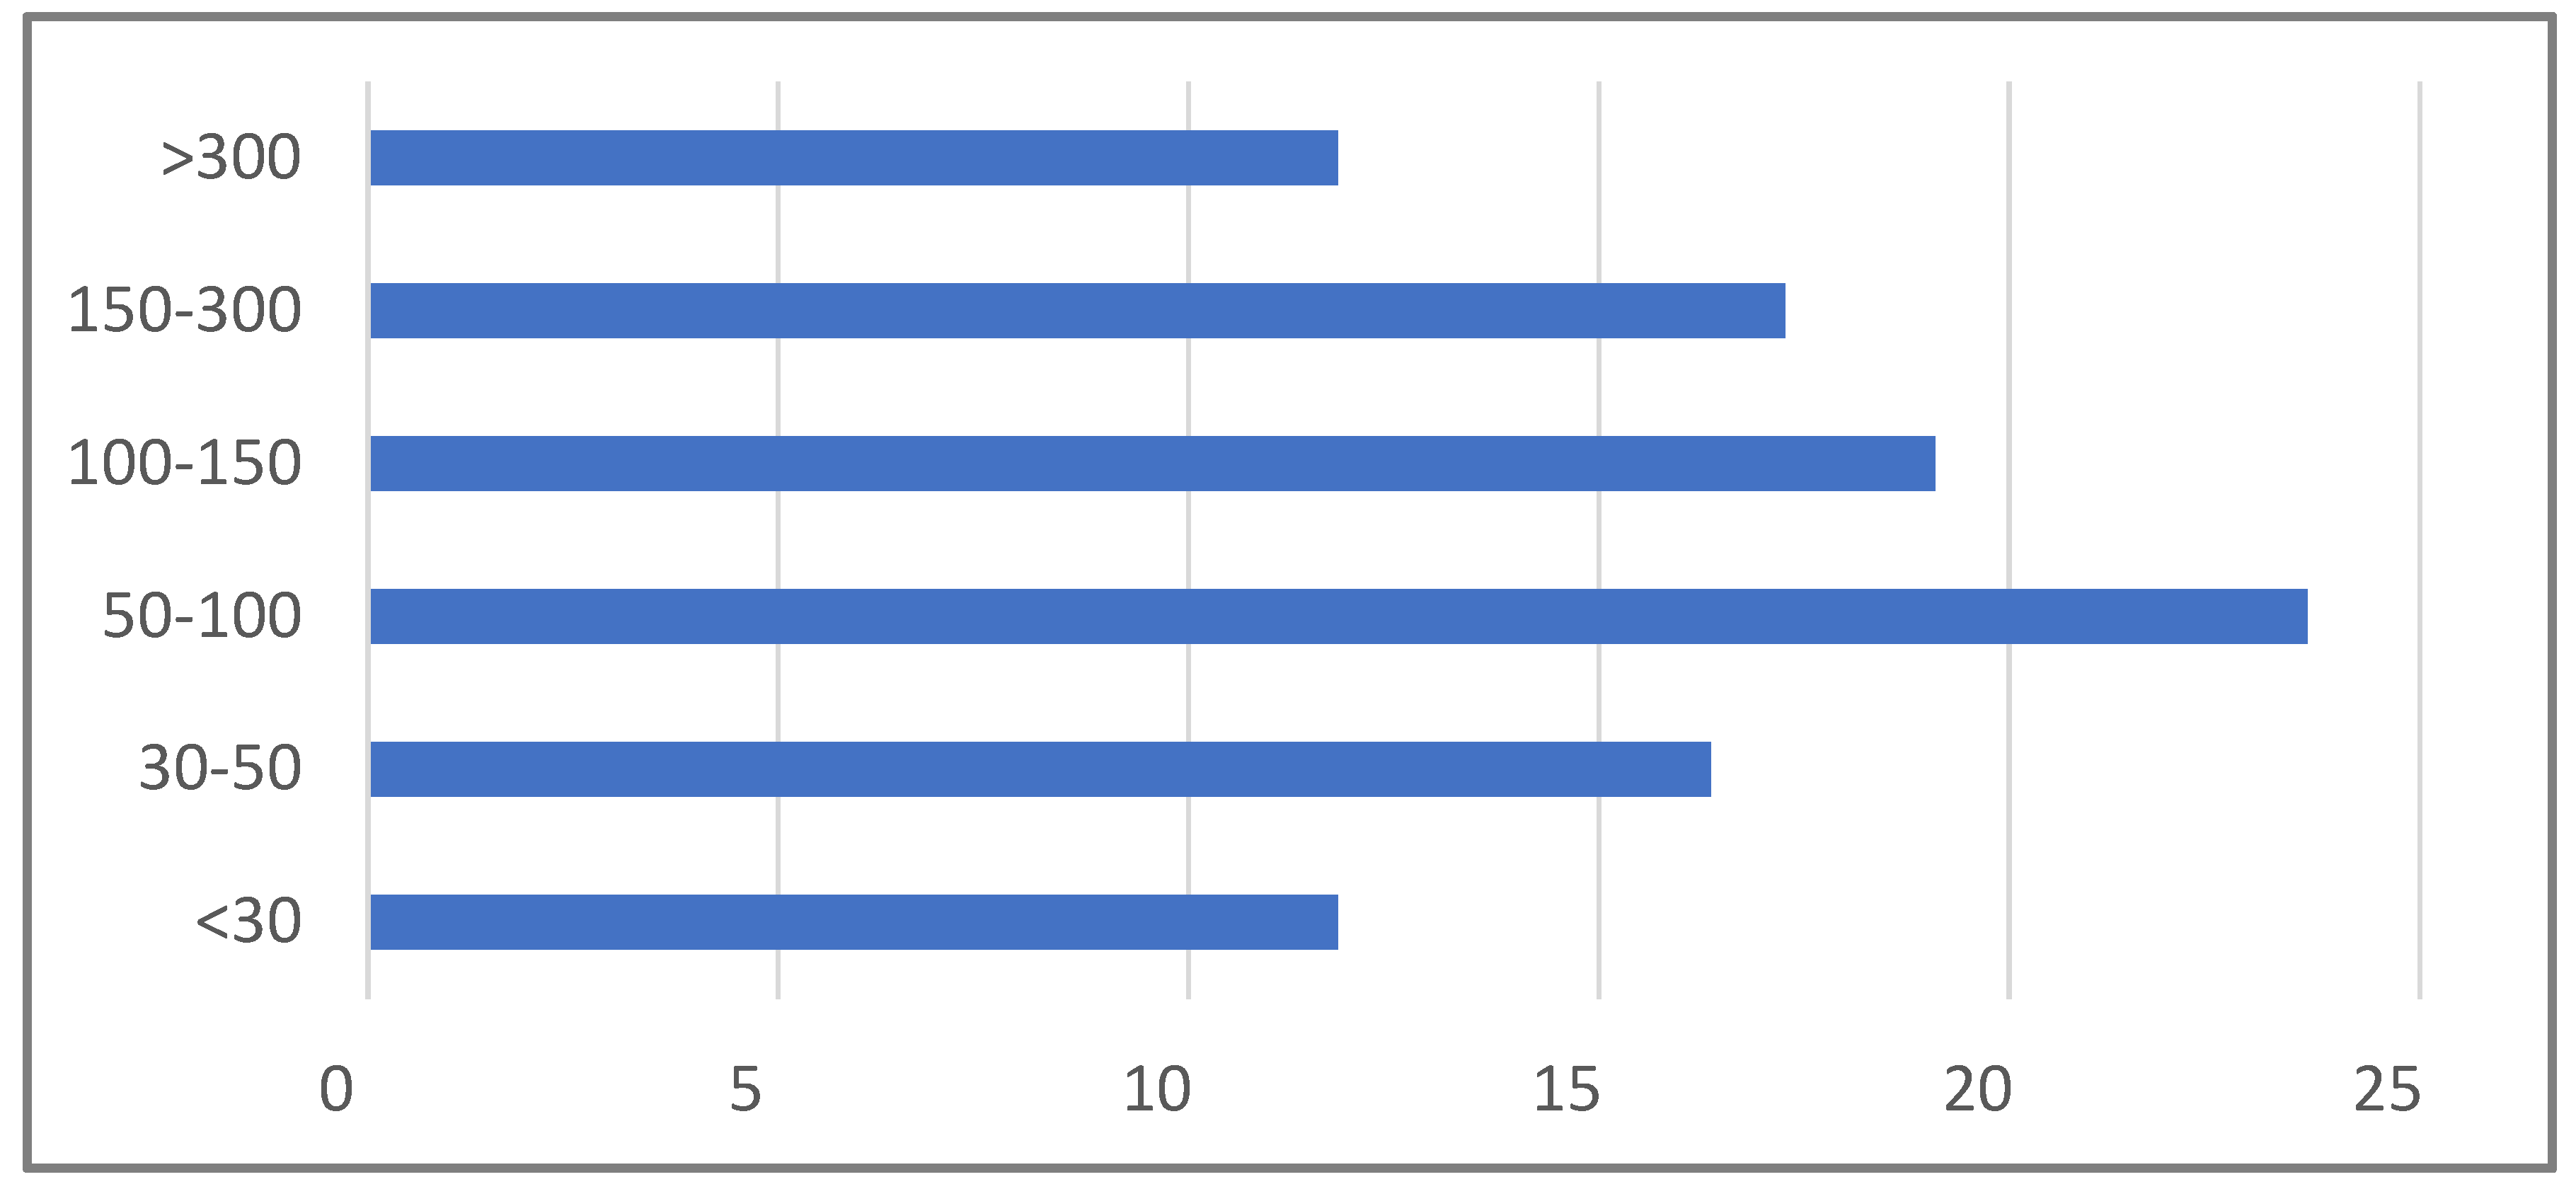
Disclaimer/Publisher’s Note: The statements, opinions and data contained in all publications are solely those of the individual author(s) and contributor(s) and not of MDPI and/or the editor(s). MDPI and/or the editor(s) disclaim responsibility for any injury to people or property resulting from any ideas, methods, instructions or products referred to in the content. |
© 2024 by the authors. Licensee MDPI, Basel, Switzerland. This article is an open access article distributed under the terms and conditions of the Creative Commons Attribution (CC BY) license (https://creativecommons.org/licenses/by/4.0/).