Abstract
Due to extensive soft soil and high human activities, Wuhan is a hotspot for land subsidence. This study used the time-series InSAR to calculate the spatial and temporal distribution map of subsidence in Wuhan and analyze the causes of subsidence. An improved fuzzy analytic hierarchy process (GD-FAHP) was proposed and integrated with the Entropy Weight Method (EWM) to assess the hazard and vulnerability of land subsidence using multiple evaluation factors, thereby deriving the spatial distribution characteristics of subsidence risk in Wuhan. Results indicated the following: (1) Maximum subsidence rates reached −49 mm/a, with the most severe deformation localized in Hongshan District, exhibiting a cumulative displacement of −135 mm. Comparative validation between InSAR results and leveling was conducted, demonstrating the reliability of InSAR monitoring. (2) Areas with frequent urban construction largely coincided with subsidence locations. In addition, the analysis indicated that rainfall and hydrogeological conditions were also correlated with land subsidence. (3) The proposed risk assessment model effectively identified high-risk areas concentrated in central urban zones, particularly the Hongshan and Wuchang Districts. This research establishes a methodological framework for urban hazard mitigation and provides actionable insights for subsidence risk reduction strategies.
1. Introduction
With the increasing frequency of human infrastructure construction activities, a series of destructive geological hazards have been triggered [1]. Land subsidence refers to the downward displacement of the ground surface caused by subsurface soil compaction under combined natural and anthropogenic influences [2]. It has become a common geological disaster due to frequent activities such as groundwater mining and urban construction [3]. Because of the uneven distribution of subsidence in some urban areas, land subsidence has brought great negative impacts into people’s normal life [4,5]. The phenomenon of surface deformation has manifested with varying intensity in multiple Chinese urban centers, as evidenced by geodetic surveys conducted in Beijing, Tianjin, and other northern cities during the past few years [6,7,8]. So, there is an urgent need for time-series subsidence monitoring work and risk assessment in urban areas with ground subsidence hazard potential. Conventional monitoring methods such as leveling surveys and GNSS still exhibit limitations including high costs and challenges in obtaining comprehensive subsidence information [9]. At the same time, InSAR technology has obvious advantages such as large coverage and high temporal and spatial resolution [10,11]. In land subsidence monitoring, time-series InSAR technology has been widely used [12,13], which largely improves the monitoring accuracy. Moreover, Small Baseline Subset Interferometric Synthetic Aperture Radar (SBAS-InSAR) uses shorter spatial baseline interferometric pairs to form interferometric combinations, which reduces the negative impact of spatiotemporal coherence [14]. It is an effective monitoring method for the spatial distribution and spatial and temporal evolution of urban land subsidence [15,16].
Located in central China along the Yangtze River, Wuhan is recognized as a major metropolitan city. With special hydrogeological conditions, land subsidence phenomenon continues to occur [17]. This research summarizes the studies performed by some scholars on land subsidence monitoring in Wuhan using various InSAR technology. Bai [18] utilized TerraSAR images, while Zhou et al. [19] and Zhang et al. [20], basing their work on Sentinel-1A images and RADARSAT images, respectively, and using the SBAS-InSAR method, both investigated the spatial and temporal distribution of subsidence deformation in each time period. It is known that the subsidence in the Houhu area was more serious before 2020. Additionally, there were also the results of the subsidence in Wuhan obtained by fusing multiple data sources [21]. From this research, we learned that the distribution of subsidence in Wuhan is not uniform, and the subsidence area also shifted from the Hankou area to the south of the urban center. Consequently, both the magnitude and spatial extent of subsidence in Wuhan exhibited dynamic changes, warranting further investigation into the synergistic effects of multiple contributing factors. It is worth mentioning that, although there are various InSAR methods for land subsidence research in Wuhan for different areas and periods, the risk of subsidence in different areas of the city and the degree of harm caused by subsidence are unknown. There is a lack of holistic assessment of land subsidence in Wuhan at present. There have been a variety of assessment methods used for urban infrastructure construction [22], buildings [23], and other disaster assessments [24,25,26]. Many scholars have performed research and applications of the land subsidence disaster assessment [27,28]; related assessment methods such as the analytic hierarchy process (AHP) [29], gray clustering method [30], fuzzy mathematical methods [31,32], and EWM [33,34] are relatively mature. AHP is relatively widely used, but the method is insufficient in that the results assessed using a single weight index will have some bias. At this time, people proposed the fuzzy analytic hierarchy process (FAHP) can make up for this deficiency. Compared with the AHP method, FAHP is better for risk assessment level division [35].
The purpose of this study is to extract the land subsidence information of Wuhan and to identify the land subsidence disaster risk areas in Wuhan through the constructed risk assessment model. The research comprised three key components: (1) It monitored the land subsidence in Wuhan by using the land deformation data in large-scale urban areas of Wuhan mapped by Sentinel-1A images from 2020 to 2022. Meanwhile, the accuracy was verified in conjunction with leveling data. (2) It analyzed key driving factors including urban infrastructure development, subway engineering, hydrogeological conditions, and precipitation patterns through coupled anthropogenic-natural system analysis. (3) It developed a comprehensive risk assessment model integrating GD-FAHP and EWM methodologies, where each geofactor serves as a weighted indicator for spatial risk zonation.
2. Materials and Methods
2.1. Research Area
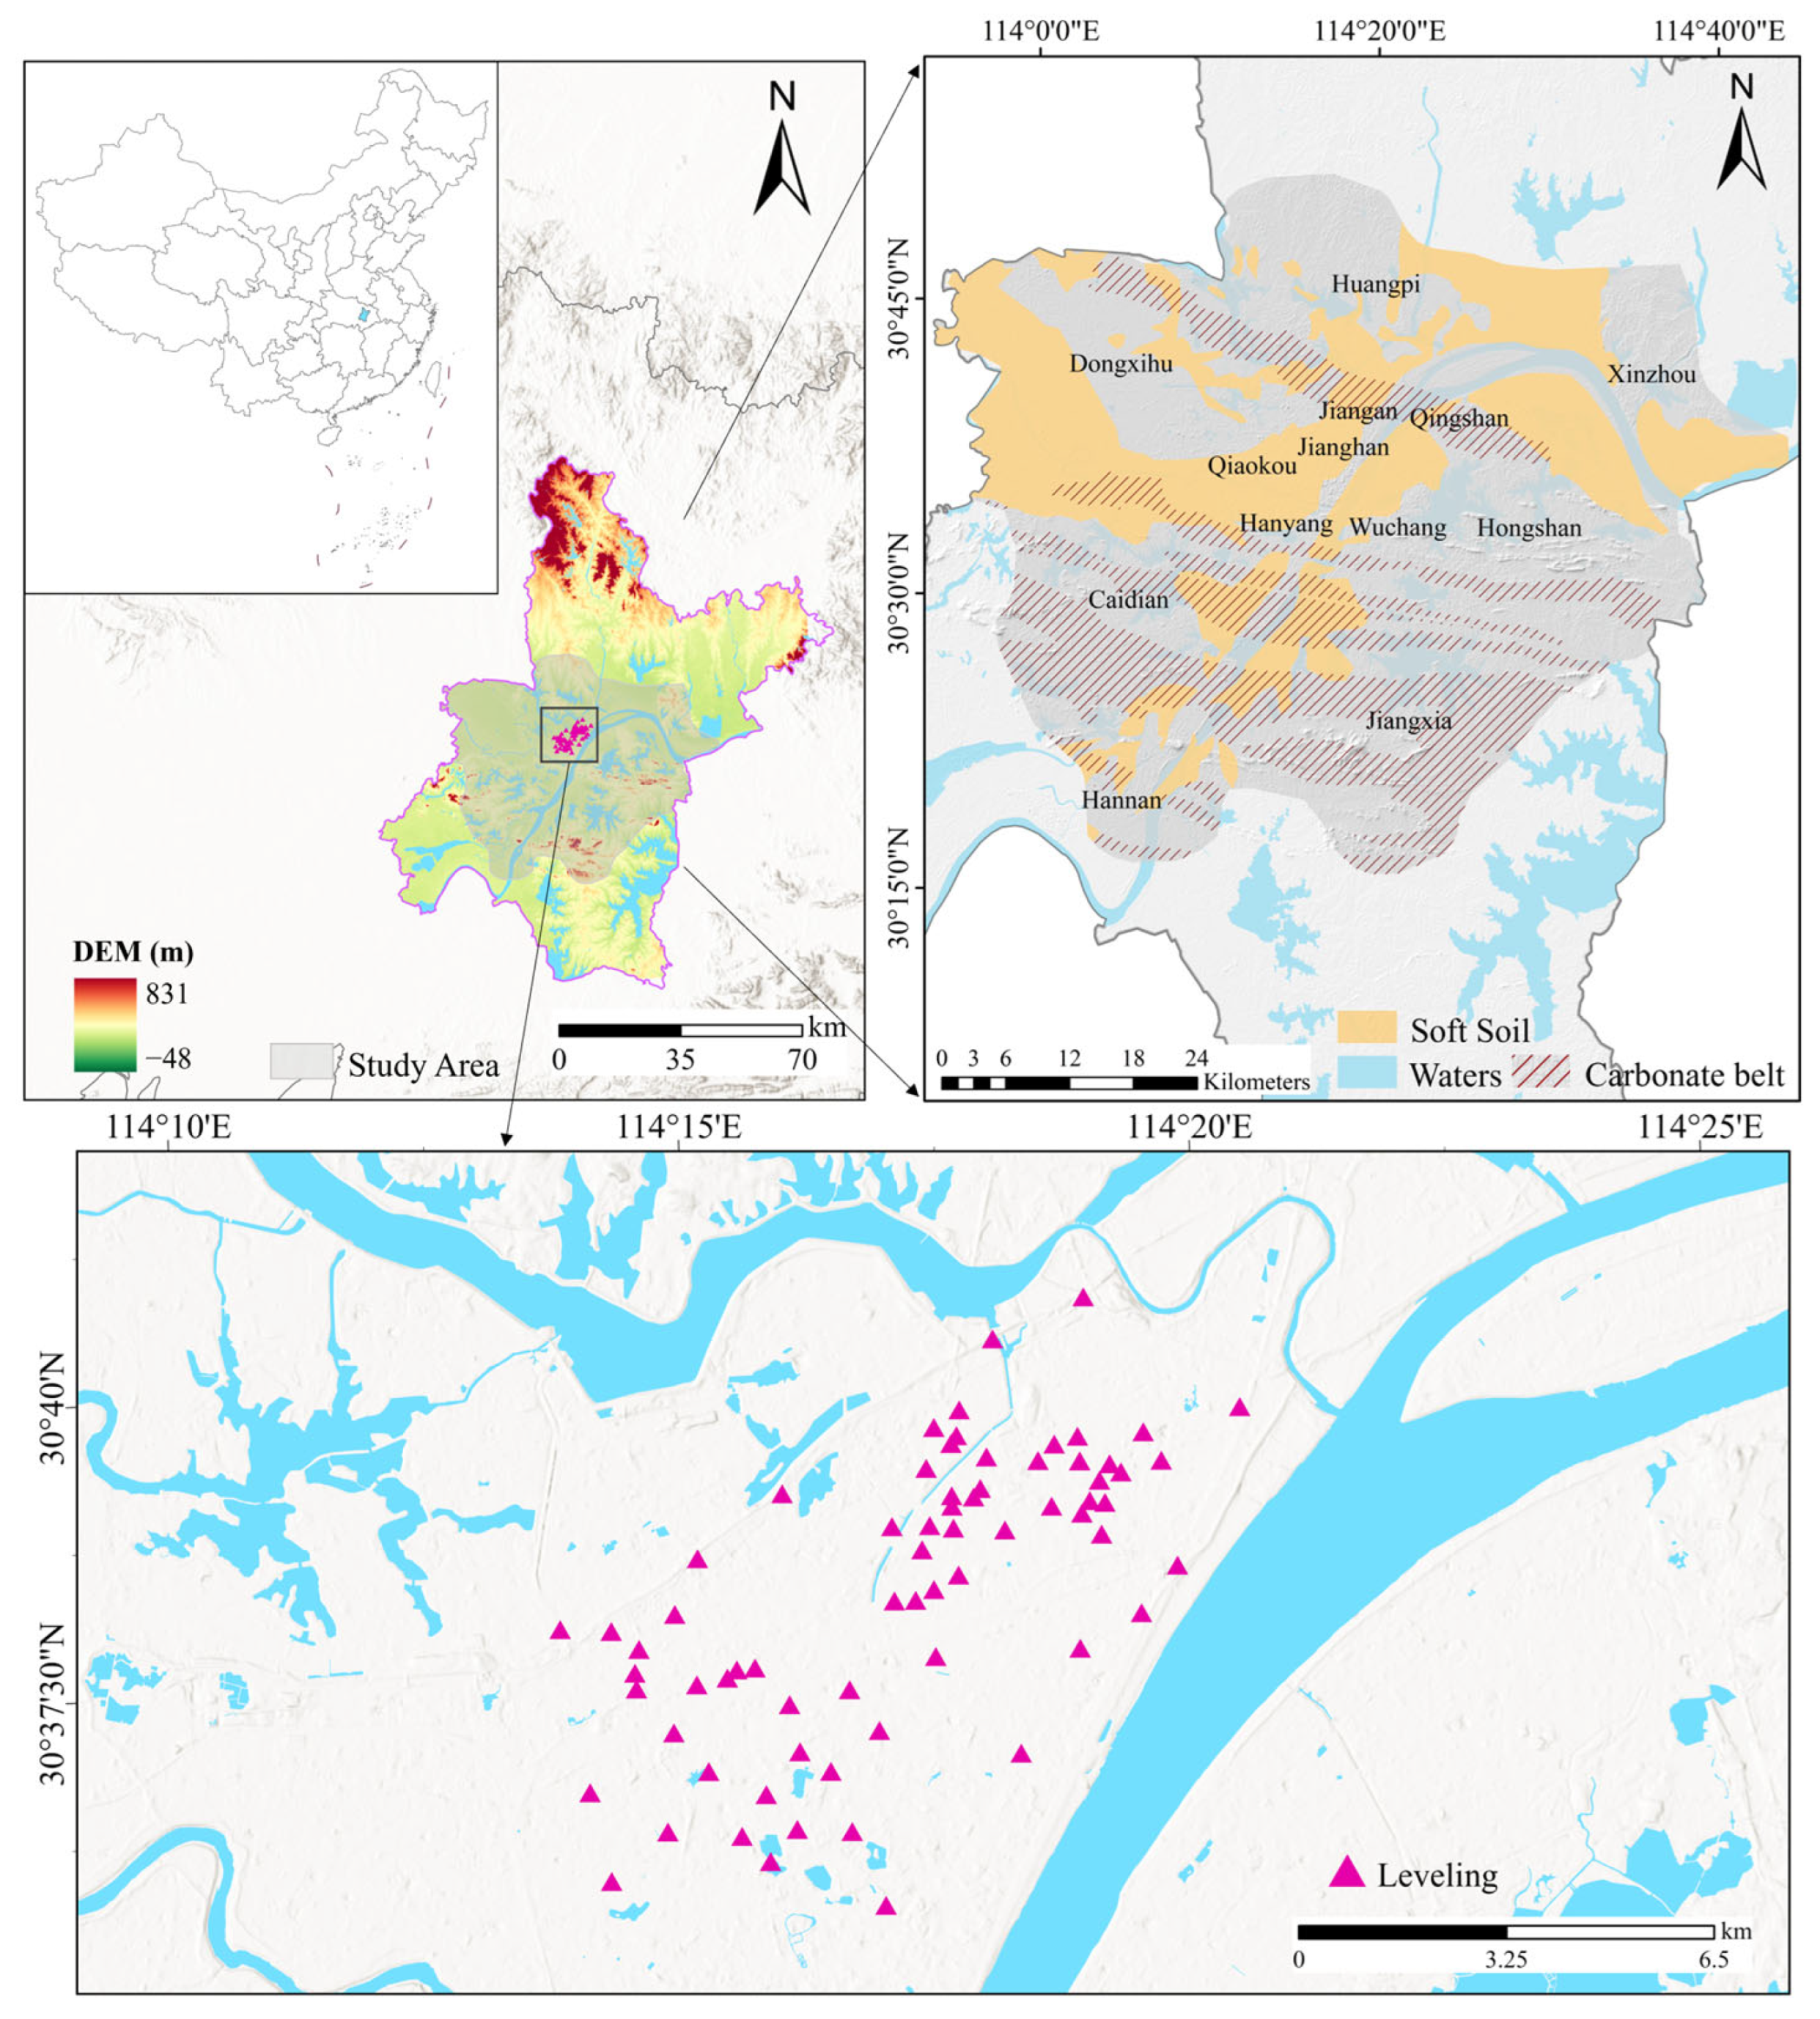
The study area of this paper was Wuhan City, Hubei Province, which is located in the eastern part of the Jianghan Plain and the confluence of major tributaries with the Han River (113°41′ E~115°05′ E, 29°58′ N~31°22′ N). In order to facilitate the analysis of the subsidence mechanism in Wuhan, the SAR images containing the main range of the territory were cropped as the main study area in this paper (gray range in Figure 1). Wuhan has seasonal rainfall, mostly concentrated from June to August every year. In the summer of heavy rainfall, it is also easy to cause localized regional flooding [36]. Wuhan is the inland city with the largest distribution of soft soils in China, with a total distribution area of over 1000 km2 of soft soils. There are six carbonate belts distributed from north to south, which are the Tianxingzhou Strip, Bridge Strip, Baisazhazhou Strip, Chaokou Strip, Jungshan Strip, and Hannan Strip [37] (Figure 1). Quaternary accumulations are widely distributed, dominated by alluvial plains on both sides of the Yangtze River and Han River, with a high north and a low south. The hydrogeology of Wuhan provides natural conditions for subsidence.
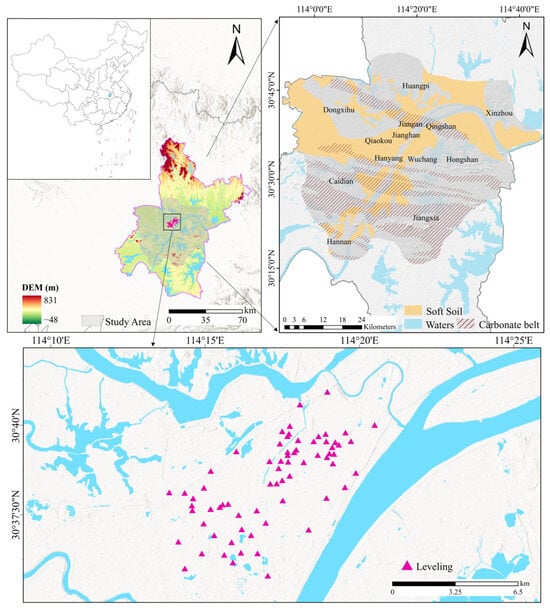
Figure 1.
Geographic location of the study area.
2.2. Datasets
This study utilized 36 ascending Sentinel-1A TOPS SAR images acquired over Wuhan from January 2020 to December 2022. Topographic phases were eliminated using the 30 m resolution SRTM DEM provided by NASA. To correct for orbital inaccuracies, precise orbit files released by the European Space Agency (ESA) were applied. Information on Wuhan’s metro system was sourced from Wuhan Metro Group Co., Ltd. (Wuhan, China). Additionally, the spatial datasets of soft soil and carbonate rock distributions were obtained from the Hubei Geological Bureau. Rainfall statistics were collected from the Wuhan Water Resources Bulletin, while water level data were retrieved from the Department of Water Resources of Hubei Province. In the risk assessment model, population density and unit GDP data were calculated from the Wuhan Statistical Yearbook 2022 published by the Wuhan Municipal Bureau of Statistics; building and road vector data were downloaded from Openstreetmap website (https://download.geofabrik.de/ (accessed on 12 October 2023)). In addition, the 69 leveling points provided by the Wuhan Geomatic Institute were used for accuracy verification. The distribution of leveling points is shown in Figure 1.
2.3. Methods
2.3.1. Basic Principles of SBAS-InSAR
The SBAS-InSAR technology generates several sets of short-baseline differential interferograms based on given temporal and spatial baseline thresholds [38]. It can overcome the phenomenon of spatial incoherence by extracting target points and building linear models based on spatial coherence coefficients. The jth (j is an arbitrary natural number) amplitude differential interferogram generated by interfering with the SAR image maps at moments and . After removing the flat terrain phase by DEM, the interferometric phase of the differential interferogram in the azimuth direction x and distance direction r is expressed as
where and are the phase values on the SAR image at moments and , respectively, and and are deformations in the LOS direction accumulated since at moments and , respectively. denotes the residual topographic phase in the differential interferogram; denotes the noise phase; and represents the atmospheric delay phase, as atmospheric disturbances in the interferogram manifest as low-frequency spatial signals and are separated using spatiotemporal filtering. Assuming that the period A to B is partitioned into a plurality of adjacent consecutive periods, for each adjacent period the deformation rate can be considered as a linear deformation rate, and is the phase-averaged deformation rate for the ith time interval. The deformation phases in periods A and B are denoted
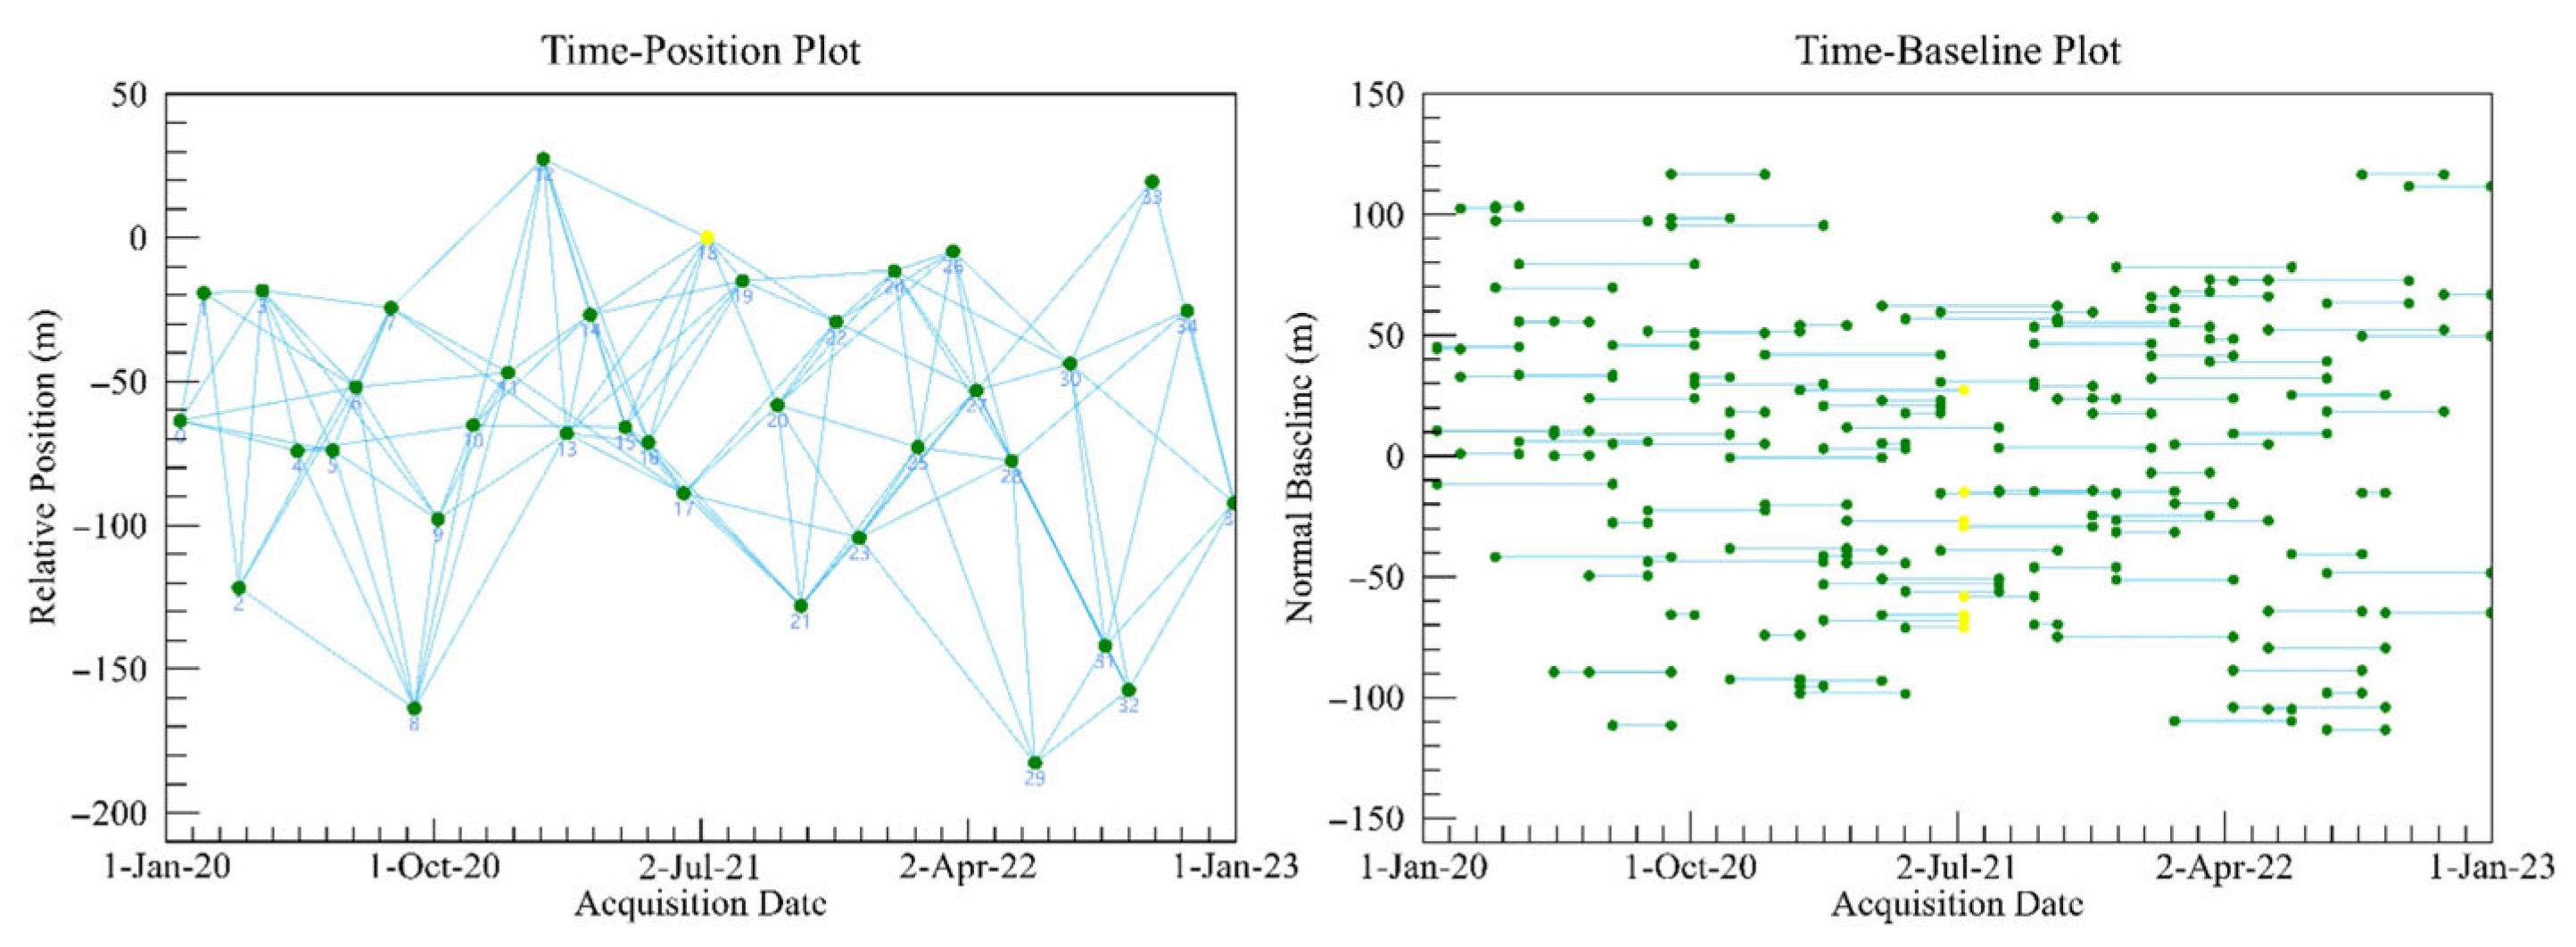
The deformation and displacement parameters were solved by using the least square methods [39]. Finally, atmospheric delay phases were estimated and corrected using spatiotemporal filtering, allowing the extraction of deformation velocities and time-series displacement for coherent targets. In this experiment, the generated spatiotemporal baseline is shown in Figure 2.
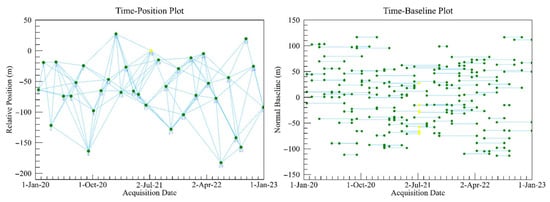
Figure 2.
Spatiotemporal baseline diagram.
2.3.2. The GD-FAHP Model
FAHP solves the consistency problem of judgment matrices. Through the construction of the affiliation function between each influencing factor and land subsidence, the weight of the influencing factors can be calculated for the intuitive interpretation of their importance [40]. Geodetector [41] can effectively detect the interaction between explanatory factors and identification variables. The explanatory capacity of independent variables can be quantified through the q statistic, where higher values indicate stronger spatial heterogeneity effects. This metric, derived from Equation (3), is computed by dissimilarity detectors that analyze inter-variable spatial divergence patterns.
where h = 1, 2, …, L is the classification or partition within the dependent variable Y or independent variable factor X, and are the number of cells in layer h and the whole area; and and are the variance of the Y value in the whole area, respectively. (Within Sum of Squares) and (Total Sum of Squares) are the sum of the intra-layer variance and the total variance in the whole area, respectively.
The combination of Geodetector and FAHP to establish the risk assessment model of Wuhan can be used to determine the indicator weights of different factors to reduce the subjectivity of using empirical models, so as to make the obtained assessment results more objective and reliable. The GD-FAHP mainly uses the results of the factor drivers obtained by Geodetector to calculate the comparison matrix Q to improve the calculation of the priority relationship matrix in the FAHP model. The modeling steps are as follows:
- (1)
- Based on the obtained q-value, the factor comparison matrix Q is calculated, and then the priority judgement matrix F is built. In Equation (6), is the comparative value of the factor drivers for factor i and factor j; q is the factor driver; and is the prioritized discriminant value of factor i and factor j.
- (2)
- Each row of the prioritized relation matrix F is summed to obtain the vector C, and then the fuzzy judgment matrix R is computed. Finally, the sorting vector is computed, utilizing the sum-row normalization method, as shown in Equation (7).where is the value of vector in row n and n is the total number of factors.
- (3)
- To solve the sorting vector with higher accuracy, the sorting vector is used as the initial value for iteration. The eigenvector is obtained by iterating using the formula , in which the reciprocal judgment matrix E is transformed by the complementary judgment matrix R, until is satisfied. Then is the maximum eigenvalue , and is normalized to obtain the final sorting vector . At this point, the iteration is finished. If the condition is not satisfied, the iteration is carried out again with as the new initial value until the iteration condition is satisfied.
2.3.3. EWM Process
The EWM is a very objective method of assignment. According to the degree of variability of the indicators, information entropy was used to calculate the entropy weight of each indicator so that the weight of different factors can be corrected. Therefore, the weight results obtained are very objective [42]. The main application steps of the EWM are as follows:
- (1)
- Determine the assessment factors and establish a standardized data matrix. Using the selected factors as the assessment set, categorize each as a positive or negative indicator and then apply data standardization. The ratio of each indicator in each unit is calculated by the formula . Then, the information entropy value contained in the jth indicator is obtained by the Equation (8), where i = 1, 2, … m, k is the adjustment coefficient and . After having nondimensionalized the ith unit’s jth indicator value, is the original value of the jth indicator data for the ith unit.
- (2)
- Calculate the difference coefficient of the indicator, according to the principle of the entropy value method, with the difference coefficient of the indicator ; a larger difference coefficient indicates that the higher the influence degree of this indicator is, the more likely it is the object of focusing consideration. Calculate the weight of each indicator by and establish the fuzzy relationship affiliation matrix according to Equation (9).
- (3)
- Determine the fuzzy integrated assessment matrix
2.3.4. Assessment Workflow
The land subsidence disaster risk mechanism is mainly interconnected with the induced disaster driving factors and the damage brought by the disaster to the environment [43]. Hazards for land subsidence risk assessment are disaster triggers. Vulnerability is the loss of human life and property caused by land subsidence. Therefore, the land subsidence risk assessment model for the main urban area of Wuhan was then established by using a combination of the two models of hazard and vulnerability. This research set equal weights for both, which can be expressed by Equation (10).
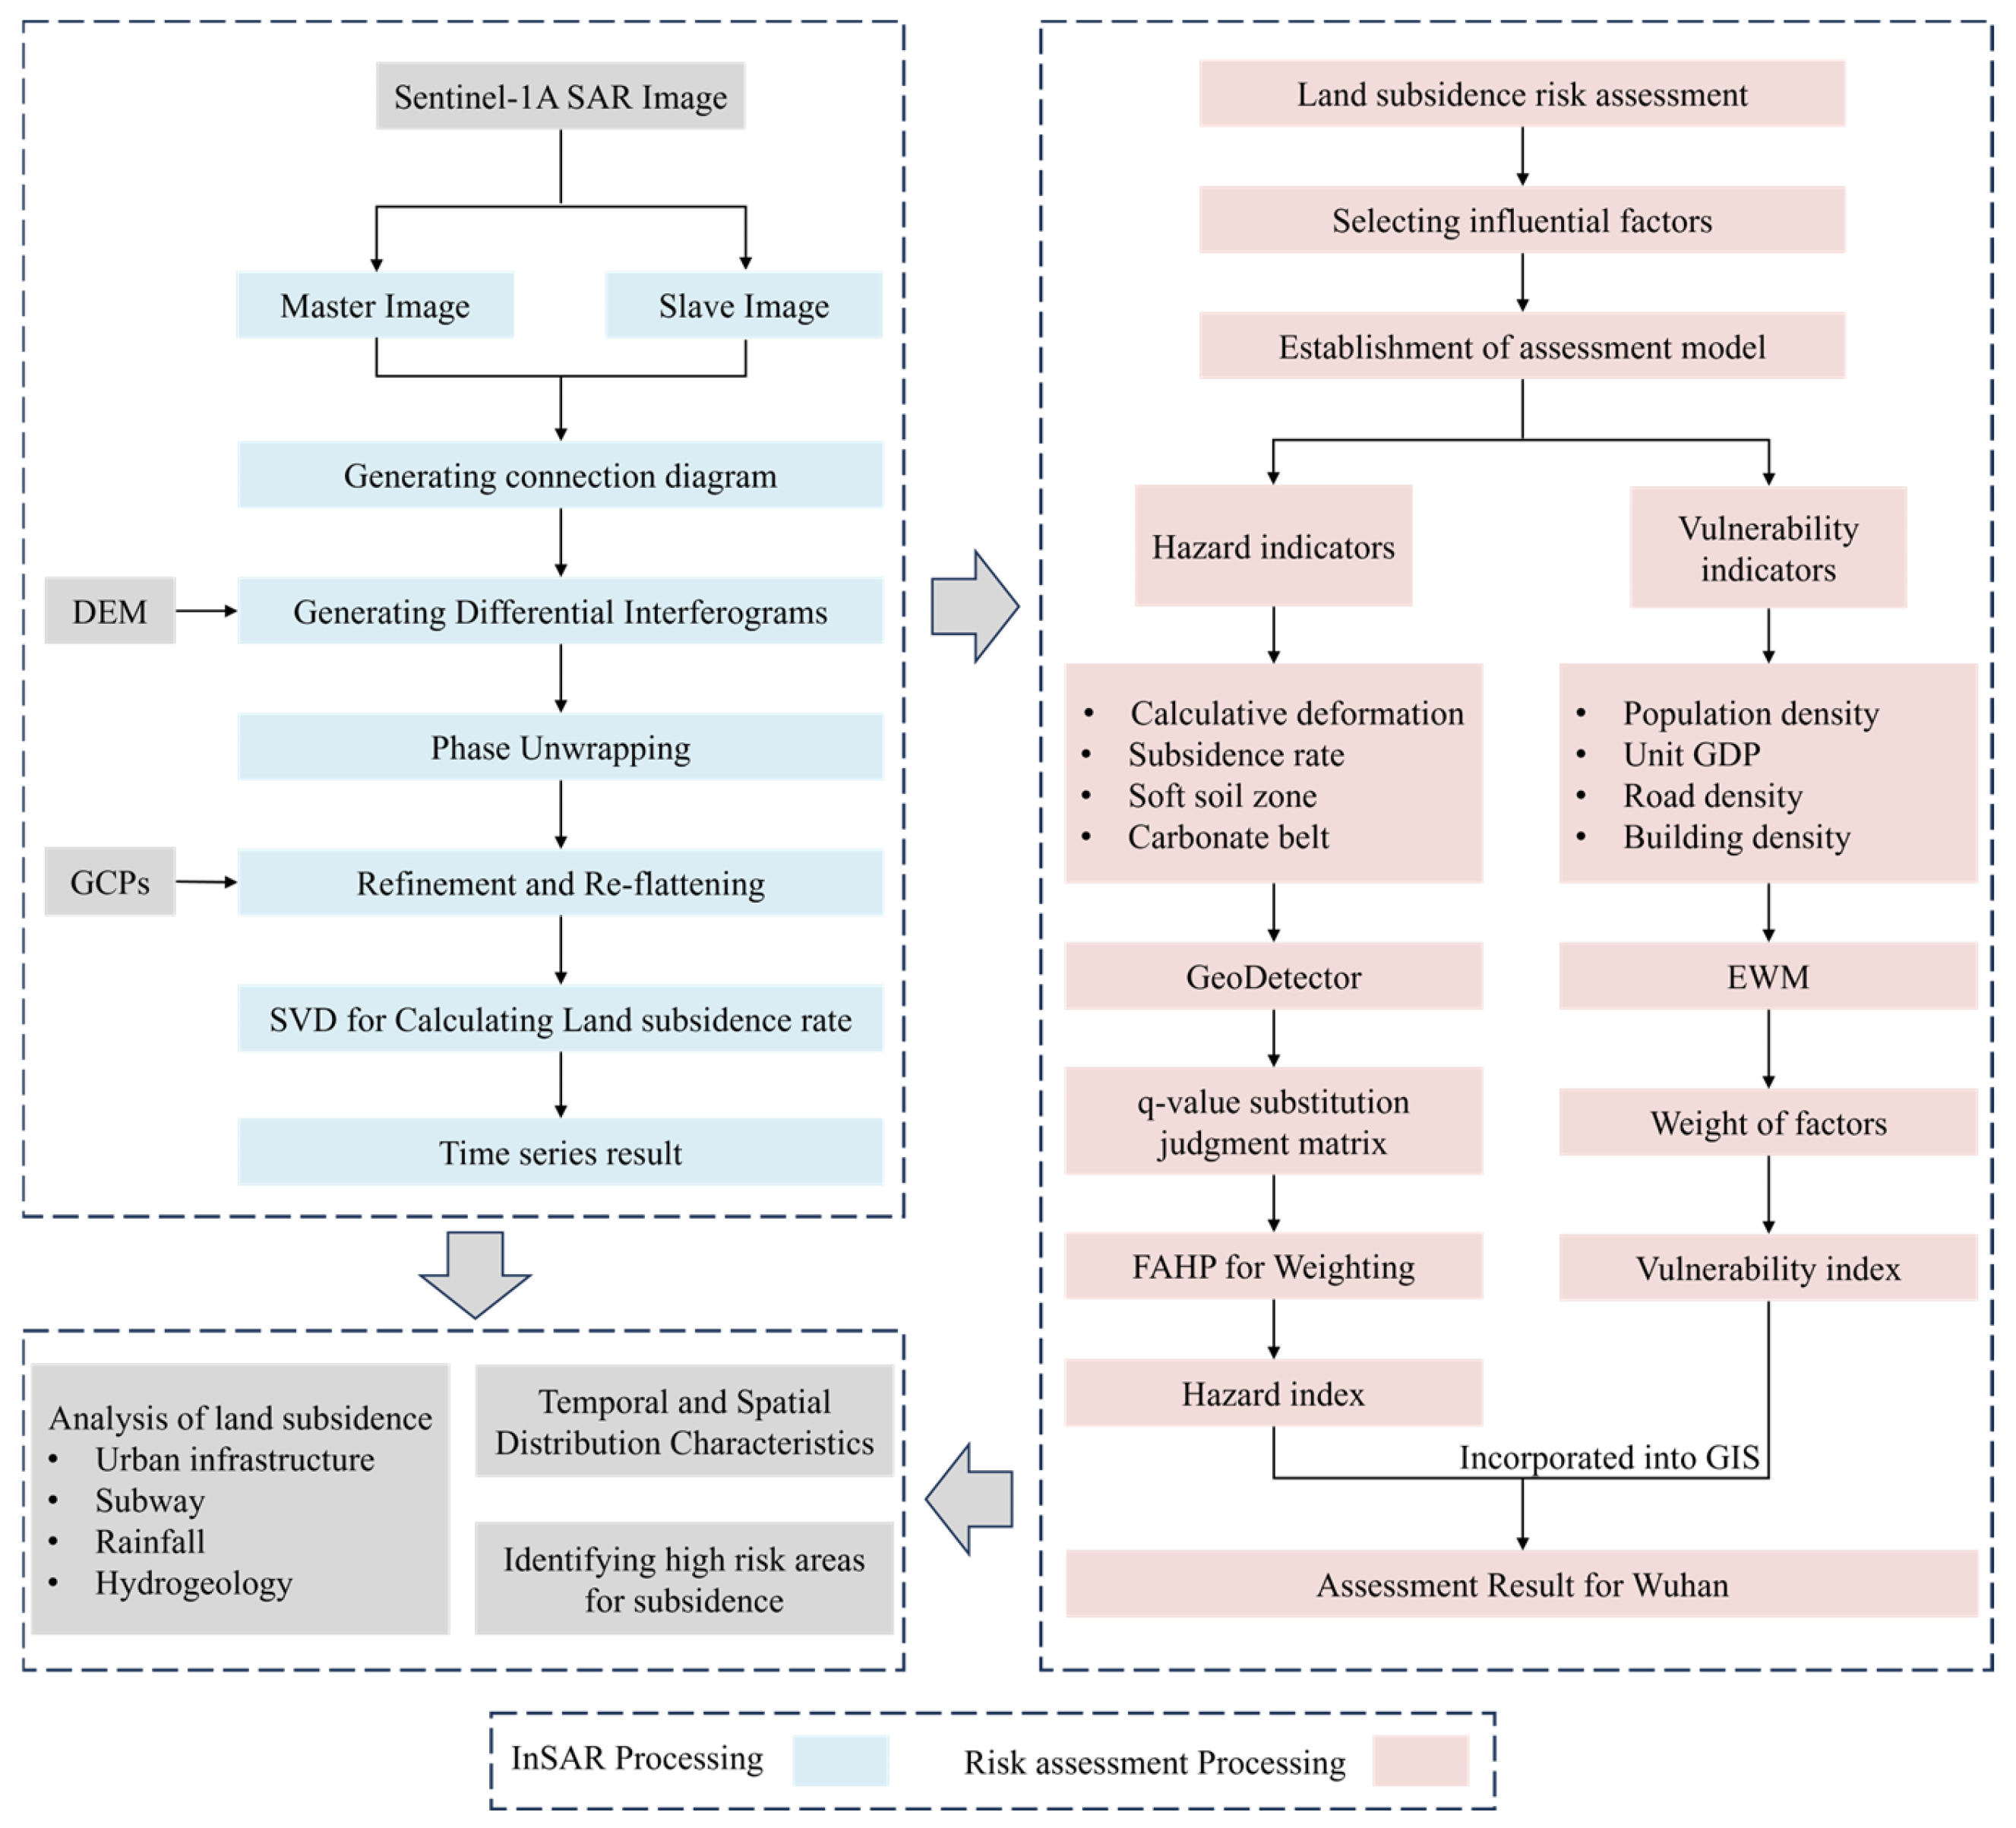
According to the existing data in Wuhan, this study selected four indicators, namely a cumulative amount of land subsidence, subsidence velocity, distribution of the soft soil layer, and distribution of the carbonate zone, as the assessment factors for the risk assessment of the subsidence hazard in Wuhan. The above four indicators have obvious geographic relationships with each other. Therefore, this study adopted the GD-FAHP to construct the hazard assessment model of the risk of land subsidence in Wuhan. This research selected the four identifiable indicators of road density (RD), building density (BD), population density (POD), and unit GDP as the vulnerability assessment factors. To determine the weights of these different factors, the EWM was chosen to establish the vulnerability assessment model. The specific assessment process is shown in Figure 3.
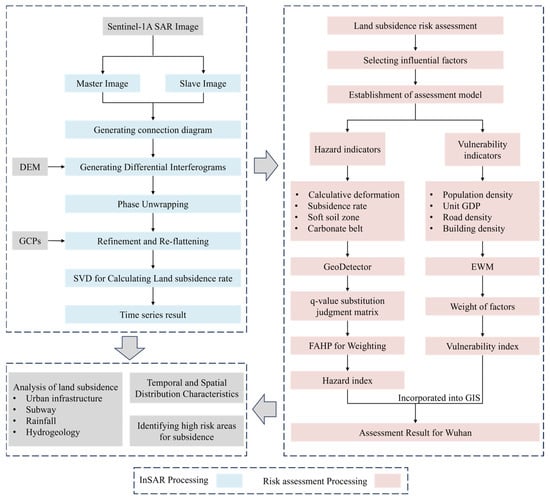
Figure 3.
Land subsidence risk assessment process.
3. Results
3.1. Time-Series Analysis of Subsidence
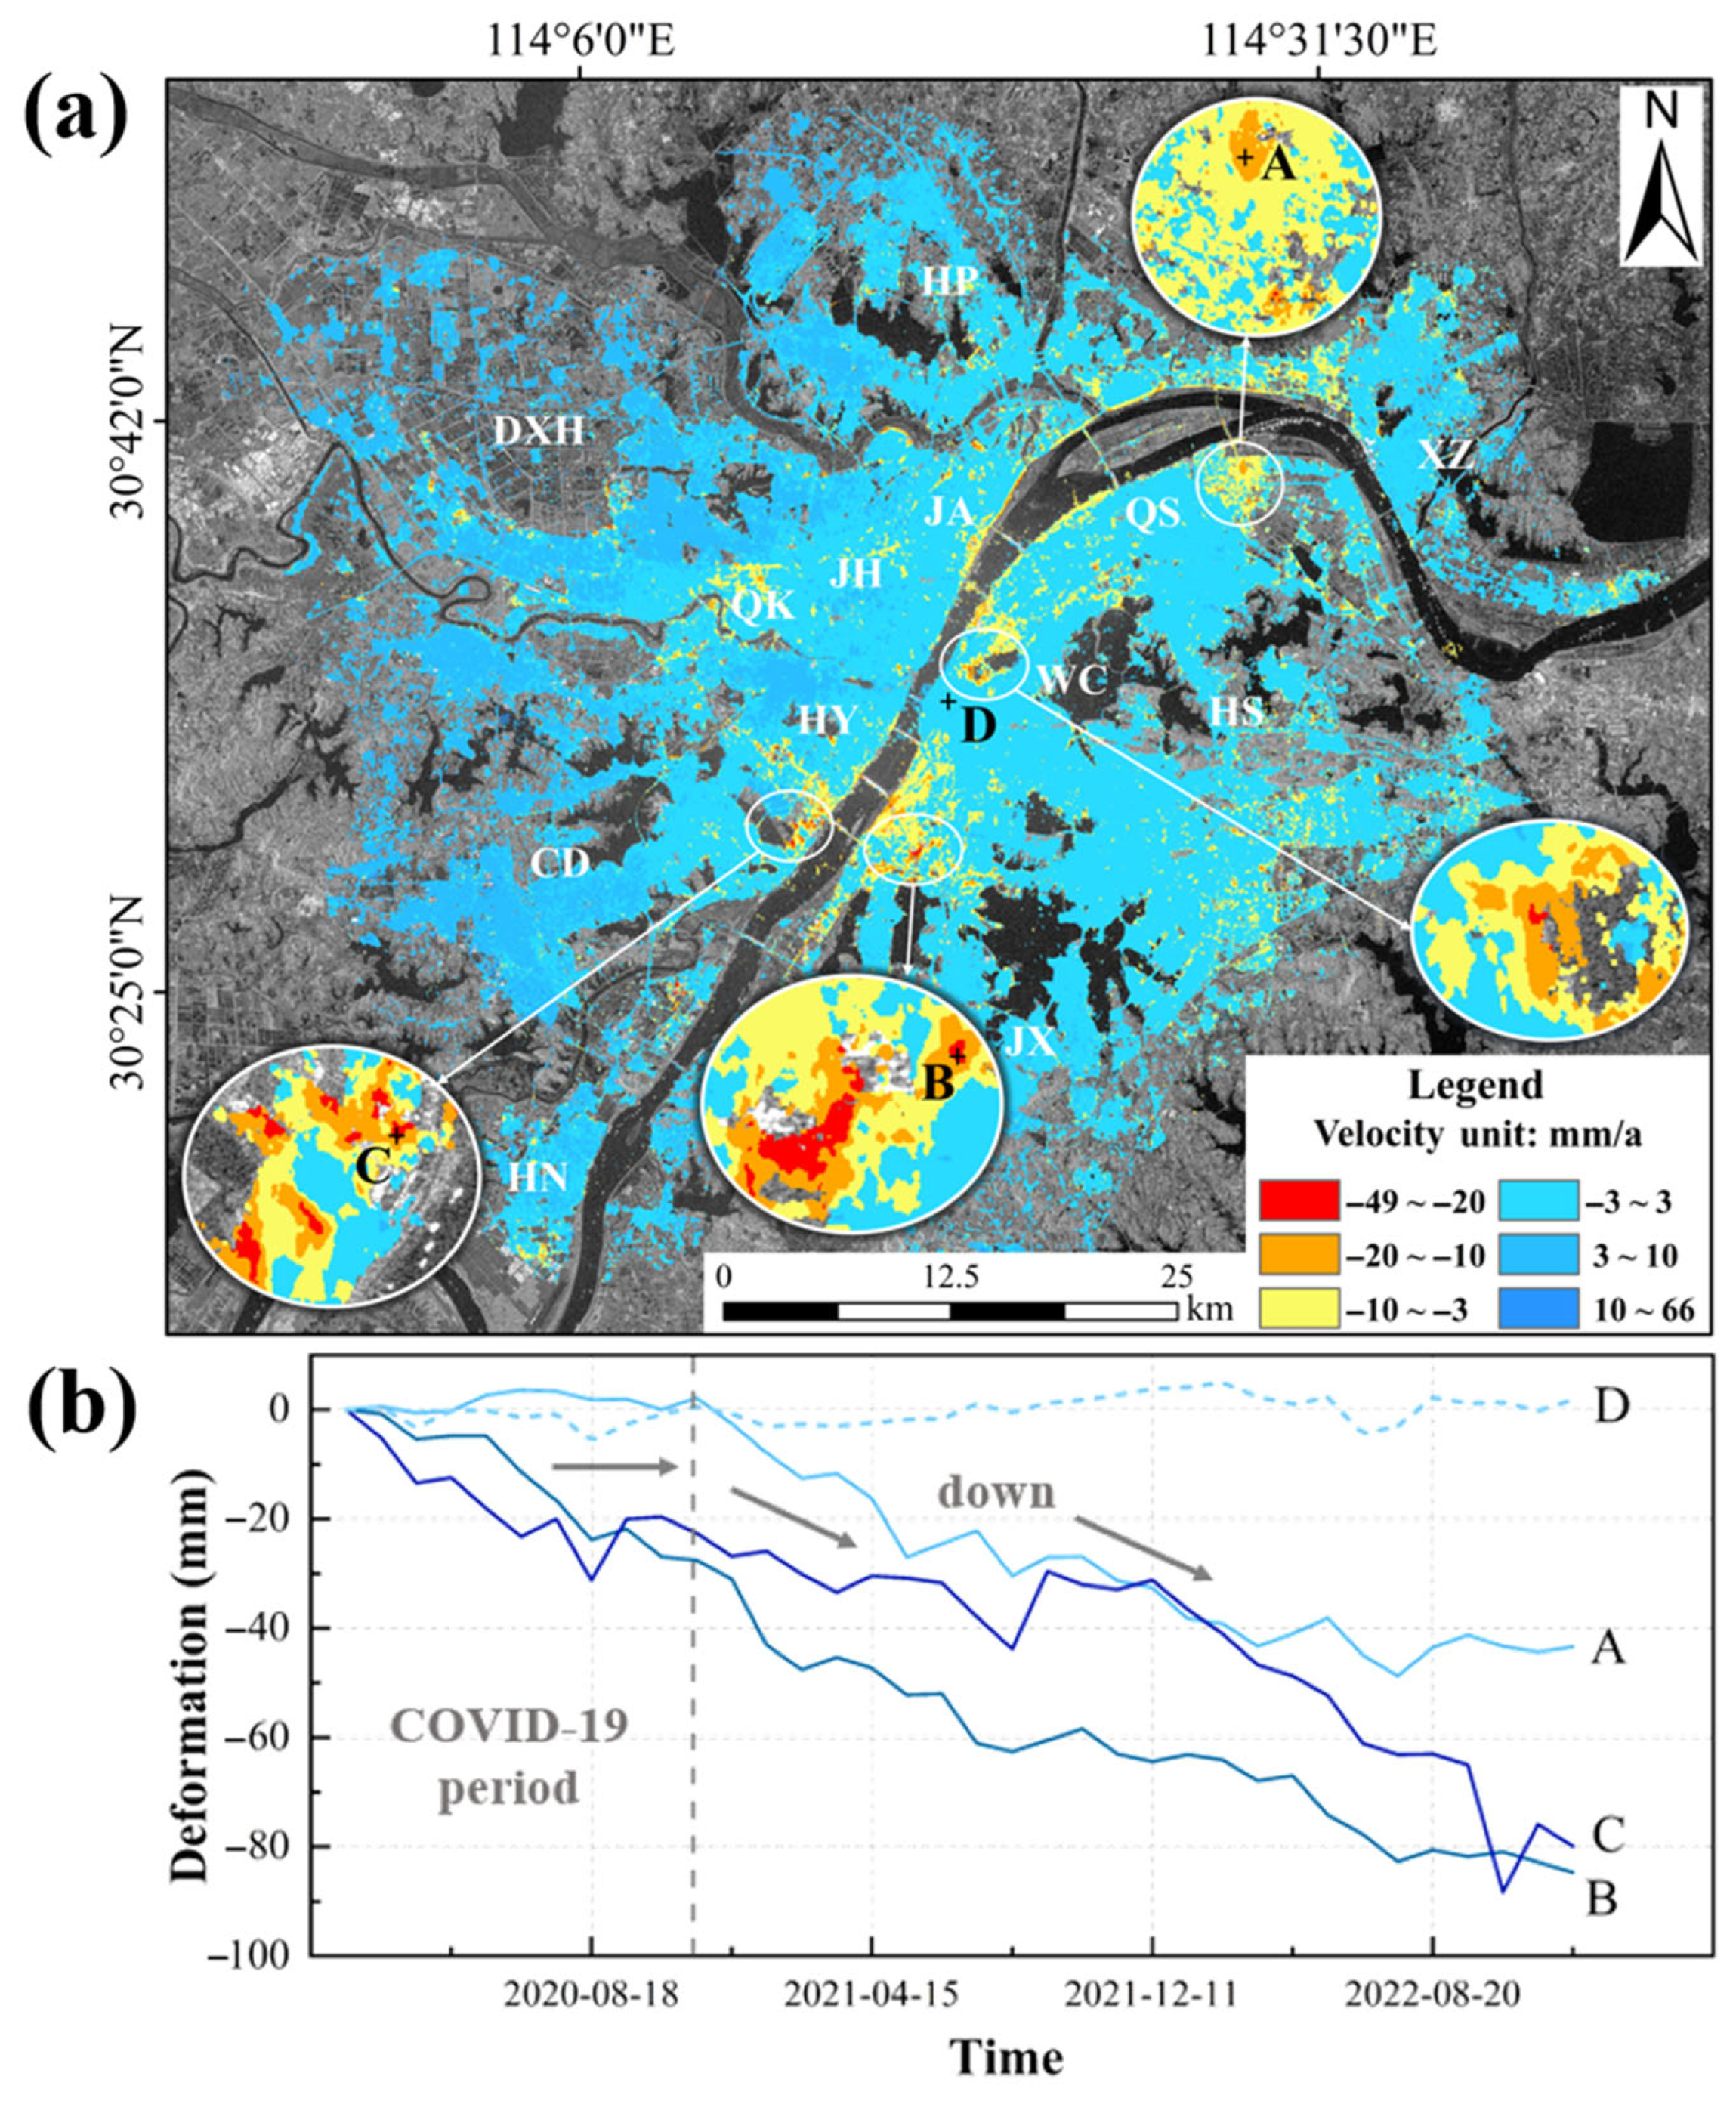
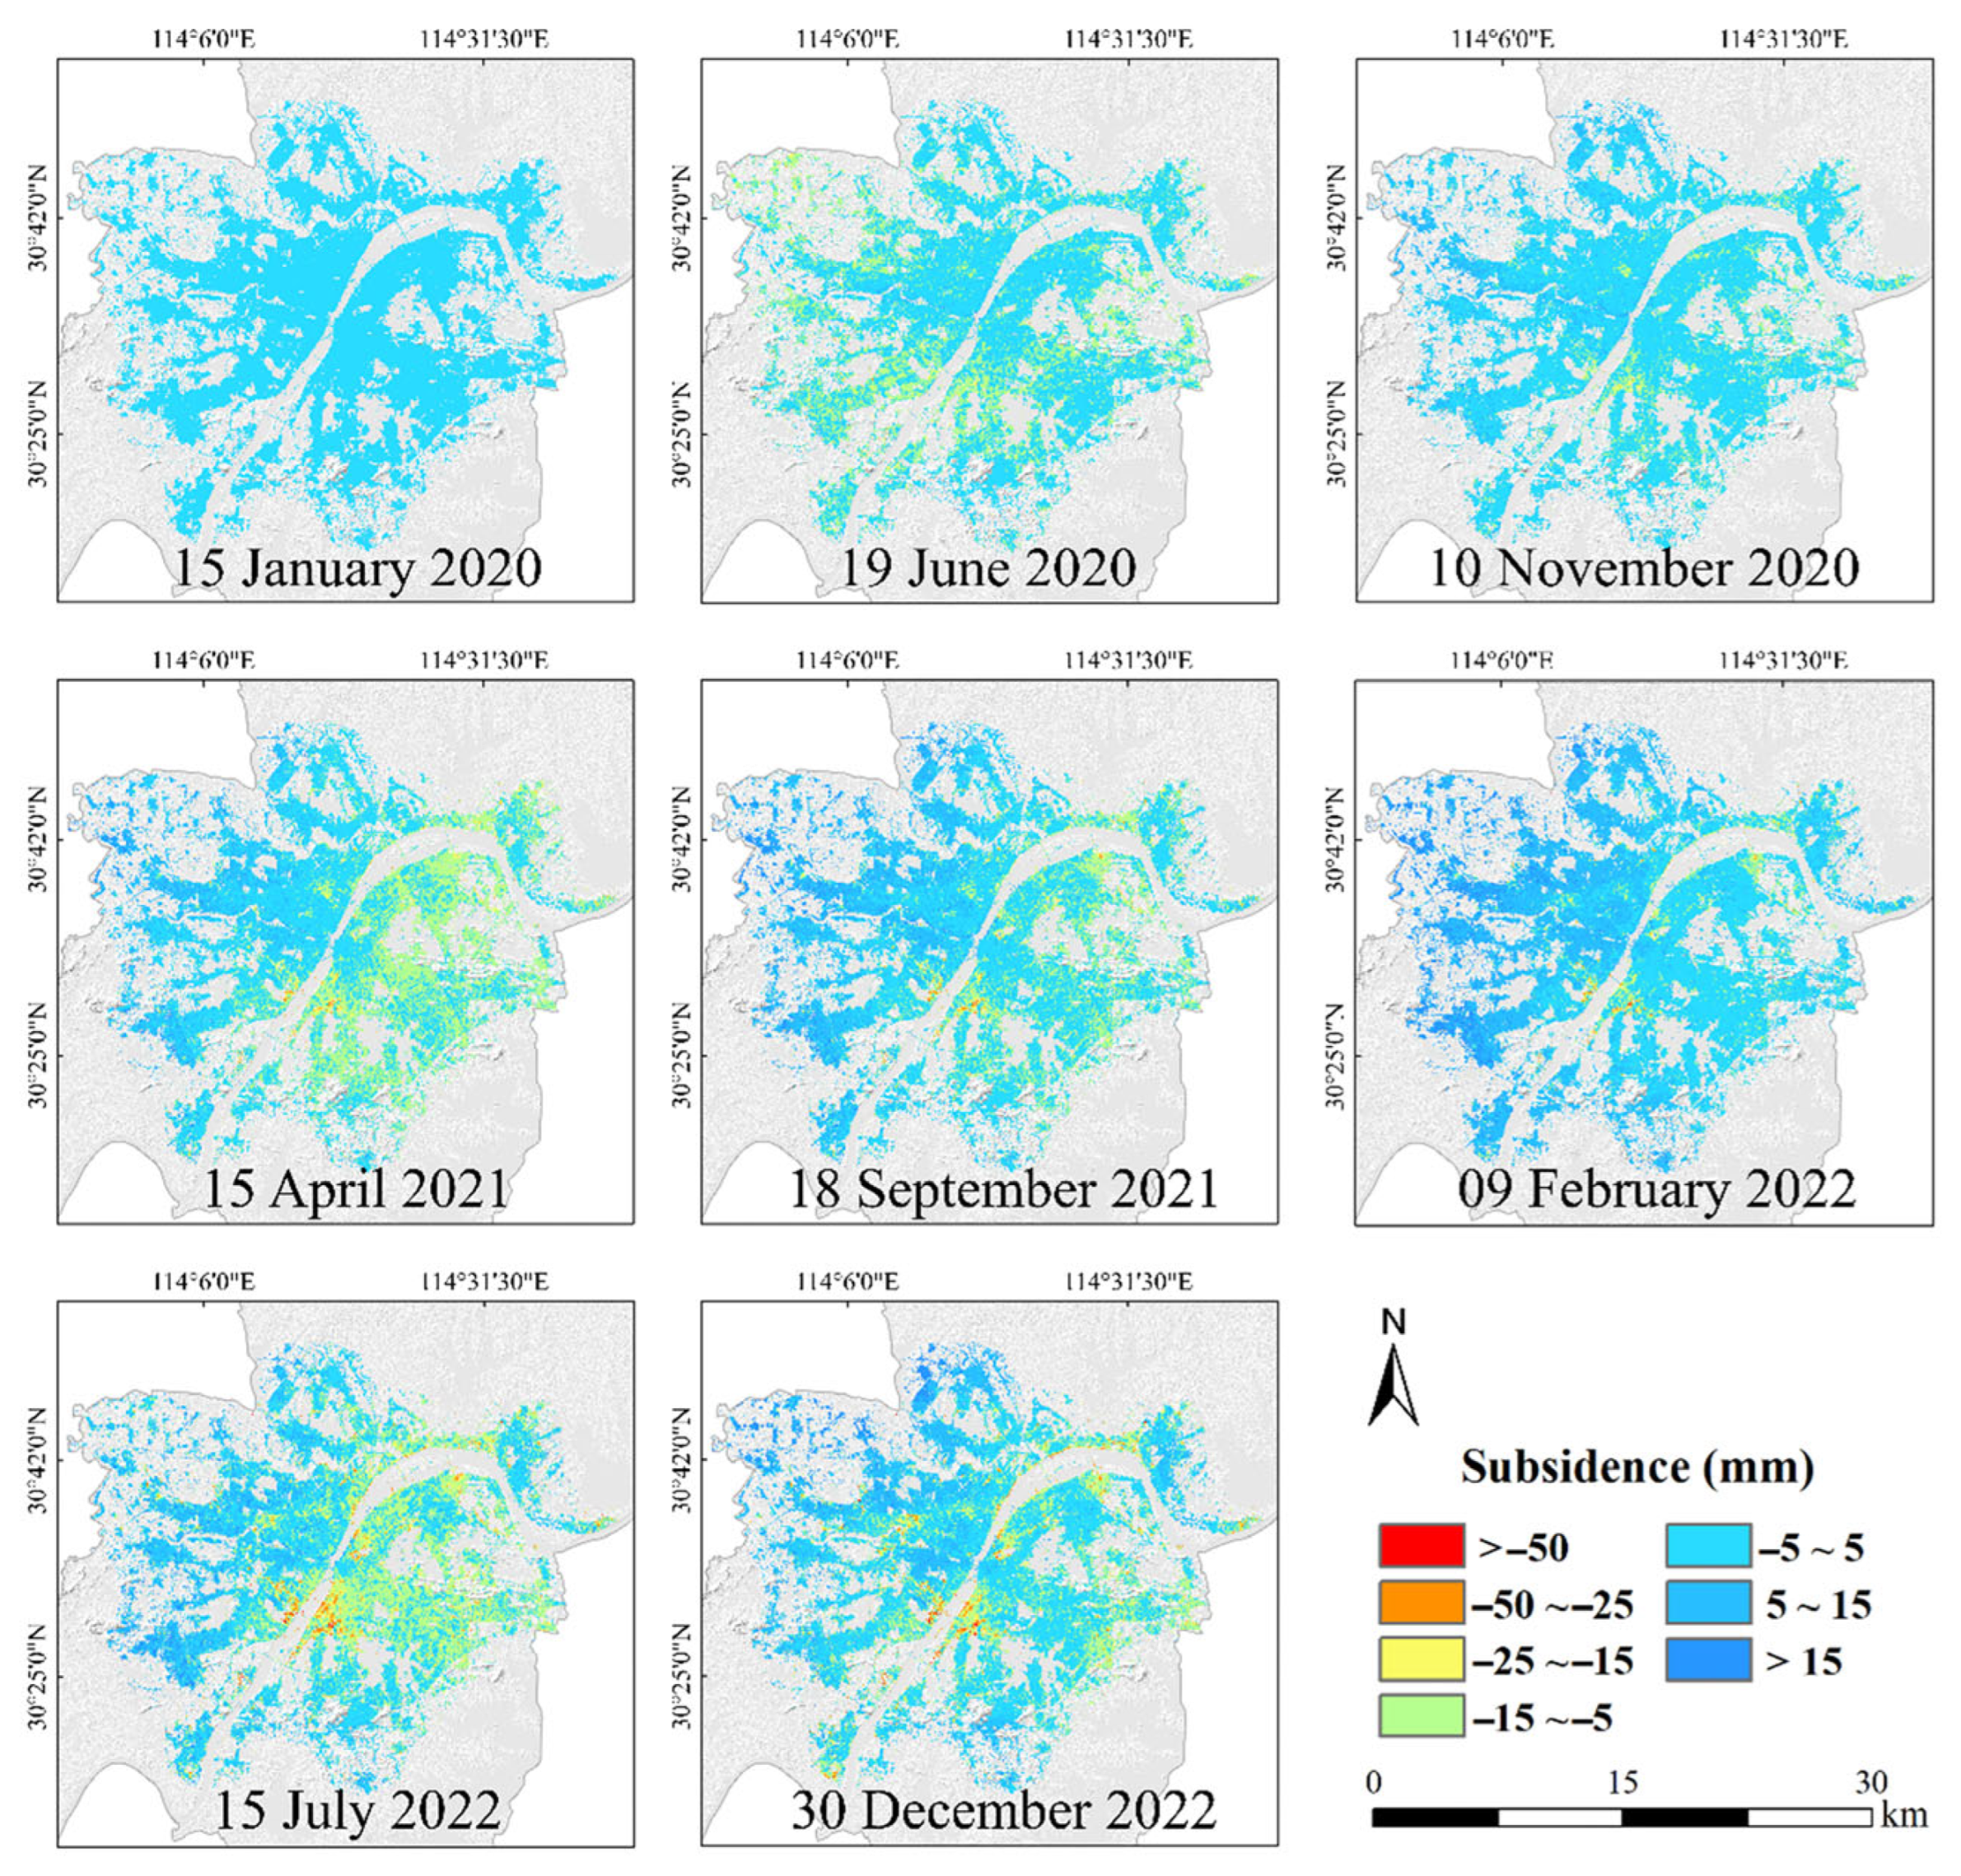
The calculated land deformation results for Wuhan are shown in Figure 4a, with positive values indicating land uplift and negative values indicating land subsidence. The analysis revealed significant spatial heterogeneity in land subsidence across Wuhan, with the maximum subsidence rate reaching −49 mm/a. Cumulative deformation predominantly ranged between −10 mm and 15 mm (Figure 5), while the most severe subsidence, amounting to −135 mm, was observed in Hongshan District (HS). Four prominent subsidence funnels were identified: Qingshan District (QS), Hanyang District (HY), Wuchang District (WC), and HS. Spatially, HS exhibited the most extensive subsidence distribution. Temporal analysis indicated the emergence of subsidence funnels in Baisazhazhou (BSZ) and Qingling (QL) by 2021, with subsidence intensifying over time (Figure 5). Subsidence areas were primarily concentrated in the central urban region, with outward expansion observed in HS-BSZ, the areas north of Shahu, and Qingshan Industrial Park. In contrast, Caidian District in southwestern Wuhan displayed notable land uplift ranging from 3 to 10 mm/a, which was potentially attributed to the physicochemical expansion of soil water [44].
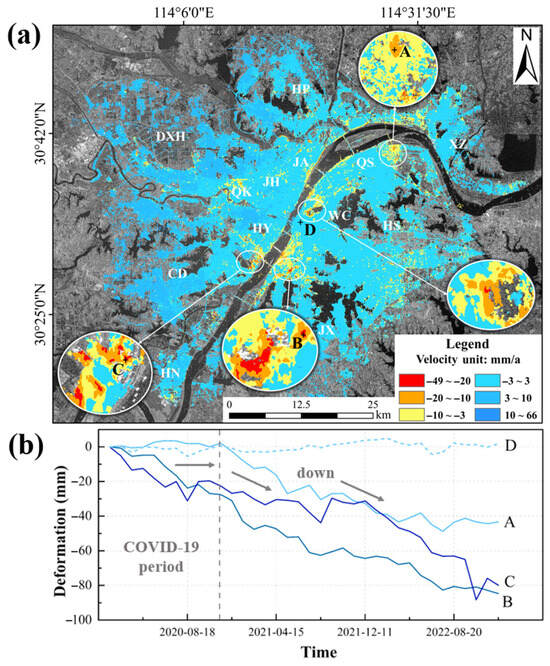
Figure 4.
(a) Land subsidence rate results for Wuhan from 2020 to 2022; (b) time-series plot of PS points.
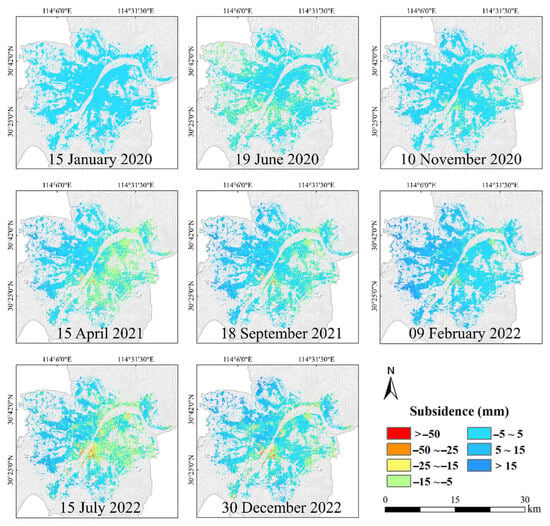
Figure 5.
Temporal evolution of cumulative land subsidence.
The post-COVID-19 resumption of industrial and construction activities in 2021 likely exacerbated subsidence phenomena. To validate this, four representative persistent scatterer (PS) points (A, B, C, and D) were analyzed in Qingshan Industrial Park, HS-QL, HY, and WC, respectively (Figure 4b). Point D served as a stable reference. Temporal subsidence trends revealed that Point B exhibited rapid and sustained subsidence, likely driven by intensive urban construction in HS. Point A initially showed minimal deformation, with slight uplift, followed by significant subsidence post-2021, correlating with the resumption of factory construction after the pandemic. Point C experienced a temporary subsidence slowdown during the pandemic, with renewed intensification in January 2022.
3.2. Accuracy Assessment
3.2.1. Internal Precision Evaluation
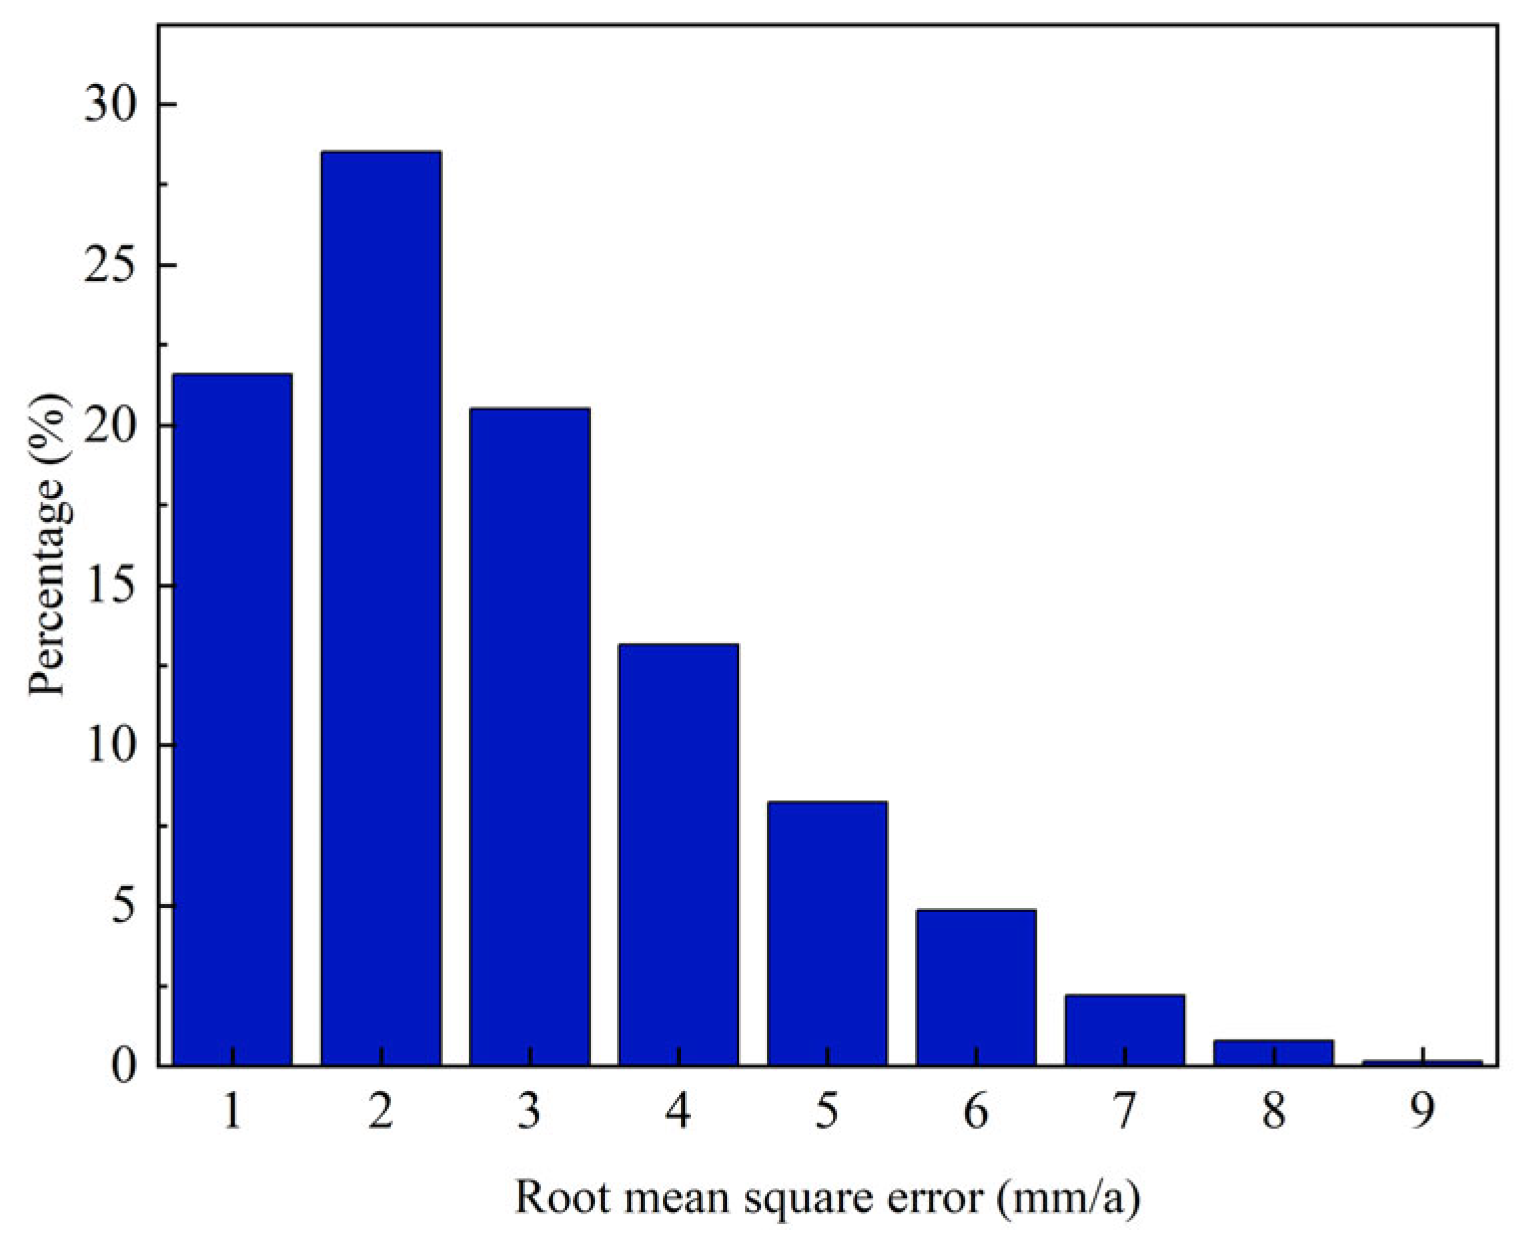
This study evaluated the internal conformity accuracy of this experiment, and Figure 6 shows the spatial distribution and density statistics of the root mean square (RMSE) of the subsidence rate in Wuhan during the monitoring period. The RMSE values of the monitored points were predominantly within the range of 0–5 mm/a, representing over 90% of all data points, with an average RMSE of 3.06 mm/a. It can be seen that the inversion accuracy of land subsidence in Wuhan was considerable, which indicated that applying SBAS-InSAR to the inversion result of land subsidence in Wuhan was reliable.
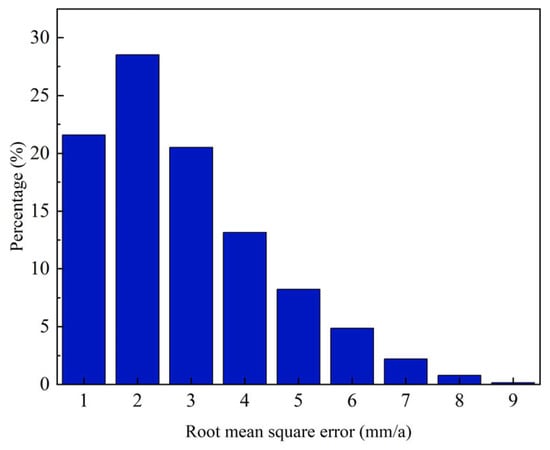
Figure 6.
RMSE of the average deformation rate.
3.2.2. Real Precision Evaluation
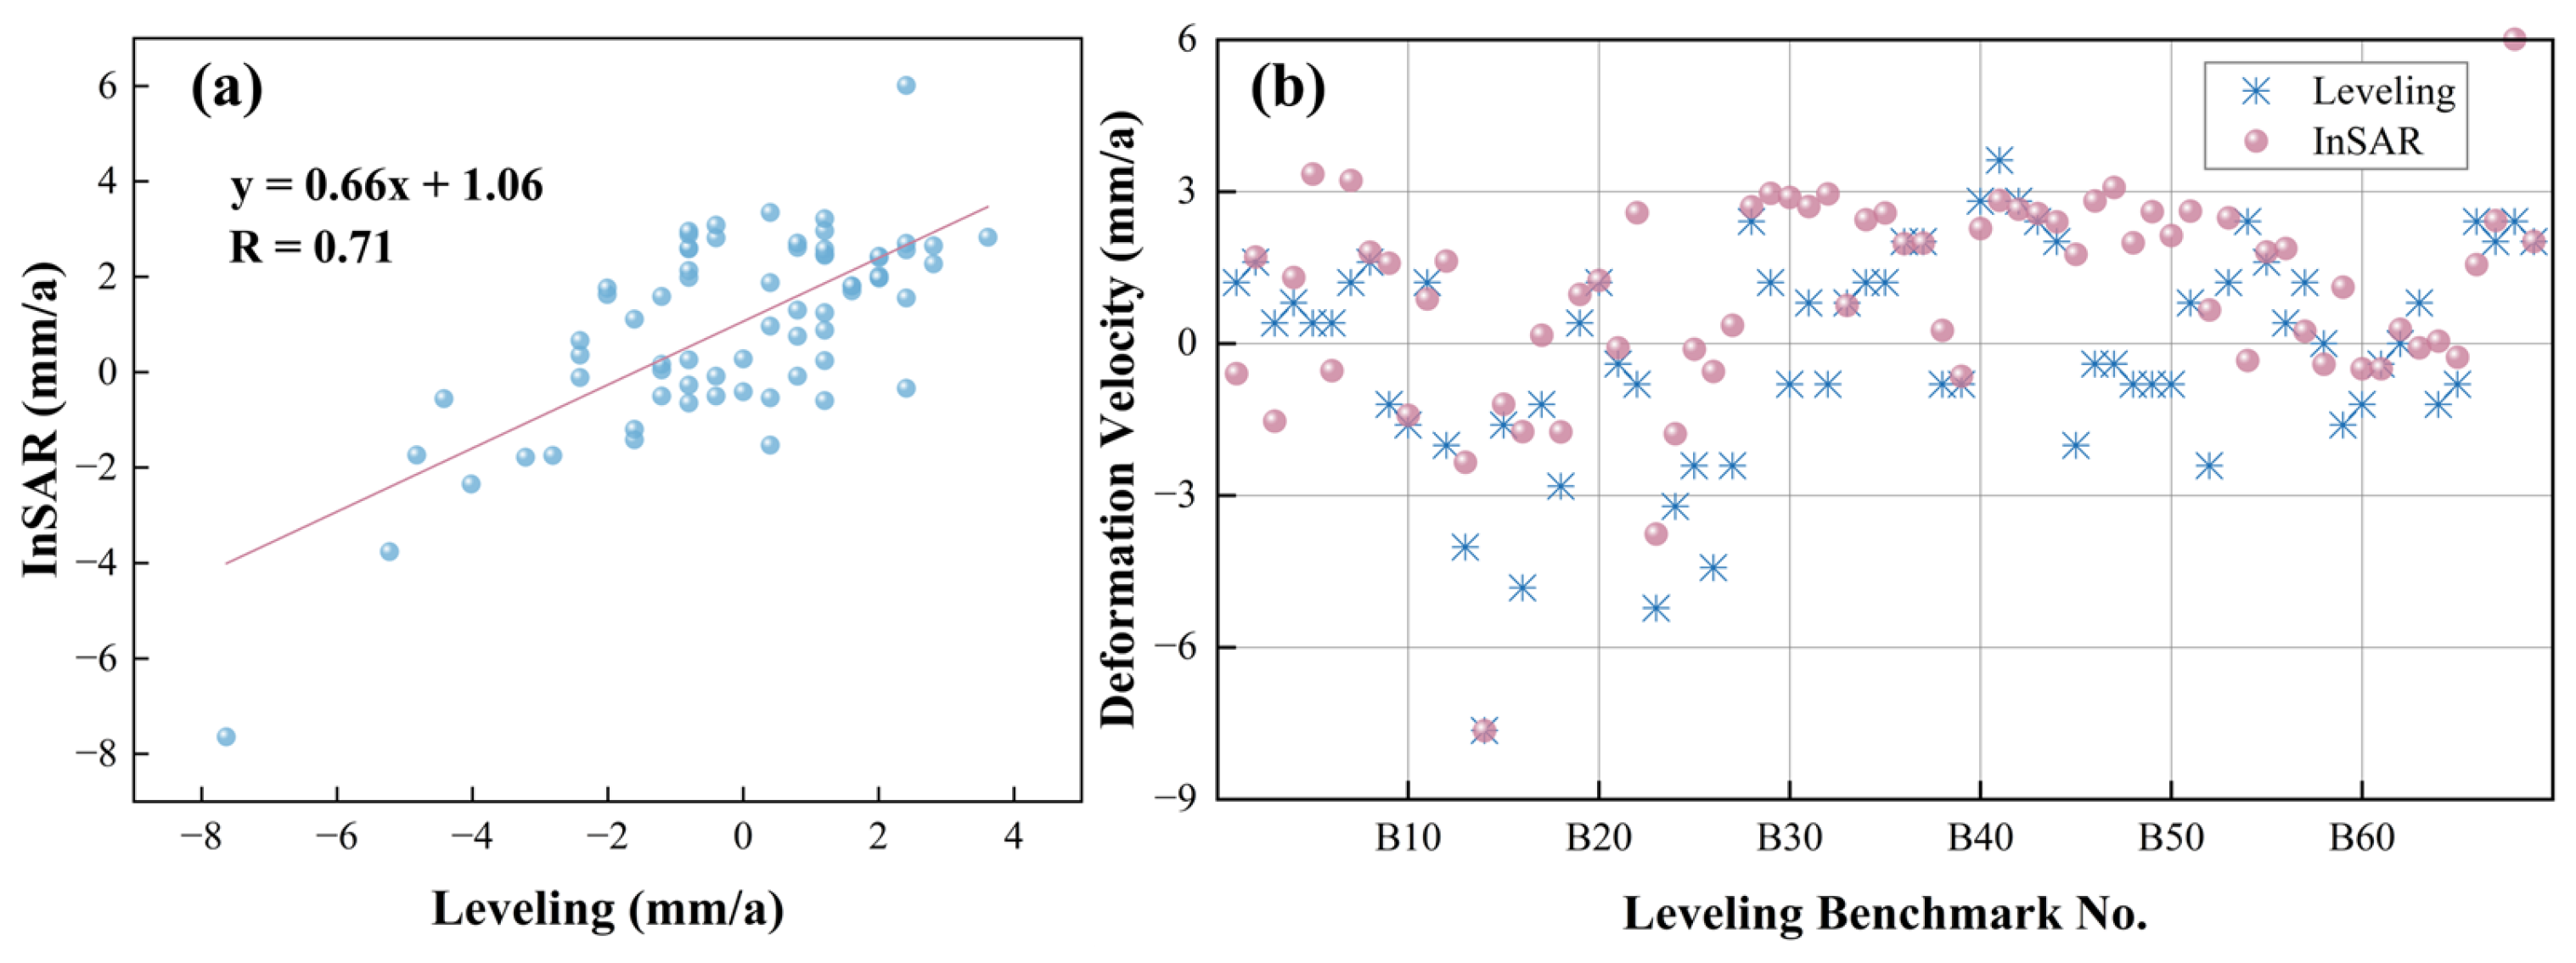
This study conducted an internal accuracy assessment of the SBAS-InSAR results, achieving favorable outcomes. To further validate the accuracy of the SBAS-InSAR method, a validation was performed using 69 second-order leveling points in Wuhan from December 2020 to October 2022, comparing them with high-coherence points monitored by InSAR. The location of the leveling points is shown in Figure 1. First, the least squares method was employed to calculate the average annual deformation velocity of the InSAR-monitored points from December 2020 to October 2022, ensuring temporal consistency in the data. Then, since the leveling point and InSAR-monitored points were not co-located, InSAR-monitored points within a 100 m buffer zone centered on each leveling point were selected, and their mean values were computed. Finally, the vertical deformation rates from the leveling data were converted into line of sight (LOS) deformation velocity values and compared with the InSAR LOS deformation velocity values.
Figure 7a presents the verification results between leveling and InSAR monitoring, demonstrating strong consistency between the two methods with a correlation coefficient of 0.71. The results in Figure 7b show that the annual average deformation velocity obtained by both techniques were highly similar. However, discrepancies exceeding 3 mm/a still existed for individual monitoring points, with the maximum error reaching 3.9 mm/a. It is due to various reasons: (1) The spatial distribution of the leveling points and InSAR monitoring points was not entirely consistent; and (2) the temporal resolutions of the two monitoring techniques differ. Despite our efforts to align the monitoring periods, minor temporal differences remained in the results. In conclusion, the SBAS-InSAR deformation monitoring results for Wuhan in this study are reliable.
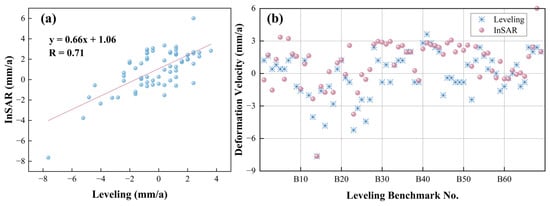
Figure 7.
(a) Results of linear regression analysis between InSAR and leveling deformation velocity; (b) comparison of InSAR and leveling data from October 2020 to December 2022.
3.3. Land Subsidence Risk Zonation Results
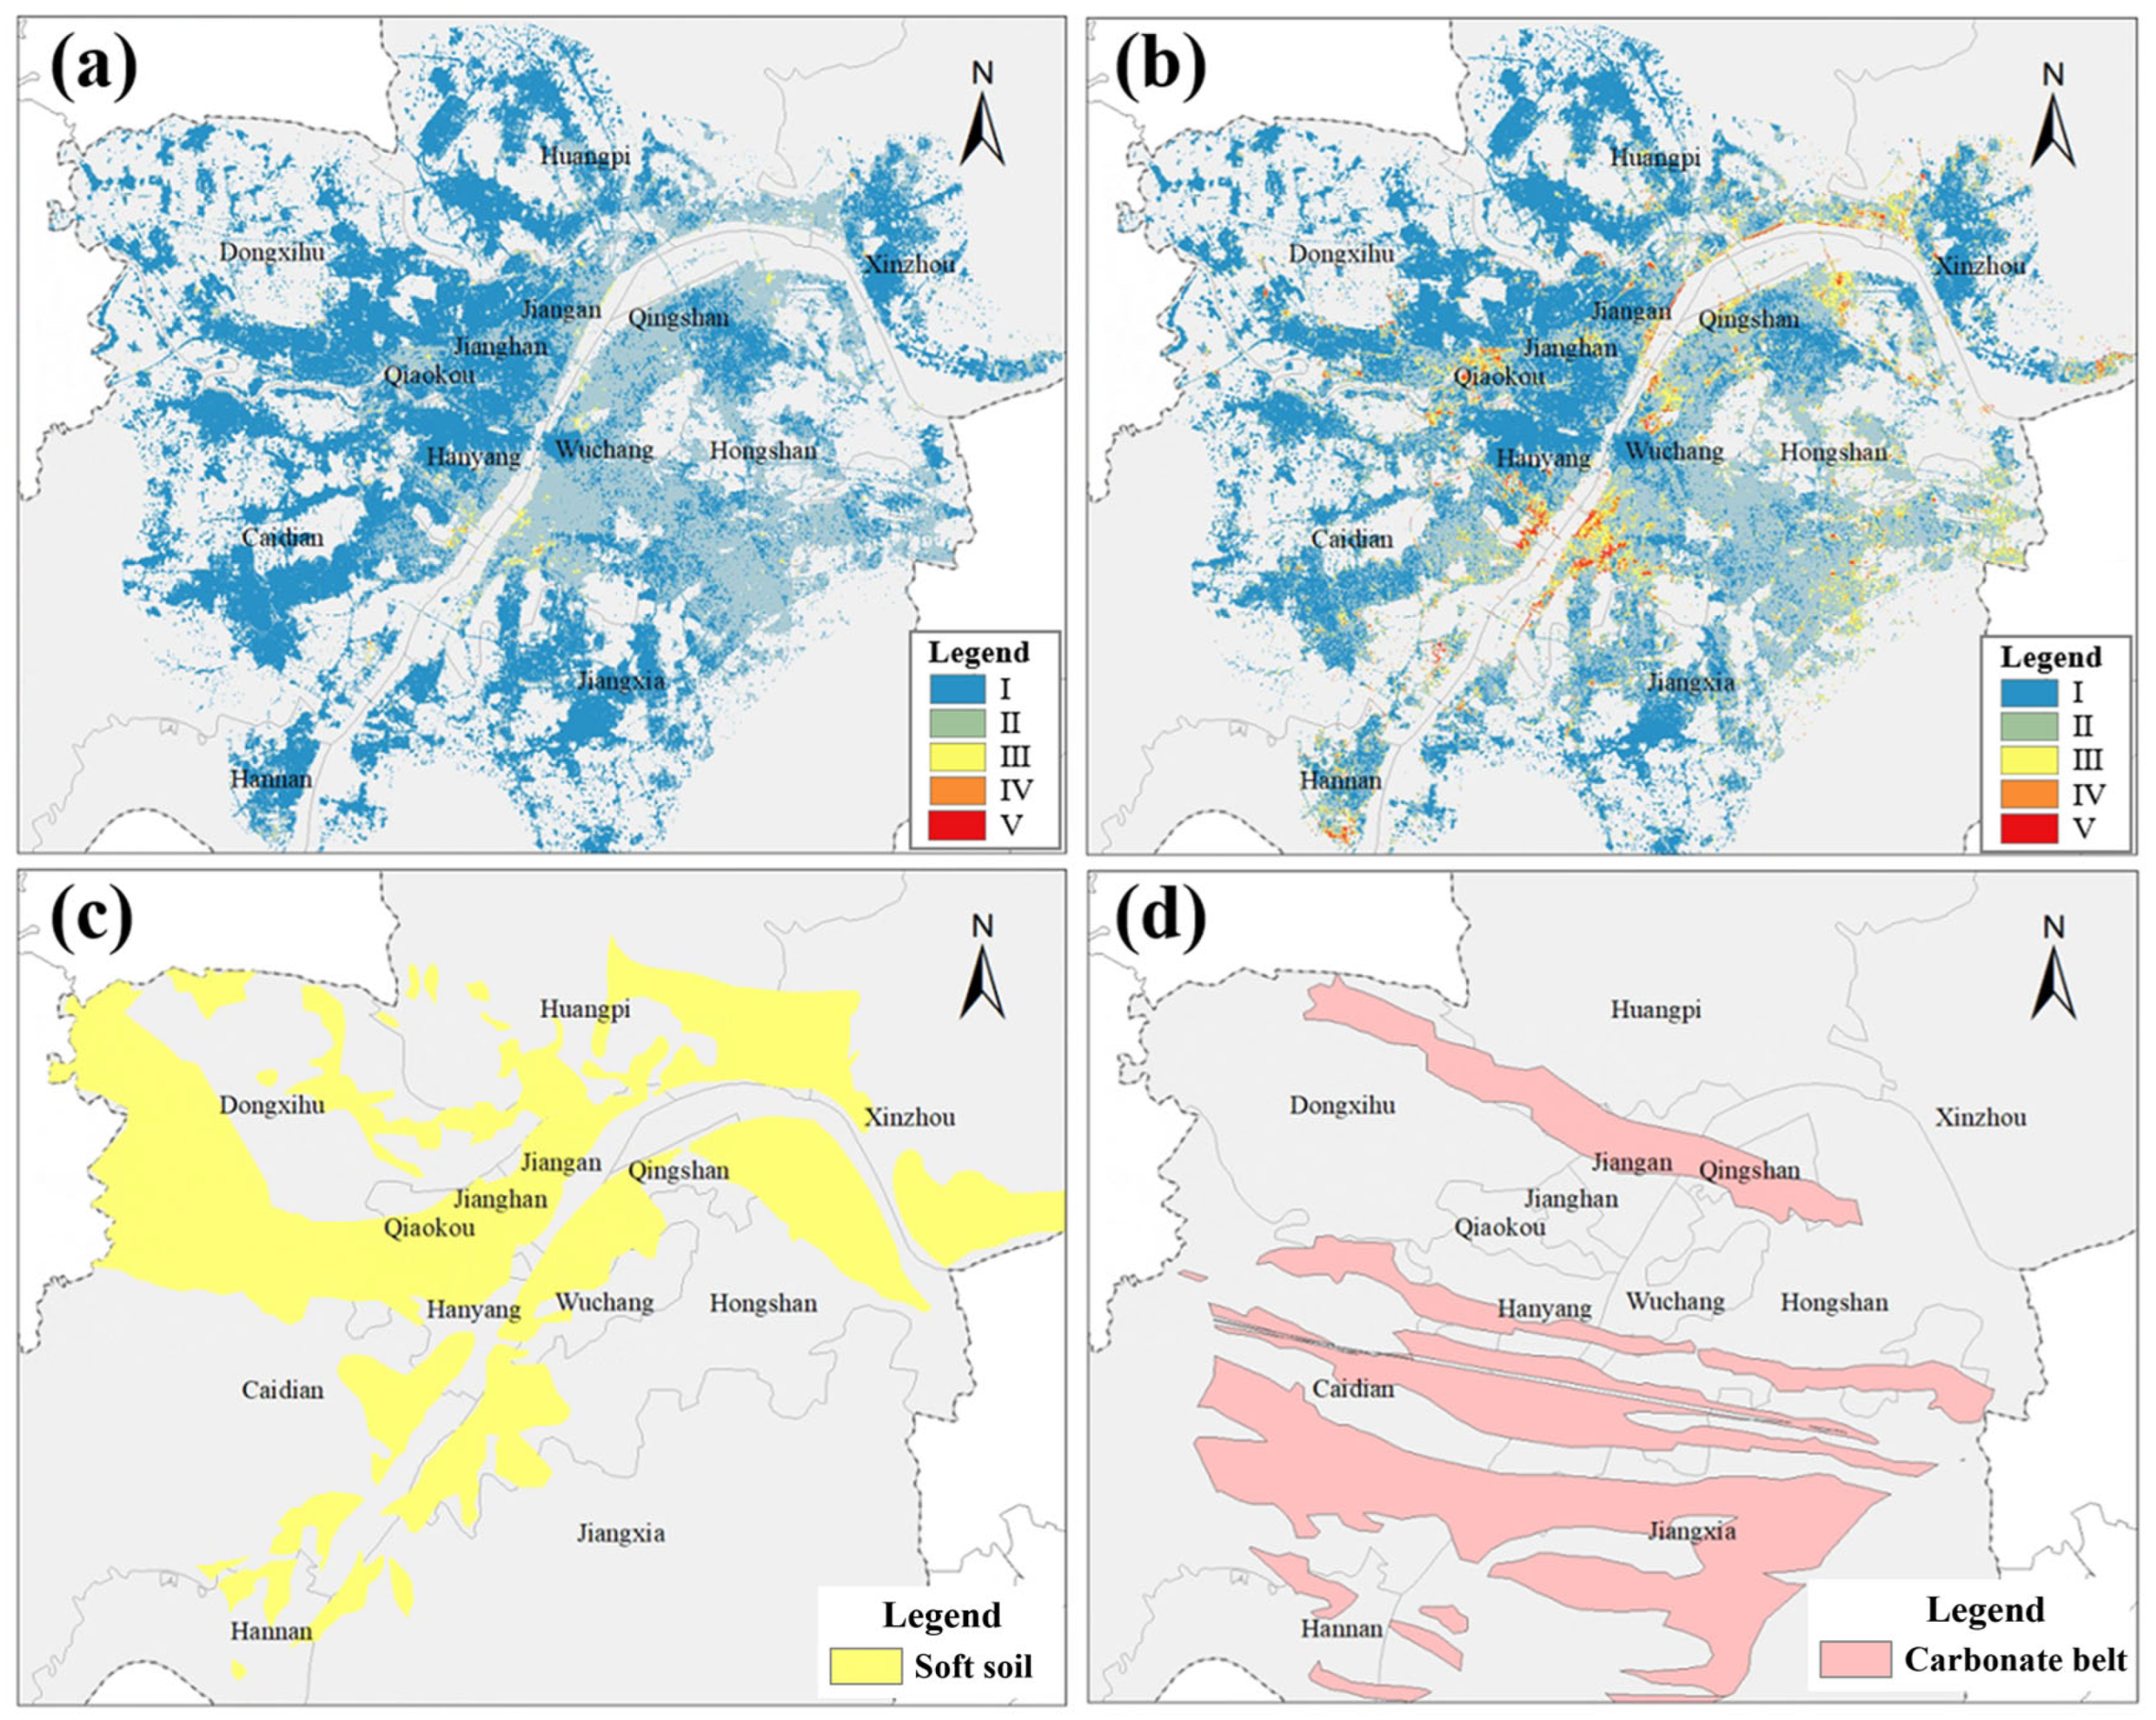
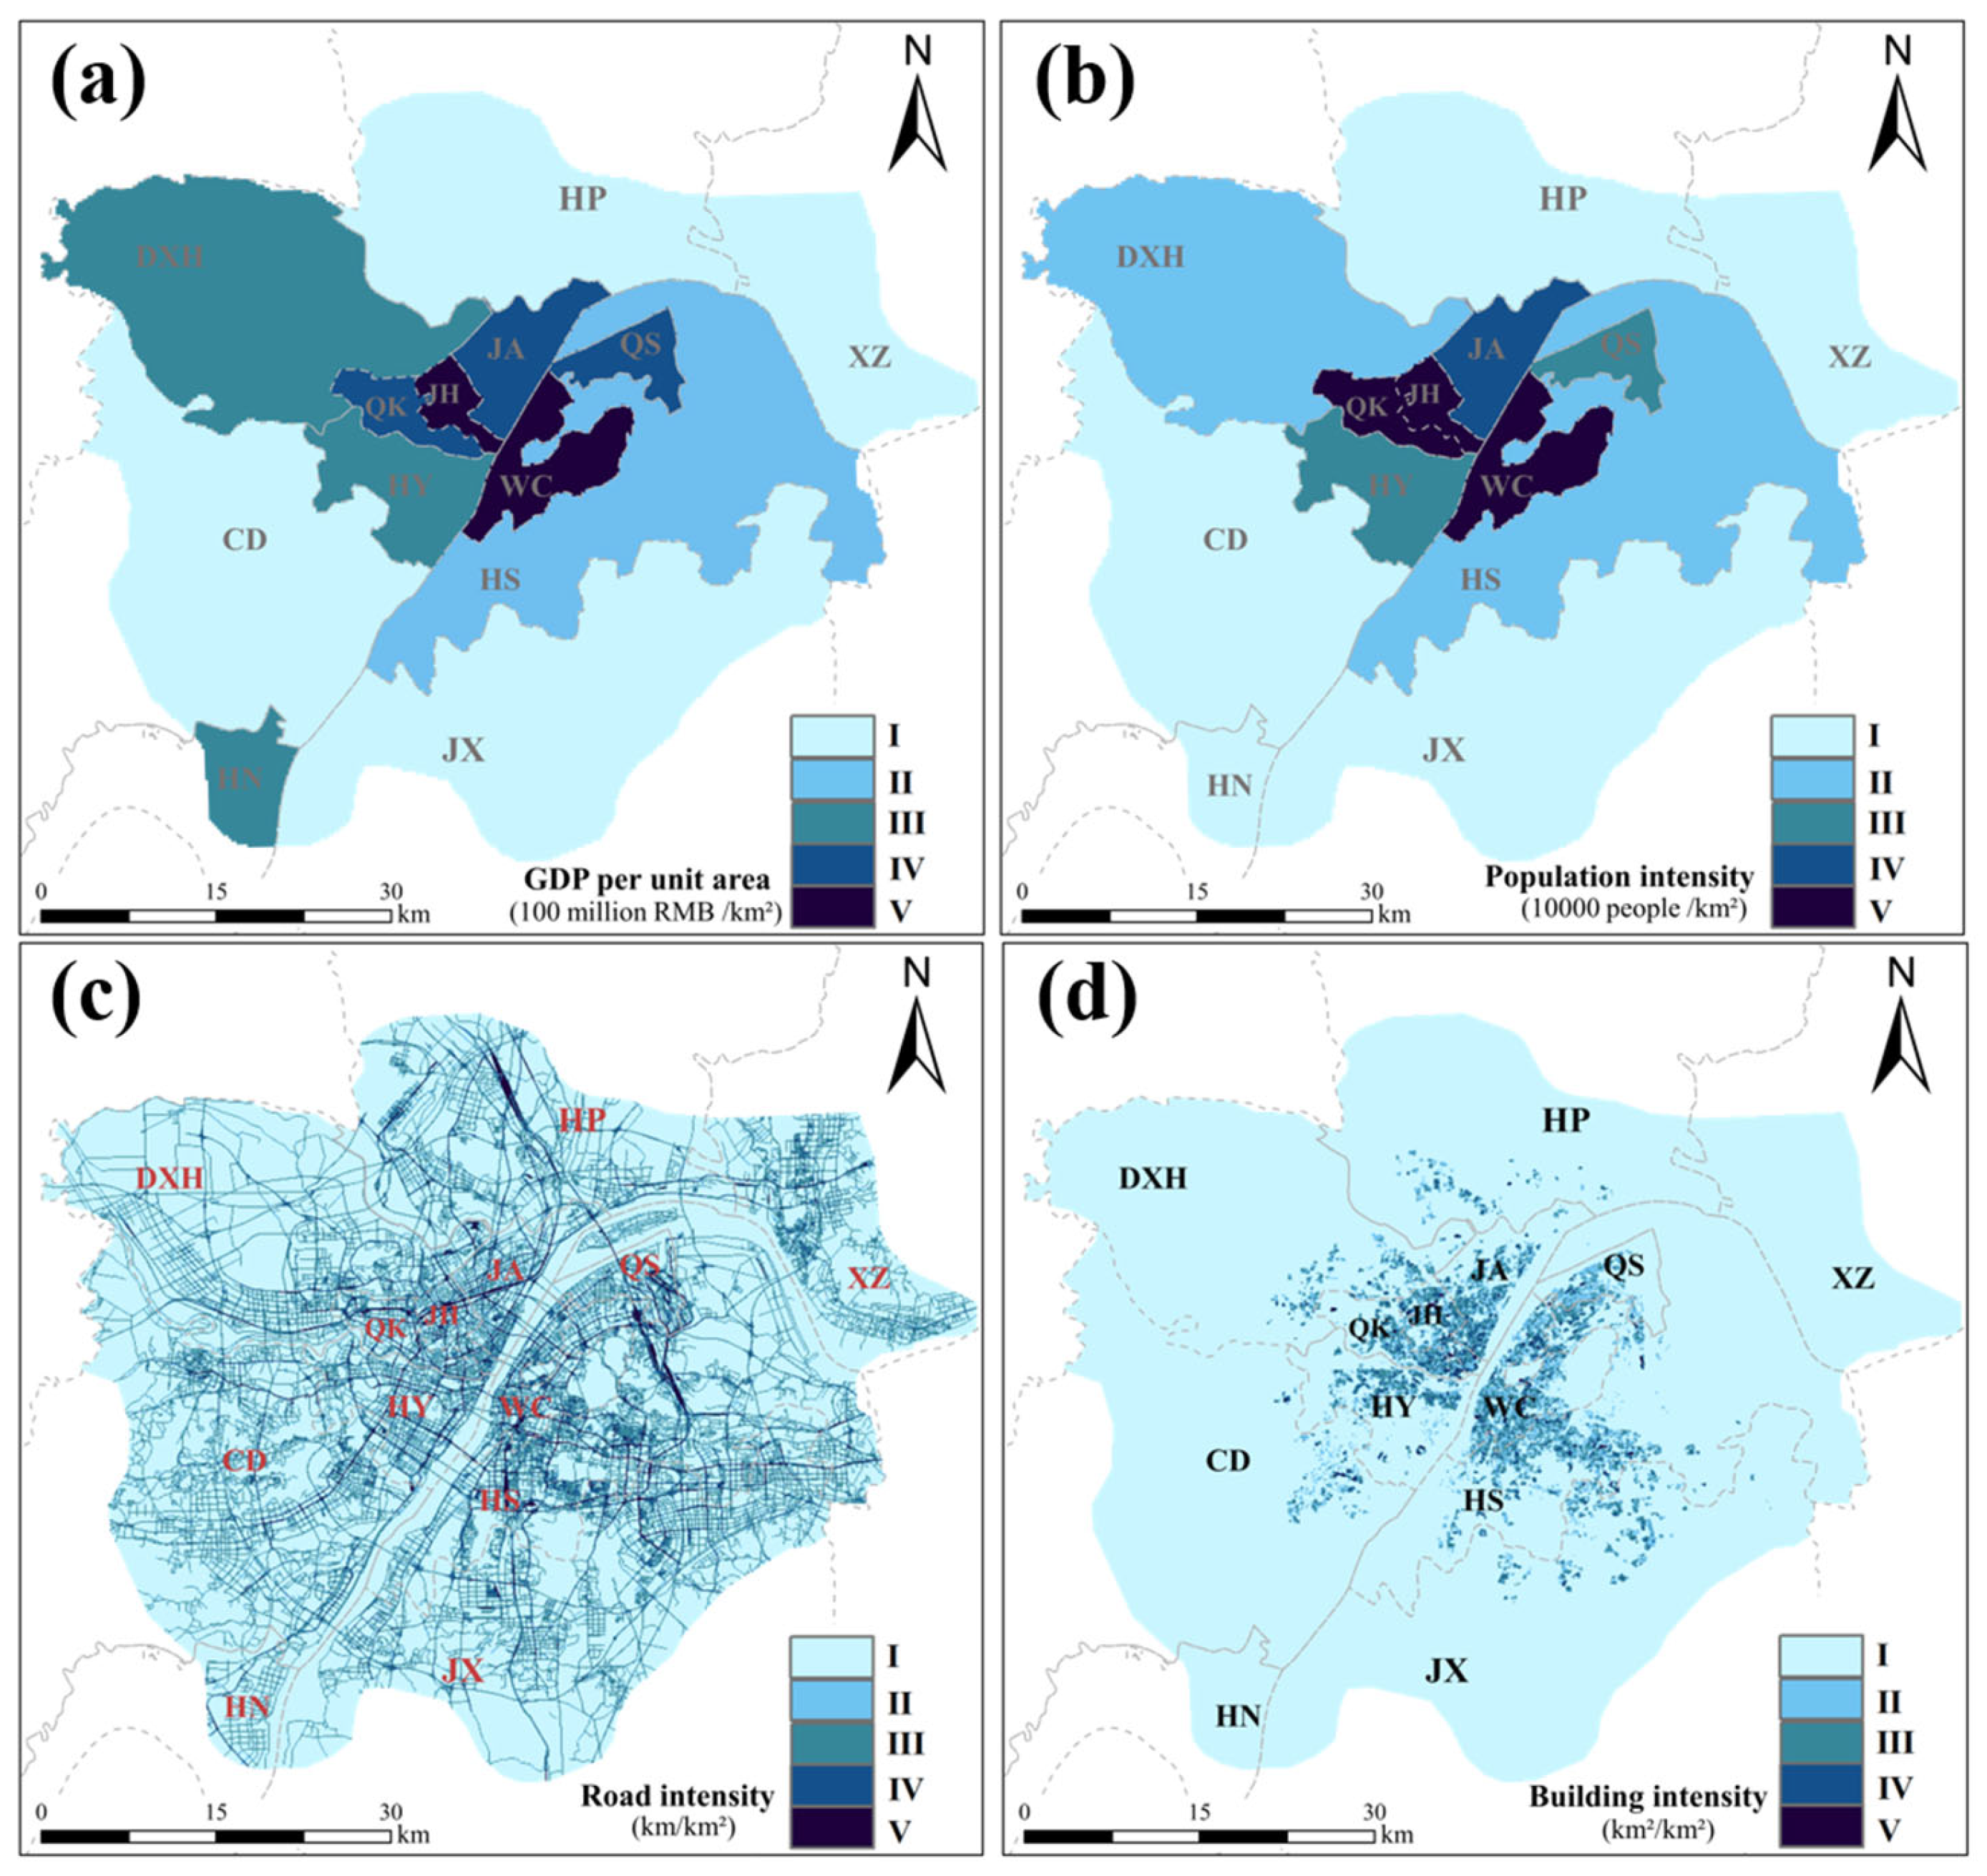
Based on the collected data from Wuhan, this study referenced previous research [45,46] and the specifications for the risk assessment of geological hazards (2021) to classify the evaluation factors of the hazard and vulnerability models into five levels (Table 1), ranked from low to high according to their suitability or compliance. In order to facilitate the comparison of the individual factors with each other, we normalized these eight factors before superimposing the analyses. The four assessment index factors for hazard are shown in Figure 8, and the four assessment index factors for vulnerability are shown in Figure 9.

Table 1.
Land subsidence risk zoning indicator classes.
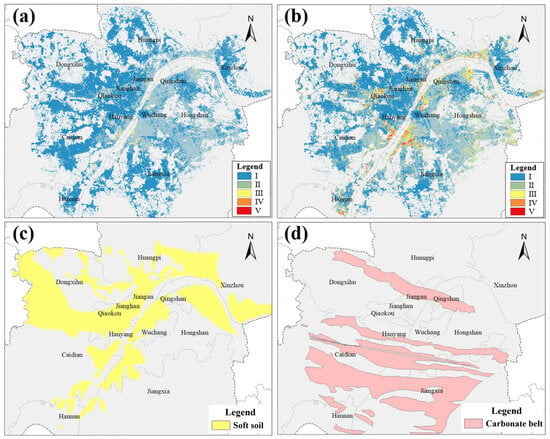
Figure 8.
Hazard factor zoning results for (a) subsidence velocity (SV); (b) cumulative deformation (CUD); (c) soft soil (SS); (d) carbonate belt (CB).
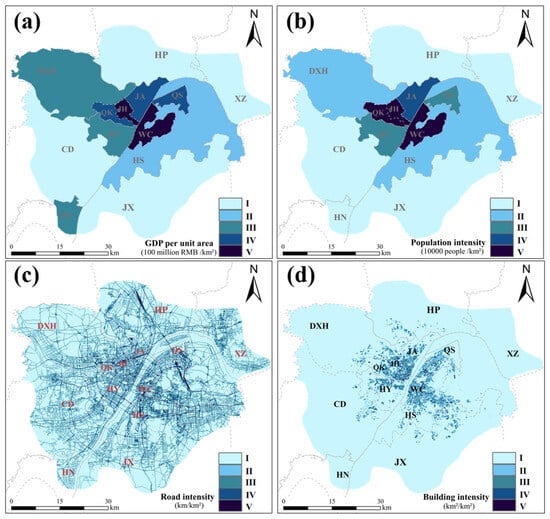
Figure 9.
Vulnerability assessment factor zoning results for (a) GDP per unit area; (b) population density; (c) road density; (d) building density.
4. Discussion
4.1. Land Subsidence and Urbanization
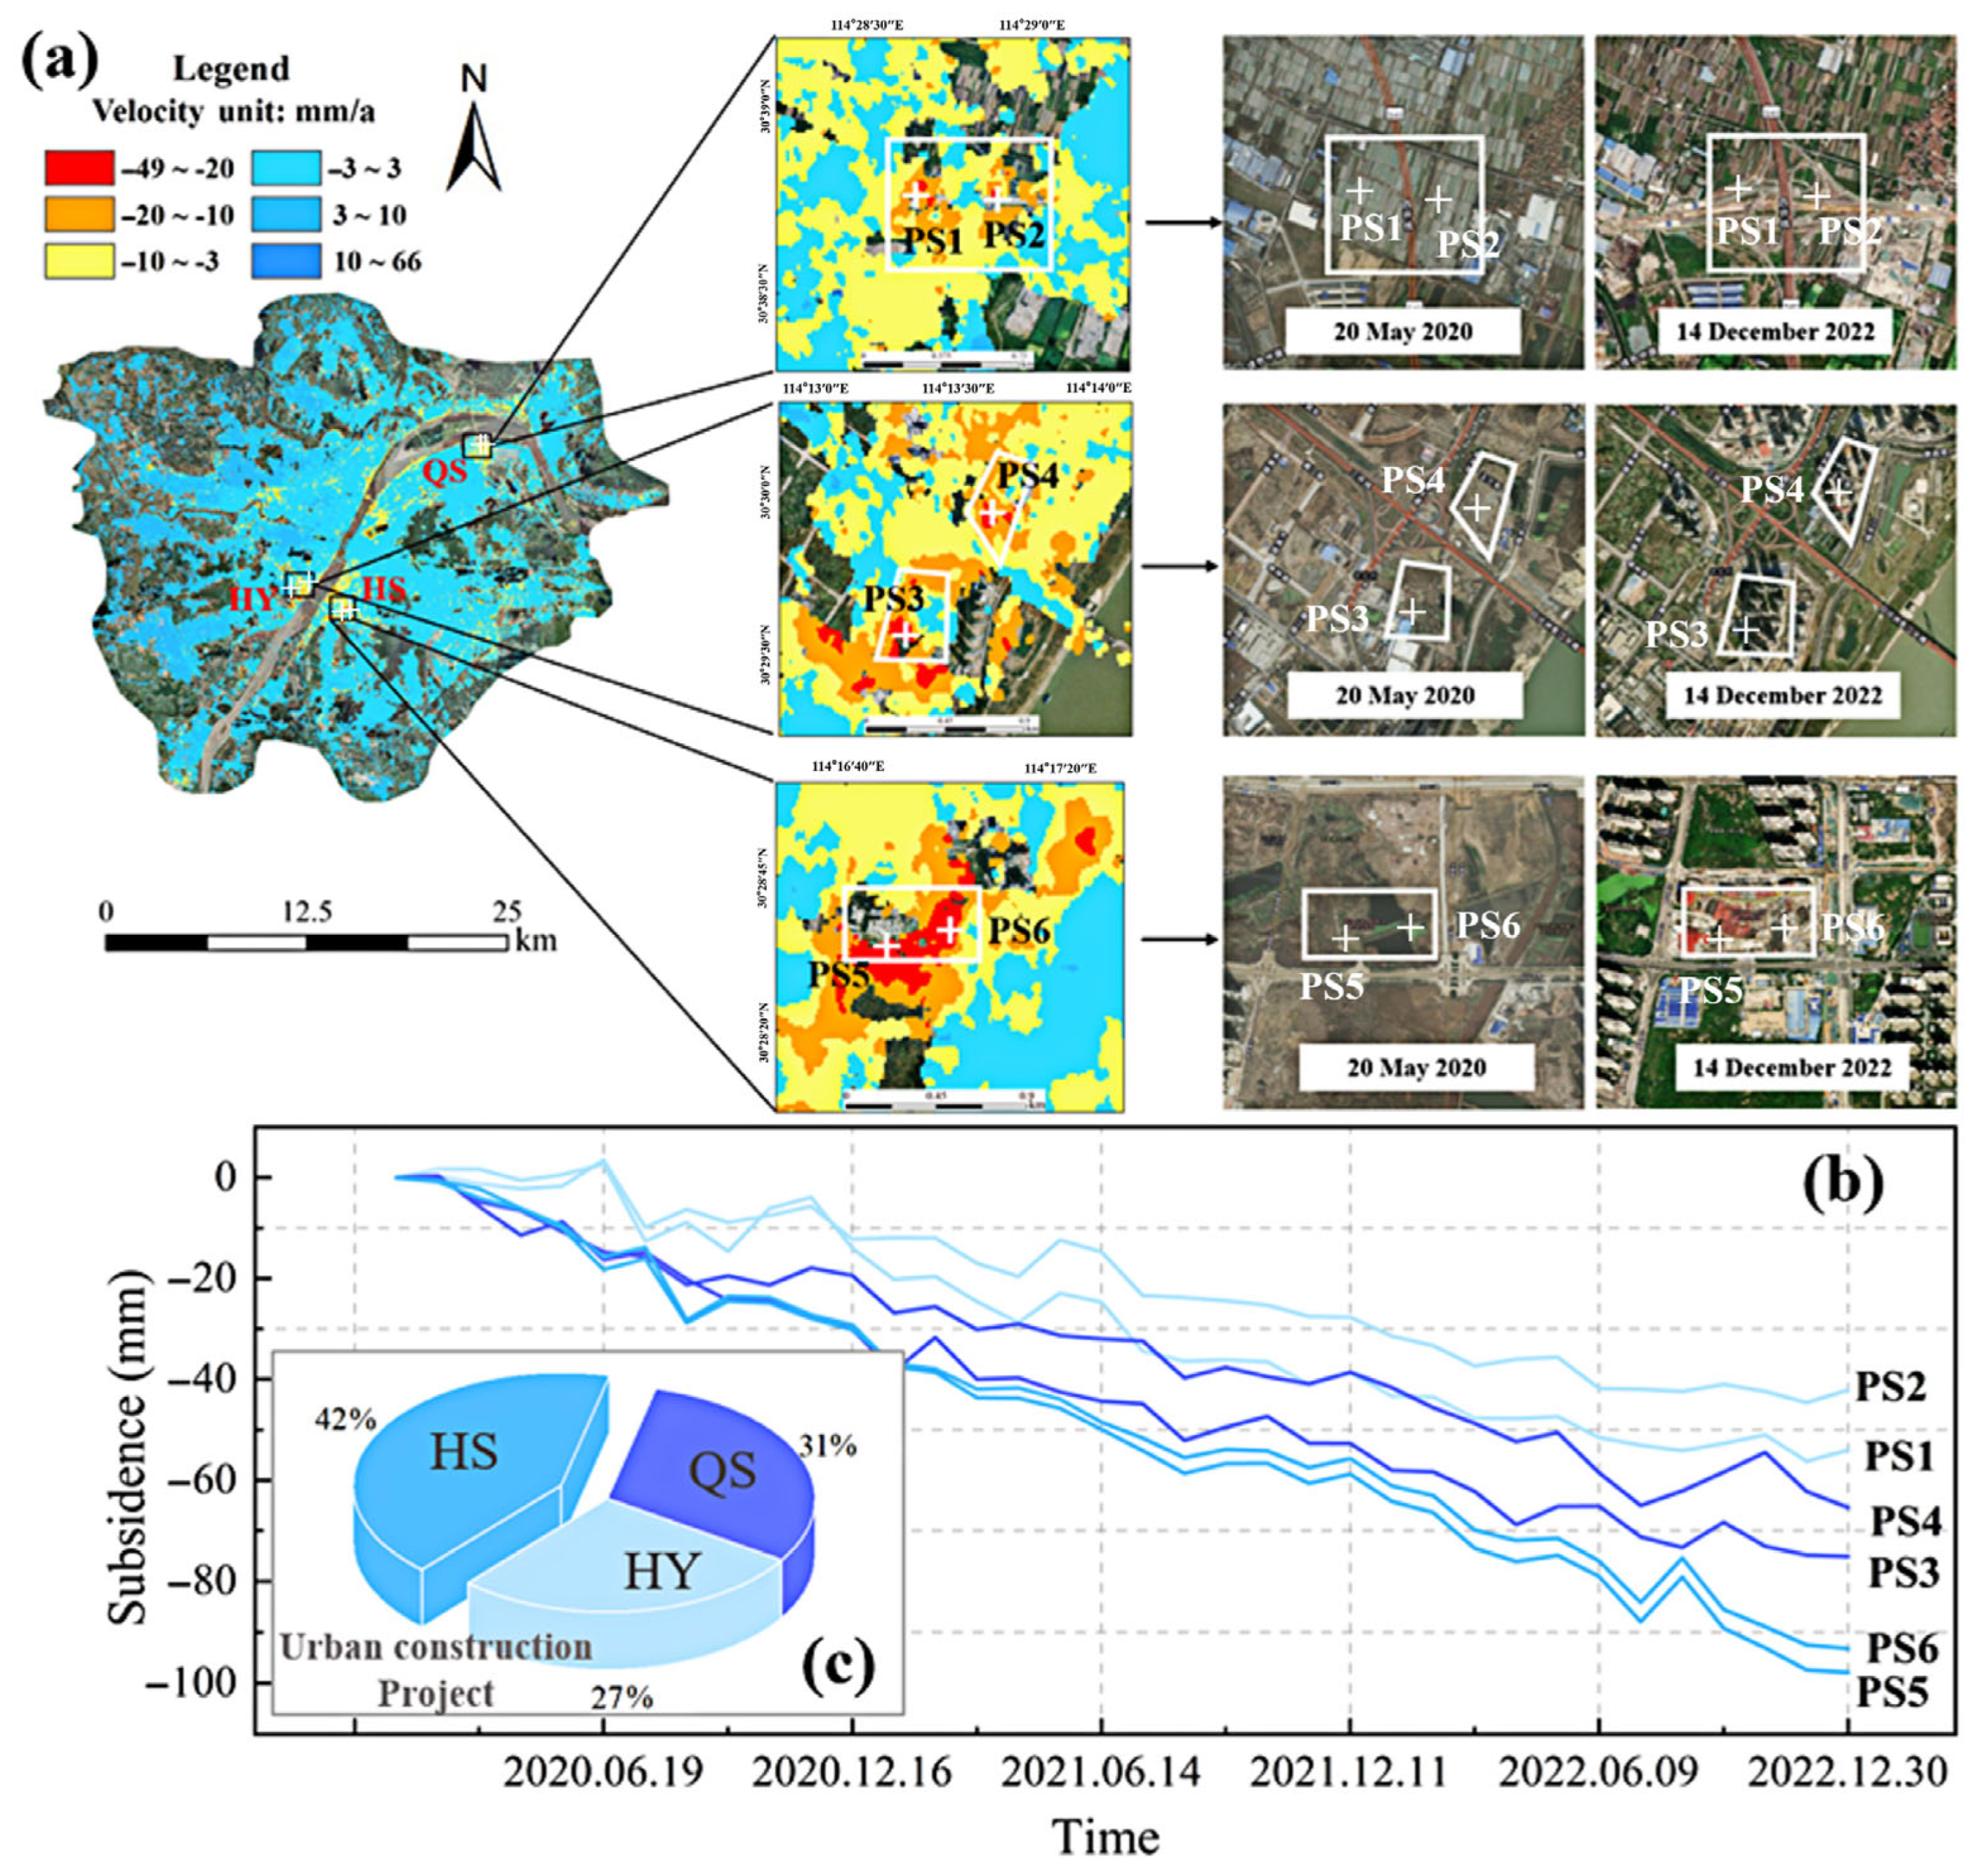
This section focuses on the three prominent subsidence zones in QS, HS, and HY. Figure 10a presents the spatial pattern of subsidence rates and topographic variation in the specified regions during the period from 2020 to 2022 (construction zones are marked with white boxes). Two target points (white cross in Figure 10a) within the subsidence centers of each zone were selected for time-series analysis, revealing cumulative subsidence exceeding −98 mm and a predominantly linear deformation trend (Figure 10b). In QS, the primary subsidence area was concentrated near PS1 and PS2 along Fourth Ring Road. The construction of overpass piers necessitated lake water drainage within the steel sheet pile cofferdams, reducing groundwater recharge and lowering water levels. Subsidence was relatively moderate during the 2020 rainy season but intensified after the road’s opening in early 2021. The delayed subsidence effects, combined with the increased ground load from operational traffic, resulted in a subsidence rate exceeding −32 mm/a due to insufficient surface buoyancy to counteract the pressure.
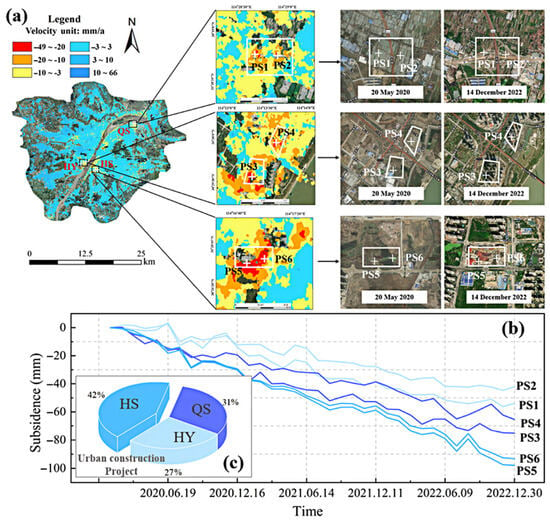
Figure 10.
(a) Sinkholes and urban construction changes in QS, HS, and HY; (b) cumulative deformation time series at PS points; (c) distribution of key urban construction projects.
Figure 10c illustrates the proportional distribution of major urban construction activities across the QS, HY, and HS Districts during the period of 2020–2021. Among these regions, HS exhibited the highest frequency of construction projects, which corresponded spatially and temporally with the most extensive subsidence area and the maximum observed subsidence rates. These findings suggest a strong correlation between urban construction and subsidence distribution. The underlying mechanism can be attributed to the engineering practices associated with large-scale construction, particularly deep foundation pit excavations. Such projects often necessitate extensive groundwater drainage to ensure structural stability during excavation. The resultant decline in pore water pressure within compressible soil strata, especially in soft clay or silt layers, accelerates land subsidence. These insights emphasize the need for integrated groundwater management and subsidence mitigation strategies in urban planning.
4.2. Land Subsidence Induced by Underground Construction
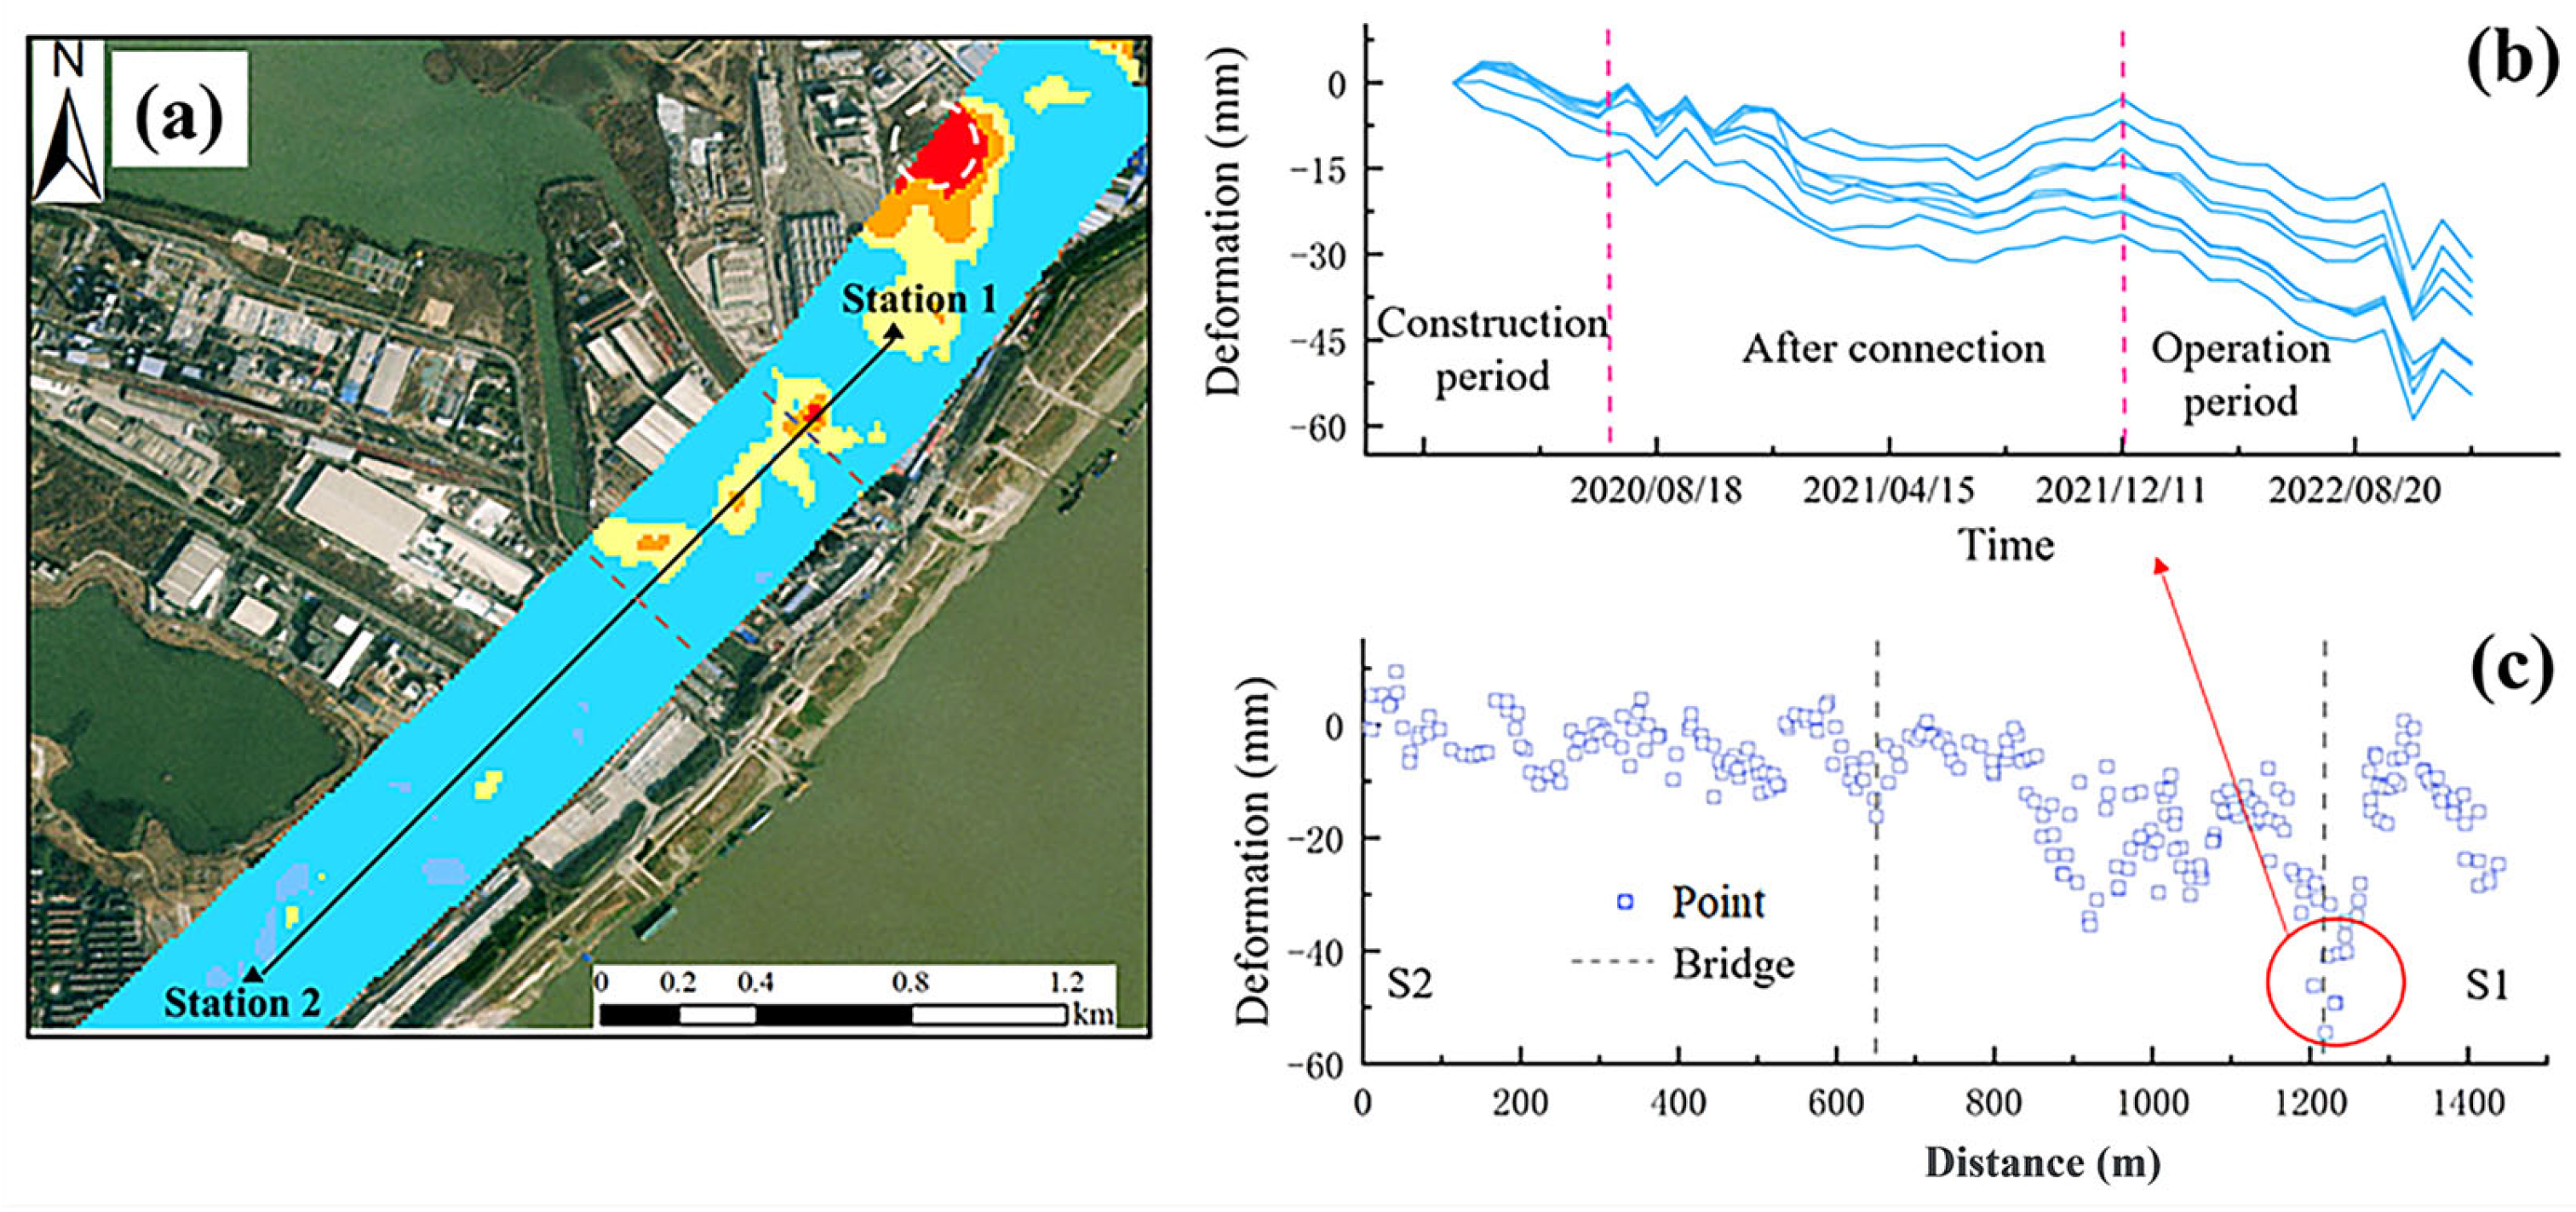
In this section, a 400 m buffer centered on the Wuhan metro lines was delineated, from which the subsidence rates were extracted. It was found that there was significant subsidence along the metro line in HY as shown in Figure 11a. In particular, the white area in the Figure 11a, the intersection of Metro Line 16 and Line 6, had more serious subsidence. The subsidence rate reached −30 mm/a, which was likely to be caused by the nearby industrial park and the metro station together. Due to the epidemic which delayed the schedule, the through tunnel of Line 16 from Chaokou Station to Lao Guancun Station interval resumed boring only in March 2020. It passed over two bridges and an area of soft soil. Constant drainage was required to ensure that the construction section was free of impregnation and excavation, which led to the compaction of highly compressible soft soils and induced subsidence phenomena. Figure 11c shows the section analysis of the corresponding metro stations in this paper, which showed significant subsidence around the metro stations, with the cumulative subsidence exceeding −89 mm in the severe subsidence zone centered on the Laoguancun station.
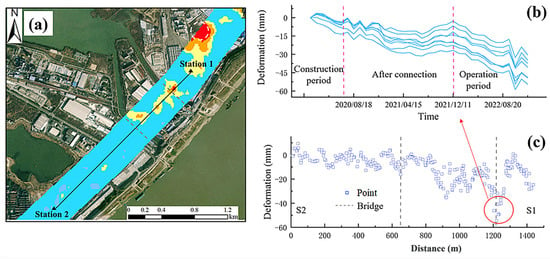
Figure 11.
S (a) Subsidence situation of Line 16; (b) Deformation in severely subsided sections of the line; (c) Cross-sectional deformation of Line 16.
Figure 11b selected the red circle area analyzed from the time Line 16 resumed tunnelling in March 2020, where the subsidence was more critical. In June, after the tunnel passed through, the subsidence was eased. In 2021, after the official start of the operation, the subsidence was slightly serious again. It can be assumed that the construction and operation of the underground project was related to subsidence.
4.3. Hydrogeological Effects on Land Subsidencce
Earlier research has indicated a measurable relationship between rainfall and urban land subsidence [40]. In this paper, four different reference points H, I, J, and K distributed in the area around the hydrological station were selected (Figure 12a). By analyzing their sedimentation time series against the monthly average precipitation (Figure 12b), the rainfall in 2020 was the most abundant and peaked in July. Overall, it can be seen that the rainfall changes were very close to the subsidence changes of the reference points and accompanied by seasonal changes. The rainy weather in Wuhan was concentrated in April to July. Correspondingly, the continuous heavy precipitation makes the surface have different degrees of uplift phenomenon. Yet some periods such as in 2022 from April to July, uplift or subsidence phenomenon occurred with a certain degree of delay. The deformation trends are illustrated by arrows in Figure 12b, where upward arrows indicate subsidence mitigation while downward arrows represent aggravated subsidence. When precipitation decreased substantially in May 2022, the corresponding downward deformation trend was not observed until June. Similarly, despite increased rainfall in July and August, deformation mitigation did not occur until September. These temporal patterns clearly demonstrate that rainfall influences surface deformation with a consistent time lag of approximately 1–2 months. In general, there was a certain linear correlation between rainfall and land subsidence. Seasonal rainfall contributed to land subsidence alleviation through the quaternary aquifer recharge. When the submergence level is higher than the compression water level, it can flow downward to recharge the compression aquifer, which can alleviate, to a certain extent, the land subsidence caused by the lowering of the groundwater level due to anthropogenic factors [47,48].

Figure 12.
(a) Time series of reference point sedimentation for 2020–2022; (b) changes in average monthly rainfall.
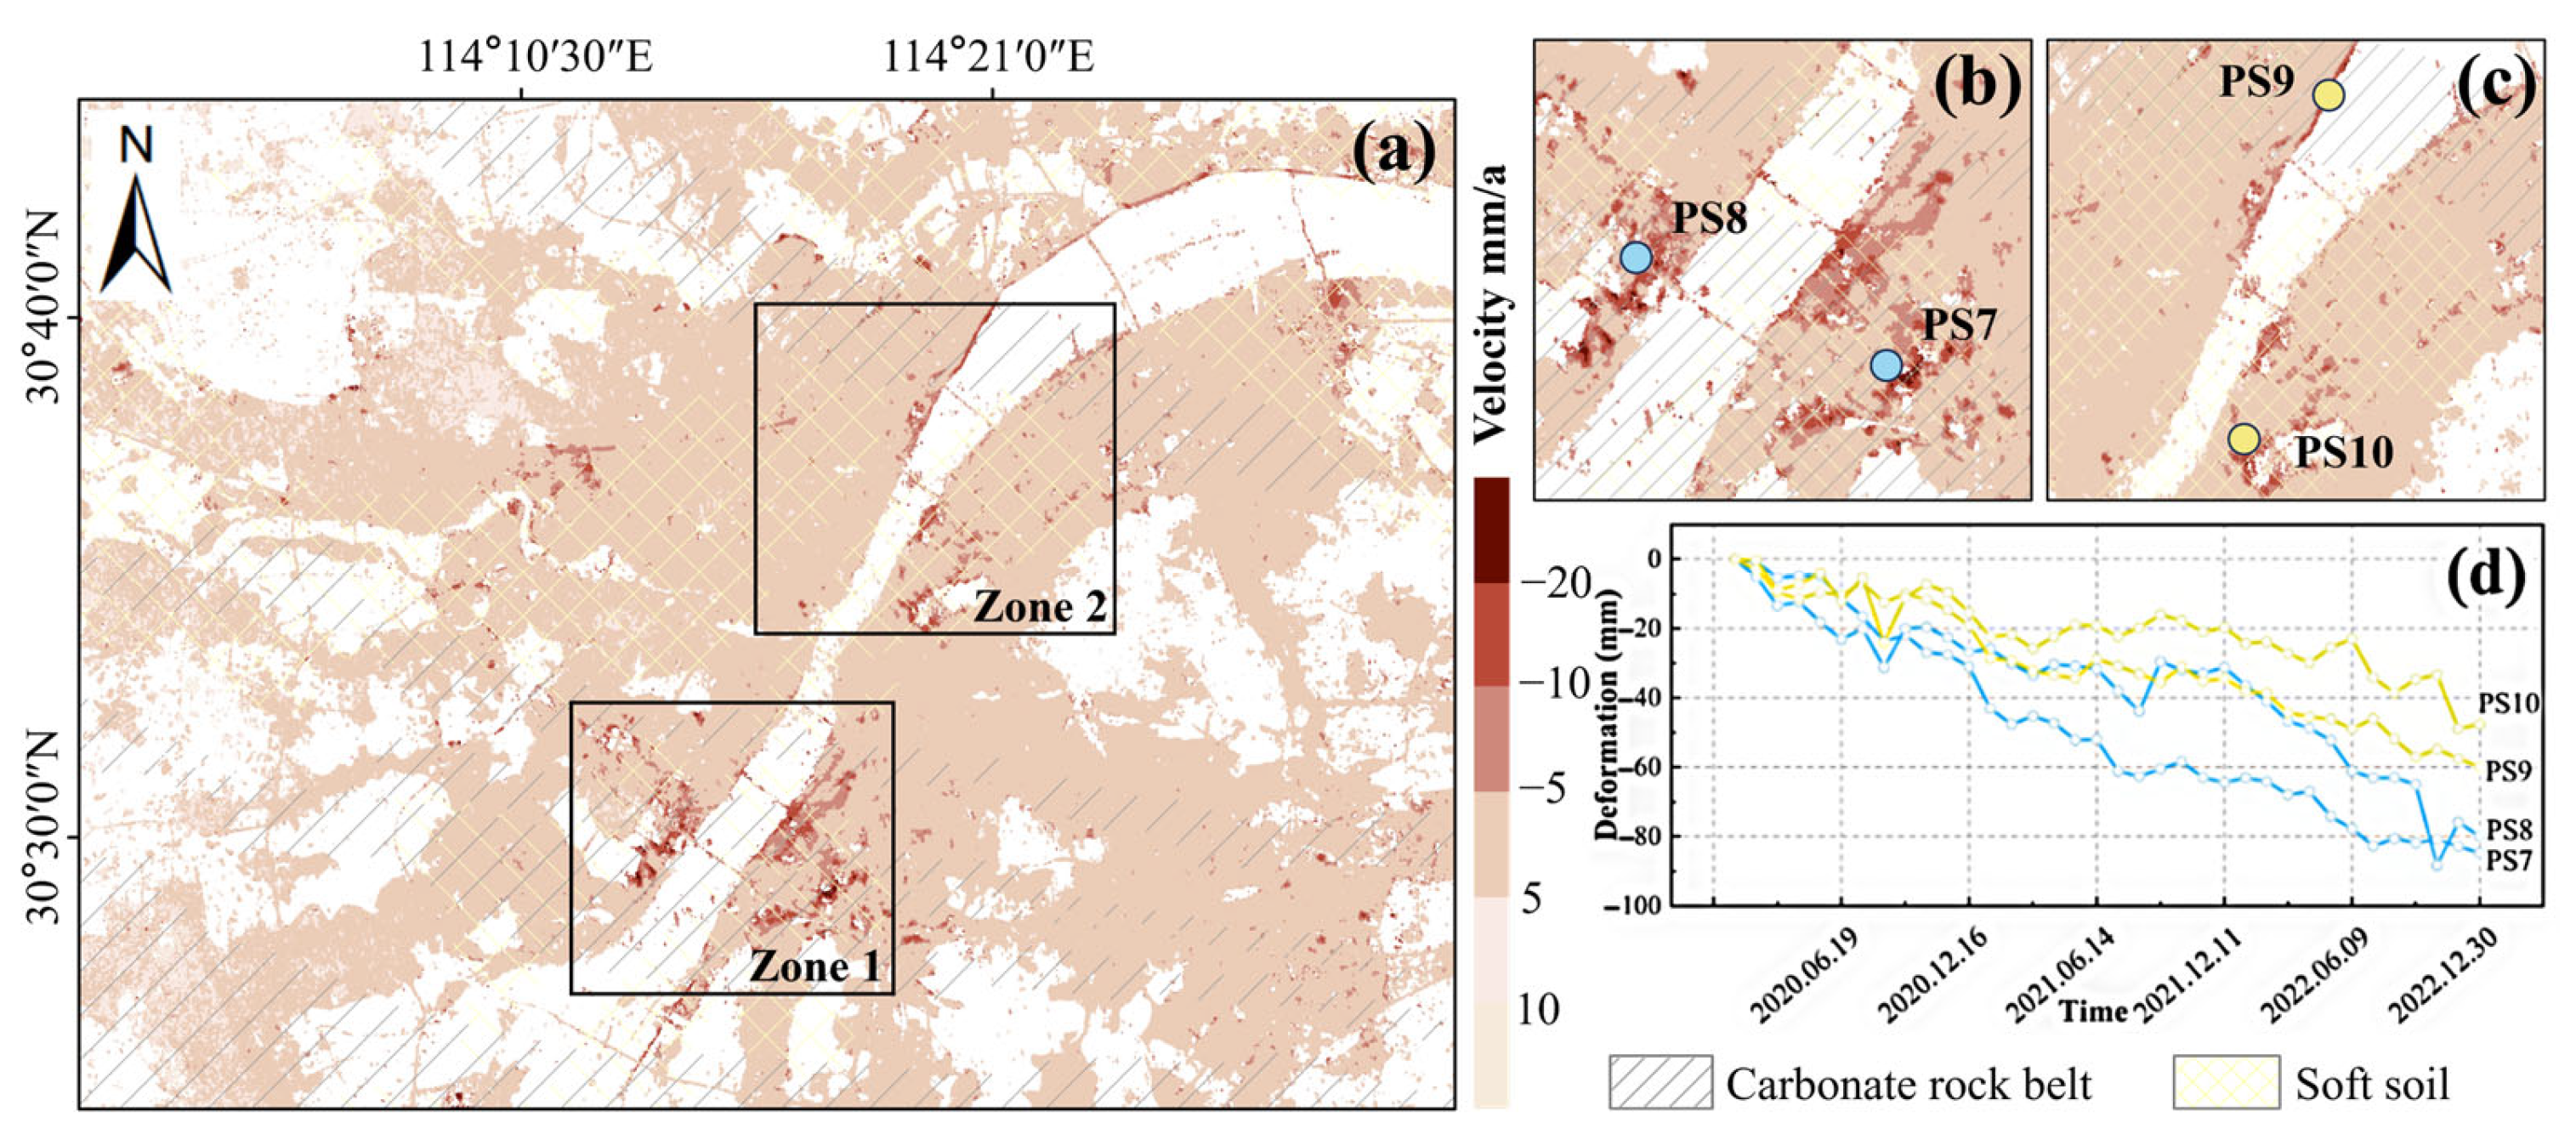
As reported in earlier studies, an increase in soft soil thickness is generally accompanied by a corresponding rise in the subsidence rate [19]. In this study, two characteristic points were selected from each delineated area to observe their cumulative settlement curves. As shown in Figure 13, the most significant subsidence occurred at points PS7 and PS8 within the HS-BSZ carbonate zone and soft soil layer area, respectively. The PS7 cumulative subsidence exceeded −80 mm. The PS9 and PS10 subsidence were relatively gentle, both in the carbonate zone only and in the soft soil layer only, respectively. Taken together, it was hypothesized that the simultaneous action of the carbonate and soft soil layer distributions may have exacerbated the subsidence.
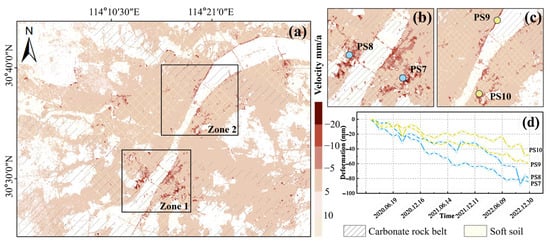
Figure 13.
(a) Relationship between land subsidence, carbonate, and soft soil layers with PS point cumulative displacement time series. (b) Detailed view: Zone 1; (c) detailed view: Zone 2; (d) The cumulative deformation of PS points.
In order to further explore the influence of hydrogeology in Wuhan, we summarized the hydrogeological characteristics of the water-bearing rock groups of the BSZ groundwater (Table 2). The groundwater in BSZ is mainly the pore water of loose rock types and karst water of carbonate rock fissures. The former is rich in water and highly permeable, while the latter has no water barrier between the water-bearing rock groups and is susceptible to dissolution, and they are both hydraulically well connected. Karst geological conditions offer pathways and void spaces for the migration and accumulation of overlying soil, facilitating the development of funnel-shaped loose zones or cavities in the subsurface, which in turn contribute to localized land subsidence. Therefore, man-made activities such as negative surface pressure or groundwater extraction can cause damage to the soil quality, thus triggering subsidence phenomena. Obviously, there is a link between hydrogeological conditions and land subsidence, but some of them are also stable in areas with carbonate or soft soil layers where subsidence is not significant. This suggests that hydrogeological conditions are a prerequisite for inducing the occurrence of subsidence.

Table 2.
Characteristics of water-bearing rock groups in the White Sands Island groundwater.
4.4. Analysis of the Land Subsidence Risk Assessment
4.4.1. Hazards
We used divergence and factor detection in Geodetector to detect the factors of ground subsidence within the main urban area of Wuhan. Thirty sampling points were randomly generated within the study area, and the values of each indicator were extracted. The factors were normalized and then weighted (Table 3).

Table 3.
Hazard indicator weights.
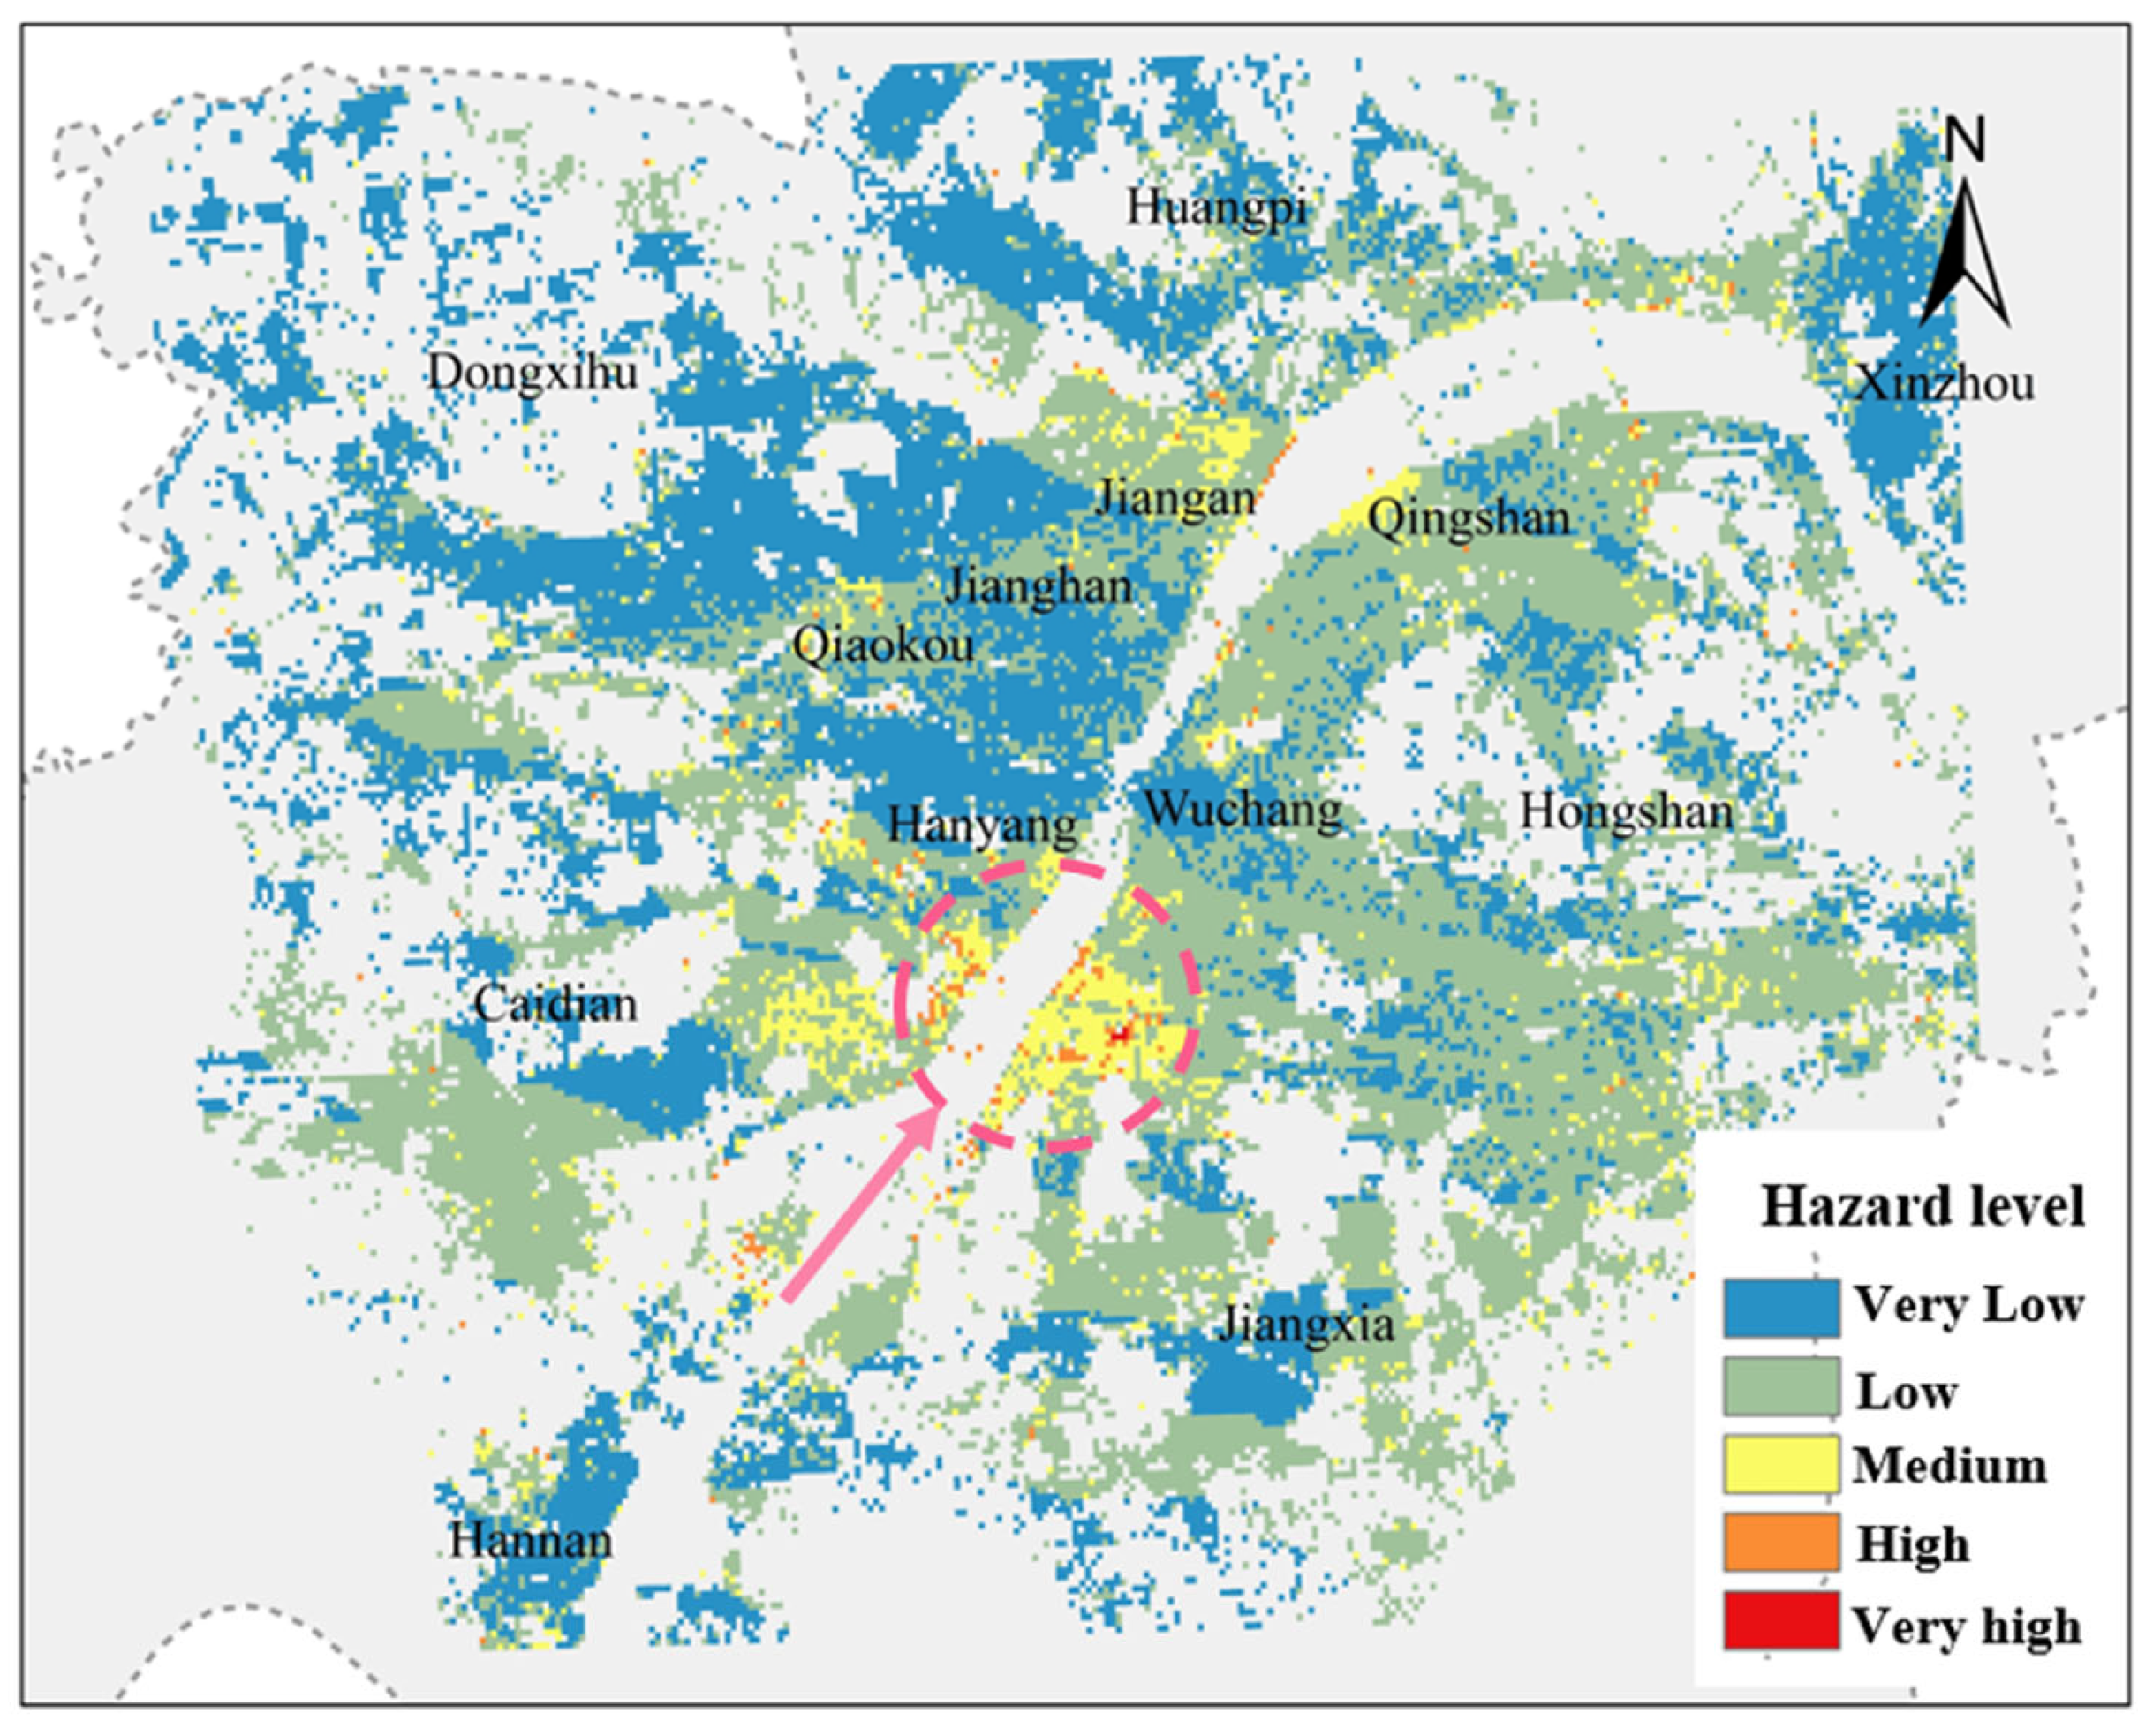
Figure 14 indicates that the majority of Wuhan’s central urban area fell within the low-risk zone for ground subsidence hazards, and HS is the main high-risk area (circled in red circles in Figure 13). There were some higher risk zones in the northern part of Jiangan District (JA), along the Yangtze River in QS, and in the HY and Caidian Districts (CD). Medium-risk zones mainly included most of JA, Qiaokou District (QK), JH, and QS. The results of the land subsidence hazard assessment in the main urban area of Wuhan were consistent with the high risk zone of geological hazards in Wuhan. The center of the city is densely populated and soft soils are widely distributed, while effects such as the excessive pumping of groundwater may trigger land subsidence.
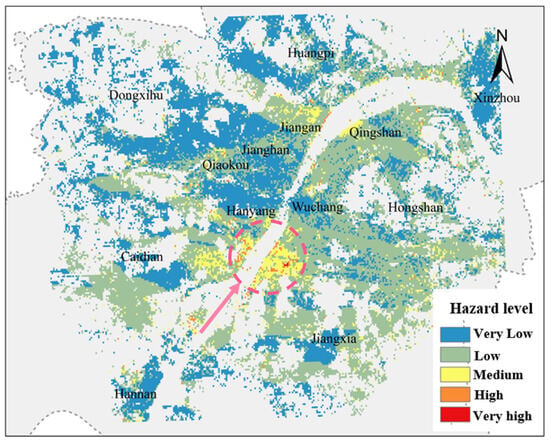
Figure 14.
Results of the hazard assessment (the red circle indicates a high-risk area located in the HS).
4.4.2. Vulnerability
A random sampling approach was implemented across the study area, generating 100 initial points for index value extraction. Following quality control procedures that excluded sampling points with null road and building density value, 30 valid sample sets were retained for analysis. The EWM was applied to determine factor weights, yielding the vulnerability distribution shown in Figure 15. The weights of the land subsidence vulnerability indicators for Wuhan’s main urban area, calculated using the EWM, are presented in Table 4, with the Unit GDP density exhibiting higher weighting than other indicators.
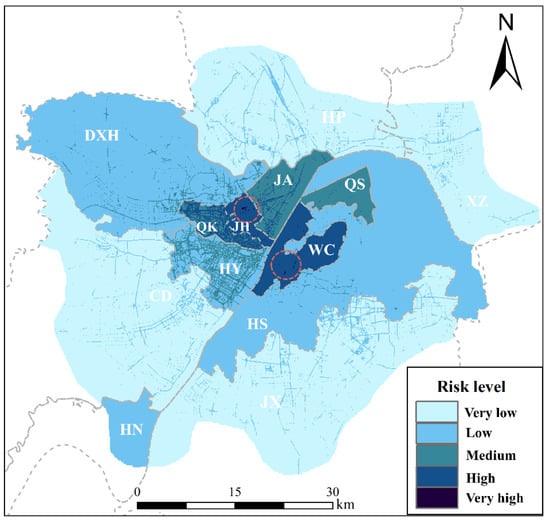
Figure 15.
Results of the vulnerability assessment (the red circle indicates the high-risk area).

Table 4.
Vulnerability indicator weights.
Spatial analysis revealed that medium-to-high vulnerability risks in Wuhan were predominantly concentrated in the urban core, with the Jianghan (JH) and Wuchang (WC) Districts exhibiting the highest susceptibility levels. Secondary high-risk zones included the JA, QS, and HY Districts, particularly along the Yangtze and Han River waterfronts. These areas correlated strongly with regions of intensive economic activity, high population density, and developed transportation infrastructure. The observed vulnerability patterns demonstrated a clear positive relationship with urban development intensity across Wuhan’s administrative districts.
4.4.3. Results of the Risk Assessment of Wuhan
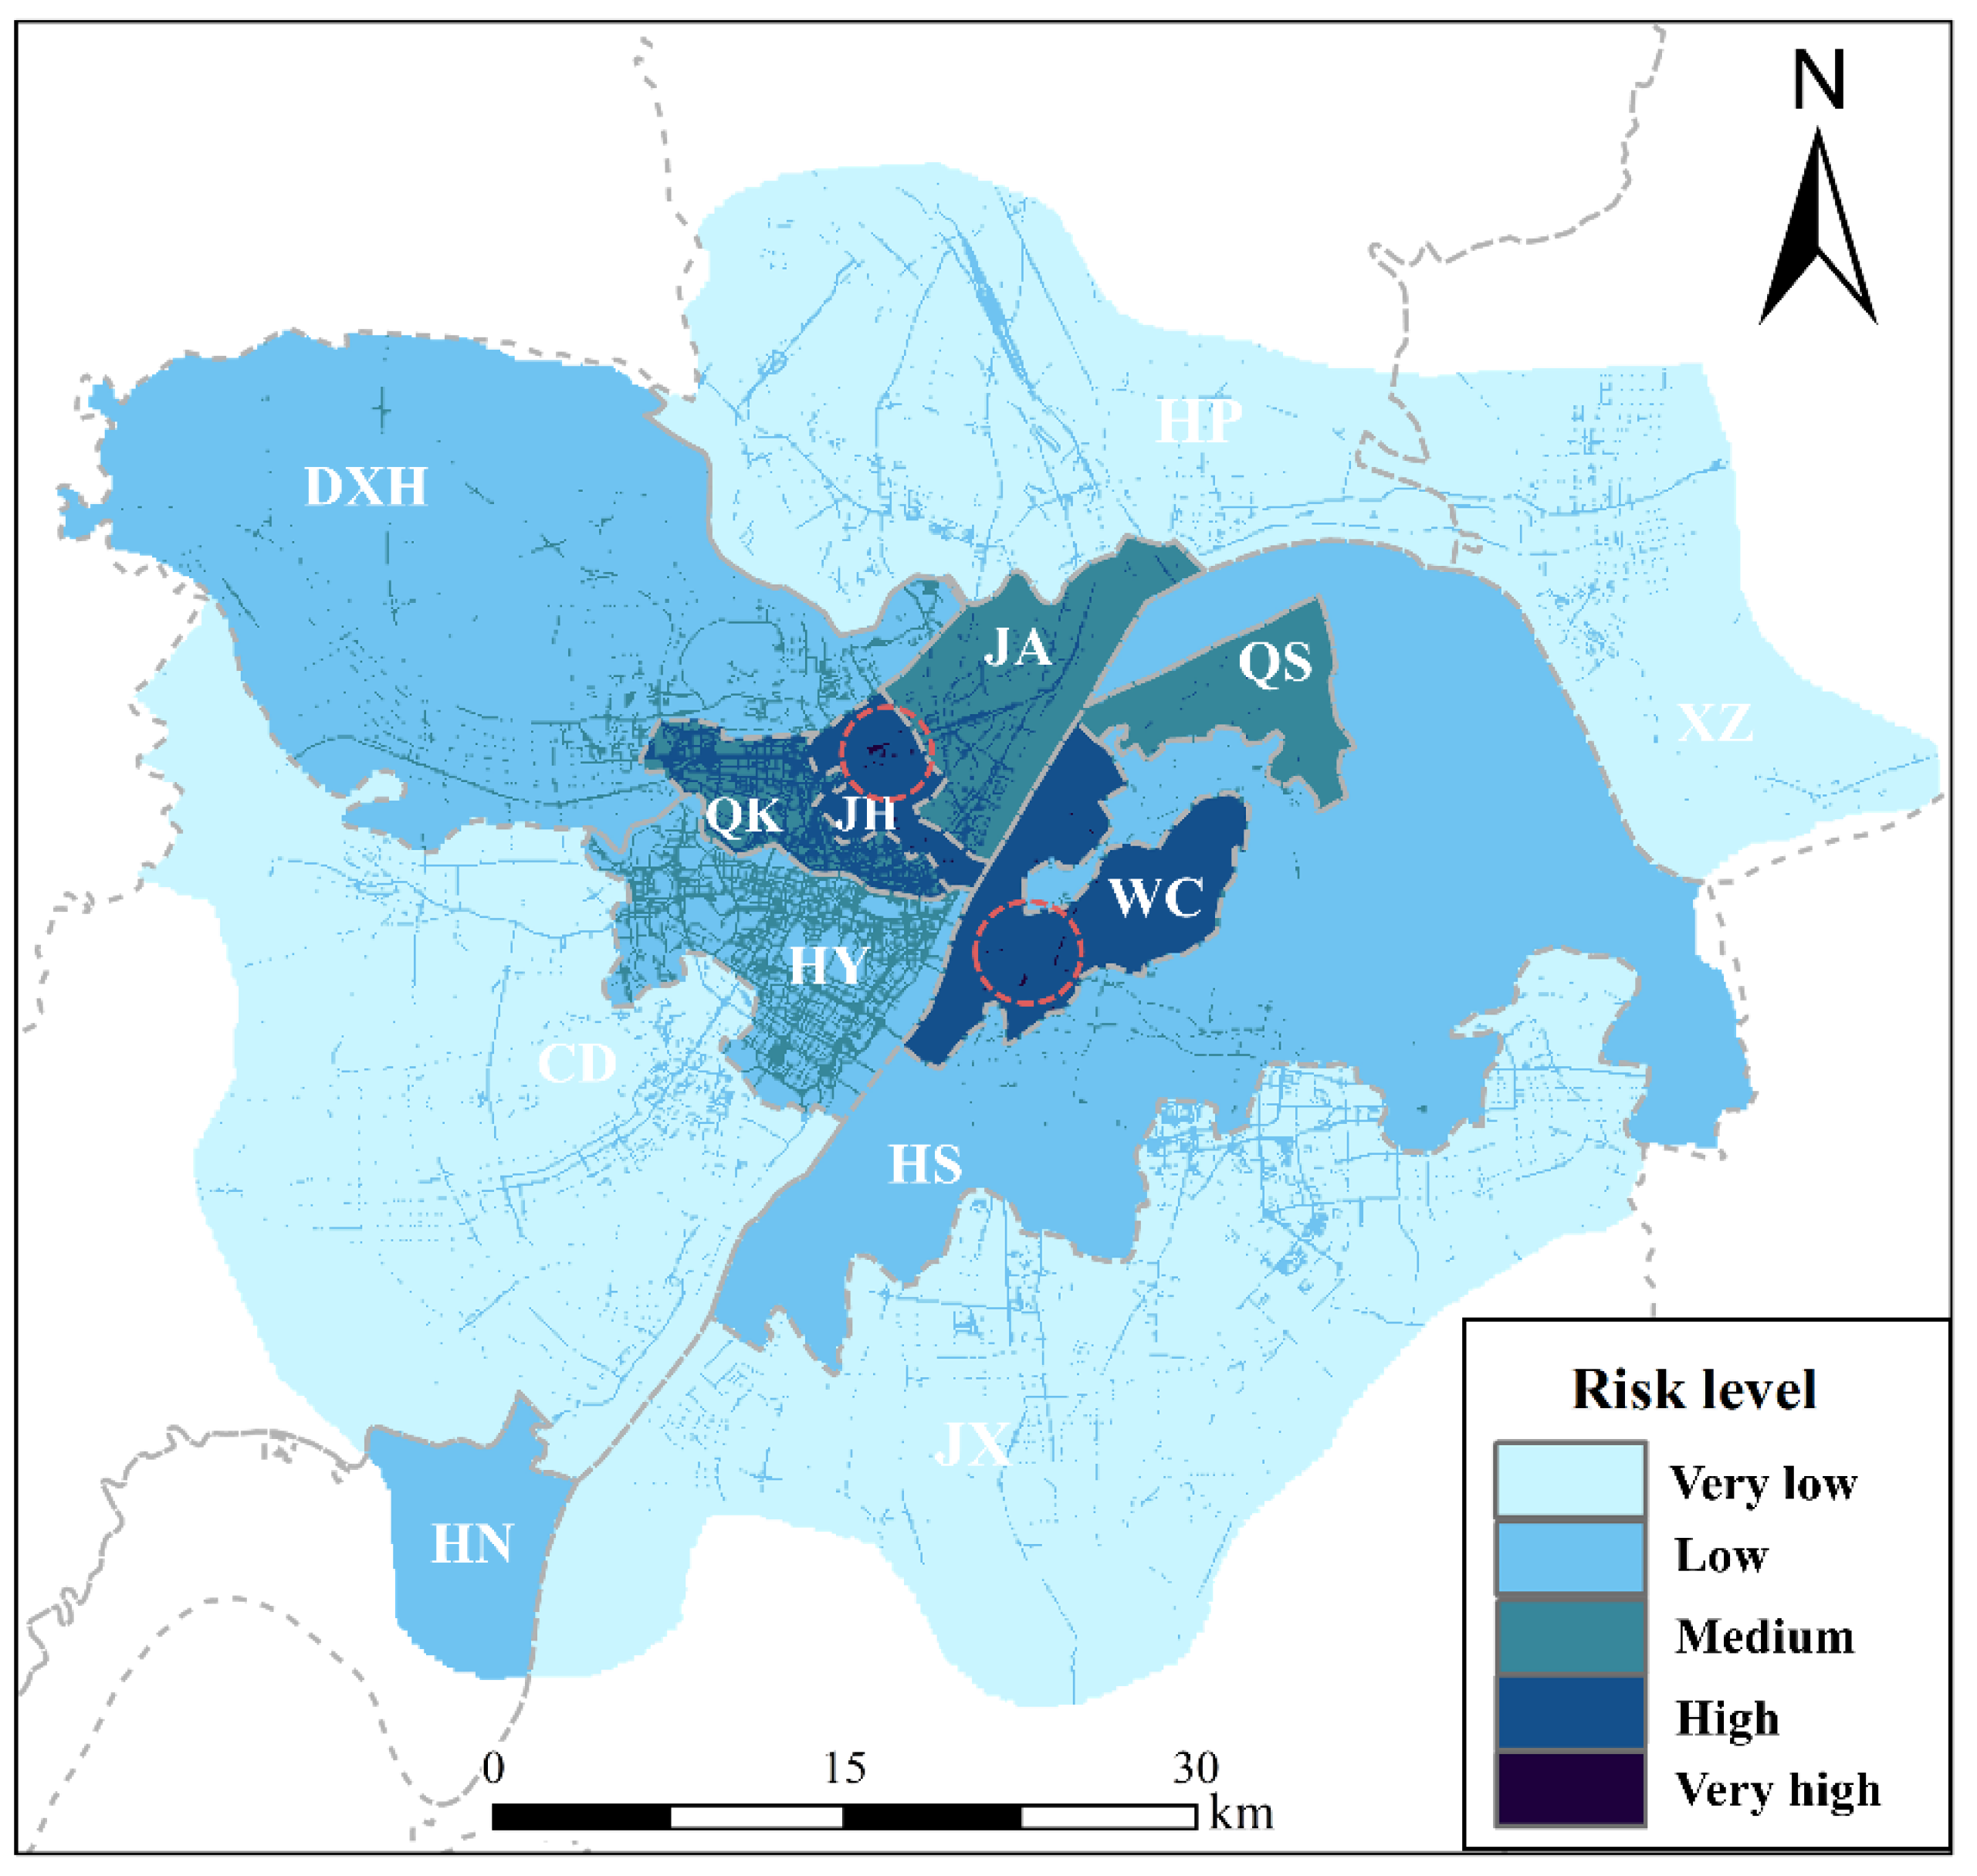
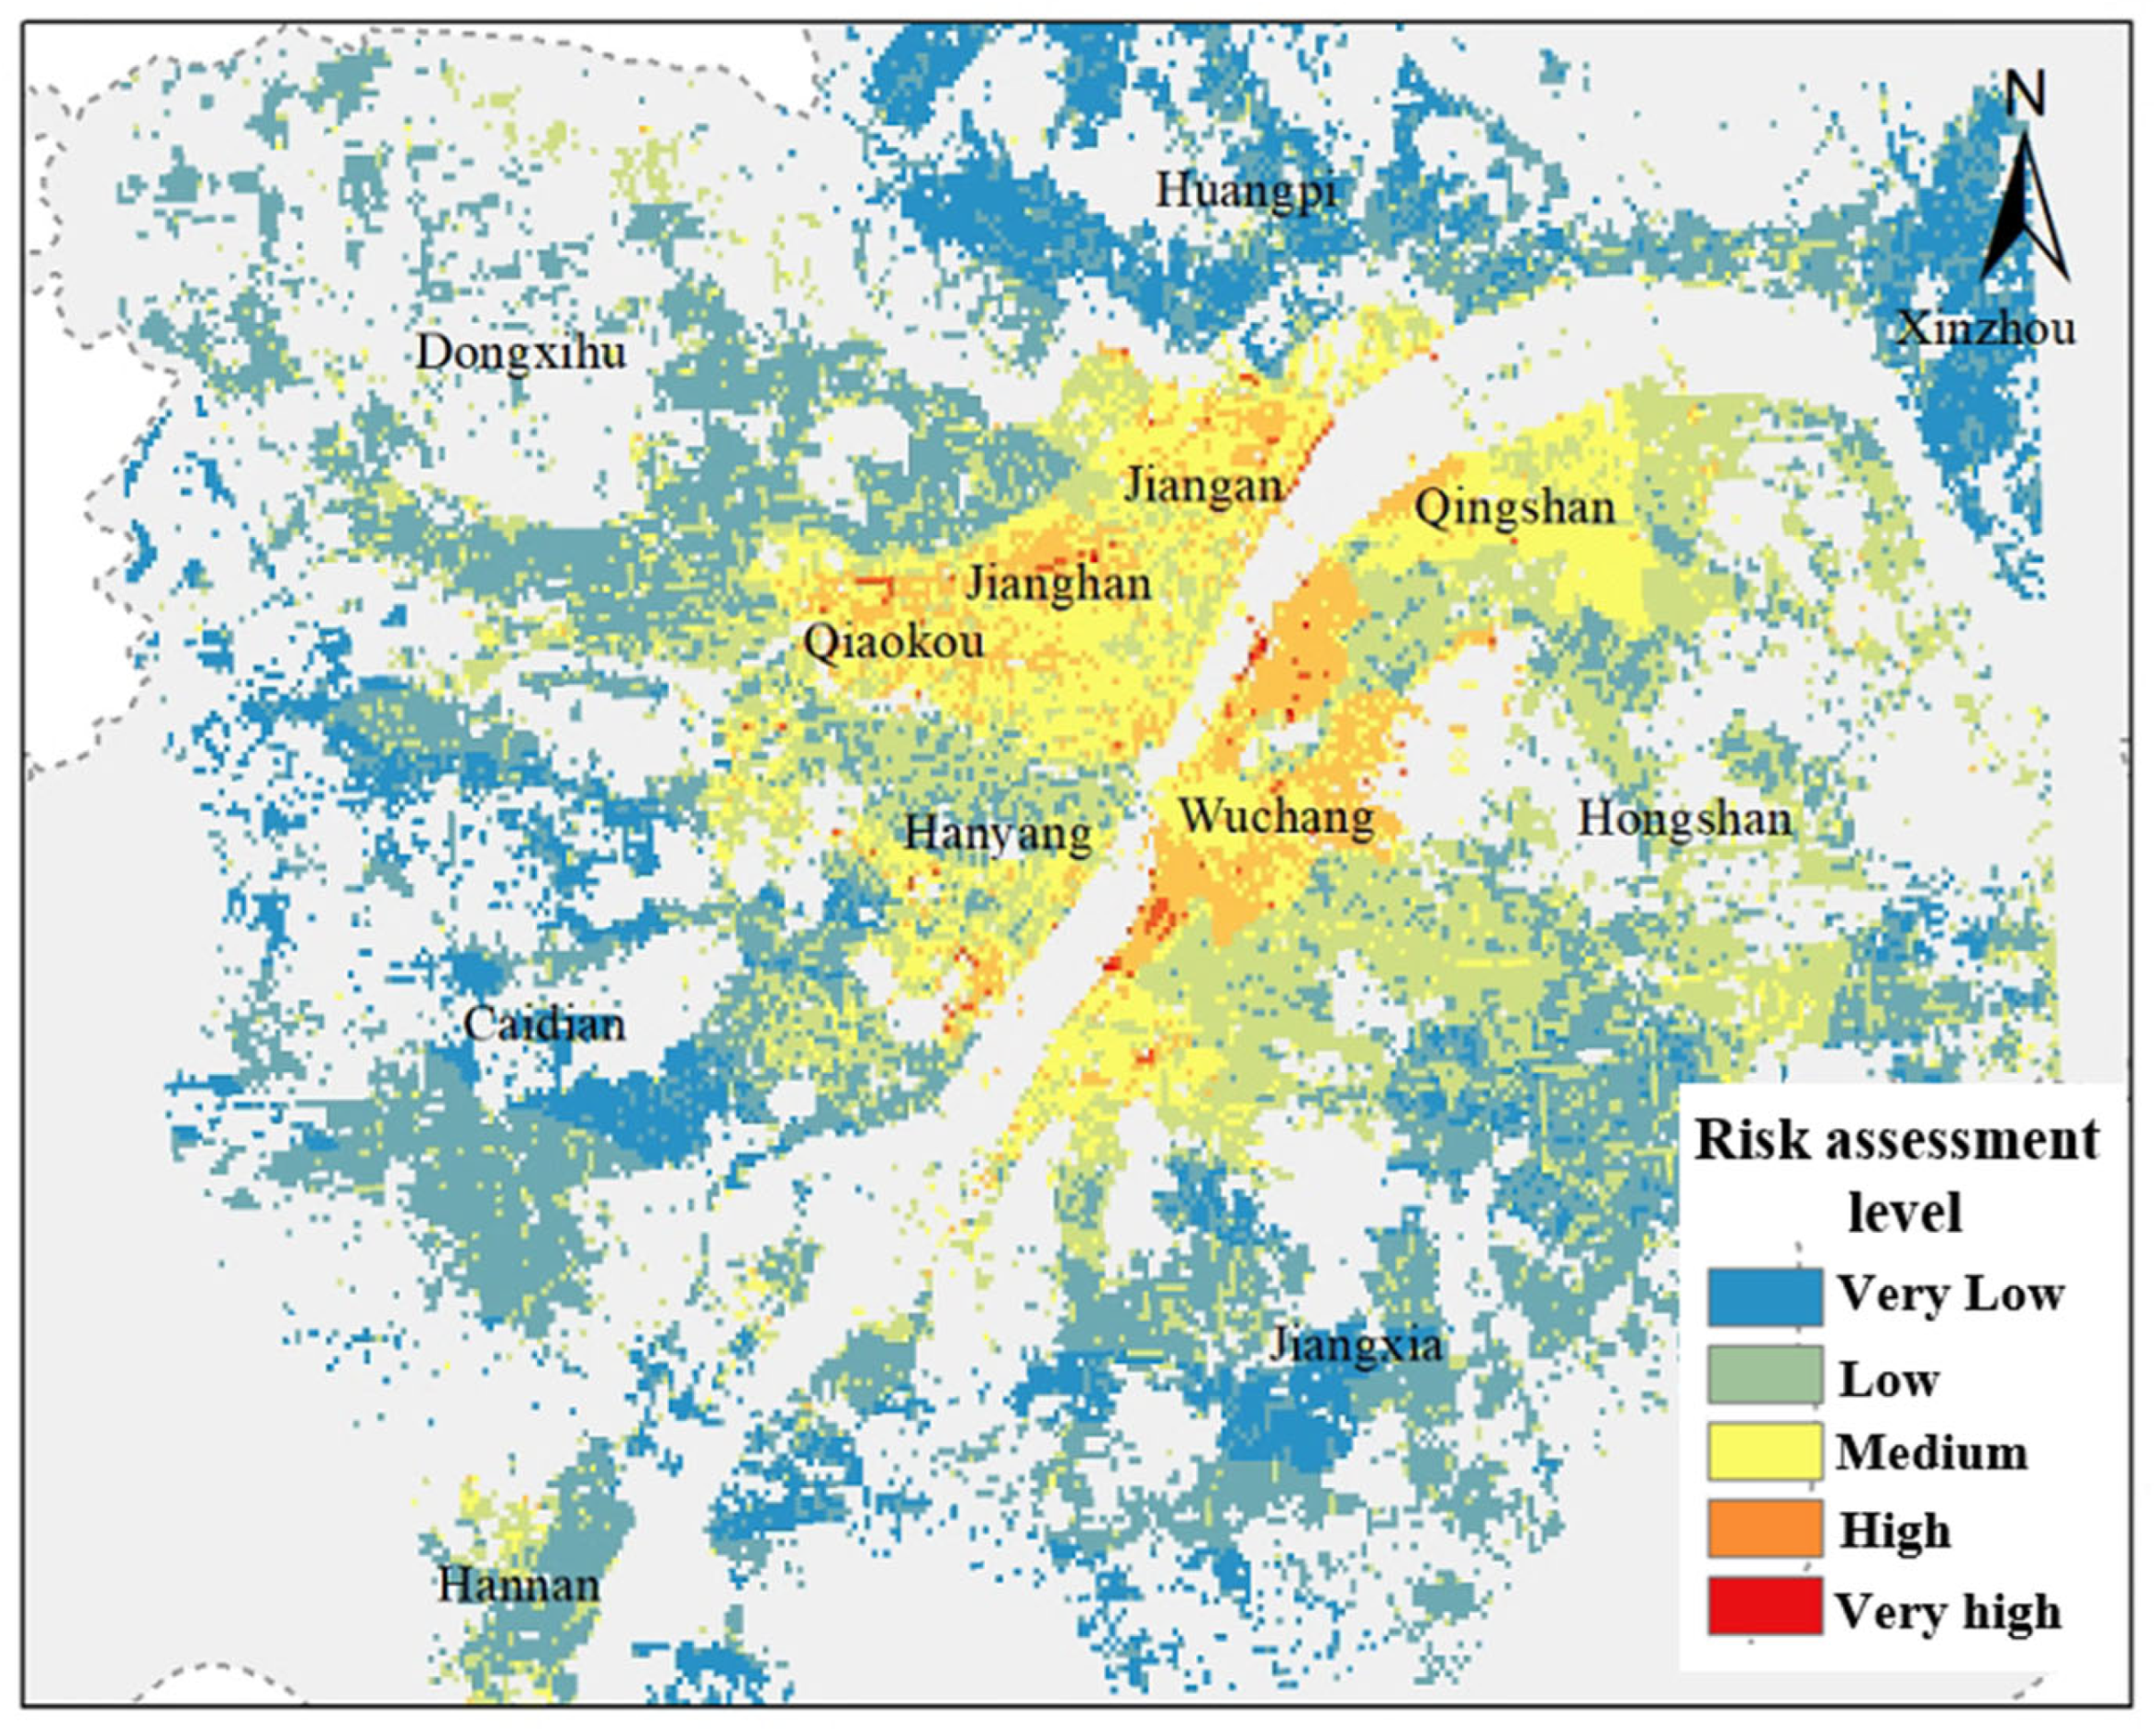
We classified the assessment results into five grades from low to high. Figure 16 demonstrates that most of the areas in Wuhan had a low ground subsidence risk level. High-risk zones were primarily distributed within the core urban areas of the city, with a notable concentration in the BSZ section of HS. The districts of WC, JH, and QK were situated on the first-level terrace of the Yangtze River, where substantial underground deposits of soft soil are present. JH is the center of Wuhan, with the highest population density, a dense concentration of roads and buildings, and a large number of high-rise buildings, which may be a reason for the high risk of subsidence. The high level of urbanization along the banks of the Yangtze and Han Rivers in Wuhan, coupled with the effects of rainfall variability, also results in a high risk of subsidence along the rivers in Wuhan. These areas of high risk of land subsidence require increased vigilance on the part of the relevant authorities.
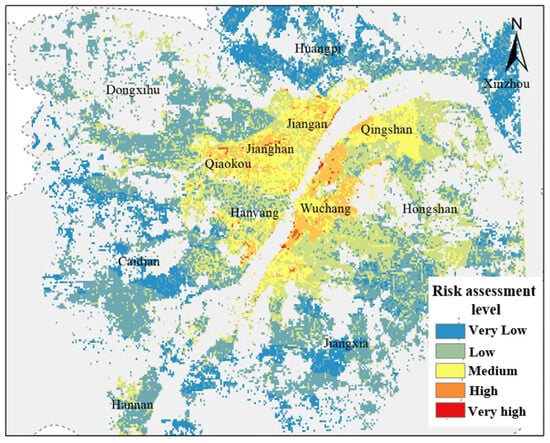
Figure 16.
Results of the Wuhan risk assessment.
5. Conclusions
This study leveraged SBAS-InSAR technology to comprehensively analyze land subsidence in Wuhan. Furthermore, validation was performed using leveling data, showing a consistent deformation velocity between InSAR and leveling monitoring with a correlation coefficient of 0.71. The spatiotemporal characteristics of subsidence were investigated, and the influence of both anthropogenic and natural factors on subsidence dynamics was explored. Additionally, a risk assessment model was developed by integrating the GD-FAHP method and the EWM. The key findings are summarized as follows:
- (1)
- Wuhan exhibited a peak subsidence rate of −49 mm/a, with significant spatial heterogeneity. The greatest cumulative subsidence, reaching −135 mm, occurred in HS, where ground deformation was most pronounced. Subsidence areas are expanding outward, with new subsidence zones emerging in Hannan District. Overall, subsidence predominantly developed in the southern central urban area during the study period.
- (2)
- Land subsidence in Wuhan is driven by a combination of factors. Urban infrastructure construction emerged as the primary driver, with cumulative subsidence exceeding −98 mm in construction-intensive areas. Underground engineering activities and soft soil conditions exacerbated subsidence in surrounding regions. Seasonal rainfall variations influenced groundwater levels, further impacting subsidence dynamics. Notably, land uplift was observed during the July 2020 flood, albeit with a temporal lag. Additionally, hydrogeological conditions, such as soft soil layers and carbonate rock belts, facilitated subsidence occurrence.
- (3)
- The GD-FAHP method was employed to classify subsidence risk levels, identifying HS as a high-risk area, likely due to its thick, soft soil layers. The EWM-based vulnerability analysis categorized the main urban area as medium to high risk. The integrated risk assessment model highlighted high-risk zones concentrated in JH, HS, and WC, underscoring the significant impact of human activities on subsidence risk. These findings emphasize the need for targeted monitoring and mitigation efforts in high-risk areas. The proposed methodology demonstrates the applicability of geohazard risk evaluation in Wuhan and similar urban environments.
Author Contributions
Lv Zhou: writing—review and editing, methodology, conceptualization; Liqi Liang: software, writing—original draft preparation; Quanyu Chen: investigation, resources; Haotian He: data curation; Hongming Li: supervision, project administration; Jie Qin: writing—review and editing; Fei Yang: methodology, data curation; Xinyi Li: visualization, software; Jie Bai: data curation. All authors have read and agreed to the published version of the manuscript.
Funding
This research was funded by the Guangxi Key Research and Development Program (Grant No. GUIKE AB24010144); the Major Science and Technology Project of Nanning (Grant No.20241027); the Central Guidance for Local Scientific and Technological Development Funding Project (Grant No. GUIKE ZY24212008); the National Natural Science Foundation of China (Grant No. 42264004 and 42204022); the Key Laboratory of China—ASEAN Satellite Remote Sensing Applications, the Ministry of Natural Resources of the People’s Republic of China (Grant No. ZDMY202309); the Technology Innovation Center for Geohazard Monitoring and Risk Early Warning, the Ministry of Natural Resources (Grant No. TICGM-2024-07); and the Hubei Provincial Natural Resources Science and Technology Program (2025) (No. ZRZY2025KJ08).
Data Availability Statement
The data included in this study can be obtained for free through the following websites: Sentinel-1A imagery (https://browser.dataspace.copernicus.eu/ (accessed on 20 January 202)); Geological data (https://dzj.hubei.gov.cn/ (accessed on 20 January 2023)); 30 m SRTM DEM data (http://dwtkns.com/srtm30m/ (accessed on 20 January 2023)); satellite POD (https://browser.dataspace.copernicus.eu/ (accessed on 20 January 2023)); building and road vector data (http://www.openstreetmap.org (accessed on 3 September 2023)); and historical aerial imagery (https://livingatlas.arcgis.com/wayback (accessed on 23 September 2023)).
Conflicts of Interest
Author Quanyu Chen and Hongming Li were employed by the company Guangxi Communications Research Institute Co., Ltd. The remaining authors declare that the research was conducted in the absence of any commercial or financial relationships that could be construed as a potential conflict of interest.
References
- Du, Y.; Zhang, H.D.; Xie, M.W.; Jiang, Y.J.; Chicas, S.D.; Liu, J.N. A Possible Mechanism of High-Speed and Long-Distance Rockslides. J. Earth Sci. 2024, 35, 2158–2162. [Google Scholar] [CrossRef]
- Davydzenka, T.; Tahmasebi, P.; Shokri, N. Unveiling the Global Extent of Land Subsidence: The Sinking Crisis. Geophys. Res. Lett. 2024, 51, 11. [Google Scholar] [CrossRef]
- Zhang, G.; Xu, Z.X.; Chen, Z.W.; Wang, S.Y.; Liu, Y.T.; Gong, X.H. Analyzing surface deformation throughout China’s territory using multi-temporal InSAR processing of Sentinel-1 radar data. Remote Sens. Environ. 2024, 305, 114105. [Google Scholar] [CrossRef]
- Tao, Q.X.; Li, X.P.; Gao, T.F.; Chen, Y.; Liu, R.X.; Xiao, Y.X. Land subsidence monitoring and analysis in Qingdao, China using time series InSAR combining PS and DS. Geomat. Nat. Hazards Risk 2025, 16, 31. [Google Scholar] [CrossRef]
- Chen, B.B.; Gong, H.L.; Lei, K.C.; Li, J.W.; Zhou, C.F.; Gao, M.L.; Guan, H.L.; Lv, W. Land subsidence lagging quantification in the main exploration aquifer layers in Beijing plain, China. Int. J. Appl. Earth Obs. Geoinf. 2019, 75, 54–67. [Google Scholar] [CrossRef]
- Zhou, L.; Zhao, Y.Z.; Zhu, Z.L.; Ren, C.; Yang, F.; Huang, L.; Li, X. Spatial and temporal evolution of surface subsidence in Tianjin from 2015 to 2020 based on SBAS-InSAR technology. J. Geod. Geoinf. Sci. 2022, 5, 60–72. [Google Scholar]
- Zhou, L.; Guo, J.M.; Li, X.; Hu, J.Y. Monitoring and analyzing on ground settlement in Beijing area based on SBAS-InSAR. J. Geod. Geodyn. 2016, 36, 793–797. [Google Scholar]
- Guo, J.M.; Zhou, L.; Yao, C.L.; Hu, J.Y. Surface subsidence analysis by multi-temporal insar and grace: A case study in Beijing. Sensors 2016, 16, 1495. [Google Scholar] [CrossRef]
- He, X.F.; Gao, Z.; Xiao, R.Y.; Luo, H.B.; Jia, D.Z.; Zhang, Z.T. Application and prospect of the integration of InSAR and BDS/GNSS for land surface deformation monitoring. Acta Geod. Cartogr. Sin. 2022, 51, 1338. [Google Scholar]
- Yu, C.; Li, Z.H.; Penna, N.T.; Crippa, P. Generic atmospheric correction model for interferometric synthetic aperture radar observations. J. Geophys. Res. Solid Earth 2018, 123, 9202–9222. [Google Scholar] [CrossRef]
- Li, Z.W.; Hu, J. Research progress and methods of InSAR for deformation monitoring. Acta Geod. Cartogr. Sin. 2017, 46, 1717–1733. [Google Scholar]
- Ferretti, A.; Prati, C.; Rocca, F. Nonlinear subsidence rate estimation using permanent scatterers in differential SAR interferometry. IEEE Trans. Geosci. Remote Sens. 2000, 38, 2202–2212. [Google Scholar] [CrossRef]
- Hooper, A.; Segall, P.; Zebker, H. Persistent scatterer interferometric synthetic aperture radar for crustal deformation analysis, with application to Volcán Alcedo, Galápagos. J. Geophys. Res. Solid Earth 2007, 112. [Google Scholar] [CrossRef]
- Berardino, P.; Fornaro, G.; Lanari, R.; Sansosti, E. A new algorithm for surface deformation monitoring based on small baseline differential SAR interferograms. IEEE Trans. Geosci. Remote Sens. 2002, 40, 2375–2383. [Google Scholar] [CrossRef]
- Li, Z.; Zhu, W.; Yu, C.; Zhang, Q.; Zhnag, C.; Liu, Z.; Zhang, X.; Chen, B.; Du, J.; Song, C. Interferometric synthetic aperture radar for deformation mapping: Opportunities, challenges and the outlook. Acta Geod. Cartogr. Sin. 2022, 51, 1485–1519. [Google Scholar]
- Li, D.; Deng, K.Z.; Gao, X.X.; Niu, H.P. Monitoring and analysis of surface subsidence in mining area based on SBAS-InSAR. Geomat. Inf. Sci. Wuhan Univ. 2018, 43, 1531–1537. [Google Scholar]
- Hu, J.Y.; Motagh, M.; Guo, J.M.; Haghighi, M.H.; Li, T.; Qin, F.; Wu, W.H. Inferring subsidence characteristics in Wuhan (China) through multitemporal InSAR and hydrogeological analysis. Eng. Geol. 2022, 297, 16. [Google Scholar] [CrossRef]
- Bai, L.; Jiang, L.M.; Wang, H.S.; Sun, Q.S. Spatiotemporal Characterization of Land Subsidence and Uplift (2009–2010) over Wuhan in Central China Revealed by TerraSAR-X InSAR Analysis. Remote Sens. 2016, 8, 14. [Google Scholar] [CrossRef]
- Zhou, L.; Guo, J.M.; Hu, J.Y.; Li, J.W.; Xu, Y.F.; Pan, Y.J.; Shi, M. Wuhan surface subsidence analysis in 2015–2016 based on Sentinel-1A data by SBAS-InSAR. Remote Sens. 2017, 9, 982. [Google Scholar] [CrossRef]
- Zhang, Y.; Liu, Y.L.; Jin, M.Q.; Jing, Y.; Liu, Y.; Liu, Y.F.; Sun, W.; Wei, J.Q.; Chen, Y. Monitoring Land Subsidence in Wuhan City (China) using the SBAS-InSAR Method with Radarsat-2 Imagery Data. Sensors 2019, 19, 16. [Google Scholar] [CrossRef]
- Jiang, H.N.; Balz, T.; Cigna, F.; Tapete, D.; Li, J.A.; Han, Y.K. Multi-sensor InSAR time series fusion for long-term land subsidence monitoring. Geo-Spat. Inf. Sci. 2023, 27, 1424–1440. [Google Scholar] [CrossRef]
- Lyu, H.M.; Zhou, W.H.; Shen, S.L.; Zhou, A.N. Inundation risk assessment of metro system using AHP and TFN-AHP in Shenzhen. Sustain. Cities Soc. 2020, 56, 14. [Google Scholar] [CrossRef]
- Jin, Y.; Gao, X.; Hu, Q.; Jia, Z. Risk Assessment of Urban Buildings Based on InSAR Technology. Sci. Surv. Mapp. 2021, 46, 76–79. [Google Scholar]
- Mercurio, C.; Calderón-Cucunuba, L.P.; Argueta-Platero, A.A.; Azzara, G.; Cappadonia, C.; Martinello, C.; Rotigliano, E.; Conoscenti, C. Predicting Earthquake-Induced Landslides by Using a Stochastic Modeling Approach: A Case Study of the 2001 El Salvador Coseismic Landslides. ISPRS Int. J. Geo-Inf. 2023, 12, 28. [Google Scholar] [CrossRef]
- Moresi, F.V.; Maesano, M.; di Cristofaro, M.; Mugnozza, G.S.; Brunori, E. Evaluating Shallow Landslide Prediction Mapping by Using Two Different GIS-Based Models: 4SLIDE and SHALSTAB. ISPRS Int. J. Geo-Inf. 2025, 14, 19. [Google Scholar] [CrossRef]
- Komu, M.P.; Nefeslioglu, H.A.; Gokceoglu, C. Modeling Shallow Landslide Runout Distance in Eocene Flysch Facies Using Empirical-Statistical Models (Western Black Sea Region of Türkiye). ISPRS Int. J. Geo-Inf. 2024, 13, 27. [Google Scholar] [CrossRef]
- Sundell, J.; Haaf, E.; Tornborg, J.; Rosén, L. Comprehensive risk assessment of groundwater drawdown induced subsidence. Stoch. Environ. Res. Risk Assess. 2019, 33, 427–449. [Google Scholar] [CrossRef]
- Zhao, F.M.; Gong, W.P.; Tang, H.M.; Pudasaini, S.P.; Ren, T.H.; Cheng, Z. An integrated approach for risk assessment of land subsidence in Xi’an, China using optical and radar satellite images. Eng. Geol. 2023, 314, 14. [Google Scholar] [CrossRef]
- Saaty, T.L. Decision-making with the AHP: Why is the principal eigenvector necessary. Eur. J. Oper. Res. 2003, 145, 85–91. [Google Scholar] [CrossRef]
- Ishikawa, A.; Amagasa, M.; Shiga, T.; Tomizawa, G.; Tatsuta, R.; Mieno, H. The max-min delphi method and fuzzy dephi method via fuzzy integration. Fuzzy Sets Syst. 1993, 55, 241–253. [Google Scholar] [CrossRef]
- Chitsazan, M.; Rahmani, G.; Ghafoury, H. Land subsidence susceptibility mapping using PWRSTFAL framework and analytic hierarchy process: Fuzzy method (case study: Damaneh-Daran Plain in the west of Isfahan Province, Iran). Environ. Monit. Assess. 2022, 194, 16. [Google Scholar] [CrossRef]
- Jin, Y.F.; Yin, Z.Y.; Zhou, W.H.; Huang, H.W. Multi-objective optimization-based updating of predictions during excavation. Eng. Appl. Artif. Intell. 2019, 78, 102–123. [Google Scholar] [CrossRef]
- Gu, X.B.; Wu, S.T.; Ji, X.J.; Zhu, Y.H. The Risk Assessment of Debris Flow Hazards in Banshanmen Gully Based on the Entropy Weight-Normal Cloud Method. Adv. Civ. Eng. 2021, 2021, 11. [Google Scholar] [CrossRef]
- Ouyang, T.P.; Fu, S.Q.; Zhu, Z.Y.; Kuang, Y.Q.; Huang, N.S.; Wu, Z.F. A new assessment method for urbanization environmental impact: Urban environment entropy model and its application. Environ. Monit. Assess. 2008, 146, 433–439. [Google Scholar] [CrossRef] [PubMed]
- Lv, H.M.; Shen, S.L.; Zhou, A.N.; Yang, J. Risk assessment of mega-city infrastructures related to land subsidence using improved trapezoidal FAHP. Sci. Total Environ. 2020, 717, 18. [Google Scholar]
- Zhao, Q.Z.; Liu, Y.; Yao, W.Q.; Yao, Y.B. Hourly Rainfall Forecast Model Using Supervised Learning Algorithm. IEEE Trans. Geosci. Remote Sens. 2022, 60, 9. [Google Scholar] [CrossRef]
- Luo, X. Features of the shallow karst development and control of karst collapse in Wuhan. Carsologica Sin. 2013, 32, 419–432. [Google Scholar]
- Zhou, L.; Li, X.; Pan, Y.; Ma, J.; Wang, C.; Shi, A.; Chen, Y. Deformation monitoring of long-span railway bridges based on SBAS-InSAR technology. Geod. Geodyn. 2024, 15, 122–132. [Google Scholar] [CrossRef]
- Li, R.W.; Wang, P.W.; Tan, S.C.; Zhou, Y.B.; Liu, L.F.; Gou, C.D.; Yu, Y.L. Exploration of slope-type geological hazard susceptibility evaluation based on dynamic correction of SBAS-InSAR technology: A case study of Kang County in Gansu Province. Ecol. Inform. 2025, 85, 16. [Google Scholar] [CrossRef]
- Sierra, L.A.; Yepes, V.; Pellicer, E. A review of multi-criteria assessment of the social sustainability of infrastructures. J. Clean Prod. 2018, 187, 496–513. [Google Scholar] [CrossRef]
- Wang, J.F.; Xu, C.D. Geodetector: Principle and prospective. Acta Geogr. Sin. 2017, 72, 116–134. [Google Scholar]
- Chen, P.Y. On the Diversity-Based Weighting Method for Risk Assessment and Decision-Making about Natural Hazards. Entropy 2019, 21, 13. [Google Scholar] [CrossRef] [PubMed]
- Zhang, Z.H.; Zhang, S.B.; Hu, C.T.; Zhang, X.X.; Yang, S.W.; Yan, H.W.; Zhang, Z. Hazard assessment model of ground subsidence coupling AHP, RS and GIS—A case study of Shanghai. Gondwana Res. 2023, 117, 344–362. [Google Scholar] [CrossRef]
- Xie, P.; Zhang, S.X.; Zhou, L.; Li, Q.L.; Xiao, J.H.; Cai, J.F. Detection of the Urban Surface Deformation and New Strategy for Flood Prevention in Wuhan Central District. Geomat. Inf. Sci. Wuhan Univ. 2021, 46, 1015–1024. [Google Scholar]
- Hu, B.B.; Zhou, J.; Wang, J.; Chen, Z.L.; Wang, D.Q.; Xu, S.Y. Risk assessment of land subsidence at Tianjin coastal area in China. Environ. Earth Sci. 2009, 59, 269–276. [Google Scholar] [CrossRef]
- Qin, Y.Z.; Cao, L.; Li, S.M.; Ye, F.W.; Boloorani, A.D.; Liang, Z.X.; Huang, J.; Liu, G.F. Multisource geoscience data-driven framework for subsidence risk assessment in urban area. Int. J. Disaster Risk Reduct. 2024, 113, 22. [Google Scholar] [CrossRef]
- Chen, R.R.; Zhan, Q.; Jiang, X.Z.; Chen, J. Conical ground subsidence morphodynamics in the Yellow River Delta, China: Insights from InSAR analysis. J. Hydrol. Reg. Stud. 2025, 60, 19. [Google Scholar] [CrossRef]
- Hu, R.L.; Yue, Z.Q.; Wang, L.C.; Wang, S.J. Review on current status and challenging issues of land subsidence in China. Eng. Geol. 2004, 76, 65–77. [Google Scholar] [CrossRef]
Disclaimer/Publisher’s Note: The statements, opinions and data contained in all publications are solely those of the individual author(s) and contributor(s) and not of MDPI and/or the editor(s). MDPI and/or the editor(s) disclaim responsibility for any injury to people or property resulting from any ideas, methods, instructions or products referred to in the content. |
© 2025 by the authors. Published by MDPI on behalf of the International Society for Photogrammetry and Remote Sensing. Licensee MDPI, Basel, Switzerland. This article is an open access article distributed under the terms and conditions of the Creative Commons Attribution (CC BY) license (https://creativecommons.org/licenses/by/4.0/).

