


Abstract
Commercial and residential spaces constitute two fundamental components of urban spatial structure, and their coupling relationship critically shapes urban functional organization and planning interventions. However, integrated analyses of static facility layouts and observed human mobility remain limited. This study develops a static–dynamic framework that integrates facility co-distribution with observed travel connectivity. It further distinguishes catering, shopping, living, financial and insurance, accommodation, and vehicle-related services for category-specific comparison. Kernel density estimation (KDE), average nearest neighbor (ANN) analysis, spatial autocorrelation, Spearman’s rank correlations, median-based classification, and social network analysis characterize static–dynamic relationships. Data comprise Amap commercial points of interest (POIs), Anjuke residential POIs, and a single weekday of Didi origin–destination (OD) records. After removing records with invalid positioning or missing fields, 10:00–16:00 trips within the study area were matched to POI buffers. Both commercial and residential POIs exhibit clustering, with commercial POIs more strongly clustered. Residential POIs follow a core–periphery gradient with a stronger presence in western Beijing. Residential intensity is positively associated with overall commercial intensity in neighboring subdistricts (bivariate Moran’s I = 0.645). Category-specific associations range from 0.282 for vehicle-related services to 0.642 for living services, remaining supported after false-discovery-rate correction (q ≤ 0.0002). Residential–commercial facility intensity and commercial facility–inbound mobility intensity show strong rank correspondence (Spearman’s ρ = 0.869 and 0.883, respectively). Median-based classification identifies 170 subdistricts with concordant high–high or low–low facility–mobility patterns and 20 with contrasting high–low or low–high patterns. Catering, shopping, and living services form more continuous networks, whereas financial and insurance, accommodation, and vehicle-related services exhibit sparser or more spatially peripheral network patterns. Distinguishing facility co-distribution from observed travel connectivity provides service-specific evidence for commercial facility allocation, community life-circle planning, and peripheral cluster development.
1. Introduction
Urban space is the result of long-term spatial clustering, differentiation, and reorganization of various elements—such as population, industry, transportation, and public services—within a geographic area. As cities expand and residents’ activity ranges extend, the relationships between different urban functional spaces are no longer merely characterized by spatial proximity but are instead formed through continuous spatial connections created by daily travel, service consumption, and traffic flows [1]. Commercial and residential spaces, which respectively support the provision of urban consumer services and residents’ daily needs, are the two most fundamental and dynamic types of space within the urban functional system. Their spatial interaction directly influences the convenience of residents’ daily lives, the accessibility of consumer services, the efficiency of transport organization, and the optimization of the urban spatial structure. Beijing, as China’s capital and a typical megacity, exhibits a high concentration of commercial services and human activity. Existing research indicates that Beijing’s intra-city travel network exhibits distinct spatial heterogeneity, a hierarchical structure, and polycentric characteristics [2]. Therefore, examining the interaction patterns between commercial and residential spaces within Beijing’s Sixth Ring Road has significant practical implications for understanding urban spatial organization within a megacity.
Regarding the interaction patterns between commercial and residential spaces, existing research has generally progressed from identifying facility distributions to conducting spatial matching analyses. Early studies primarily focused on commercial and residential facilities, as well as retail POIs [3,4,5], using methods such as kernel density, spatial correlation, and accessibility to analyze spatial clustering and proximity. For example, Xue Bing et al., using residential and retail POI data from Shenyang, found that the spatial clustering patterns of residential and retail areas were highly similar [6]; Liu Wei et al., using Taiyuan as a case study, further compared the degree of correlation between residential areas and different retail formats [7]. Focusing on Beijing, Zhou et al. used urban POI data to quantify the spatial association between commercial and residential spaces, noting that these are not geographically independent entities [8]; Zhou and Wang employed the co-location coefficient method to reveal spatial heterogeneity between different commercial service categories and residential spaces of varying tiers in Beijing [9]. Such studies provide a foundation for understanding static spatial matching between commercial and residential spaces, but they also tend to interpret the commercial–residential interaction patterns solely in terms of “proximity of distribution,” while paying insufficient attention to the dynamic connections formed by residents’ actual residential-to-commercial travel patterns.
Ultimately, whether commercial and residential spaces are well matched must be assessed in the context of residents’ daily lives. Wu Danxian and Zhou Suhong explained the relationship between residential and commercial spaces through daily shopping behaviors in Guangzhou neighborhoods, noting that neighborhood commercial services are closely tied to residents’ quality of life [10]; Ma Liya and Xiu Chunliang, focusing on shopping trips in Shenyang, found that residents in outlying areas have relatively low access to high-quality commercial services and that a mismatch between commercial and residential spaces may also induce traffic pressures [11]. From a supply-and-demand perspective, Zhang et al.’s study of the shrinking city of Yichun indicates that the spatial association between residential and commercial spaces can be evaluated at the 5, 10, and 15 min community life circle scales [12]. By applying mobile location and trajectory data, scholars have begun to reinterpret the spatial association between commercial and residential spaces from the perspective of consumer travel flows. Zhou et al. used Baidu trajectory data from Zhuhai to analyze dynamic interaction patterns between commercial and residential spaces [13]; Zhang Xiangcheng and He Tianxiang, using Shanghai and Zhuhai as case studies, respectively, linked the static distribution of POIs to residents’ residential-to-commercial trips [14,15]; Zhou et al. constructed a dynamic framework for residential–commercial spatial associations based on Shanghai taxi trajectory data and social network analysis [16]. These studies suggest that the spatial interaction between commercial and residential spaces is not merely a matter of spatial proximity between facilities but also encompasses the direction, intensity, and network structure of residents’ residential-to-commercial trips.
Advances in geographic information science have established POI data as a foundational input for deciphering urban spatial organization [17,18,19,20]. Compared with questionnaire surveys or single-source POI data, taxi or ride-hailing vehicle OD (origin–destination) data can more directly capture the connections between the origins and destinations of intra-urban trips, providing a new data foundation [21,22,23,24] for identifying dynamic interactions among urban functional spaces. Based on large-scale taxi GPS data from Beijing, Wang et al. found that high-intensity travel in Beijing is primarily concentrated within the Sixth Ring Road, and that OD flows can reveal the city’s travel structure in terms of direction, scale, and time periods [25]; Liu et al. used Shanghai taxi travel data to construct a spatially embedded network, demonstrating that travel flow networks can identify the city’s polycentric structure [26]. From a network perspective, Fu Xin et al. modeled taxi trajectories as directed, weighted complex networks to analyze node strength, clustering coefficients, and spatial differentiation [27]; Zhang et al. and Zhang Yan et al. identified urban spatial structures and flow patterns using fine-grained grids, the Louvain algorithm, and traffic flow networks [28,29]. Furthermore, Zhou et al. proposed a method for extracting multi-level spatial network structures from large-scale OD flows, emphasizing that strong links, spatial proximity, and spatial continuity should be incorporated into OD network analysis [30]; Barroso et al. also demonstrated that correlations between OD flows and traffic volume can reflect the distribution of urban activities and network centrality [31]. These findings provide a methodological basis for this study’s approach of treating residential-to-commercial trips as directed connections and applying social network analysis.
Previous studies have characterized commercial–residential spatial associations using POIs [8,9] and examined functional connections through human mobility data [13,14,15,16]. Building on these contributions, the present study asks how commercial service categories differ in their combinations of spatial correspondence with residential facilities and observed mobility-network organization in Beijing. The underlying conceptual issue concerns the distinction between where urban functions are located relative to one another and how they are connected through travel. Examining these category-specific combinations can refine the interpretation of commercial–residential relationships beyond either facility distributions or aggregate mobility patterns alone.
Against this backdrop, this study investigates commercial–residential interaction patterns within Beijing’s Sixth Ring Road by integrating commercial and residential POIs with Didi ride-hailing OD data. The main contributions of this study are as follows:
- (1)
- Methodologically, we propose an integrated static–dynamic analytical framework that addresses the limitation of examining facility configurations and mobility connections separately. At a common subdistrict scale, the framework relates residential and commercial facility intensities to destination-oriented inbound mobility and combines rank-correlation analysis, a facility–mobility correspondence typology, and OD-network analysis. It thereby identifies both concordant and contrasting patterns and distinguishes spatial co-distribution from observed travel connectivity.
- (2)
- We refine commercial–residential analysis by disaggregating commercial facilities into six service categories: catering, shopping, financial and insurance, vehicle-related, living, and accommodation. This categorization enables category-specific comparisons of residential–commercial facility correspondence, commercial facility–inbound mobility correspondence, and OD-network organization. It reveals variations that may be concealed when commercial facilities are treated as an aggregate category and provides service-specific evidence for facility planning.
2. Study Area, Data, and Methodology
2.1. Study Area
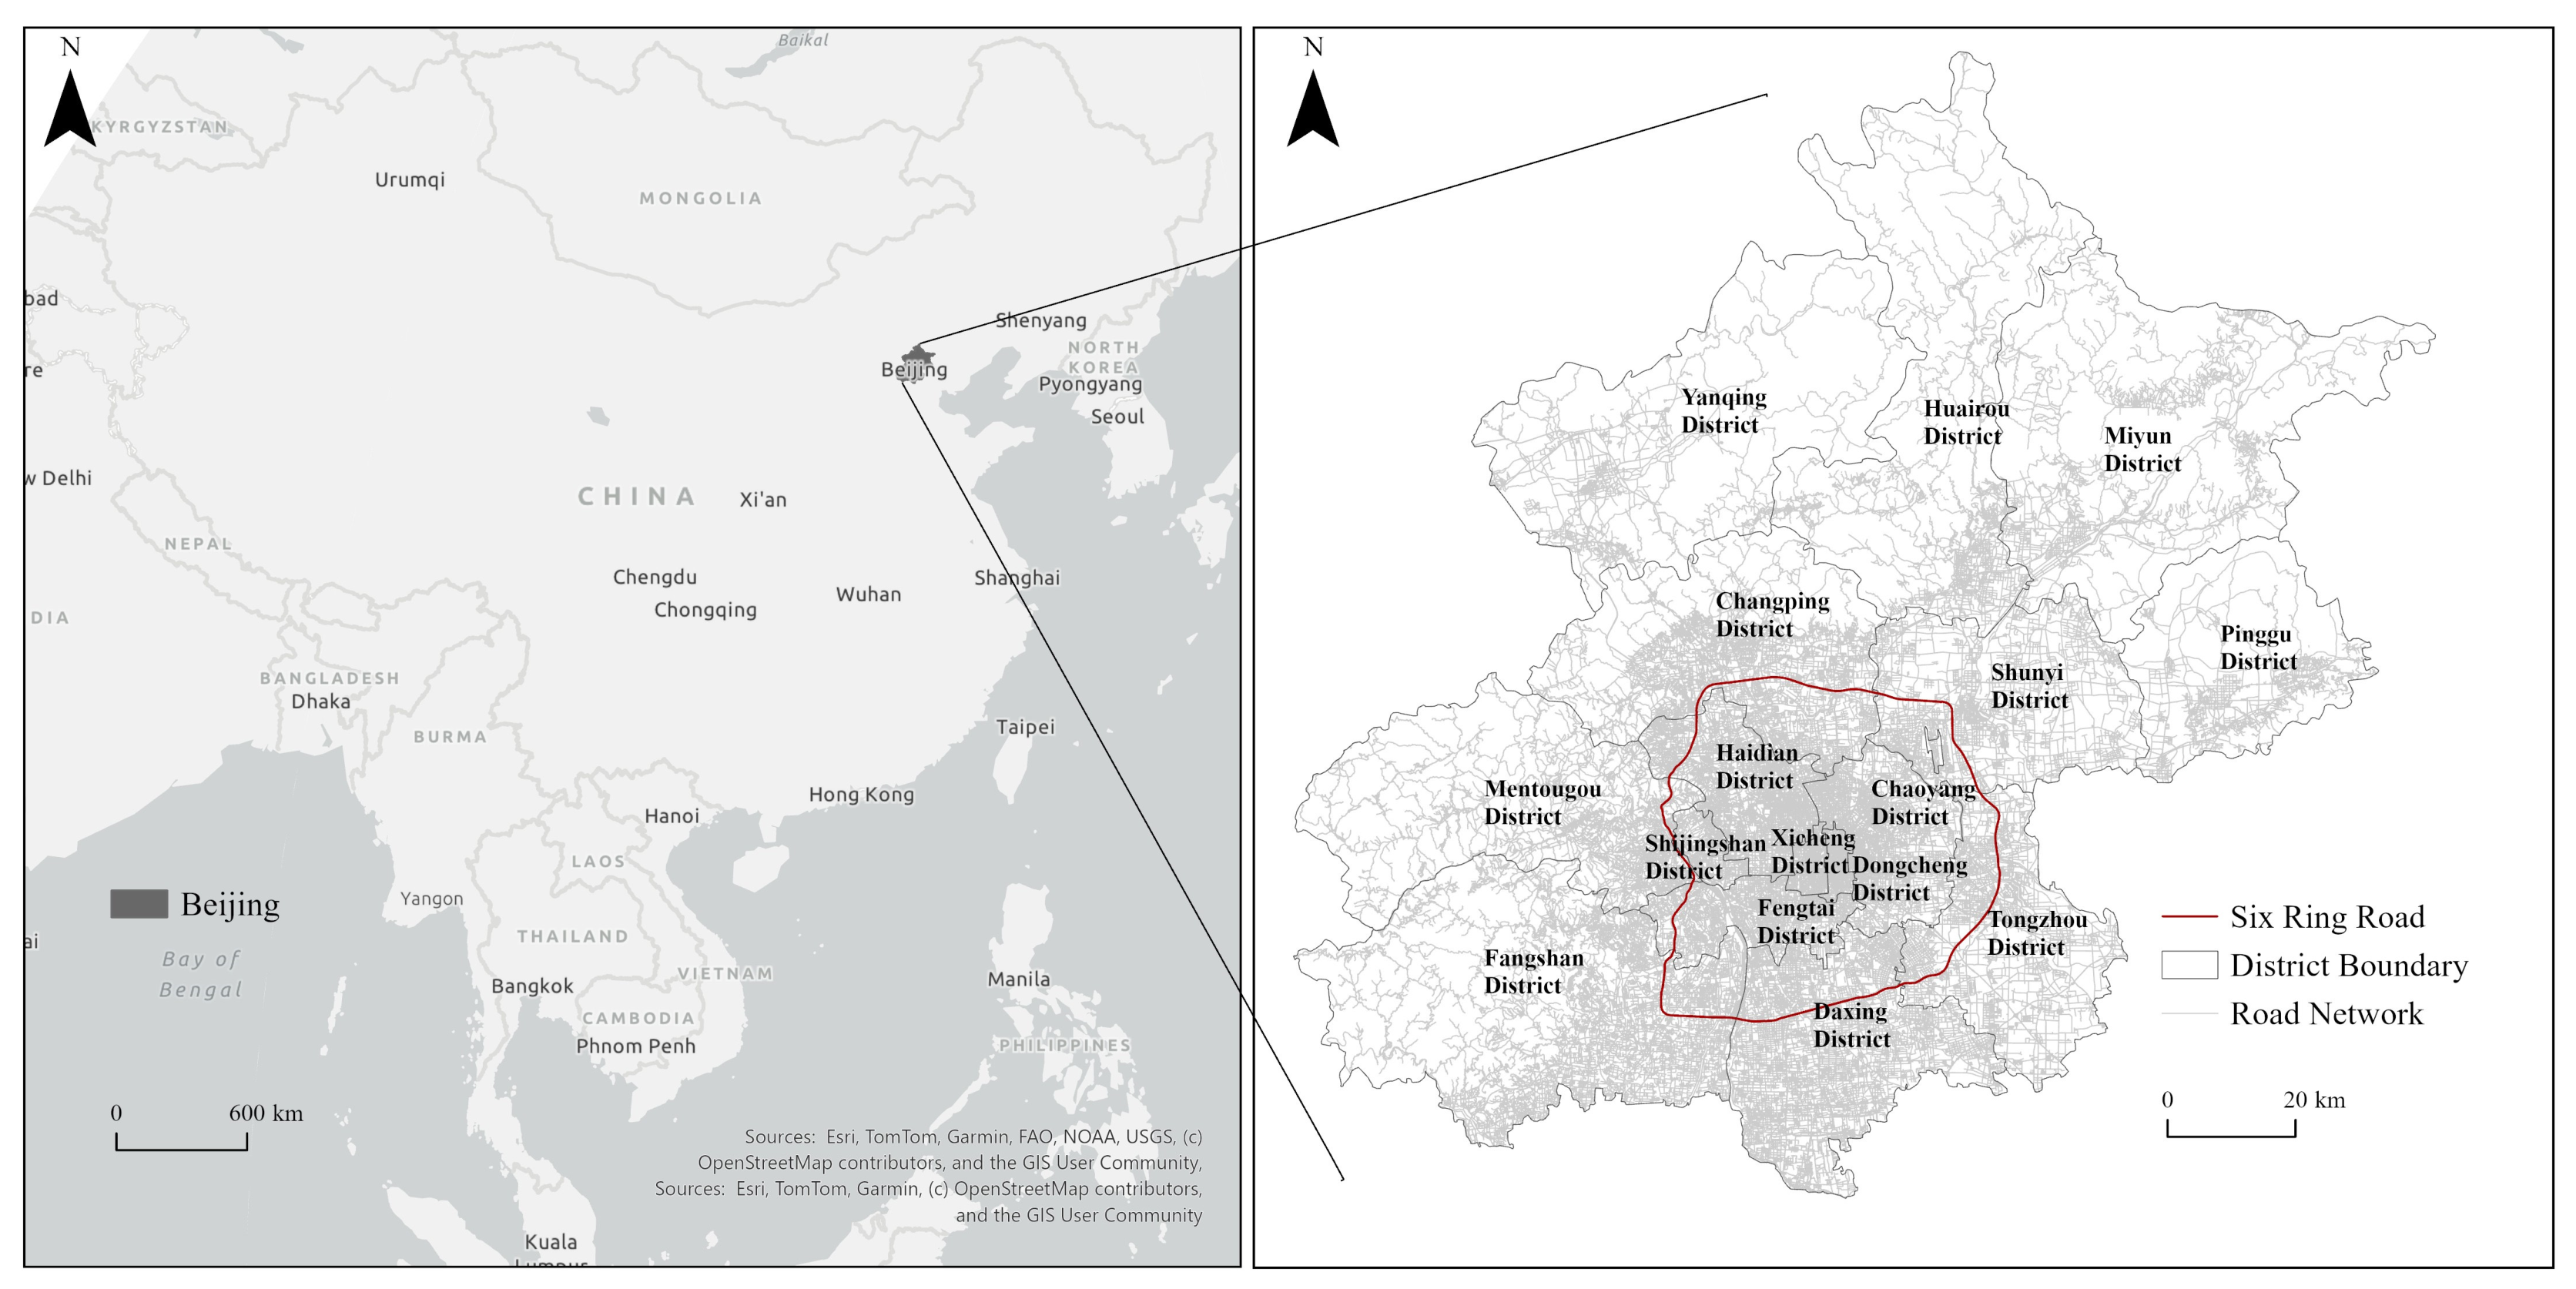
Beijing is the capital of China and a typical megacity, serving as the national center for politics, culture, international exchange, and scientific and technological innovation. In 2024, Beijing’s gross regional product (GRP) reached 4984.31 billion yuan, with the tertiary sector accounting for 85.3% of the economy; the permanent resident population at year-end stood at 21.83 million people, of which 88.2% were urban residents, reflecting a high degree of service sector dominance and intense concentration of urban activities [32]. In terms of commerce, Beijing is transitioning from a traditional commercial center to an international consumer hub, with commercial spaces exhibiting multi-tiered, multi-format, and mixed-use development characteristics. The area within Beijing’s Sixth Ring Road concentrates these features; this region encompasses traditional central commercial districts, established residential areas, science, education, and cultural zones, business and office districts, as well as emerging residential areas in the inner suburbs. The study area covers 190 subdistrict-level units across 12 administrative districts, including central urban and inner-suburban areas. It contains established commercial and residential concentrations as well as peripheral expansion areas, providing sufficient spatial heterogeneity for the analyses conducted in this study (Figure 1).
Figure 1.
Study area in Beijing.
2.2. Data
2.2.1. POI Data
This study used two categories of urban infrastructure POIs as the primary spatial data sources: commercial-facility POIs and residential-community POIs. The commercial POI data were collected from the Amap Open Platform (https://lbs.amap.com/) in Beijing in July 2024. This dataset covers the spatial locations and category attributes of various commercial service facilities and is characterized by broad coverage, high update frequency, and high spatial accuracy. The residential community POIs were collected from the Anjuke platform (https://www.anjuke.com/). This dataset primarily includes the spatial locations and basic attributes of residential communities and effectively characterizes the spatial distribution patterns of urban residential spaces.
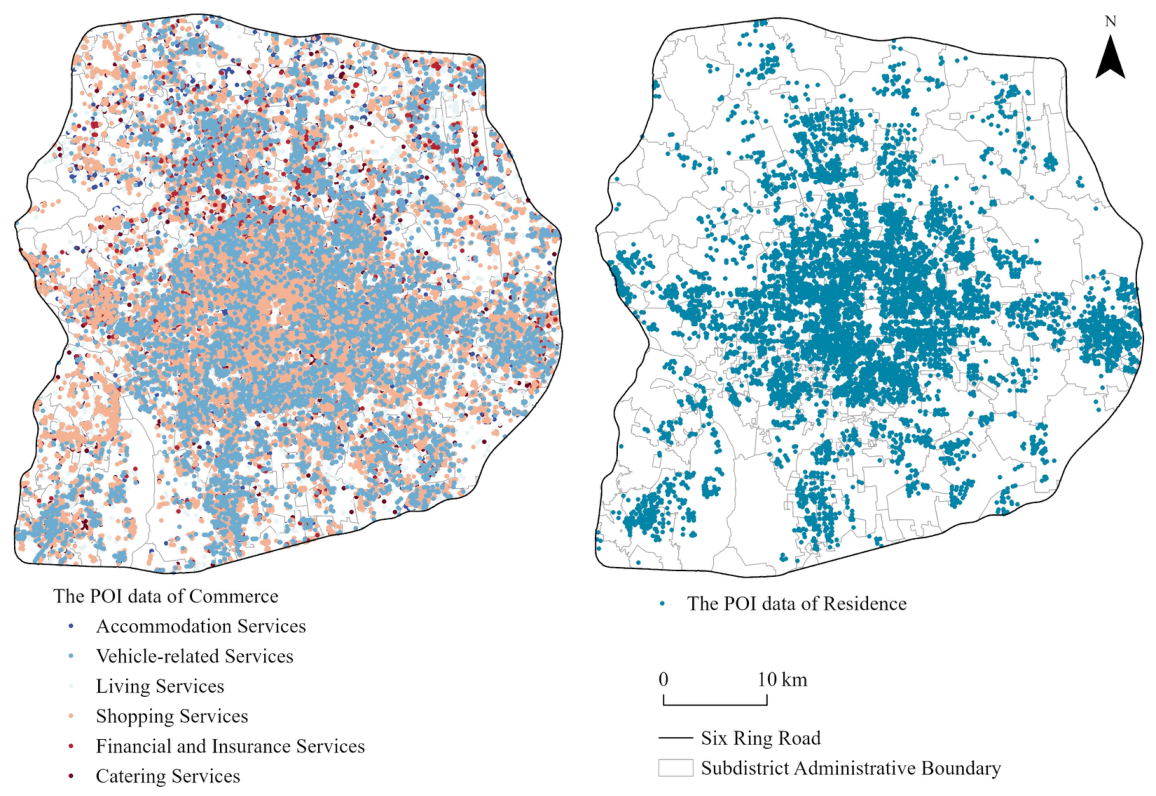
Referring to the standard and report documents [33,34], this study performed spatial processing on the raw POI data in the area within Beijing’s Sixth Ring Road, focusing on extracting commercial POIs. Commercial POIs within Beijing’s Sixth Ring Road were classified into six categories: catering, shopping, financial and insurance, vehicle-related, living, and accommodation services. Residential community POI data were filtered by property type to retain only those classified as “residential” (Figure 2 and Table 1).
Figure 2.
The POI data of commerce and residence within the Sixth Ring Road of Beijing.
Table 1.
Classification of commercial POIs and residential POIs.
2.2.2. Ride-Hailing Vehicle Origin–Destination (OD) Data
This study used origin–destination (OD) data from the Didi ride-hailing platform, which were provided internally to the research team. The available dataset covered a single day, 8 January 2025, in Beijing. The observation date was a non-holiday Wednesday. Although this calendar context avoids predictable weekend and holiday effects, it does not establish temporal representativeness or exclude weather-related, event-related, or other day-specific effects. Accordingly, the dynamic analysis is interpreted as a single-day spatial snapshot of urban ride-hailing mobility rather than a general weekly, seasonal, or long-term mobility pattern. This dataset comprises 204,404 trip records from 10,609 Didi ride-hailing vehicles. Each record contains key spatiotemporal attributes, including vehicle ID, trip ID, pickup time, pickup location coordinates, drop-off time, and drop-off location coordinates, enabling a relatively comprehensive description of the spatiotemporal characteristics of each trip.
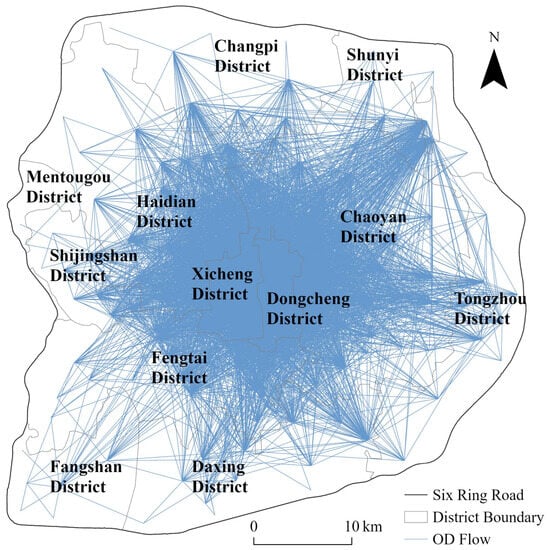
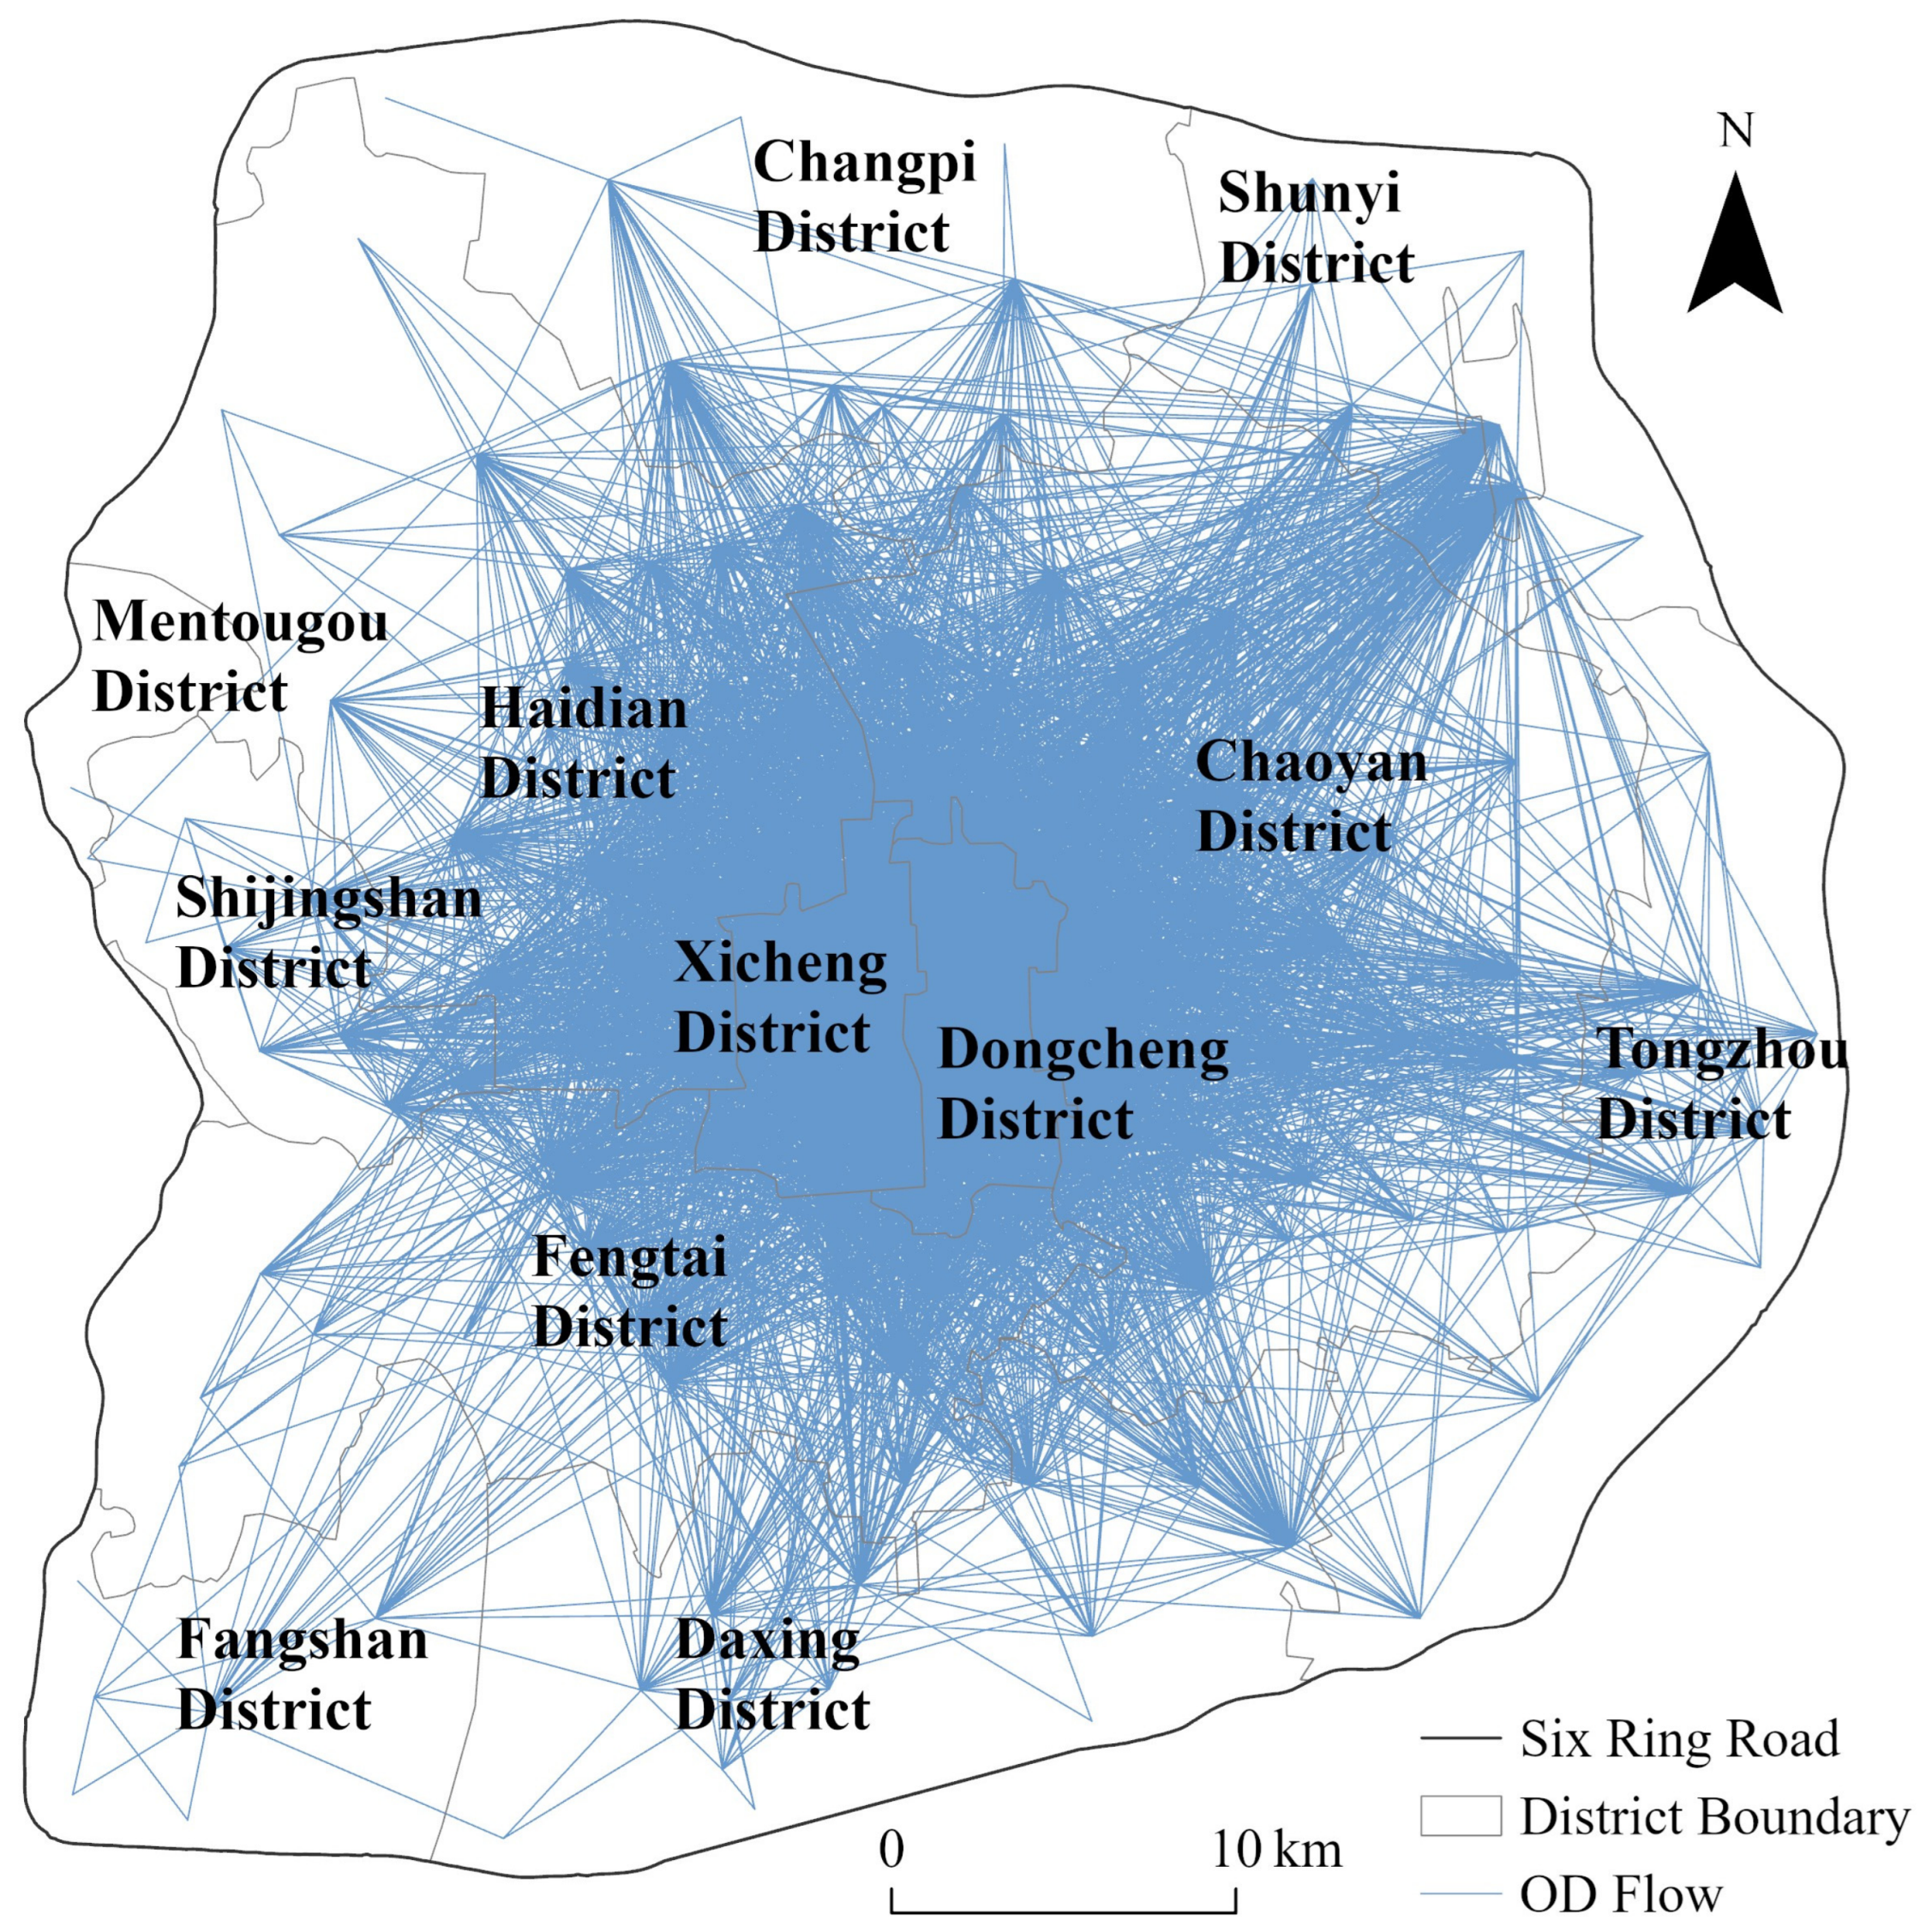
OD preprocessing was performed at the individual-trip level. A record was removed when either O_status or D_status was not 0. In the source dataset, a value of 0 indicates valid positioning, whereas other values, such as 40,000,000, indicate invalid positioning. Records with a missing value in any required field were also removed. We then retained only trips for which both the pickup and drop-off locations were within Beijing’s Sixth Ring Road and both the pickup and drop-off times fell between 10:00 and 16:00. Of the 204,404 raw OD records, 60,304 individual trip records remained after these data-quality, spatial, and temporal filters. Origins were subsequently matched to 500 m buffers of residential POIs, and destinations were matched to 200 m buffers of commercial POIs, yielding 51,172 individual endpoint-matched trip records. The asymmetric buffer distances were selected by combining the spatial thresholds adopted in related POI–trajectory studies [14,15] with the different spatial characteristics of the two types of endpoints. The 500 m residential buffer was intended to accommodate the spatial extent of residential communities and possible displacement between recorded pickup locations, community entrances, and internal access roads. The more restrictive 200 m commercial buffer was used to limit incidental destination matches in dense mixed-use areas while allowing for displacement between drop-off locations and nearby facility entrances or roads. The robustness of this specification was further evaluated using alternative residential and commercial buffer distances, as described in Section 2.2.3. The resulting records are referred to as residential-to-commercial trips. This term describes the spatial relationship between trip origins and destinations rather than their specific purposes. The structure and fields of the processed dataset are presented in Table 2, and the spatial distribution of the retained OD flows is shown in Figure 3.
Table 2.
Data structure and examples of the ride-hailing OD records.
Figure 3.
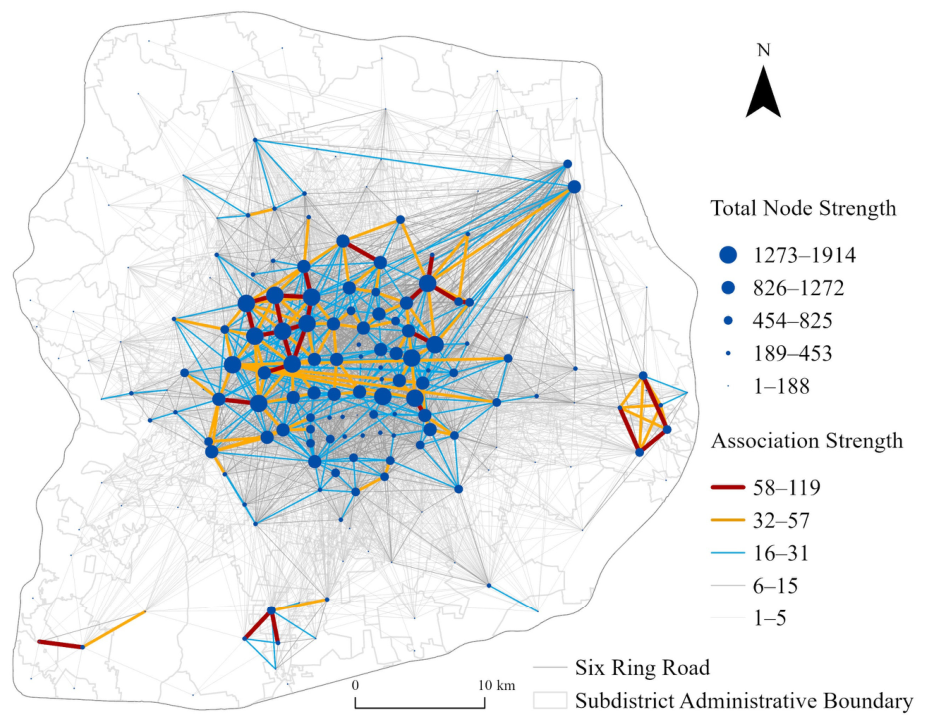
Aggregated residential-to-commercial ride-hailing network within Beijing’s Sixth Ring Road. The network contains 8514 directed inter-subdistrict OD links aggregated from individual trip records. Each link weight, termed association strength, equals the number of individual trips from the origin subdistrict to the destination subdistrict.
The commercial POI data were collected in July 2024, whereas the ride-hailing OD data were recorded on 8 January 2025. This difference arose from the distinct schedules of data availability and acquisition. We considered the two datasets suitable for an exploratory spatial comparison because they represent urban phenomena with different temporal characteristics. The POI data describe the locations and categories of relatively persistent commercial facilities, whereas the OD data capture mobility activities on a specific observation day. Moreover, the analysis focuses on aggregated spatial patterns rather than on a one-to-one correspondence between individual establishments and trips. Therefore, the July 2024 POIs were treated as an approximate representation of the commercial facility configuration around the mobility observation period. Nevertheless, possible facility openings, closures, relocations, and category changes during this interval may introduce uncertainty into the static–dynamic comparison.
2.2.3. Spatial Data Preprocessing, Coordinate System, and Buffer-Distance Sensitivity
All spatial datasets were standardized to CGCS2000/3 Degree Gauss–Krüger Zone 39, with meters as the linear unit. POIs within Beijing’s Sixth Ring Road were filtered by category, yielding 340,788 commercial POIs across six service categories and 7691 residential POIs. As described in Section 2.2.2, data-quality, spatial, and temporal filtering reduced the 204,404 raw OD records to 60,304 individual trip records, and subsequent POI-buffer matching yielded 51,172 individual endpoint-matched trip records. To focus on mobility connections between different subdistricts, 7948 trips with origins and destinations in the same subdistrict were excluded, leaving 43,224 individual inter-subdistrict trip records. The remaining records were aggregated by ordered origin–destination subdistrict pair, producing 8514 directed inter-subdistrict links. Thus, 51,172 represents the number of individual endpoint-matched trip records, whereas 8514 represents the number of aggregated directed links. Each link weight, termed association strength, equals the number of individual trips between the corresponding ordered subdistrict pair.
To evaluate the robustness of the endpoint-matching thresholds, the filtering and network-aggregation procedures were repeated under four one-factor-at-a-time alternatives to the reference scenario S0. S0 used residential and commercial buffers of 500 m and 200 m, respectively. S1 and S2 changed the residential buffer to 300 m and 800 m while retaining the 200 m commercial buffer, whereas S3 and S4 changed the commercial buffer to 100 m and 300 m while retaining the 500 m residential buffer. All scenarios used the same pre-buffer trip pool, subdistrict-assignment procedure, exclusion rules, and set of 190 subdistrict nodes. Relative to S0, the inter-subdistrict trip index ranged from 0.8505 to 1.0841, and the non-zero directed-link index ranged from 0.9016 to 1.0678. More importantly, the Spearman rank correlations of subdistrict total node strength with S0 ranged from 0.9969 to 0.9999, and between 16 and 19 of the 19 highest-strength subdistricts were retained. Thus, although network size varied predictably with the contraction or expansion of the buffers, the principal node hierarchy and core-node pattern remained stable within the evaluated range. These results support the use of the 500 m residential and 200 m commercial buffers as a stable reference specification.
Commercial categories were assigned non-mutually exclusively according to destination–buffer matches; therefore, the six category-specific subnetworks overlapped and should not be summed. For static analysis, aligned KDE rasters were generated for the residential, overall commercial, and six category-specific POI datasets and summarized by zonal means within the 190 subdistricts. This procedure produced one residential-intensity value, one overall commercial-intensity value, and six category-specific commercial-intensity values for each subdistrict.
2.3. Methodology
2.3.1. Kernel Density Estimation Method
Kernel density estimation is a nonparametric method for analyzing the spatial density of point features. By constructing a continuous spatial density surface, it reveals the spatial clustering characteristics of geographic features. The core concept is as follows: with each point feature as the center, the influences of surrounding points on the estimated location are superimposed within a specified search radius (bandwidth); points closer to the center contribute more to the density, ultimately forming a smooth density surface that gradually decays with increasing distance. This study employs a quartic kernel function to investigate the spatial clustering of commercial and residential spaces within a specific region [35]. A fixed search radius, or bandwidth, of 1500 m was used, and the output raster cell size was set to 50 m × 50 m. The 1500 m bandwidth was selected as it provided a balance between preserving local spatial variations and avoiding excessive fragmentation of the density surfaces. The same search radius, cell size, processing extent, raster alignment, and study-area mask were applied to the commercial and residential POI datasets and to all six commercial-service categories to ensure comparability among the resulting density surfaces.
The calculation formula is as follows:
where represents the kernel density estimate at location ; is the search radius, also known as the bandwidth, denotes the Euclidean distance between location and the i-th POI; is the weight for the i-th POI; when no weight field is specified, = 1; and is the number of POIs within the search radius included in the calculation. The higher the kernel density value, the denser the distribution of POIs around that location, and the stronger the spatial clustering.
2.3.2. Average Nearest Neighbor Analysis
The average nearest neighbor analysis is a spatial statistical method that calculates the average distance from each point to its nearest neighbors, compares it with the expected mean distance under a random distribution, and derives the nearest neighbor ratio to determine the spatial distribution pattern of point features (clustered, random, or dispersed) [36,37].
The calculation formula is as follows:
where is the observed mean distance, is the expected mean distance under a random distribution, is the total number of features, and is the total area of the study area. If < 1, the observed mean distance is less than the expected mean distance under a random distribution, indicating that the point features exhibit a clustered pattern. The smaller the is, the higher the degree of clustering. If > 1, the point features exhibit a dispersed pattern; the larger the is, the higher the degree of dispersion.
2.3.3. Global Spatial Autocorrelation and Bivariate Spatial Association Analysis
To account explicitly for spatial autocorrelation and spatial dependence, Global Moran’s I was calculated separately for residential intensity, overall commercial intensity, and the six commercial-service categories [38,39]. Bivariate Moran’s I was then calculated to assess the spatial association between residential intensity in a focal subdistrict and the spatially lagged commercial intensity of its neighboring subdistricts [40]. A first-order Queen-contiguity matrix was constructed from the 190 subdistrict polygons, with polygons sharing either an edge or a vertex treated as neighbors. The resulting matrix contained 519 undirected neighbor pairs and no spatially isolated units, and it was row-standardized.
The calculation formula is as follows:
where is the number of subdistricts; is the row-standardized spatial weight between subdistricts and ; is the sum of all spatial weights; is the standardized intensity of variable in subdistrict ; and is the standardized intensity of variable in neighboring subdistrict j. In the bivariate analysis, represents residential intensity in the focal subdistrict and represents overall or category-specific commercial intensity in neighboring subdistricts. A positive bivariate Moran’s I indicates that higher residential intensities tend to occur near higher commercial intensities and lower residential intensities tend to occur near lower commercial intensities.
2.3.4. Network Construction and Strength-Based Node Centrality Assessment
Network analysis represents a system through nodes and the links between them [41]. This approach has been applied to urban networks using population-movement data [42,43]. In this study, we constructed a directed, weighted network in which subdistricts represent nodes and residential-to-commercial OD trips define the links. Let denote the number of retained trips from subdistrict i to subdistrict j, with = 0 when no such trip is observed. Within-subdistrict trips were excluded from the inter-subdistrict network, and was set to zero. Node centrality was assessed in terms of observed trip volume using out-strength, in-strength, and total node strength. Unlike degree, which counts connections, strength sums their weights [44]. The corresponding measures are defined as follows:
where is the out-strength of subdistrict i; is the number of trips traveling from subdistrict i to subdistrict j; is the in-strength of subdistrict i; is the number of trips traveling from subdistrict j to subdistrict i; is the total node strength of subdistrict i; and n is the number of nodes in the network.
Out-strength and in-strength measure the volumes of observed trips originating from and arriving at a subdistrict, respectively. Their sum, total node strength, measures its overall involvement in the observed OD flows. Total node strength was used for node assessment and five-tier classification using the Jenks natural breaks method, with the first tier representing the highest values. For the overall network, Jenks class breaks were calculated using the 182 subdistricts with positive total node strength. The remaining eight subdistricts had zero total node strength. They were retained in the 190-node network but excluded from the Jenks classification and displayed as unclassified areas in the tier map. The same strength definitions were applied to the overall network and each commercial-category subnetwork. These measures were selected because the analysis focuses on direct OD interaction intensity and its spatial distribution. The directional components distinguish outgoing and incoming trip volumes, while their sum provides the basis for comparing node activity levels. Together with the mapped OD links, they support the analysis of node-strength tiers and the spatial distribution of strong connections.
2.3.5. Subdistrict-Level Static–Dynamic Comparison
To directly compare static facility patterns and dynamic mobility at the same spatial level, all measures were aligned to the 190 subdistricts. Static intensity was represented by the zonal mean of each KDE surface. Dynamic destination intensity was represented by inbound trip intensity, calculated as each subdistrict’s in-strength divided by its area in square kilometers. In-strength measures arrivals from other subdistricts at destinations near commercial POIs. Within-subdistrict trips were excluded to maintain the same inter-subdistrict flow definition used in the network analysis. Accordingly, inbound trip intensity captures arrivals from other subdistricts rather than all residential-to-commercial arrivals within a subdistrict.
For the overall commercial dataset and each of the six service categories, Spearman’s rank correlation coefficients were calculated as descriptive measures of monotonic rank correspondence between static commercial–residential matching and dynamic travel intensity at the subdistrict level [45]. Spearman’s correlation was calculated as the Pearson correlation between the ranks of the two variables, with tied observations assigned their average ranks [46]. Because conventional Spearman p-values do not account for spatial dependence among subdistricts, the coefficients are interpreted descriptively, and no conventional significance tests are reported. The Spearman rank correlation coefficient used in the descriptive analysis was calculated as follows:
where and denote the ranks of the static matching indicator and dynamic travel-intensity indicator for subdistrict i, respectively; and are their mean ranks; and n is the number of subdistricts included in the analysis.
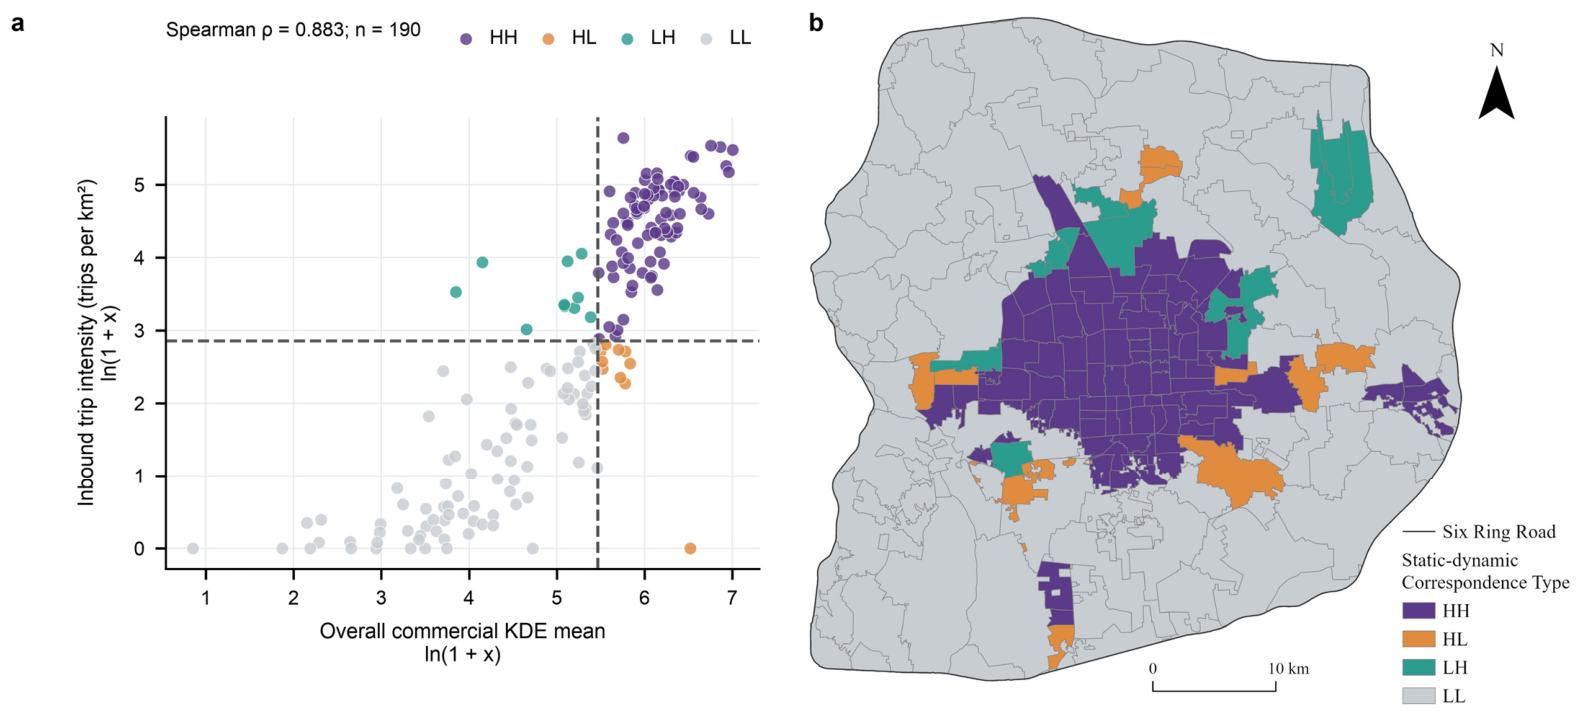
To further characterize static–dynamic correspondence in the overall commercial dataset, subdistricts were classified according to whether their commercial KDE intensity and inbound trip intensity were above or below the respective sample medians. Four descriptive correspondence types were defined: HH (high facility intensity and high inbound mobility intensity), HL (high facility intensity and low inbound mobility intensity), LH (low facility intensity and high inbound mobility intensity), and LL (low facility intensity and low inbound mobility intensity). Accordingly, “high” and “low” indicate positions relative to the study-area medians rather than compliance with planning standards. The ln(1 + x) transformation was applied only to improve the visualization of the scatter plot; Spearman’s ρ and the classification thresholds were calculated using the untransformed values.
3. Results
3.1. Analysis of Static Interaction Patterns Between Commercial and Residential Spaces
3.1.1. Spatial Distribution Patterns of Commercial Areas
An average nearest neighbor analysis was conducted on the spatial point features of commercial facilities within Beijing’s Sixth Ring Road to investigate their spatial clustering characteristics. The results showed that the average nearest neighbor ratio for commercial facilities within Beijing’s Sixth Ring Road was 0.315, which is significantly less than 1 (p-value < 0.01), indicating a significant clustering pattern. Kernel density estimation was subsequently applied to examine the spatial distribution of commercial facilities within Beijing’s Sixth Ring Road. The results revealed that commercial facilities in the study area as a whole exhibit a spatial distribution pattern characterized by “high values in the center and low values in the periphery, a patch-based polycentric pattern, and stronger development in the east than in the west.” The main spatial distribution characteristics are as follows:
- (1)
- High values in the center and low values at the periphery
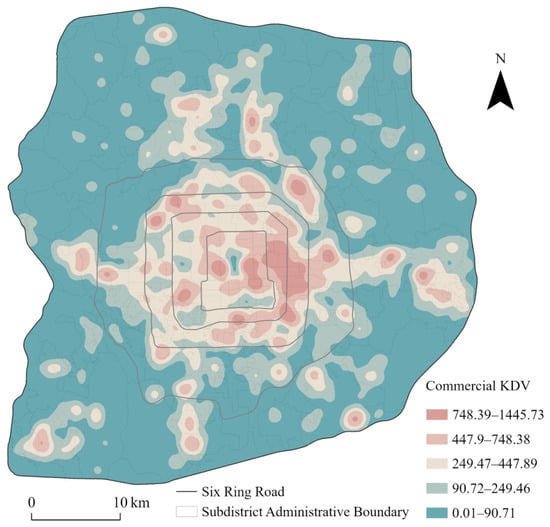
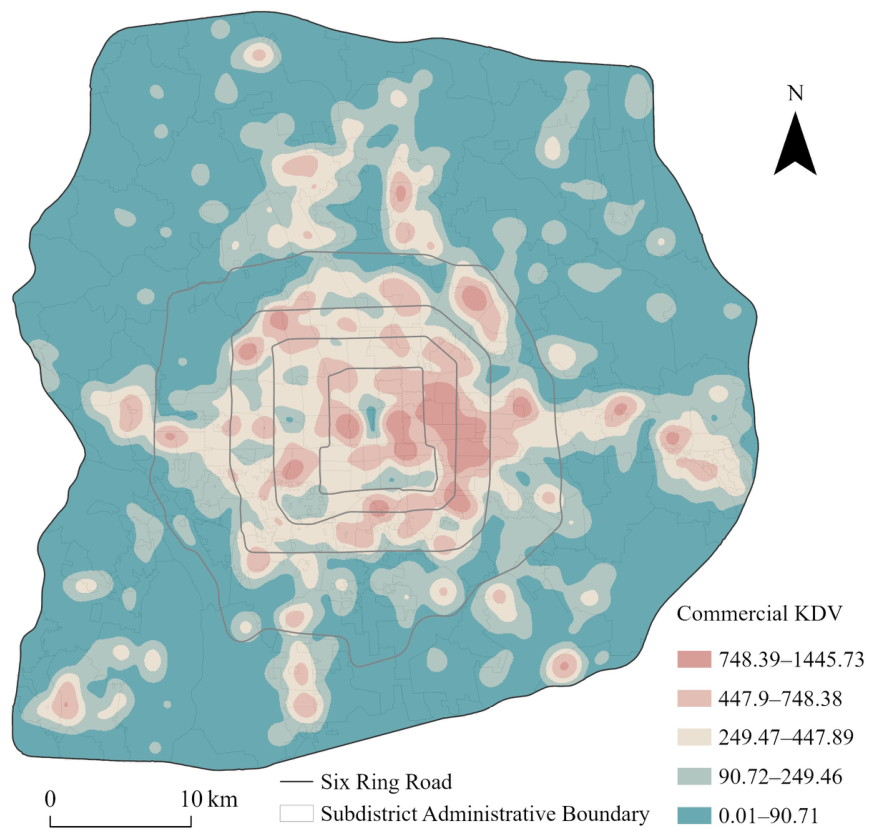
Based on the kernel density values for commercial POIs (Figure 4), commercial KDE values ranged from 0.001 to 1445.734 across the study area, indicating extremely strong spatial polarization. Level 1 density zones are compactly distributed in the core areas to the east and southeast of the central urban area, with a few concentrated on the western side. These primarily involve the three administrative districts of Xicheng District, Dongcheng District, and Chaoyang District, with Chaoyang District accounting for the largest share. Although these areas occupy a small proportion of the territory within the Sixth Ring Road, they host the city’s highest density of commercial POIs, forming a single, continuous density patch, indicating that commercial activities in these areas show a pronounced spatial concentration. As one moves from the center toward the periphery, density values drop rapidly. Specifically, Level 2 high-density areas form a semi-ring surrounding the core, though their width is limited. Further outward, the distribution transitions to Level 3 and Level 4 density zones, with Level 5 density zones ultimately distributed widely across most of the area within the Sixth Ring Road. The density of commercial points within the Sixth Ring Road exhibits a “steep” gradient decay. At the same time, the kernel density of the vast majority of towns and townships within the Sixth Ring Road is generally below 90.713, further confirming that the distribution of commercial space experiences an “abrupt” drop from the core to the periphery, rather than a gradual transition.
Figure 4.
Kernel density of the overall commercial spaces.
- (2)
- Band-like and patch-based polycentric patterns
Although commercial POIs were strongly concentrated in the central area, the high-density zones did not decline uniformly in concentric rings. Strip-like extensions and several small, spatially discontinuous secondary clusters were visible outside the core, including Beiyuan in Tongzhou, the Yizhuang core area, Xihongmen, and Huilongguan. Fourth-tier zones were more scattered, and several isolated high-density patches occurred near Daxing International Airport and Shahe Higher Education Park. Overall, the pattern combined a dominant central cluster with discontinuous secondary clusters.
- (3)
- Stronger in the east than in the west
Based on a kernel density analysis of commercial POIs, high-value areas in the eastern region (particularly eastern Chaoyang District, parts of Tongzhou District, and the Yizhuang area of Daxing District) were more extensive in contiguous area and reached higher peak intensities than those in the western region (western Shijingshan District, Mentougou District, and the mountainous areas of Fangshan District). This pattern is even more pronounced outside the Fourth Ring Road. Areas west of the Fourth Ring Road generally fall into the lowest-level, Level 5 commercial density zone, while the area east of the Fourth Ring Road features a scattered distribution of Level 4 density zones. Overall, commercial high-density areas were more extensive and intense in the east than in the west, particularly outside the Fourth Ring Road.
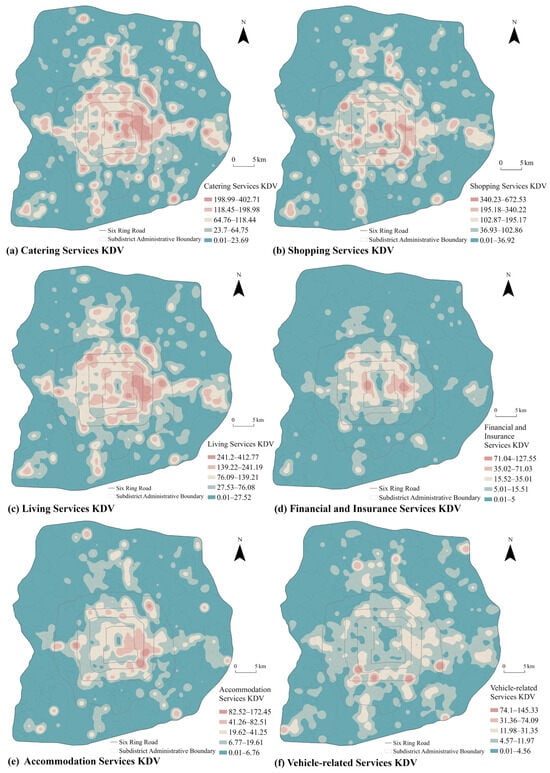
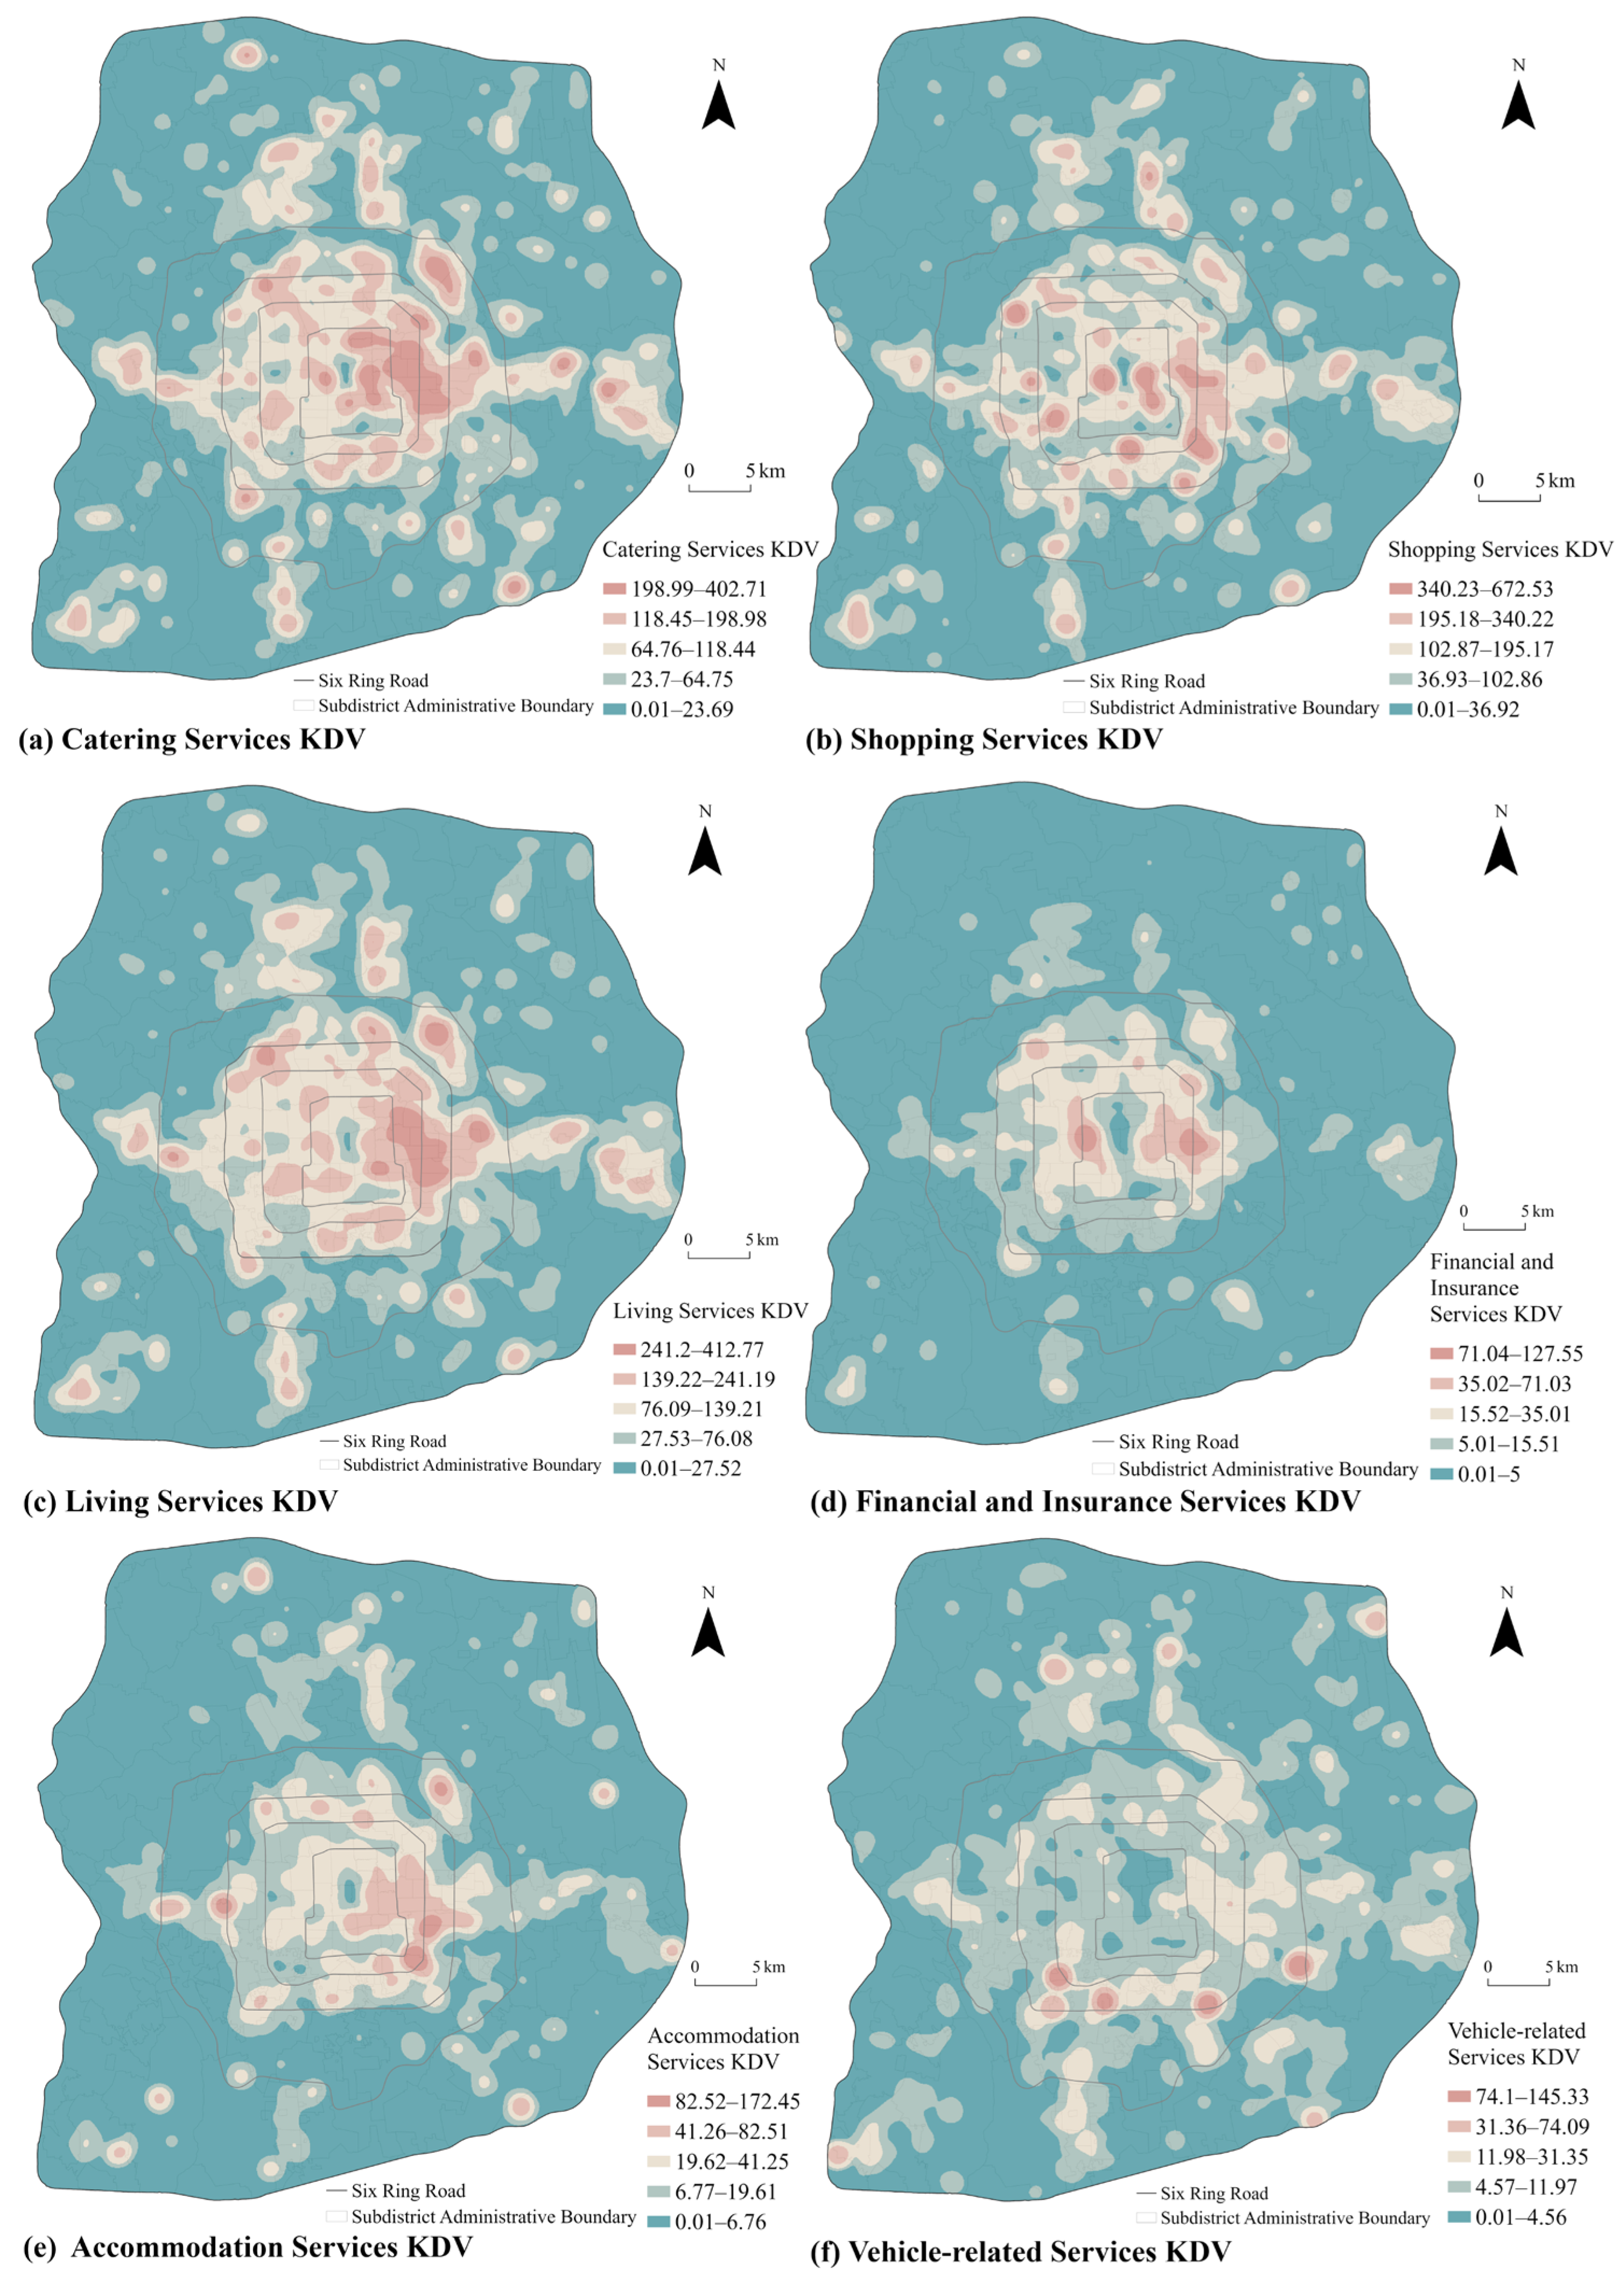
Based on the spatial distribution characteristics of commercial facilities within Beijing’s Sixth Ring Road, this study examines the spatial distribution patterns of different commercial service categories across the urban space. An average nearest neighbor analysis of POI data for different commercial facilities revealed (Table 3) that all types of commercial facilities exhibit a high degree of clustering, with clustering intensity ranked as follows: catering services > financial and insurance services > shopping services > living services > accommodation services > vehicle-related services. Given statistically significant clustering, kernel density results further reveal the spatial organization of commercial facilities, as shown in Figure 5.
Table 3.
Average nearest neighbor analysis of various commercial formats.
Figure 5.
Kernel density of various commercial service categories.
Comparison of the six commercial categories showed that all were significantly clustered, but their clustering intensity and hotspot locations differed. Catering services had the lowest ANN ratio, followed by financial and insurance, shopping, living, accommodation, and vehicle-related services. Catering, shopping, and living services most closely resembled the overall commercial KDE pattern, whereas financial and insurance and accommodation services formed more localized high-density clusters. Vehicle-related services had the highest ANN ratio and therefore the weakest clustering among the six categories. Their high-density clusters occurred more frequently outside the Old City core, particularly in southern, eastern, and southwestern subdistricts, including Lugouqiao, Majiabao, Xiaohongmen, Wangsiying, Xilu, and Majuqiao. These findings describe category-specific spatial patterns but do not establish the socioeconomic, land-use, or transport factors responsible for them.
3.1.2. Spatial Distribution Patterns of Residential Areas
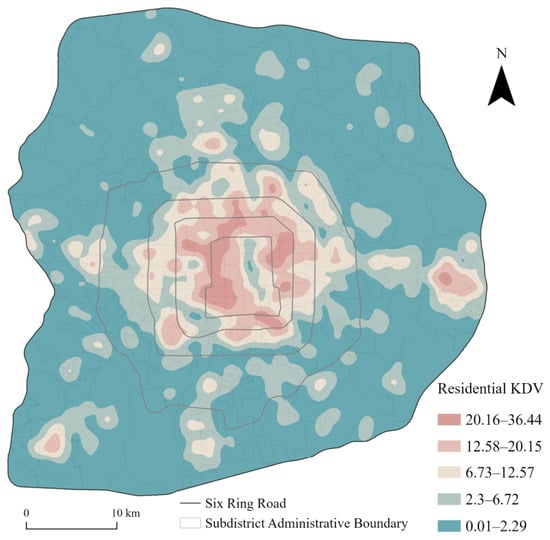
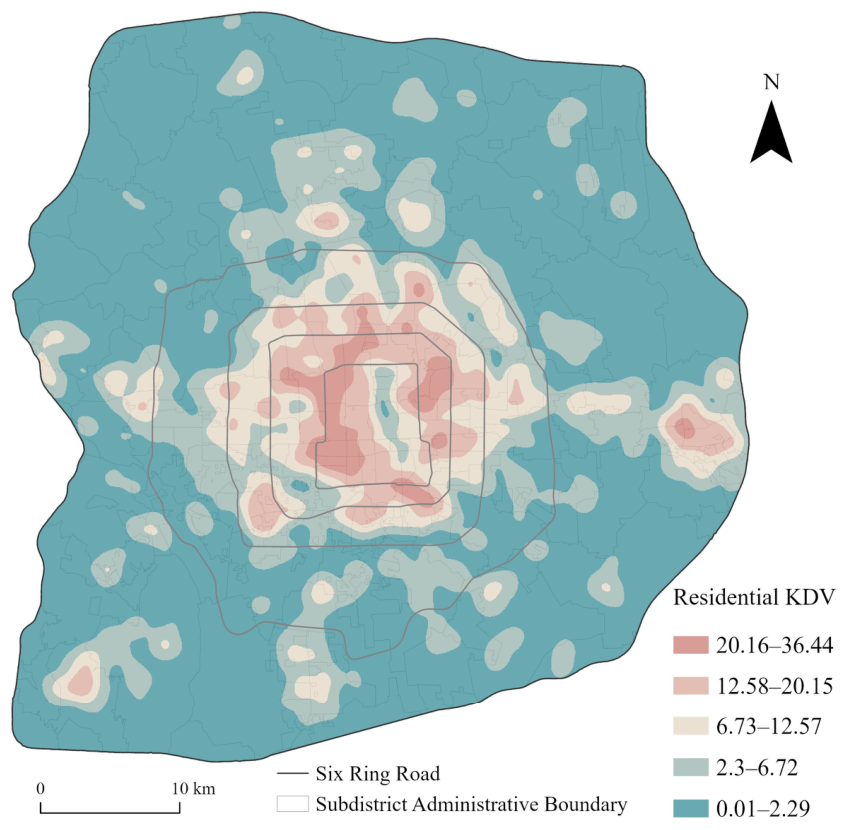
As shown in Figure 6, residential and commercial POIs both exhibited central clustering and more dispersed peripheral distributions. The average nearest neighbor ratio for residential POIs was 0.739 (p < 0.01), indicating statistically significant clustering. However, residential POIs were less strongly clustered than commercial POIs, which had an average nearest neighbor ratio of 0.315. The residential KDE surface also showed a more continuous core–periphery gradient and a relatively stronger presence in western Beijing, whereas commercial POIs exhibited a sharper decline from the central high-density areas toward the periphery.
Figure 6.
Kernel density of the overall residential spaces.
From the perspective of the overall spatial distribution pattern, the kernel density of residential POIs within Beijing’s Sixth Ring Road shows a clear central concentration and peripheral decline, forming a typical “core-transition-periphery” multi-layered ring structure. Based on the graded distribution of kernel density values, it is evident that Level 1 and Level 2 density zones are primarily concentrated in the central-western and central-southern regions of the Sixth Ring Road, forming contiguous clusters. This pattern reflects high-intensity residential agglomeration belts centered on Haidian District, Xicheng District, northern Fengtai District, and western Chaoyang District. However, high-density residential clusters were not confined to the central urban area and were also observed in parts of Tongzhou. Level 3 zones formed a relatively continuous transition around the core, including parts of Tongzhou and Shijingshan. Level 4 and Level 5 zones were concentrated near the study-area boundary and in the northern and southern peripheral areas, where they formed discrete point-like or patch-like distributions. Overall, residential POIs exhibited a more continuous core–periphery gradient than commercial POIs.
3.1.3. Spatial Autocorrelation and Bivariate Spatial Association Between Commercial and Residential Spaces
To further examine the static interaction patterns between commercial and residential spaces while accounting for spatial dependence, Global Moran’s I and bivariate Moran’s I analyses were conducted using subdistrict-level zonal mean KDE intensities. All eight KDE-intensity variables exhibited significant positive global spatial autocorrelation across the 190 subdistricts (Global Moran’s I = 0.435–0.786; all permutation p = 0.0001; Table 4). Residential intensity had the largest Global Moran’s I (I = 0.786), followed by living services (I = 0.732), overall commercial intensity (I = 0.725), and catering services (I = 0.725). Vehicle-related services had the smallest positive value (I = 0.435). These results indicate that residential and commercial intensities formed spatially clustered patterns at the subdistrict scale rather than spatially random arrangements.
Table 4.
Global Moran’s I and bivariate Moran’s I for subdistrict-level residential and commercial KDE intensity.
Bivariate Moran’s I showed a positive neighborhood-scale spatial association between residential intensity in focal subdistricts and overall commercial intensity in adjacent subdistricts (I = 0.645, permutation p = 0.0001, FDR-adjusted q = 0.000117). Among the six commercial categories, the largest observed bivariate association was found for living services (I = 0.642), followed by financial and insurance services (I = 0.633), catering services (I = 0.618), shopping services (I = 0.608), accommodation services (I = 0.562), and vehicle-related services (I = 0.282). All seven bivariate associations remained statistically supported after FDR correction (q ≤ 0.0002).
The positive bivariate statistics indicate that subdistricts with higher residential intensity tended to be located near subdistricts with higher commercial intensity, whereas lower residential intensities tended to occur near lower commercial intensities. The comparatively smaller value for vehicle-related services is consistent with their more peripheral KDE distribution shown in Figure 5. These global statistics characterize average spatial association across the study area and do not identify statistically significant individual subdistrict clusters. These analyses establish the spatial structure of the static variables; their direct comparison with observed inbound mobility at the same subdistrict scale is presented in Section 3.3.
3.2. Analysis of Dynamic Interaction Patterns Between Commercial and Residential Spaces
3.2.1. Node Hierarchy Characteristics of the Residential-to-Commercial Travel Subdistrict-Level Network
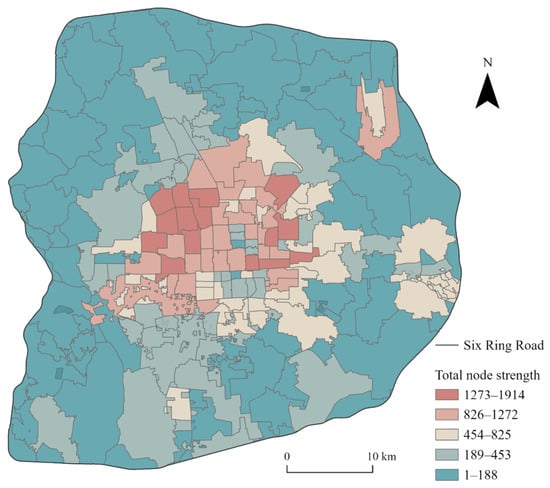
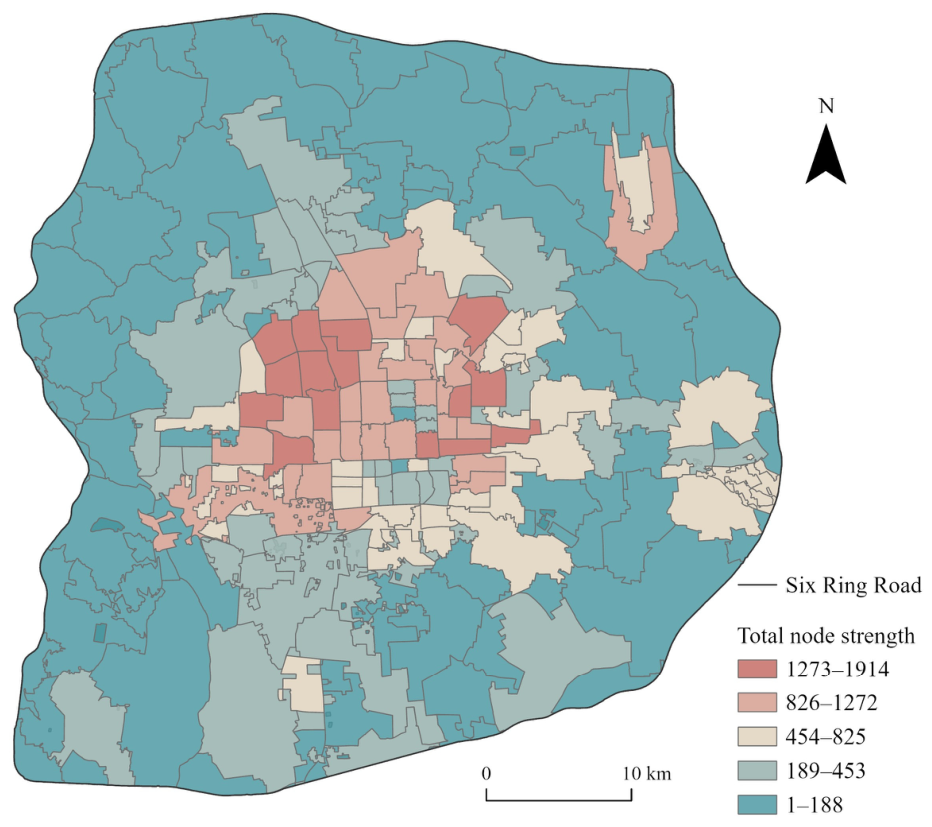
The dynamic interaction between commercial and residential spaces is not simply a superposition of individual travel flows but rather a network structure composed of subdistrict nodes and their interconnections. The following results describe residential-to-commercial ride-hailing mobility observed on 8 January 2025 and do not represent temporal variability across weekdays, weekends, or seasons. Subdistricts were evaluated using total node strength, defined as the sum of incoming and outgoing OD trip volumes in Section 2.3.4. To provide a concise representation of the hierarchical distribution of subdistrict nodes, the total node strength values were classified into five tiers using the Jenks natural breaks method [8,14,15,47]. This method identifies class breakpoints by minimizing within-class variance and maximizing between-class differences, thereby reflecting the main discontinuities in the observed distribution. The Jenks classification was applied to the 182 subdistricts with positive total node strength. The eight zero-flow subdistricts were excluded from the calculation of class breaks and remained unclassified in Figure 7. The resulting intervals were 1273–1914 for the first tier, 826–1272 for the second tier, 454–825 for the third tier, 189–453 for the fourth tier, and 1–188 for the fifth tier (Table 5).
Figure 7.
Spatial distribution of total node strength.
Table 5.
Subdistrict total node strength level classification.
Among the 182 classified subdistricts, first- and second-tier subdistricts together accounted for 23.07%, while fourth- and fifth-tier subdistricts accounted for 60.44%. The fifth tier alone accounted for 37.91%. The other eight subdistricts in the 190-node network had zero total node strength and were not assigned to a Jenks tier. This indicates that total node strength is not evenly distributed across subdistricts. Relatively few subdistricts fell into the highest strength tiers, whereas most were classified in the middle or lower tiers. The lowest value for first-tier subdistricts (1273) is approximately 6.77 times the highest value for fifth-tier subdistricts (188), further illustrating the substantial differences in observed trip volume between the highest and lowest strength tiers.
From an overall spatial perspective, total node strength shows a pattern of “high values in the center, multi-directional expansion in the inner suburbs, and widespread low values in the periphery” (Figure 7). High-level subdistricts are primarily located in the central urban area and its adjacent high-density built-up areas, forming continuous or semi-continuous high-value belts extending toward the northwest, east, and northeast. By contrast, low-level subdistricts form extensive background zones along the edge of the Sixth Ring Road. Therefore, total node strength within Beijing’s Sixth Ring Road does not follow a simple, evenly dispersed pattern across the entire area, nor does it form concentric layers with the traditional old city center as the peak and a uniform outward decline. Rather, it is characterized by several high-strength clusters within an overall centrally concentrated pattern.
Fourteen subdistricts were classified as first-tier nodes, including Balizhuang, Zhanlanlu, Huayuanlu, Beitaipingzhuang, and Wangjing. First-tier nodes were concentrated mainly in southeastern Haidian and central and western Chaoyang, with fewer located in Dongcheng and Xicheng. Among these, the subdistricts of Zhongguancun, Beitaipingzhuang, Huayuanlu, Beixiaguan, and Zizhuyuan collectively form a high-value cluster in the northwest; the subdistricts of Wangjing, Jianwai, Sanlitun, and Maizidian form a high-value cluster in the east and northeast. The highest node strength values were therefore not confined to the traditional old city but also occurred in adjacent parts of Haidian and Chaoyang. Second- and third-tier subdistricts were distributed mainly around the high-value clusters. These included Desheng, Xueyuanlu, Wanshoulu, and Zuojiazhuang in the second tier, and Shuguang, Xiaoguan, Nanmofang, and Jiuxianqiao in the third tier. Fourth- and fifth-tier subdistricts constituted the largest share and formed a broad low node strength background across the study area. Fourth-tier nodes included Wangjing Development District, Huaxiang, Majiabao, and Jiaodaokou, showing that medium-to-low node strength also occurred in several central or near-central subdistricts. Fifth-tier nodes included Guanzhuang, Dongba, Qianmen, and Jiugong, covering both peripheral subdistricts and selected locations within the traditional urban core. Together, these patterns show that node strength did not correspond uniformly to a simple central–peripheral gradient.
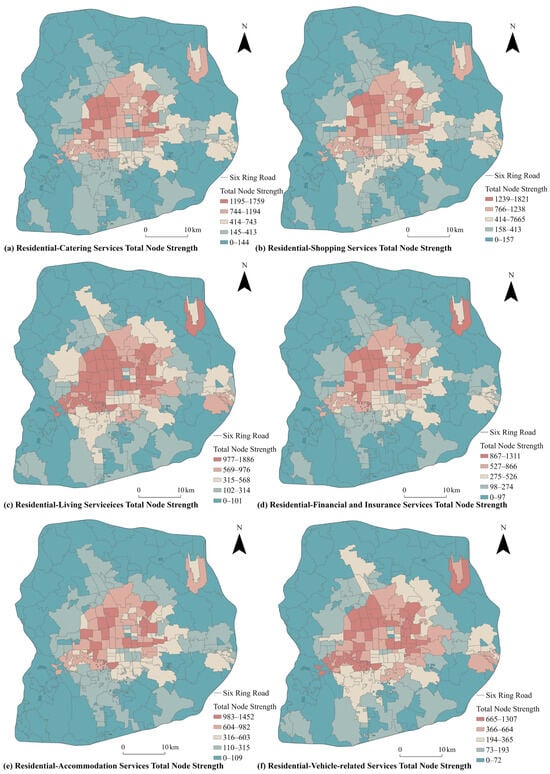
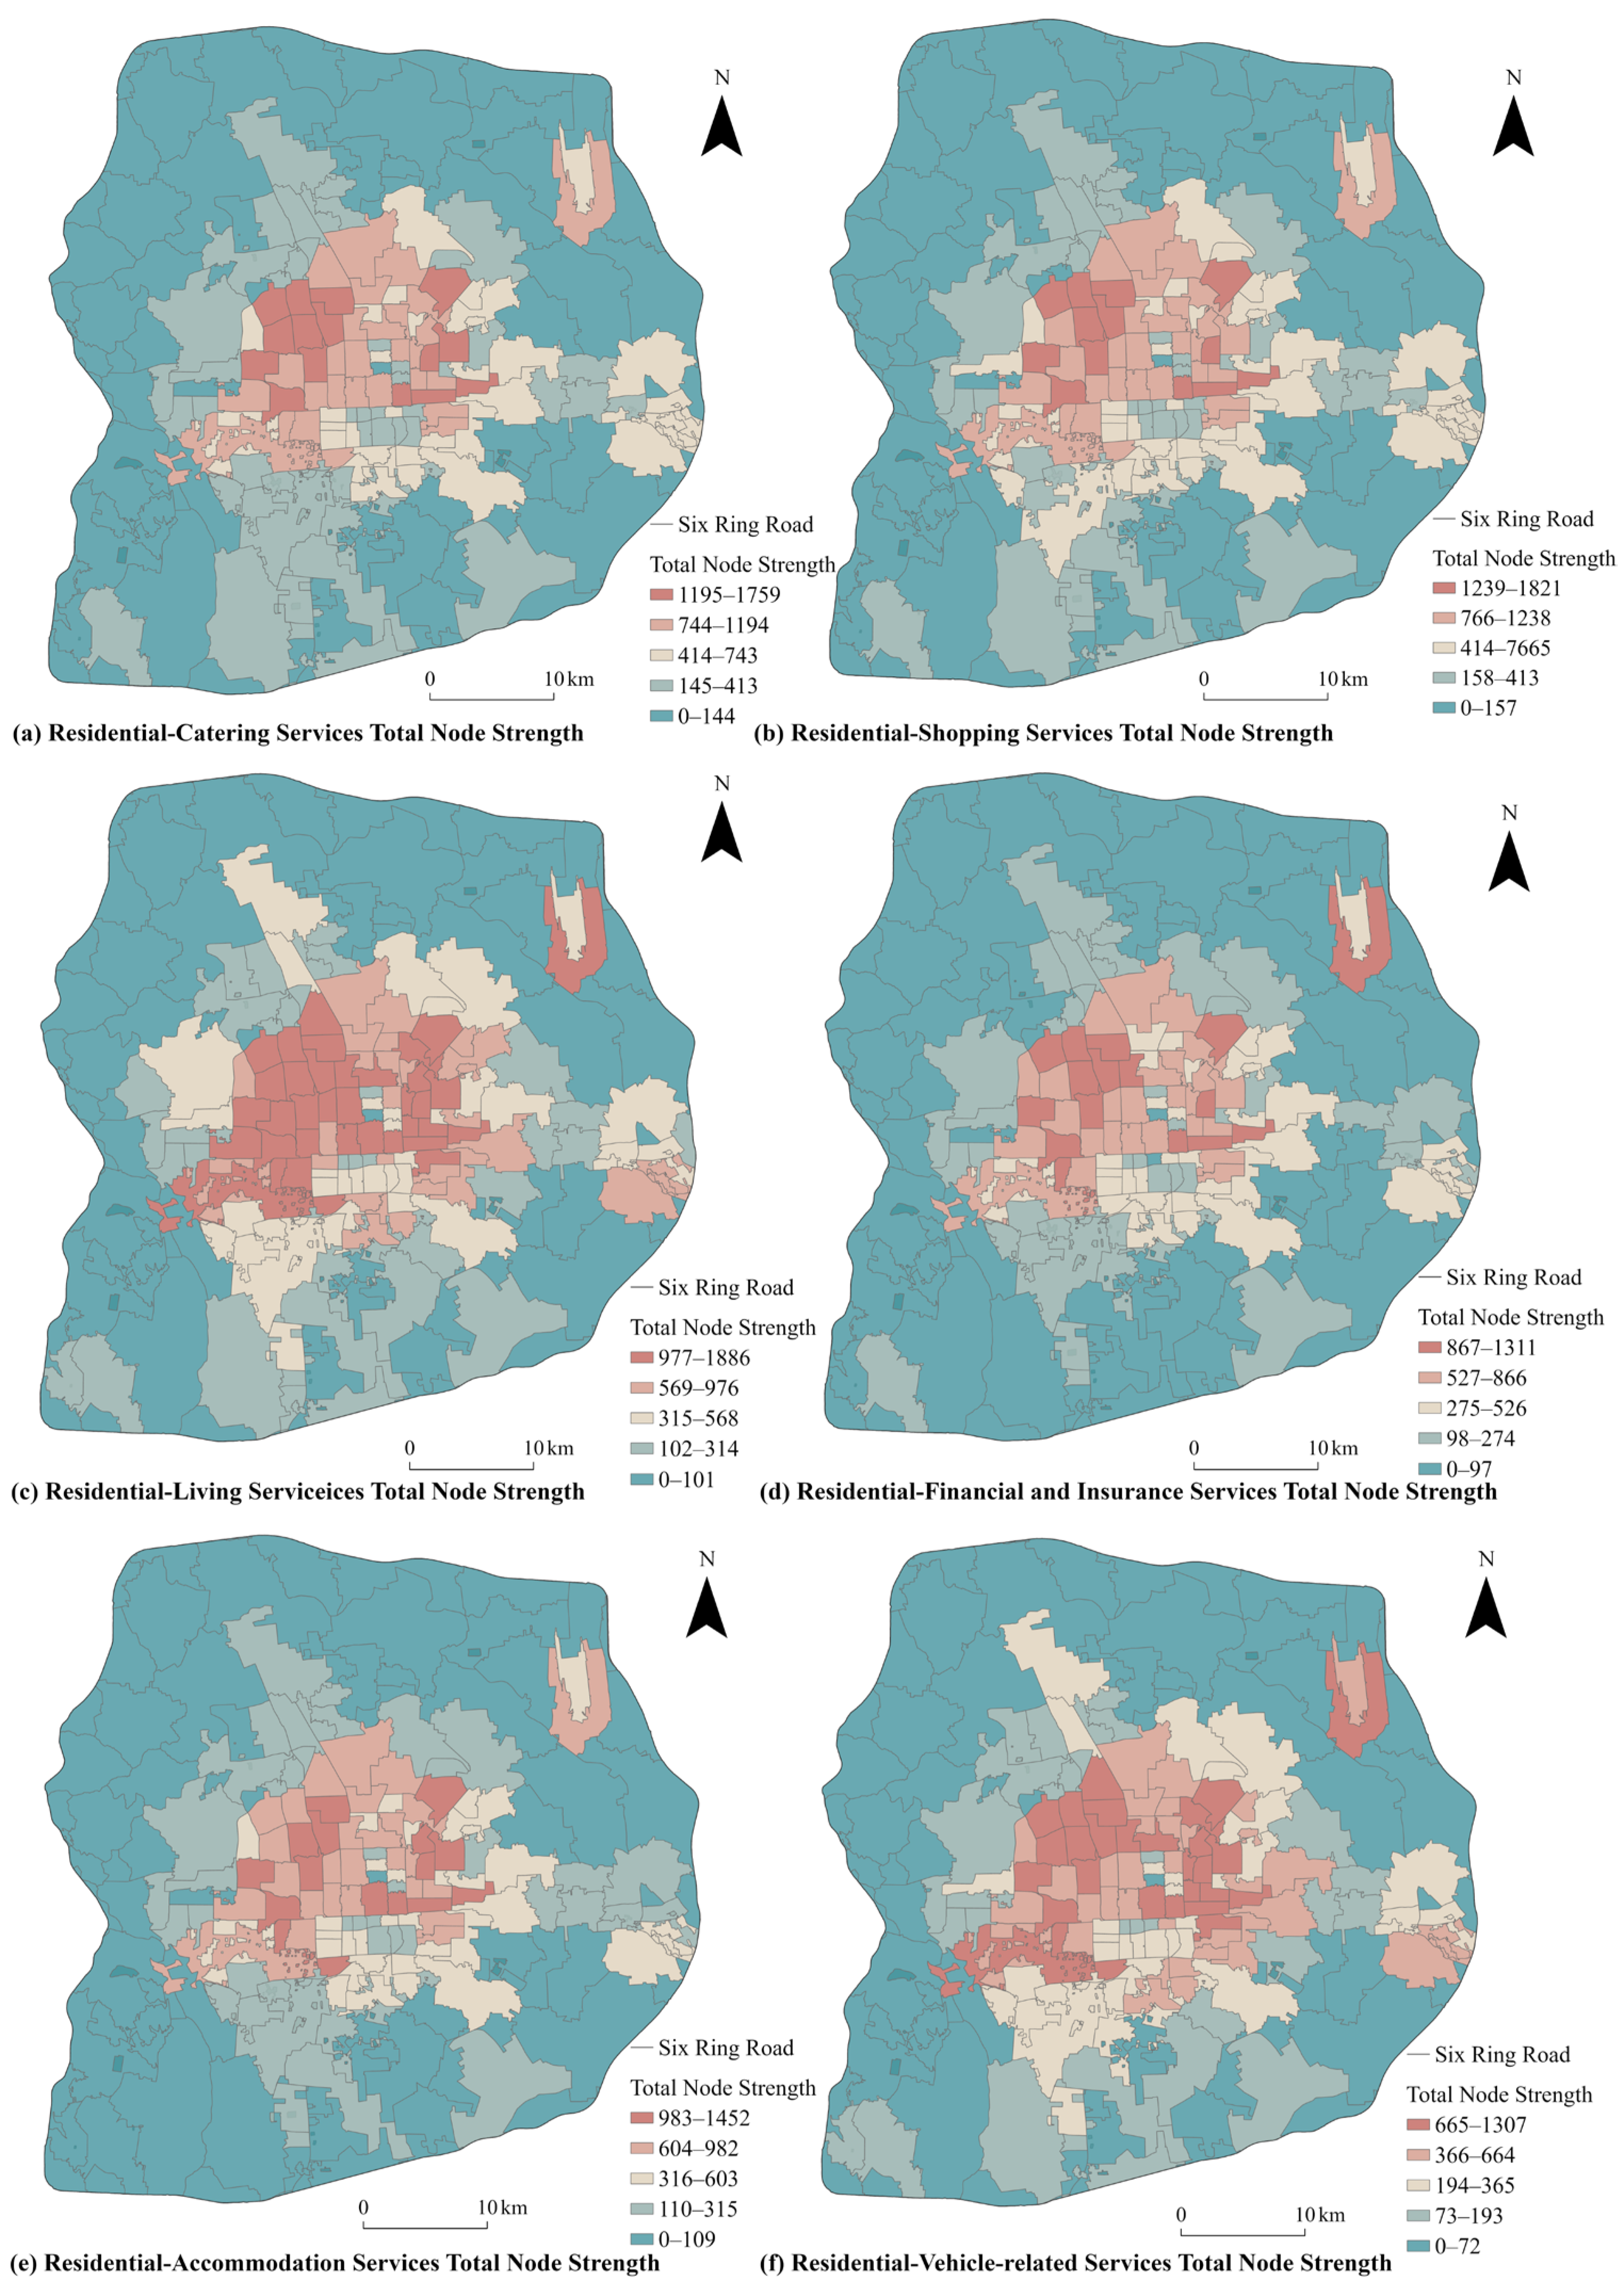
Based on the overall total node strength characteristics of commercial and residential travel within Beijing’s Sixth Ring Road, this study examines total node strength under OD travel patterns across different commercial service categories. It should be noted that urban commercial spaces are characterized by mixed-use functions and co-located facilities; multiple commercial POIs may occur near a single OD destination. Therefore, this study uses a non-mutually exclusive identification method for the six categories of residential-to-commercial OD flows: catering services, shopping services, living services, financial and insurance services, accommodation services, and vehicle-related services. Specifically, when an OD destination falls within the buffer zone of a commercial POI of a certain category, that OD is identified as a flow associated with that commercial function. Because a single OD flow could be assigned to more than one category, the six subnetworks overlap and should not be summed. At the same time, the distribution maps of total node strength for the six categories are classified according to their respective node strength values, making them suitable for comparing relative hierarchies, hotspot locations, and spatial continuity within each category, but not for directly comparing absolute magnitudes across different legends.
As shown in Figure 8, the distribution of total node strength across the six categories of residential-to-commercial OD flows exhibits a common pattern: high values cluster in the central urban area and its neighboring subdistricts, with a transitional expansion in the inner suburbs and a widespread distribution of low values along the periphery of the Sixth Ring Road. Subdistricts with high node strength are not evenly distributed across the entire area but are concentrated in high-density built-up areas such as southeastern Haidian, the outskirts of Dongcheng and Xicheng, and western and northeastern Chaoyang. Compared with static facility density, total node strength describes the relative strength of observed incoming and outgoing OD connections associated with each commercial category.
Figure 8.
Spatial distribution of total node strength of various commercial service categories.
Differences across commercial service categories are primarily reflected in the coverage of high-value areas and the nature of peripheral hotspots. Catering, shopping, and living services formed relatively continuous medium-to-high node strength belts around the central urban area. Living services included 36 first-tier subdistricts, accounting for 18.95% of all 190 subdistricts, the largest number among the six categories. Financial and insurance services and accommodation services included 80 and 76 fifth-tier subdistricts, accounting for 42.11% and 40.00%, respectively. These were the largest fifth-tier shares among the six categories. Within the separately classified maps, peripheral subdistricts in the vehicle-related subnetwork more frequently appeared in the higher node strength tiers. Several peripheral subdistricts were classified in the second tier of the vehicle-related subnetwork, whereas peripheral subdistricts in the catering subnetwork were mostly classified in the third to fifth tiers.
3.2.2. Dynamic Interaction Patterns of Residential-to-Commercial Travel Network
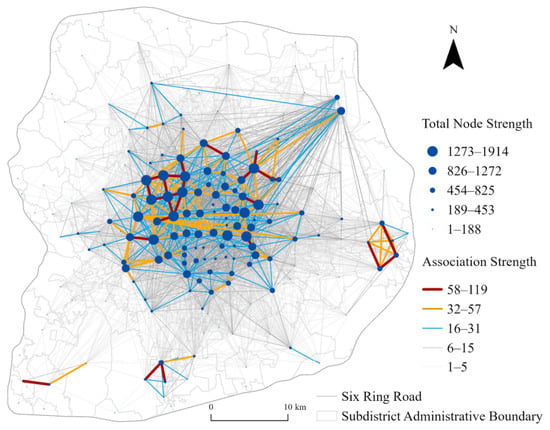
Building on the subdistrict-level node hierarchy, we calculated association strength between subdistricts to construct the overall residential-to-commercial ride-hailing OD network within Beijing’s Sixth Ring Road (Figure 9). The network showed concentrated high-strength connections in the central urban area, multidirectional extensions into the inner suburbs, and several peripheral clusters.
Figure 9.
Overall residential-to-commercial travel network.
In the central urban area, the densest connections were not located in the innermost subdistricts, such as Qianmen and Chang’an Avenue, but primarily in Haidian and Chaoyang. Haidianjiedao, Zhongguancun, Beixiaguan, Beitaipingzhuang, Huayuanlu, and Zizhuyuan formed high-value clusters in the west and northwest. Most connections within these clusters were classified at the highest level (58–119), although such high-strength links were relatively few. Jianwai, Sanlitun, Maizidian, and Wangjing formed high-value clusters in the east and northeast. A small number of high-strength connections also occurred in peripheral subdistricts. These included Yongshun Subdistrict Office, Liyuan Subdistrict Office, Yuqiao, and Beiyuan in Tongzhou; Qingyuan, Xingfeng, and Huangcun Subdistrict Office in Daxing; and Gongchen and Xilu in Fangshan.
Rather than being dominated by a single subdistrict, the central urban network comprised several clusters of subdistricts with high node strength. Second- and third-tier connections were concentrated between central urban subdistricts and several high-strength nodes in the inner suburbs. Third-tier connections extended northwestward, eastward, northeastward, and southward, showing relatively strong residential-to-commercial OD connections between the central urban area and the inner suburbs.
Compared with the central urban area, the inner suburbs contained fewer high-level nodes and a less dense network. Localized medium- and high-level connections occurred in eastern Tongzhou, among Qingyuan, Xingfeng, and Huangcun in Daxing, and between Gongchen and Xilu in Fangshan. High-level links between these peripheral clusters remained limited and discontinuous, whereas fourth- and fifth-tier links covered most of the study area.
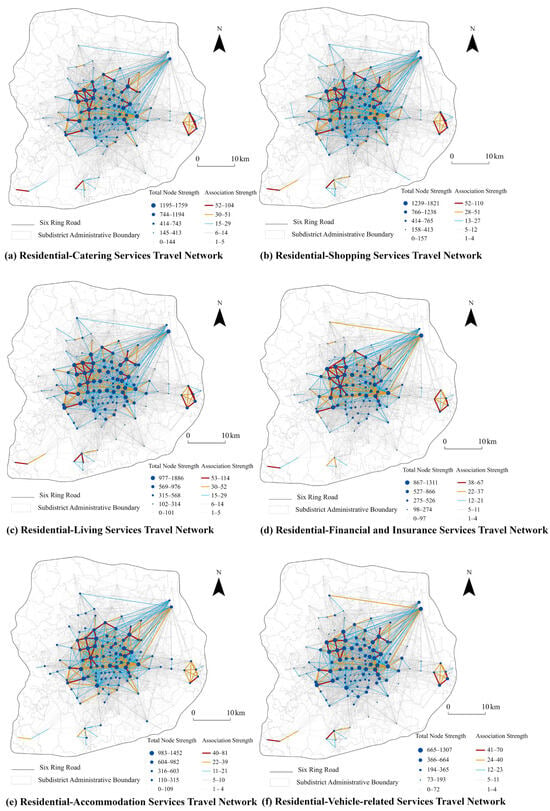
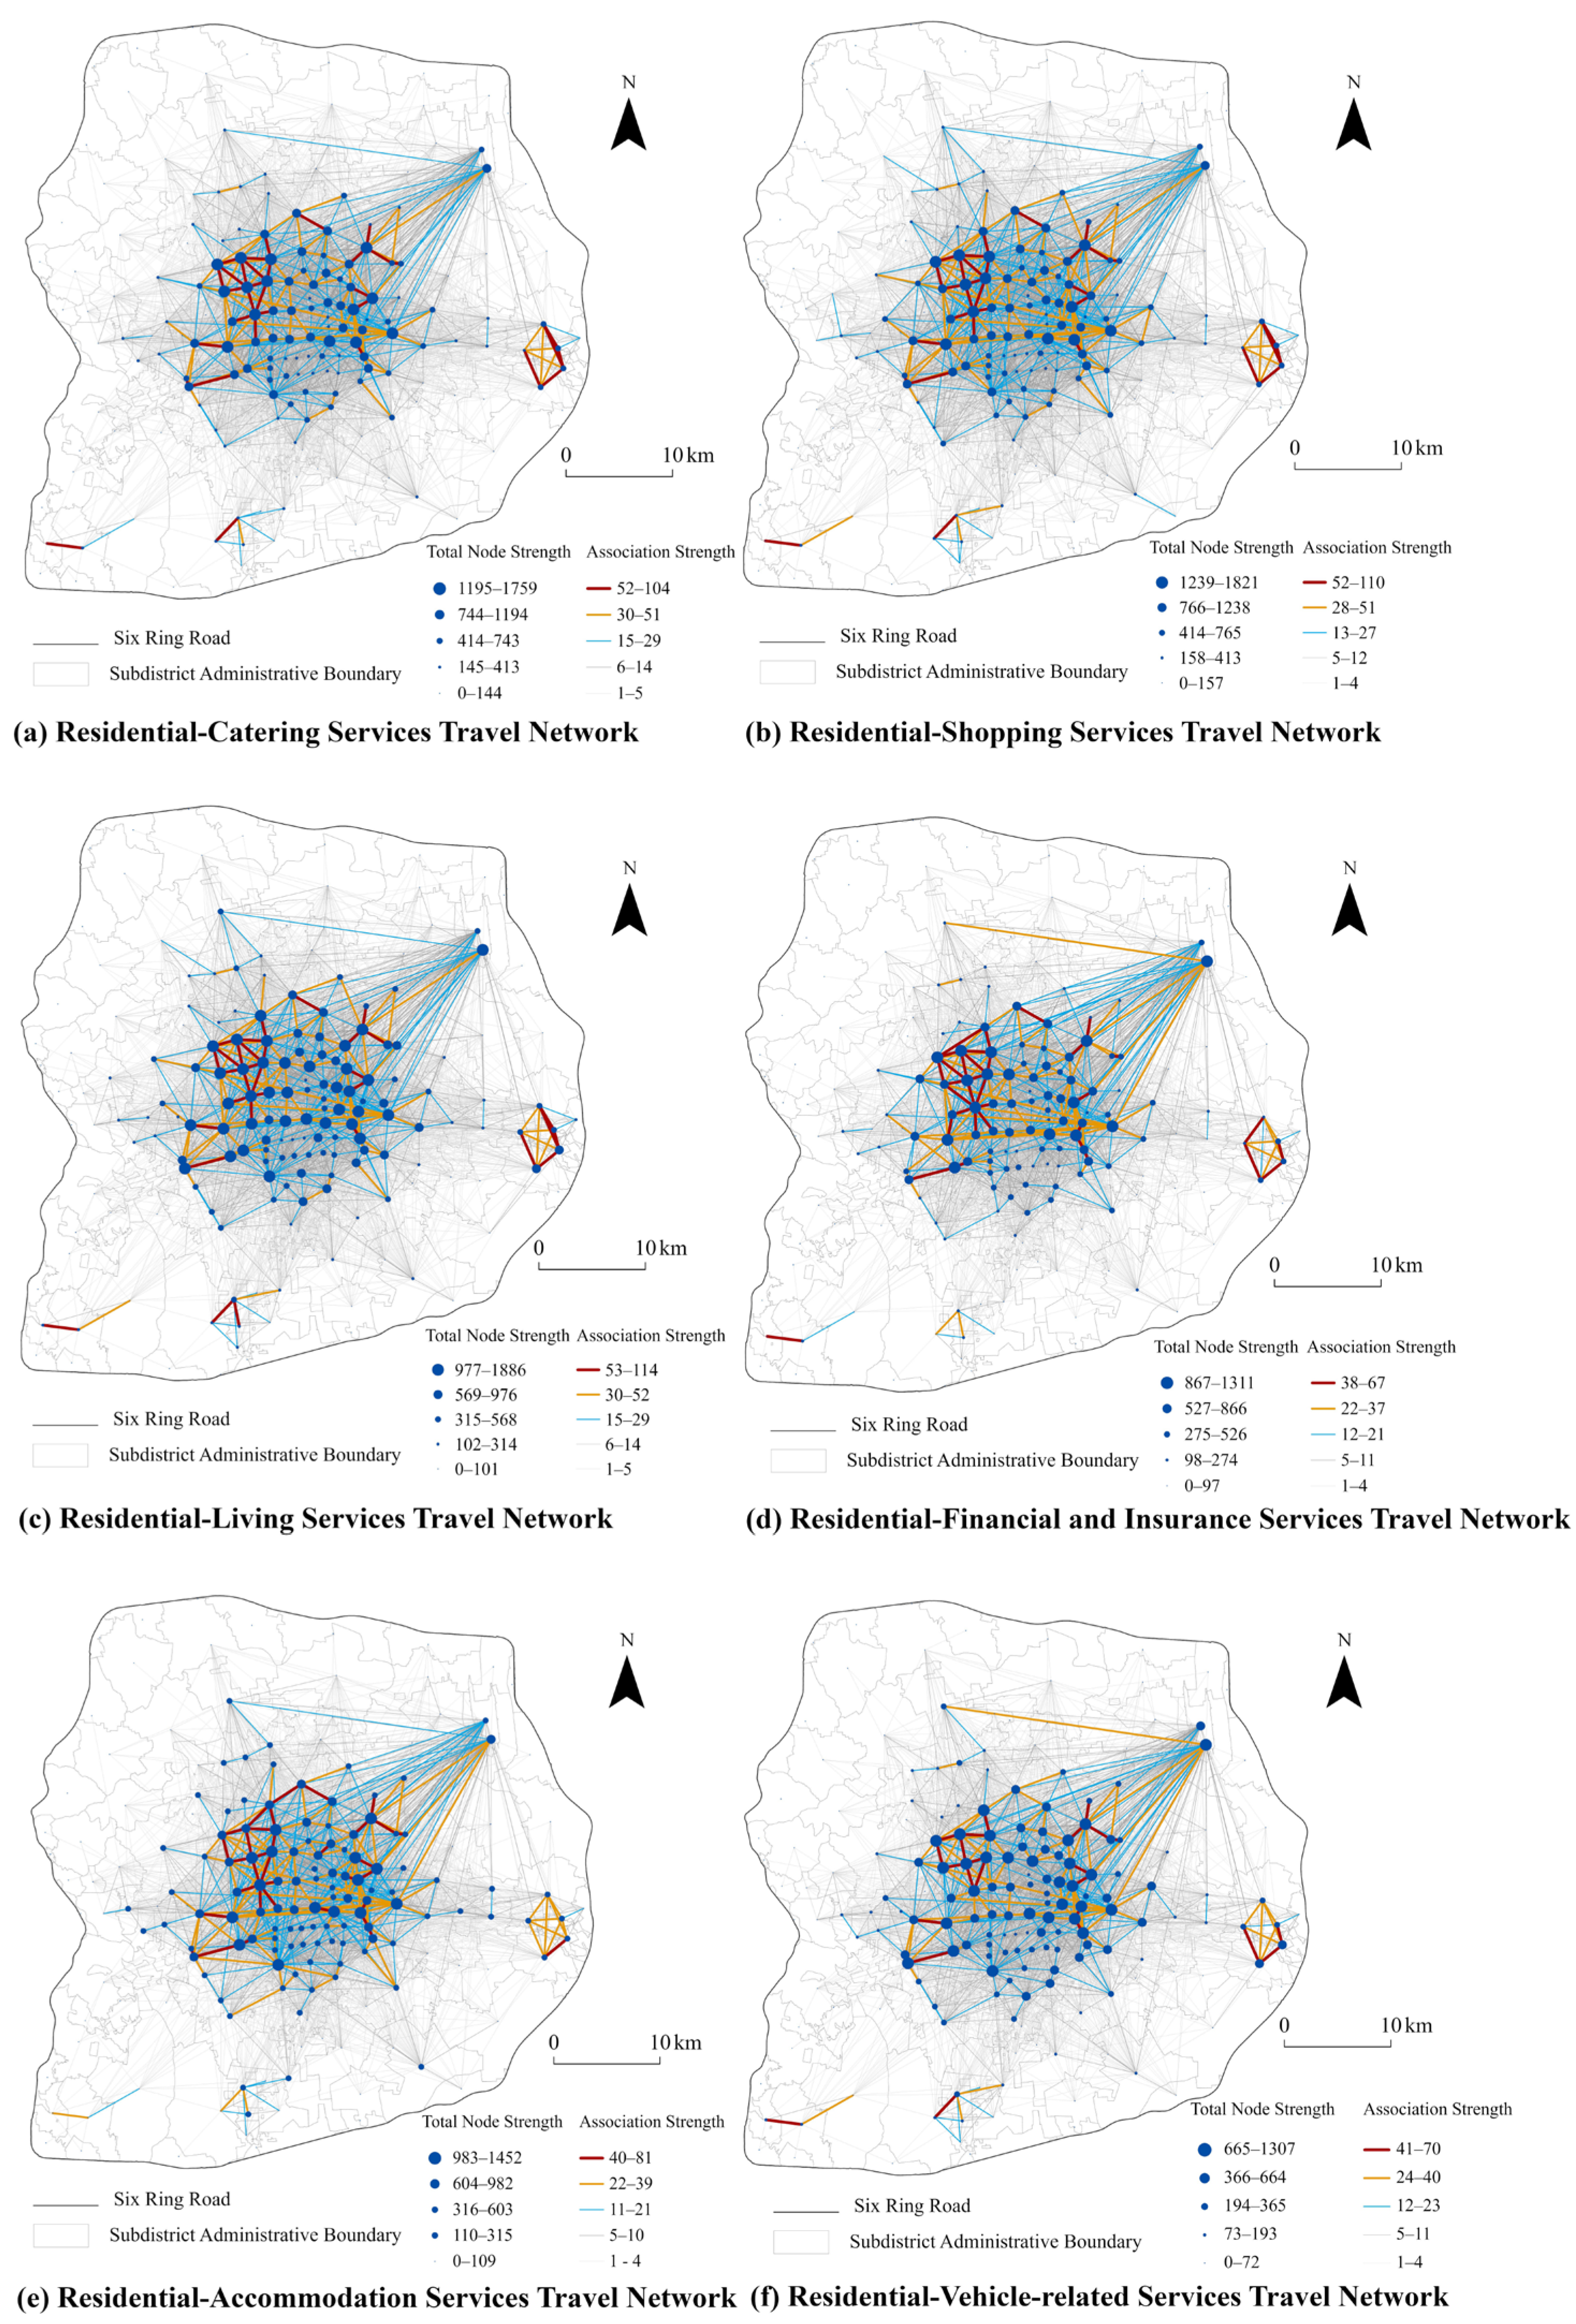
Because the six category-specific subnetworks were identified using the non-mutually exclusive procedure described in Section 3.2.1, they overlap and should not be summed. Figure 10 shows a common central–peripheral pattern across the six subnetworks, with stronger links in the central urban area and adjacent subdistricts and weaker links in outlying areas. Despite this common pattern, the subnetworks differed in connection density, link-strength composition, and hotspot locations.
Figure 10.
Residential-to-commercial travel network of various commercial service categories.
The catering, shopping, and living-service subnetworks contained denser sets of OD links. They included 8220, 8073, and 8409 links, respectively, compared with 6562 financial and insurance, 6726 vehicle-related, and 7236 accommodation-service links. The maximum association strengths were 104 for catering, 110 for shopping, 114 for living, 67 for financial and insurance, 70 for vehicle-related, and 81 for accommodation services. In contrast, the financial and insurance subnetwork had the fewest total links, while first- and second-tier links together accounted for 2.85%. Figure 10 also shows relatively long connections between the core area and northeastern locations, including Beijing Capital International Airport and Tianzhu. Among the six subnetworks, the accommodation-service subnetwork had the smallest fifth-tier link share (73.95%) and the largest combined first- to third-tier link share (9.84%). The vehicle-related subnetwork showed a more peripheral spatial distribution. First- and second-tier links accounted for 2.13%, and fifth-tier links accounted for 76.26%. Medium- and high-level vehicle-related links occurred toward the northeastern airport area, Tongzhou, and the southern and southwestern peripheries. Their density in the central urban area was lower than that of the catering, shopping, and living-service subnetworks.
3.3. Subdistrict-Level Static–Dynamic Correspondence
The common-unit comparison revealed strong descriptive rank correspondence between the measures (Table 6). Across the 190 subdistricts, residential and overall commercial KDE intensities yielded a Spearman coefficient of ρ = 0.869. Overall commercial KDE intensity and inbound trip intensity yielded ρ = 0.883. These coefficients describe subdistrict-level rank correspondence rather than spatially adjusted statistical significance. Thus, the facility pattern and observed commercial-destination arrivals exhibited closely aligned subdistrict rankings while representing distinct aspects of commercial–residential interaction.
Table 6.
Subdistrict-level Spearman’s rank correlations for static and static–dynamic comparisons.
Across the six categories, static residential–commercial correlations ranged from 0.538 to 0.893, and static–dynamic correlations ranged from 0.666 to 0.964. Financial and insurance services had the largest commercial–inbound mobility correlation (ρ = 0.964), followed by living services (ρ = 0.913), catering services (ρ = 0.911), accommodation services (ρ = 0.902), and shopping services (ρ = 0.874). Vehicle-related services had the smallest coefficient (ρ = 0.666) and were also the weakest category in the static residential–commercial comparison (ρ = 0.538).
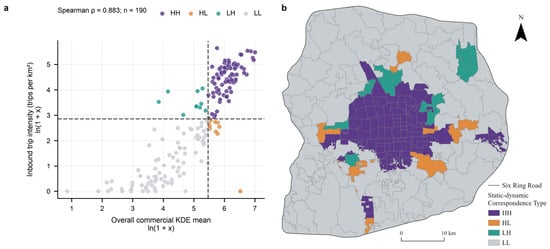
The median-based typology placed 85 subdistricts in HH, 85 in LL, 10 in HL, and 10 in LH (Figure 11). Accordingly, 170 of the 190 subdistricts (89.47%) showed concordant high–high or low–low patterns, whereas 20 (10.53%) showed contrasting facility–mobility combinations. HH subdistricts formed a broad central concentration, while LL subdistricts dominated the outer parts of the study area. HL subdistricts appeared mainly around the outer edge of the central high-intensity belt. LH subdistricts formed several northwestern and northeastern pockets, including the Capital Airport–Tianzhu area. These contrasting types identify specific subdistricts where relative commercial facility intensity differed from the observed intensity of inbound residential-to-commercial travel.
Figure 11.
Subdistrict-level static–dynamic correspondence between overall commercial facility intensity and inbound residential-to-commercial mobility intensity: (a) Scatter plot for 190 subdistricts. Dashed lines denote the sample medians; axes are displayed as ln(1 + x), whereas Spearman’s ρ was calculated using the untransformed values. (b) Spatial distribution of the four median-based correspondence types. HH, high commercial facility intensity and high inbound mobility intensity; HL, high facility intensity and low inbound mobility intensity; LH, low facility intensity and high inbound mobility intensity; LL, low facility intensity and low inbound mobility intensity.
4. Discussion
Taken together, the spatial-autocorrelation and common-unit rank analyses show that static and dynamic interaction patterns are related but not interchangeable. Global and bivariate Moran’s I showed that residential and commercial intensities were spatially clustered and positively associated across neighboring subdistricts. The direct subdistrict-level comparison further showed strong overall rank correspondence between commercial facility intensity and inbound mobility intensity (ρ = 0.883), with 170 subdistricts classified as concordant HH or LL types. The remaining 20 HL and LH subdistricts make deviations from the dominant facility–mobility correspondence explicit and identify where facility intensity and observed arrivals should be examined separately. These results extend POI-based evidence of residential–commercial spatial association in Chinese cities [6,7,8,9] by linking it to observed destination-oriented mobility at the same spatial support.
Trajectory-based studies have shown the value of OD flows for examining directional connections between urban functions [13,16]. In this study, strong OD connections were concentrated in the central urban area, while localized concentrations also appeared in Tongzhou, Daxing, and Fangshan. These peripheral concentrations show that substantial residential-to-commercial mobility extends beyond the traditional center. Nevertheless, the peripheral connections were more spatially discontinuous than the more continuous pattern observed in the central area. Overall, the OD analysis complements the POI distributions by showing the spatial concentration of strong direct connections in central areas and several localized peripheral clusters.
Category-specific results sharpen this distinction. Financial and insurance services showed the largest commercial–inbound mobility rank correlation despite a less extensive OD network, whereas living and catering services combined high rank correspondence with denser and more spatially continuous networks. Accommodation services also showed strong rank correspondence but a sparser network, while vehicle-related services combined the smallest static and static–dynamic coefficients with a more peripheral and discontinuous network. Therefore, agreement in the ranking of facility and arrival intensities does not imply the same number, spatial extent, or organization of inter-subdistrict links. The correlation analysis measures whether subdistricts with more facilities also receive relatively more trips, whereas the network analysis describes how those trips connect origins and destinations. Potential explanations involving service frequency, catchment size, and locational requirements require additional data and remain topics for future research.
This study is limited by its single-day ride-hailing sample, which leaves temporal stability and applicability to other travel modes unresolved. The temporal gap between the July 2024 commercial POIs and January 2025 OD data introduces uncertainty, and endpoint proximity does not establish trip purposes. Excluding within-subdistrict trips omits a component of neighborhood-level commercial–residential interaction. Including these trips could change subdistrict rankings of inbound trip intensity, the associated Spearman coefficients, and the median-based facility–mobility classifications. These effects were not evaluated, so the mobility-based findings should be interpreted within the scope of inter-subdistrict flows. The buffer-distance sensitivity check showed that the principal subdistrict strength hierarchy and core-node composition remained stable across the tested alternatives, although the absolute network size varied predictably with the endpoint thresholds. The Global and bivariate Moran’s I statistics depend on the 1500 m KDE bandwidth, the 50 m raster resolution used to represent the density surfaces, the subdistrict aggregation scheme, and the first-order Queen spatial-weights specification. Because the analysis used global statistics, it does not identify statistically significant local clusters or local spatial outliers. Future research could compare alternative KDE bandwidths, spatial units, and spatial-weight definitions to evaluate scale and neighborhood-specification sensitivity. The network assessment focuses on direct OD volumes and their spatial distribution; brokerage and shortest-path accessibility were not evaluated. Future research could combine temporally aligned POIs with mobility records spanning weekdays, weekends, and seasons and covering multiple travel modes to assess temporal consistency. Travel surveys could help clarify trip purposes, while detailed residential and commercial area boundaries could further refine endpoint assignment. Comparisons across spatial resolutions and aggregation units could assess scale effects. Incorporating population, employment, accessibility, land prices, and facility capacity could help explain category differences and support commercial facility allocation and community life-circle planning. The Spearman coefficients are interpreted as descriptive measures of rank correspondence because conventional Spearman p-values do not account for spatial dependence among subdistricts. Moreover, the four correspondence types are relative median-based classes rather than statistically significant local clusters or evidence of facility surplus or shortage.
5. Conclusions
This study used commercial POIs, residential POIs, and Didi ride-hailing OD data to characterize static spatial association and observed mobility connections within Beijing’s Sixth Ring Road. Commercial and residential POIs both exhibited clustered point patterns, although commercial POIs showed stronger concentration, with average nearest neighbor ratios of 0.315 and 0.739, respectively. The Moran’s I analysis further showed that all KDE-intensity variables were positively spatially autocorrelated across the subdistricts (Global Moran’s I = 0.435–0.786). Residential intensity was positively associated with overall commercial intensity in neighboring subdistricts (bivariate Moran’s I = 0.645), while category-specific bivariate associations ranged from 0.282 for vehicle-related services to 0.642 for living services. Commercial–residential spatial association was therefore positive but not uniform across service categories.
At the same subdistrict scale, static residential–commercial facility intensity and static–dynamic commercial facility–inbound mobility intensity showed strong overall rank correspondence (Spearman’s ρ = 0.869 and 0.883, respectively). The category-specific static–dynamic coefficients ranged from 0.666 for vehicle-related services to 0.964 for financial and insurance services. Of the 190 subdistricts, 170 were classified as concordant HH or LL types, while 20 showed contrasting HL or LH patterns. The OD network additionally exhibited an uneven strength hierarchy and showed that catering, shopping, and living services formed denser and more continuous link patterns than financial and insurance, accommodation, and vehicle-related services. The same-unit correlations, descriptive typology, and network structure therefore provide complementary evidence rather than interchangeable measures of commercial–residential interaction.
By directly aligning facility intensities and destination-oriented mobility at the subdistrict scale, this study provides an empirical basis for locating areas that warrant more detailed planning assessment. The correspondence types should be used as a screening description, not as a diagnosis of commercial oversupply or undersupply. The buffer-distance sensitivity check supported the stability of the principal subdistrict strength hierarchy and core-node composition within the evaluated range. Interpretation nevertheless remains constrained by the single-day ride-hailing sample, the approximate nature of point-based endpoint assignment, KDE parameters, spatial aggregation, and the spatial-weights specification. Future research could integrate temporally aligned POIs with multi-day, multimodal mobility records and compare the results across different spatial units to strengthen the robustness and planning relevance of the analysis.
Author Contributions
Conceptualization, Lujin Hu and Hao Liu; methodology, Hao Liu; software, Jianing Ma; formal analysis, Xinyu Zhang; investigation, Hao Liu; data curation, Hao Liu; writing—original draft preparation, Hao Liu. All authors have read and agreed to the published version of the manuscript.
Funding
This work was supported by the Horizontal Project of Beijing University of Civil Engineering and Architecture under Grant No. H24147.
Data Availability Statement
The commercial point-of-interest (POI) data used in this study were collected from the Amap Open Platform (https://lbs.amap.com/), and the residential-community POI data were collected from Anjuke (https://www.anjuke.com/). The ride-hailing origin–destination (OD) data were provided by Didi through an official research collaboration. The OD data are not publicly available because their disclosure is restricted under this collaboration.
Acknowledgments
We appreciate the editors for their help with editing and the reviewers for their valuable feedback on our paper.
Conflicts of Interest
The authors declare no conflicts of interest.
References
- Oosterbaan, C.; Arku, G.; Asiedu, A.B. Conversion of Residential Units to Commercial Spaces in Accra, Ghana: A Policy Dilemma. Int. Plan. Stud. 2012, 17, 45–66. [Google Scholar] [CrossRef] [Scilit]
- Kang, C.; Liu, Y.; Wu, L. Delineating Intra-Urban Spatial Connectivity Patterns by Travel-Activities: A Case Study of Beijing, China. In Proceedings of the 2015 23rd International Conference on Geoinformatics, Wuhan, China, 19–21 June 2015; IEEE: New York, NY, USA, 2015; pp. 1–7. [Google Scholar] [CrossRef] [Scilit]
- Liu, J.; Meng, B.; Shi, C. A Multi-Activity View of Intra-Urban Travel Networks: A Case Study of Beijing. Cities 2023, 143, 104634. [Google Scholar] [CrossRef] [Scilit]
- Psyllidis, A.; Gao, S.; Hu, Y.; Kim, E.-K.; McKenzie, G.; Purves, R.; Yuan, M.; Andris, C. Points of Interest (POI): A Commentary on the State of the Art, Challenges, and Prospects for the Future. Comput. Urban Sci. 2022, 2, 20. [Google Scholar] [CrossRef] [Scilit] [PubMed]
- Fang, Y.; Yu, H.; Chen, Y.; Fu, X. Spatial Distribution Characteristics and Influencing Factors of the Retail Industry in Ningbo City in Eastern China Based on POI Data. Sustainability 2024, 16, 7525. [Google Scholar] [CrossRef] [Scilit]
- Xue, B.; Xiao, X.; Li, J.; Xie, X.; Lu, C.; Ren, W. POI-Based Spatial Correlation of the Residences and Retail Industry in Shenyang City. Geogr. Sci. 2019, 39, 442–449. [Google Scholar] [CrossRef]
- Liu, W.; Lei, N.; Liu, D. Analysis of the Relationship Between Residential Areas and the Retail Sector in Taiyuan—An Example of POI Application. Technol. Innov. Appl. 2024, 14, 123–128. [Google Scholar] [CrossRef]
- Zhou, L.; Liu, M.; Zheng, Z.; Wang, W. Quantification of Spatial Association between Commercial and Residential Spaces in Beijing Using Urban Big Data. ISPRS Int. J. Geo-Inf. 2022, 11, 249. [Google Scholar] [CrossRef] [Scilit]
- Zhou, L.; Wang, C. Detecting the Spatial Association between Commercial Sites and Residences in Beijing on the Basis of the Colocation Quotient. ISPRS Int. J. Geo-Inf. 2024, 13, 7. [Google Scholar] [CrossRef] [Scilit]
- Wu, D.; Zhou, S. The Matching Pattern of Housing-Shopping Space Based on Residents’ Daily Shopping Behaviors: A Case Study of Communities in Guangzhou, China. Geogr. Sci. 2017, 37, 228–235. [Google Scholar] [CrossRef]
- Ma, L.; Xiu, L. Research on the Matching Relationship Between Residential and Commercial Space in Shenyang Based on Shopping Trips. Hum. Geogr. 2022, 37, 63–70. [Google Scholar] [CrossRef]
- Zhang, Y.; Zhou, G.; Liu, Y.; Fu, H.; Sun, H. Matching of Residential and Commercial Space in Shrinking Cities from the Perspective of Supply and Demand: A Case Study of Yichun City, China. Chin. Geogr. Sci. 2022, 32, 389–404. [Google Scholar] [CrossRef] [Scilit]
- Zhou, L.; Wang, C.; Zhen, F. Exploring and Evaluating the Spatial Association between Commercial and Residential Spaces Using Baidu Trajectory Data. Cities 2023, 141, 104514. [Google Scholar] [CrossRef] [Scilit]
- Zhang, X. Static Matching and Dynamic Association of Urban Commercial and Residential Spaces Based on POI and Trajectory Big Data—Shanghai as an Example. Master’s Thesis, Nanjing University of Posts and Telecommunications, Nanjing, China, 2024. [Google Scholar] [CrossRef]
- He, T. Research on the Correlation Between Commercial and Residential Spaces Based on the Multi-Source Geographic Big Data—A Case study of Zhuhai. Master’s Thesis, Nanjing University of Posts and Telecommunications, Nanjing, China, 2024. [Google Scholar] [CrossRef]
- Zhou, L.; Xiao, W.; Wang, C.; Wang, H. Exploring Spatial Association between Residential and Commercial Urban Spaces: A Machine Learning Approach Using Taxi Trajectory Data. J. Transp. Land Use 2024, 17, 143–161. [Google Scholar] [CrossRef] [Scilit]
- Lin, G.; Song, P.; Li, R.; Yang, F. The Progress and Prospect of Commercial Geography in the Context of Consumption Society. Hum. Geogr. 2019, 34, 80–89. [Google Scholar] [CrossRef]
- Chen, W.; Liu, L.; Liang, Y. Retail Center Recognition and Spatial Aggregating Feature Analysis of Retail Formats in Guangzhou Based on POI Data. Geogr. Res. 2016, 35, 703–716. [Google Scholar]
- Gao, Y.; Yang, Q.; Liang, L.; Zhao, Y. Spatial Pattern and Influencing Factors of Retailing Industries in Xi’an Based on POI Data. Geogr. Sci. 2020, 40, 710–719. [Google Scholar] [CrossRef]
- Hao, F.L.; Wang, S.J.; Feng, Z.X.; Yu, T.; Ma, L. Spatial pattern and its industrial distribution of commercial space in Changchun based on POI data. Geogr. Res. 2018, 37, 366–378. [Google Scholar]
- Wang, N.; Zheng, L.; Shen, H.; Li, S. Ride-Hailing Origin-Destination Demand Prediction with Spatiotemporal Information Fusion. Transp. Saf. Environ. 2024, 6, tdad026. [Google Scholar] [CrossRef] [Scilit]
- Liang, Z.; Kong, W.; Zhan, X.; Xiao, Y. Analysis of the Impact of Ride-Hailing on Urban Road Network Traffic by Using Vehicle Trajectory Data. J. Adv. Transp. 2022, 2022, 6940850. [Google Scholar] [CrossRef] [Scilit]
- Gehrke, S.R.; Felix, A.; Reardon, T.G. Substitution of Ride-Hailing Services for More Sustainable Travel Options in the Greater Boston Region. Transp. Res. Rec. J. Transp. Res. Board 2019, 2673, 438–446. [Google Scholar] [CrossRef] [Scilit]
- Liu, X.; Tian, Y.; Zhang, X.; Wan, Z. Identification of Urban Functional Regions in Chengdu Based on Taxi Trajectory Time Series Data. ISPRS Int. J. Geo-Inf. 2020, 9, 158. [Google Scholar] [CrossRef] [Scilit]
- Wang, H.; Huang, H.; Ni, X.; Zeng, W. Revealing Spatial-Temporal Characteristics and Patterns of Urban Travel: A Large-Scale Analysis and Visualization Study with Taxi GPS Data. ISPRS Int. J. Geo-Inf. 2019, 8, 257. [Google Scholar] [CrossRef] [Scilit]
- Liu, X.; Gong, L.; Gong, Y.; Liu, Y. Revealing Travel Patterns and City Structure with Taxi Trip Data. J. Transp. Geogr. 2015, 43, 78–90. [Google Scholar] [CrossRef] [Scilit]
- Fu, X.; Yang, Y.; Sun, H. Structural complexity and spatial differentiation characteristics of taxi trip trajectory network. J. Traffic Transp. Eng. 2017, 17, 106–116. [Google Scholar]
- Zhang, Y.; Zheng, X.; Chen, M.; Li, Y.; Yan, Y.; Wang, P. Urban Fine-Grained Spatial Structure Detection Based on a New Traffic Flow Interaction Analysis Framework. ISPRS Int. J. Geo-Inf. 2021, 10, 227. [Google Scholar] [CrossRef] [Scilit]
- Zhang, Y.; Li, Y.; Zheng, X.; Liu, H. Research on Track Network and Flow Mode Based on Taxi Data. Geospat. Inf. 2021, 19, 1–6. [Google Scholar] [CrossRef]
- Zhou, X.; Zhang, H.; Ye, X. A Multi-Hierarchical Method to Extract Spatial Network Structures from Large-Scale Origin-Destination Flow Data. Int. J. Geogr. Inf. Sci. 2024, 38, 577–602. [Google Scholar] [CrossRef] [Scilit]
- Barroso, J.M.F.; Albuquerque-Oliveira, J.L.; Oliveira-Neto, F.M. Correlation Analysis of Day-to-Day Origin-Destination Flows and Traffic Volumes in Urban Networks. J. Transp. Geogr. 2020, 89, 102899. [Google Scholar] [CrossRef] [Scilit]
- The People’s Government of Beijing Municipality. Available online: https://www.beijing.gov.cn/zhengce/zhengcefagui/202503/t20250320_4039431.html (accessed on 27 July 2026).
- GB 50137-2011; Code for Classification of Urban Land Use and Planning Standards of Development Land. China Architecture & Building Press: Beijing, China, 2011.
- Ministry of Natural Resources of the People’s Republic of China. Guidelines for Land and Sea Use Classification in Territorial Spatial Survey, Planning, and Use Regulation; Ministry of Natural Resources of the People’s Republic of China: Beijing, China, 2023.
- Silverman, B.W. Density Estimation for Statistics and Data Analysis; Chapman and Hall: New York, NY, USA, 1986. [Google Scholar]
- Ebdon, D. Statistics in Geography; Blackwell: Hoboken, NJ, USA, 1985. [Google Scholar]
- Mitchell, A. The ESRI Guide to GIS Analysis; ESRI Press: Redlands, CA, USA, 2005; Volume 2. [Google Scholar]
- Getis, A.; Ord, J.K. The Analysis of Spatial Association by Use of Distance Statistics. Geogr. Anal. 1992, 24, 189–206. [Google Scholar] [CrossRef] [Scilit]
- Moran, P.A.P. Notes on Continuous Stochastic Phenomena. Biometrika 1950, 37, 17–23. [Google Scholar] [CrossRef] [Scilit]
- Wartenberg, D. Multivariate Spatial Correlation: A Method for Exploratory Geographical Analysis. Geogr. Anal. 1985, 17, 263–283. [Google Scholar] [CrossRef] [Scilit]
- Liu, J. An Introduction to Social Network Analysis, 1st ed.; Social Sciences Academic Press: Beijing, China, 2004. [Google Scholar]
- Wang, L.; Liu, H.; Liu, Q. China’s city network based on Tencent’s migration big data. Acta Geogr. Sin. 2021, 76, 853. [Google Scholar] [CrossRef]
- Zhang, X.; Han, H.; Tang, Y.; Luo, G. Research on the Characteristics of Urban Network Structure in China based on Baidu Migration Data. J. Geo-Inf. Sci. 2021, 23, 1798–1808. [Google Scholar] [CrossRef]
- Opsahl, T.; Agneessens, F.; Skvoretz, J. Node Centrality in Weighted Networks: Generalizing Degree and Shortest Paths. Soc. Netw. 2010, 32, 245–251. [Google Scholar] [CrossRef] [Scilit]
- Spearman, C. The Proof and Measurement of Association Between Two Things. In Studies in Individual Differences: The Search for Intelligence; Appleton-Century-Crofts: New York, NY, USA, 1961; pp. 45–58. [Google Scholar] [CrossRef] [Scilit]
- Kendall, M.G. The Treatment of Ties in Ranking Problems. Biometrika 1945, 33, 239–251. [Google Scholar] [CrossRef] [Scilit]
- Yang, J.; Yi, D.; Qiao, B.; Zhang, J. Spatio-Temporal Change Characteristics of Spatial-Interaction Networks: Case Study within the Sixth Ring Road of Beijing, China. ISPRS Int. J. Geo-Inf. 2019, 8, 273. [Google Scholar] [CrossRef] [Scilit]

Disclaimer/Publisher’s Note: The statements, opinions and data contained in all publications are solely those of the individual author(s) and contributor(s) and not of MDPI and/or the editor(s). MDPI and/or the editor(s) disclaim responsibility for any injury to people or property resulting from any ideas, methods, instructions or products referred to in the content. |
© 2026 by the authors. Published by MDPI on behalf of the International Society for Photogrammetry and Remote Sensing. Licensee MDPI, Basel, Switzerland. This article is an open access article distributed under the terms and conditions of the Creative Commons Attribution (CC BY) license.