Abstract
Calcifying macroalgae contribute significantly to the structure and function of tropical marine ecosystems. Their calcification and photosynthetic processes are not well understood despite their critical role in marine carbon cycles and high vulnerability to environmental changes. This study aims to provide a better understanding of the macroalgal calcification process, focusing on its relevance concerning seawater carbonate chemistry and its relationship to photosynthesis in three dominant calcified macroalgae in Thailand, Padina boryana, Halimeda macroloba and Halimeda opuntia. Morphological and microstructural attributes of the three macroalgae were analyzed and subsequently linked to their calcification rates and responses to inhibition of photosynthesis. In the first experiment, seawater pH, total alkalinity and total dissolved inorganic carbon were measured after incubation of the macroalgae in the light and after equilibration of the seawater with air. Estimations of carbon uptake into photosynthesis and calcification and carbon release into air were obtained thereafter. Our results provide evidence that calcification of the three calcified macroalgae is a potential source of CO2, where calcification by H. opuntia and H. macroloba leads to a greater release of CO2 per biomass weight than P. boryana. Nevertheless, this capacity is expected to vary on a diurnal basis, as the second experiment indicates that calcification is highly coupled to photosynthetic activity. Lower pH as a result of inhibited photosynthesis under darkness imposes more negative effects on H. opuntia and H. macroloba than on P. boryana, implying that they are more sensitive to acidification. These effects were worsened when photosynthesis was inhibited by 3-(3,4-dichlorophenyl)-1,1-dimethylurea, highlighting the significance of photosynthetic electron transport-dependent processes. Our findings suggest that estimations of the amount of carbon stored in the vegetated marine ecosystems should account for macroalgal calcification as a potential carbon source while considering diurnal variations in photosynthesis and seawater pH in a natural setting.
1. Introduction
Since the mid-18th century, atmospheric CO2 has risen from 280 to 400 ppm, and is predicted to increase to 730–1200 ppm by 2100 as a result of human activities, such as the burning of fossil fuel, deforestation, agriculture and industrialization [1,2]. This has led to an increase in sea-surface temperature (ocean warming) and a decrease in ocean pH (ocean acidification), which have affected a range of marine floras and faunas [3,4,5]. Macroalgae play important roles as primary producers in the marine food chain and serve as habitat for various animals, which directly contribute to the livelihood and food security of the coastal community [6,7]. Recent studies have suggested that macroalgae may play a role in carbon sequestration, thus mitigating the changing climate, and offset anthropogenic carbon emissions to the atmosphere [8,9,10,11].
Calcifying macroalgae are intriguing organisms and have become a subject of interest for recent marine frontiers research [12,13,14,15] as they are a source of primary production via photosynthesis as well as CaCO3 production via calcification with relatively fast growth and turnover rates compared to corals [16,17]. However, their role in the carbon economy, whether they act as a net sink or source of carbon, remains a knowledge gap and debatable [18,19,20] mainly due to uncertainties about the fate of carbon associated with calcification. Previous studies suggest that in the pathway of calcification, the chemical reaction step modifies the carbonate chemistry of the seawater and releases CO2, resulting in a net loss of CO2 to the atmosphere [18,21,22,23]. A recent study by Kalokora et al. [20] found that calcification in a calcifying alga, Corallina officinalis L., can release a significant amount of CO2 to the atmosphere and become a source of CO2 if not refixed via photosynthesis in the system, highlighting the complex role of algal calcification on carbon capture potential in coastal areas [20].
Calcification is closely coupled to photosynthesis because photosynthetic carbon uptake decreases CO2, elevates pH and increases the CO32− proportion in the carbonate–bicarbonate system of the seawater, which promotes CaCO3 precipitation [24,25,26,27,28]. Respiratory CO2 release takes place in darkness, lowering seawater pH and promoting CaCO3 dissolution [13,29]. This relationship may change partly due to interspecific variations in the mechanisms and efficiency of photosynthetic carbon acquisition [30,31] and in the capacity to regulate the pH in the microenvironment [28,30,31,32]. A balance between all these simultaneous and interrelated processes partly shapes the daily and seasonal variations in calcification rates and carbon flux of shallow coastal water [26,33].
Species from genera Padina and Halimeda are calcifying macroalgae from divisions Phaeophyta and Chlorophyta commonly found in coastal subtropical and tropical habitats, including in Thailand [8,32,34,35]. While species from genus Halimeda have long been a model for calcification investigation, much less is known about species from genus Padina. Padina deposits aragonite crystals at cell surface, whereas Halimeda precipitates CaCO3 in the form of aragonite in intercellular spaces [36,37,38,39]. The source of CaCO3 for calcification of Padina is, thus, in the surface seawater layer on the thalli, whereas that of Halimeda is in the calcification fluid in interutricular spaces [36,37,38,39]. The species from genus Padina was categorized as lightly calcified where CaCO3 ranged from 9% to 63%, 21% and 38% of dry weight in Padina pavonica, Padina japonica and Padina sanctae-crucis, respectively [37,40,41], while the species from genus Halimeda has greater CaCO3 precipitation (81% and 86% of dry weight in H. macroloba and H. cylindracea, respectively [27]). Differential degrees of calcification and variation in microstructures are expected to be linked with their carbon use, particularly how they modify seawater chemistry and their carbon economy. In addition, the diversity of calcification sites and their proximity to pH-elevating processes (e.g., photosynthesis, H+ pumping and carbon concentrating mechanisms (CCMs)) relative to external seawater might affect their response to changing environments [14,28,39,42,43].
This study aims to provide a better understanding of the calcification process, focusing on its role in carbon economy and its relationship to photosynthesis in three dominant calcified macroalgae in upper sublittoral areas in Phuket, Thailand, P. boryana, H. opuntia and H. macroloba [44,45,46,47]. Our findings will improve estimations on the amount of carbon stored in the vegetated marine ecosystems and support the evidence-based management on mitigating the impact of human-induced climate change.
2. Results
Specific thallus area (wet weight) of P. boryana, H. opuntia and H. macroloba were 37.09 ± 1.83, 6.41 ± 0.28 and 6.31 ± 0.40 cm2 g−1, respectively, while the specific thallus area (dry weight) of P. boryana. H. opuntia and H. macroloba were 163.88 ± 13.37, 14.84 ± 1.32 and 23.97 ± 1.50 cm2 g−1, respectively. Specific thallus area (wet and dry weight) of P. boryana was significantly greater than that of H. opuntia, and H. macroloba (Fisher’s LSD test, p < 0.001 and p < 0.001, respectively). CaCO3 in the form of aragonite of P. boryana, H. opuntia and H. macroloba were 46.89 ± 3.57, 81.44 ± 1.71 and 77.35% ± 1.44% dry weight, respectively, suggesting that H. opuntia and H. macroloba had greater CaCO3 precipitation than P. boryana (Fisher’s LSD test, p < 0.001 and p < 0.001, respectively), with no significant difference in %CaCO3 between H. opuntia and H. macroloba (p = 0.246). CaCO3 crystals of P. boryana were precipitated at the cell surface, whereas H. opuntia and H. macroloba precipitate CaCO3 in intercellular spaces. Figure 1 shows locations of primary utricles (pU), primary interutricle spaces (pIUS) and aragonite crystals of H. opuntia and H. macroloba and cellular structure and aragonite crystals of P. boryana. Aragonite crystals of P. boryana, H. opuntia and H. macroloba were needle- or rod-shaped and were 0.13 ± 0.02, 0.22 ± 0.02 and 0.12 ± 0.02 μm wide and 1.36 ± 0.05, 1.80 ± 0.09 and 1.24 ± 0.05 μm long, respectively (Figure 1). Significant longer and wider aragonite crystals were observed in H. opuntia (Fisher’s LSD test, p < 0.001 and p < 0.001, respectively). The CaCO3 crystal densities of P. boryana, H. opuntia and H. macroloba were 5.26 ± 0.41, 3.47 ± 0.12 and 5.65 ± 0.34 needles µm−2, respectively (Table 1). H. opuntia had significantly lower crystal density than P. boryana and H. macroloba (Fisher’s LSD test, p < 0.001).
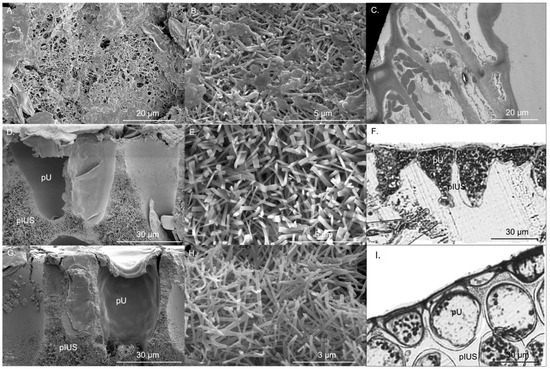
Figure 1.
Aragonite crystal microstructure of Padina boryana (A,B), Halimeda opuntia (D,E) and Halimeda macroloba (G,H) from scanning electron microscope, cell of P. boryana (C), primary utricle (pU) and primary interutricle spaces (pIUS) of H. opuntia (F) and H. macroloba (I) from transmission electron microscope and compound microscope.

Table 1.
Morphological and anatomical characters of Padina boryana, Halimeda opuntia and Halimeda macroloba. Data are Mean ± SE. Different uppercase letters indicate statistical difference (Fisher’s LSD test, p < 0.05).
The surface diameter of primary utricles (pU) of H. macroloba (28.31 ± 0.40 µm) was significantly larger than that of H. opuntia (23.67 ± 0.69 µm) (t-test, p < 0.001), while the diffusion pathway length of H. macroloba (22.11 ± 0.51 µm) was almost four-fold larger than that of H. opuntia (5.95 ± 0.25 µm) (t-test, p < 0.001) (Table 1).
The biological processes of the three macroalgae incubated in the light presented changes in seawater carbonate chemistry (Figure 2, Table 2). No significant alteration in controls (seawater without macroalgae) confirmed that the observed change in other treatments was associated with biological processes. Repeated-measures ANOVA showed that macroalgal species (p < 0.001), time of measurements (initial, after 3 h in the light and after equilibration with air, p < 0.001) and an interaction of the two factors (p < 0.001) significantly affected seawater pH, TA and total DIC (Figure 2). After exposure to the light for 3 h, a significant increase in seawater pH was detected in incubated P. boryana (reaching 8.79 ± 0.15, Fisher’s LSD test, p < 0.05), a reduction in seawater pH was detected in incubated H. opuntia (Fisher’s LSD test, p < 0.05) and no significant change in seawater pH compared to the initial values was observed in incubated H. macroloba (Figure 2A). Seawater pH was restored to the initial level after P. boryana was removed and the seawater was allowed to be equilibrated with air. In contrast, seawater pH remained low in treatment with H. opuntia (Fisher’s LSD test, p < 0.05 compared to the initial value) and reduced in treatment with H. macroloba (Fisher’s LSD test, p < 0.05). A significant decrease in TA was detected in the seawater incubated with all species tested after light exposure (Fisher’s LSD test, p < 0.05, Figure 2B). After equilibration, a recovery of TA was observed in treatment with P. boryana, whereas TA in the other two treatments remained low. Total DIC followed the same trend as observed in TA (Figure 2C). These shifts in pH and TA resulted in a change in CO2, HCO3−, CO32−, saturation of calcite (ΩCa) and saturation of aragonite (ΩAr) (Table 2). Incubation of P. boryana in the light resulted in a decrease in CO2 and HCO3− and an increase in CO32−, ΩCa and ΩAr in seawater (Fisher’s LSD test, p < 0.05). After equilibration, CO2 and HCO3− were restored to the initial levels, whereas CO32− ΩCa and ΩAr in the seawater became slightly lower than the initial values (Table 2, Fisher’s LSD test, p < 0.05). The incubation of H. opuntia and H. macroloba displayed similar responses. After light exposure, all parameters were reduced (Fisher’s LSD test, p < 0.05) except for CO2, which showed an increase in H. opuntia (Fisher’s LSD test, p < 0.05) and a slight decrease from the initial value, although not statistically significant in H. macroloba. Equilibration reinstated CO2 concentration but did not restore HCO3− CO32− ΩCa and ΩAr (Table 2, Fisher’s LSD test, p < 0.05). The salinity and temperature of the seawater remained steady throughout the experiments (30 ppt; 30 °C–31 °C).
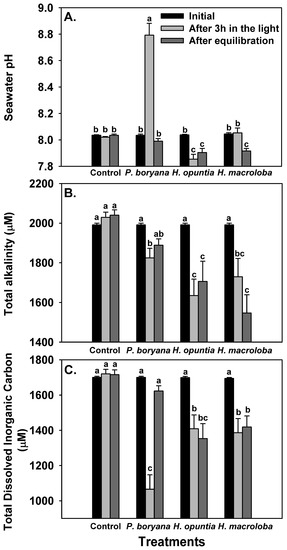
Figure 2.
Changes in seawater chemistry: pH (A), total alkalinity (B) and total dissolved inorganic carbon (C) after incubation with Padina boryana, Halimeda opuntia and Halimeda macroloba under an irradiance of 150 μmol photons m−2 s−1 and after equilibration with air. The same set-up without macroalgae serves as the control. Bars without shared letters are considered statistically different (Fisher’s LSD test, p < 0.05). Data are means ± SE (n = 9).
Table 2.
A summary of seawater carbonate chemistry before an incubation with Padina boryana, Halimeda opuntia and Halimeda macroloba (initial), after 3 hours of incubation and after equilibration with air. The values presented were calculated from the average total alkalinity and pH (see Figure 2) using CO2 sys.xls program (version 2.3). Data are means ± SE (n = 9). Different uppercase letters indicate statistical difference (Fisher’s LSD test, p < 0.05).
Fates of the DIC associated with biological processes differed among species (Figure 3). Photosynthetic carbon uptake was highest in P. boryana (Fisher’s LSD test, p < 0.05), whereas H. opuntia and H. macroloba displayed comparable rates (Figure 3A), corroborating the pH drift and DIC results previously described in Figure 2 and Table 2. Opposite trends were observed in carbon removal by calcification and carbon loss due to biological processes (Figure 3B,C). The amount of carbon associated with both processes was lowest in P. boryana (Fisher’s LSD test, p < 0.05), whereas no difference was detected between H. opuntia and H. macroloba. With lightly calcified algae, P. boryana was more engaged in photosynthetic carbon uptake than in calcification, resulting in no net carbon loss. In contrast, two heavily calcified macroalgae removed a larger amount of carbon for calcification than for photosynthesis. The consequential carbon loss was almost as high as their carbon removal for calcification.
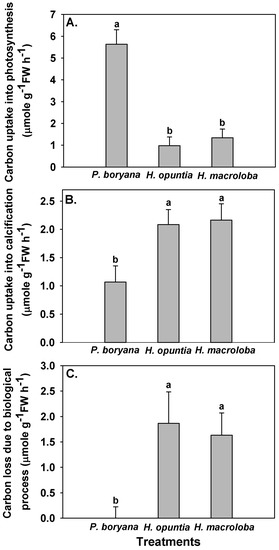
Figure 3.
Carbon uptake by photosynthesis (A), carbon removal by calcification (B) and carbon lost to the air due to incubation (C) with Padina boryana, Halimeda opuntia and Halimeda macroloba under an irradiance of 150 μmol photons m−2 s−1. The fates of carbon were calculated according to Kalokora et al. [20]. Different letters above the bar indicate statistical difference (Fisher’s LSD test, p < 0.05). Data are means ± SE (n = 9).
There was a significant positive relationship between carbon removal by calcification and carbon loss to air in P. boryana and H. opuntia (Figure 4A, p = 0.005 in P. boryana and p = 0.0124 in H. opuntia), although both were not significantly related in H. macroloba (p = 0.0658). A trend line with an intercept = 0 was fitted using all the data points, and the ratio of carbon loss to air to carbon removal by calcification was 0.78. In addition, a significant positive relationship between photosynthetic carbon uptake and removal by calcification was detected in all species tested (Figure 4B, p = 0.0251, 0.0066 and 0.0223 in P. boryana, H. opuntia and H. macroloba, respectively). Photosynthetic carbon uptake caused 59.44%, 73.441% and 60.90% of the variation in carbon removal by calcification in P. boryana, H. opuntia and H. macroloba, respectively.
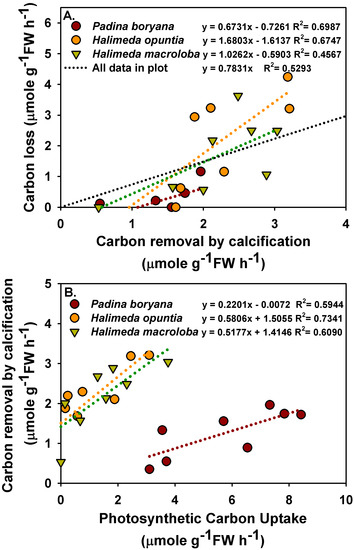
Figure 4.
Relationship between carbon removal by calcification and carbon lost to air (A) and between photosynthetic carbon uptake and removal by calcification (B) in treatments incubated with Padina boryana, Halimeda opuntia and Halimeda macroloba. Fittings using linear regressions are shown as dotted lines, and the equations are displayed. Data are obtained from calculations shown in Figure 3.
Inhibition of light reactions of photosynthesis affected the calcification rates of the three macroalgae and the pH drift of the seawater (Figure 5). Significant effects of incubation conditions (light and darkness) on calcification rates of the three macroalgae were detected (repeated-measures ANOVA, p < 0.001, Figure 5A). Similar to the results reported in Figure 3, calcification rates in P. boryana were lower than those in H. opuntia and H. macroloba (Fisher’s LSD test, p < 0.05). Calcification rates were lowered when macroalgae were incubated in darkness (Fisher’s LSD test, p < 0.05). P. boryana and H. opuntia maintained positive net calcification rates in darkness; however, net dissolution was detected in H. macroloba. Treatment with DCMU had a strong impact on the calcification process (repeated-measures ANOVA, p < 0.001) and induced dissolution in all species tested (Figure 5B). Seawater pH (Figure 5C,D) was affected by macroalgal species (repeated-measures ANOVA, p < 0.001), incubation conditions (repeated-measures ANOVA, p < 0.001) and interaction of the two factors (repeated-measures ANOVA, p < 0.001). Incubation conditions did not result in significant change in seawater pH of controls, indicating that changes observed in other treatments were associated with biological processes. An increase in seawater pH was detected after P. boryana was exposed to light for 1 h (Fisher’s LSD test, p < 0.05), whereas seawater from the incubation with H. opuntia and H. macroloba remained comparable to controls. Incubation in darkness resulted in a lower seawater pH as compared to incubation in the light in all treatments containing macroalgae (Fisher’s LSD test, p < 0.05, Figure 5C). Similar results were observed in the presence of DCMU (Figure 5D).
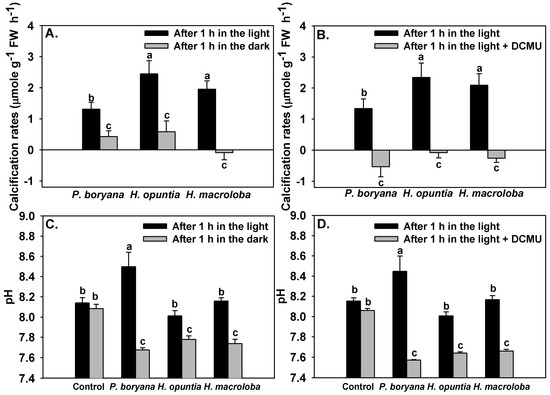
Figure 5.
Effects of inhibition of photosynthesis on calcification rates of Padina boryana, Halimeda opuntia and Halimeda macroloba (A,B) and seawater pH (C,D) after 1 h incubation under an irradiance of 150 μmol photons m−2 s−1. Bars without shared letters are considered statistically different (Fisher’s LSD test, p < 0.05). Data are means ± SE (n = 9).
3. Discussion
Our study showed that the biological processes of P. boryana, H. opuntia and H. macroloba significantly alter seawater chemistry but to a different extent, which is probably due to differences in photosynthetic carbon uptake and calcification. While both photosynthetic carbon fixation and calcification contributed to total DIC uptake in P. boryana, photosynthesis appears to be the main driver for a drastic decrease in DIC and a rise in seawater pH. In contrast, DIC uptake of H. opuntia and H. macroloba were largely associated with calcification and to a lesser extent, with photosynthesis, resulting in a change in pH with smaller magnitude. Higher calcification rates in H. opuntia and H. macroloba compared to P. boryana may also explain their higher accumulation of CaCO3 (1.6–1.7 times higher than in P. boryana).
Both Padina and Halimeda were identified as active HCO3− and CO2 users by means of CCMs [48]. Both can readily utilize HCO3− for photosynthesis, although their actual mechanisms may differ depending on their modes of calcification [48,49]. Morphological characteristics and site of calcification influence calcification and photosynthetic process [39,50,51]. The sheet-like thallus of P. boryana has higher specific surface area than H. opuntia and H. macroloba thus they are expected to exhibit higher productivity and more efficient nutrient uptake for the same weight [52]. The morphology of primary utricle in Halimeda (e.g., size, orientation) and their lateral adhesion between adjacent primary utricles likely affect the diffusion pathway and ions uptake for CaCO3 precipitation (e.g., Ca2−, CO32−) [39,50,51]. Diffusion pathways between primary utricles also control H+ fluxes from the bulk seawater into the primary interutricle spaces or removal of H+, a product of calcification, from the primary interutricle spaces to prevent H+ accumulation [39]. In addition, shorter diffusion pathway may lead to lower diffusive resistance for the influx of Ca2+ and potentially HCO3− or CO32− from seawater to primary interutricle space, which potentially increases CaCO3 precipitation [39,50]. This suggests lower energetic cost to H. opuntia than H. macroloba in calcification [53,54,55], which might explain the higher CaCO3 content with larger crystal length and width and smaller crystal density in H. opuntia with a smaller surface diameter of the primary utricle and lower diffusion pathway length than H. macroloba. Our findings were also consistent with Peach et al. [39], which found strong inverse relationship between average CaCO3 content and primary utricle surface diameter.
Variability in calcification rates in relation to photosynthesis among the three macroalgae corresponded well with reduced total alkalinity which did not recover after equilibration. In H. opuntia and H. macroloba, TA and DIC were decreased after incubation and remained low after equilibration, implying that CO2 loss from the seawater took place, which was consistent with a recent study in Corallina officinalis [20]. In contrast, with lightly calcified algae, P. boryana was more engaged in photosynthetic carbon uptake than in calcification, thus resulting in no net carbon loss. In this study, a positive correlation between carbon loss to air and calcification was presented, and the ratio of carbon loss to air to carbon removal by calcification was 0.78. This estimate is comparable to the values reported in C. officinalis (0.78; [20]) and slightly higher than those reported in the coral reefs (0.6; [56]). Notably, when each species was analyzed separately, different functional constants were obtained. These constants suggest that in order to obtain net carbon loss, a certain rate of calcification must be reached (negative y-intercept). While the results generally imply that macroalgal calcification may act as a source of CO2, the carbon economy of the coastal community is controlled by multiple processes. Kalokora et al. [20] suggested that the released CO2 may be refixed by a photosynthetic process, particularly of marine primary producers, such as seagrasses and other macrophytes. In Thai waters and other tropical habitats, calcified macroalgae, especially species from genus Halimeda, were often found coexisting with fleshy macroalgae and seagrasses [57,58,59]. Therefore, community photosynthesis may enhance calcification by increasing the pH and saturation state of CaCO3 in the surrounding seawater and simultaneously capture CO2 released from calcification during daytime [12,57].
There was a significant positive relationship between photosynthetic carbon uptake and carbon removal by calcification in all species tested, similar to previous studies in other calcifying algae [20,28,60,61,62]. Our findings provide supporting evidence that calcification and photosynthesis in P. boryana, H. opuntia and H. macroloba are closely coupled [24,28,32,63,64] but contradict the results of a study on the congeneric species, Padina pavonica and Padina japonica, which reported a lack of correlation between photosynthesis and carbonate deposition [40]. These discrepant results may be due to differences in calcification capacity, which was significantly higher in P. boryana in the present study [40]. This coupling between photosynthesis and calcification is mediated by a localized modification of seawater chemistry, generating a suitable microenvironment for photosynthesis and calcification. Calcium carbonate deposition of an individual promotes photosynthesis via an increase in proton extrusion, which subsequently increases CO2 availability readily for photosynthetic carbon uptake of the same individual [20,25,32,65]. Meanwhile, photosynthesis elevates the pH and saturation state of CaCO3 at the macroalgal thalli surface diffusive boundary layer and at the calcification site, thus promoting calcification [25,31,42,66,67]. Beer and Larkum [64] suggested that calcification in Halimeda discoidea is linked to pH in intercellular spaces controlled by the ratio of photosynthesis to respiration. Recent studies have revealed that higher pH at the diffusive boundary layer in the light in many tropical calcified macroalgae, including Halimeda, is maintained by photosynthetic CCM involving a HCO3−–H+ symport, OH− antiport and HCO3− dehydration catalyzed by external carbonic anhydrase [14,28]. Our study showed that approximately 4.5–4.7 mols of carbon were taken in photosynthesis for every mol carbon fixed into calcification in P. boryana. While regressions in H. opuntia and H. macroloba did not show the x and y intercepts of zero, approximately 0.5–1.0 and 0.5–1.2 mols of carbon were taken in photosynthesis for every mol carbon fixed into calcification in H. opuntia and H. macroloba, respectively. Different ratio numbers were reported in previous studies: 4–8 for Halimeda [68], 1.6 for four deep-water Halimeda [63] and 1 and 1.5 for C. officinalis, respectively [20,60], indicating that this is a variable depending on local adaptation and not only species-specific.
The dependency of calcification on photosynthesis was further illustrated in the subsequent experiment in which both light-dependent and photosystem II (PSII) electron transport-dependent calcification was observed. Incubation in darkness significantly reduced calcification rates in all tested species and simultaneously reduced seawater pH. As H. opuntia and H. macroloba deposit aragonite crystals in the intercellular space between utricles, which is semi-separated from external seawater, these algae may be more resistant to the pH change in surrounding water than P. boryana, which precipitate aragonite crystals externally at the thallus surface [40,68,69]. However, our results indicate that P. boryana was the least pH-sensitive, sustaining the highest percentage of calcification rate relative to the rates in the light (approx. 33%) at the lowest final pH (7.67 ± 0.02). This is evident as Padina is among the persistent macroalgal genus in acidified environments [38,41,70,71,72,73,74]. Meanwhile, H. macroloba was the most sensitive species, displaying net dissolution after 1 h of darkness at the highest pH (7.74 ± 0.04) among all species. Minimal calcification and dissolution were also observed in species from genus Halimeda in the field condition at nighttime [13,14,75]. Differences in sensitivity to pH between H. opuntia and H. macroloba may be due to different morphological characteristics, such as branching and crystal microstructure [76]. While multitudinous branches forming tight complex structures in H. opuntia may generate greater diffusive boundary layer thickness and consequently allowing better regulation of their microenvironment as previously observed in coralline algae [77], shorter and thinner crystals found in H. macroloba may be more susceptible to dissolution and may require more crystal nucleation, which is a major rate-limiting step for precipitation of CaCO3 [78]. In addition, inhibiting PSII electron transport using DCMU imposed stronger negative effects on calcification of all tested species, with P. boryana as the most affected. This emphasizes that certain mechanisms associated with calcification are species specific, and the processes and factors associated with functioning photosynthetic electron transport are more important facilitators of calcification than other light-dependent but PSII-independent processes, such as light-triggered H+ transport pumps [28,31,64]. Nevertheless, more adverse effects of DCMU could be attributed to a lower pH in the seawater, promoting dissolution in all species [13,38]. Comparisons among different species of calcified macroalgae in our study suggest that CaCO3 precipitation is linked to photosynthesis and pH, and may vary depending on the morphological features. However, these interrelations remain unclear and require further investigations.
Our results provide experimental evidence that calcification of the three common calcified macroalgae in Phuket, Thailand is a potential source of CO2, supporting a recent study on C. officinalis [20]. Calcification by H. opuntia and H. macroloba lead to greater loss in CO2 per biomass weight than P. boryana. Nevertheless, this capacity varies on a diurnal basis, as calcification is highly coupled to photosynthetic activity. Our results also imply that future acidification will impose more negative effects on H. opuntia and H. macroloba than on Padina boryana, and the effects on calcified macroalgae may be worsened in darkness. Therefore, further investigations on the carbon budget of the coastal ecosystem should account for calcification as a potential carbon source while considering diurnal variations and the buffering capacity of the primary production of marine vegetation in the natural setting [12,26,57].
4. Materials and Methods
4.1. Sampling and Acclimatization
P. boryana, H. opuntia and H. macroloba were carefully collected with their holdfasts intact from Tung Khen Bay, Phuket (7.810057; 98.404100), where all species were found in high densities and growing on calcareous sediment with depth between 0.5 and 1.0 m. As our investigations were solely focused on the populations growing in the upper sublittoral areas, differences due to varying depth and irradiance were not considered. Cleaned samples were transported to the aquaria facility of Coastal Oceanography and Climate Change Research Center, Prince of Songkla University, in cool boxes containing seawater collected from the sampling site. Additional seawater was collected in sealed dark polypropylene bottles and fixed when necessary. Seawater pH, salinity and total alkalinity (TA) were immediately determined upon arrival at the laboratory (pH = 8.1, salinity = 30 and TA = 2.04 ± 0.05 mM).
At our aquaria facility, the samples were rinsed to remove the remaining sediment and epiphytes. Collected samples were maintained in aquaria filled with sterile seawater (pH = 8.1, salinity = 30 PSU and TA = 1.90 ± 0.08 mM) with constant aeration under ambient temperature (27 °C–32 °C). The irradiance of approximately 150 μmol photons m−2 s−1 was provided with aquarium LED light (A601, Chihiros, Cixi, Zhejiang, China) with a 12:12 h light–dark cycle. An irradiance of 150 μmol photons m−2 s−1 (measured using LI-250A light meter; LICOR, Germany) was chosen based on the minimal saturating irradiance (Ek) derived from the rapid light curves (RLC; Ralph and Gademann [79]) conducted using the collected samples (data not shown). Throughout the acclimation period, pH, salinity and TA were monitored regularly to avoid changes due to evaporation, and distilled water was added as necessary. Prior to the experiment, the health of the macroalgae was evaluated by a pulse amplitude modulated fluorometer (Diving-PAM, Walz, Effeltrich, Germany) using the maximum quantum yield (Fv/Fm) as a biomarker. Subsequent experiments were carried out with algal thalli with an Fv/Fm ≥ 0.7. Experiments were conducted within 7 days of the collection date after which the samples were discarded and fresh materials were collected. Each experimental run consists of all species and all treatments. The run was repeated with new biological materials.
4.2. Characterization of Calcification and Its Effect on Seawater Chemistry
4.2.1. Experimental Design
Each macroalga was weighed to reach the wet weight of approximately 5 g and placed in 250 mL flasks containing a magnetic bar (0.4 × 1.0 cm in size) and filled with 250 mL of seawater. The flasks were tightly closed with rubber stoppers and securely wrapped with parafilm. Flasks filled with seawater without macroalgae were used as controls and were included in the experiment. The flasks were arranged on top of magnetic stirrers where mixing occurs and the effect of the diffusive boundary layer was minimized. The assembly of the experimental set-up was done in dimmed light. Subsequently, an irradiance of approximately 150 μmol photons m−2 s−1 was provided by aquarium LED light (A601, Chihiros, China) for 3 h. The light source was positioned on the side so that the macroalgae were not shaded by the stoppers. When incubation in the light was finished, the macroalgae were removed from the flasks. The remaining seawater without macroalgae was then allowed to be equilibrated with air using a compressed air pump for an additional 4 h (the minimum duration for the seawater to reach stable pH, predetermined from the preliminary results). The macroalgae from each flask were rinsed and dried using a paper towel and kept at −20 °C for further assessment of the surface area, CaCO3 accumulation and microstructural analyses (See below).
Parameters related to seawater chemistry, namely seawater pH, TA and salinity, were measured at three steps: (1) the initial step before light exposure, (2) after 3 h of light exposure and (3) after equilibration with air. Seawater temperature was also recorded. These parameters were used to calculate total dissolved inorganic carbon (DIC), calcification rates, photosynthetic carbon uptake and carbon loss to air, further detailed in Section 4.2.3. Measurements for each species and each treatment were based on nine biological replicates (n = 9).
4.2.2. Determination of Surface Area, CaCO3 Accumulation and Microstructural Analyses
Thalli of P. boryana, H. macroloba and H. opuntia were cut into parts (individual lobe for P. boryana and individual segment for H. macroloba and H. opuntia) and spread on a surface lined with rulers, and the image of each sample was taken. The surface area was determined using image processing software (ImageJ V. 1.53e, Rasband W.S., U.S. National Institute of Health, Bethesda, Maryland, USA) from images of samples [80,81].
Samples were rinsed with distilled water and dried until constant weight at 60 °C. The CaCO3 accumulation of each sample was investigated by dissolving thalli in 5% HCl for 1 h and measuring the dry weights before and after CaCO3 dissolution using an electronic balance [27].
Images of aragonite CaCO3 crystals were examined using a scanning electron microscope (SEM Apreo, FEI, Czech Republic) at the Office of Scientific Instrument and Testing, Prince of Songkla University. The instrument was operated at 20 kV w in high vacuum mode and imaged using the secondary in-lens detector. Samples were mounted on aluminum stubs and then placed in a gold coating unit (SPI Supplies, USA) operated at a 40 mm working distance. Length, width and density of aragonite crystals (n = 4–6) were determined using image processing software. Aragonite crystals with complete needle structure at the top layer in the images were chosen. Ten crystals per replicate were used to calculate average size following the method described by Sinutok et al. [35].
Thalli of P. boryana and apical segments of Halimeda were fixed in 2% glutaraldehyde in 0.05 M phosphate buffered saline and stored at 4 °C. Fixed samples were posted-fixed in 1% OsO4 buffer, and dehydrated through a series of ethanol concentrations (70%, 80%, 90% and 100%). Samples embedded in epoxy resin and were cut into thin sections (80 nm) using a microtome (MT XL microtome, RMC, USA) and stained with 2% uranyl acetate (3 min). Stained sections of P. boryana were examined with a transmission electron microscope at 160 kV (JOEL, JEM-2010, Japan), while stained sections of H. opuntia and H. macroloba were examined using a compound microscope (DM500, Leica Microsystems, Germany). Surface diameter of primary utricle (pU) and diffusion pathway length were determined using image processing software as previously described.
4.2.3. Determination of Carbonate Chemistry-Related Parameters and Fates of Carbon Related to Biological Processes
To avoid creating large headspace in incubation flasks, parameters related to seawater chemistry at the initial step were determined from the samplings drawn from the prepared seawater for the experiment and not directly from the flasks. After light exposure and after equilibration, seawater was collected from each flask using a 50 mL syringe with an extended rubber tube. Total alkalinity was determined using a total alkalinity mini-titrator for water analysis (HI-84531-02, Hanna Instruments, Woonsocket, RI, USA) according to the manufacturer’s instruction. Salinity was measured using an optical refractometer, and seawater pH was measured using a bench-top pH meter (Ohaus RL150, Russell, USA) according to the manufacturer’s instructions.
The measured seawater chemistry parameters were later used to calculate DIC, its distribution among different forms (CO2, HCO3− and CO32−) and saturation state of aragonite (ΩAr) and calcite (ΩCa). Calculation was performed using the software CO2 sys.xls [82].
Calcification rates were calculated following alkalinity anomaly protocol (as described in [20]), whereby a decrease in TA by two equivalents when one mole of CaCO3 is precipitated [83,84]. Calcification rates were normalized against macroalgal wet weight.
In addition to calcification rates, the difference in DIC and TA in seawater collected at the initial time point after incubation in the light and after equilibration can estimate photosynthetic carbon uptake and carbon loss from the seawater surrounding the macroalga. Estimation of photosynthetic carbon uptake and carbon loss was done as described by Kalokora et al. [20] using the following equations:
Photosynthetic carbon uptake = (DICinitial − DICafter light incubation) − DICcalcification
Carbon loss = (DICinitial − DICafter equilibration) − DICcalcification
4.3. Interrelation between Photosynthesis and Calcification
Downscaled and shortened setups were adopted for this experiment. Each macroalga with known and similar wet weight (5 g) was placed in 125 mL flasks filled with 140 mL of sterilized seawater. Measurements for each species and each treatment were based on five biological replicates (n = 5).
This experiment was designed to compare calcification rates in the light to those obtained when photosynthetic light reactions were inhibited. First, we compared calcification rates in light and darkness. During the light exposure, an irradiance of approximately 150 μmol photons m−2 s−1 was provided for 1 h (Aquarium LED light A601, Chihiros, China). Calcification rates in the light were calculated from the TA measured before and after light exposure as previously described. The seawater was subsequently replaced, and macroalgae were maintained in fresh seawater in darkness for an additional 1 h. Calcification rates in the dark (Calcificationdark) were calculated from the TA measured before and after incubation in darkness. Flasks filled with seawater without macroalgae were used as negative controls. Second, we compared calcification rates in the light and in the presence of 0.1 mM 3(3,4-dichlorophenyl)-1,1-dimethylurea (DCMU, the concentration was selected based on the preliminary test, data not shown). Calcification rates in the light were calculated from the TA measured before and after 1 h of light exposure as previously described. The seawater was subsequently replaced with seawater containing 0.5 mM DCMU, and irradiance was provided for an additional 1 h. DCMU inhibits photosynthetic electron transport from PSII to plastoquinone and is widely used as an inhibitor of photosynthesis [85]. The use of DCMU can determine whether the calcification and photosynthetic electron transport are interrelated [64,86]. Seawater prepared for the measurements of calcification rates in the light contained the same volume of ethanol used as the solvent in DCMU treatment (70 µL, corresponding to 0.05% v/v). Flasks filled with seawater without macroalgae were used as negative controls. Calcification rates in the presence of DCMU (Calcificationdcmu) were calculated from the TA measured before and after incubation in the light. Seawater pH at the end of each step was also recorded.
4.4. Statistical Analyses
All the analyses were performed using Statistica academic platform version 13.0 (StatSoft, Tulsa, OK, USA). Cochran’s test was used to verify the assumption of homogeneity of variance prior to conducting the analysis of variance (ANOVA). The statistical significance level was set at p < 0.05 in all analyses.
Differences in %CaCO3 and the CaCO3 crystal morphology and densities among species were analyzed using one-way ANOVA. The difference in surface diameter of primary utricles (pU) diffusion pathway length was analyzed using a t-test.
To characterize the effects of calcification and its effect on seawater chemistry, water chemistry and calcification rates were analyzed by repeated-measures ANOVA using the time of measurements as the within-group factor and macroalgal species as the categorical factor. Differences in each fate of carbon (carbon uptake by photosynthesis, carbon removal by calcification and carbon lost to the air) among species were analyzed using one-way ANOVA. Fisher’s least significant difference (LSD) test was used to compare these parameters across treatments. The relationships between calcification and carbon loss and between photosynthesis and calcification were analyzed by linear regression.
Effects of inhibition of photosynthesis on seawater pH and calcification rates were tested by repeated-measures ANOVA using time of measurements as the within-group factor and macroalgal species as the categorical factor. Fisher’s LSD test was used to compare these parameters across treatments.
Author Contributions
Conceptualization, all authors; methodology, all authors; software, all authors; validation, all authors; formal analysis, all authors; investigation, all authors; resources, all authors; data curation, all authors; writing—original draft preparation, all authors; writing—review and editing, all authors., visualization, all authors; supervision, all authors; project administration, all authors; funding acquisition, all authors. All authors contributed equally to this work. All authors have read and agreed to the published version of the manuscript.
Funding
This research was funded by PRINCE OF SONGKLA UNIVERSITY, grant number ENV6302182S.
Institutional Review Board Statement
Not applicable.
Informed Consent Statement
Not applicable.
Data Availability Statement
Request to corresponding author of this article.
Acknowledgments
We thank Coastal Oceanography and Climate Change Research Center (COCC), Prince of Songkla University (PSU), Faculty of Environmental Management, PSU and Division of Biological Science, Faculty of Science, PSU for research facilities.
Conflicts of Interest
The authors declare no conflict of interest.
References
- Houghton, J.T.; Ding, Y.; Griggs, D.J.; Noguer, M.; van der Linden, P.J.; Dai, X.; Maskell, K.; Johnson, C.A. Climate Change 2001: The Scientific Basis. Contribution of Working Group I to the Third Assessment Report of the Intergovernmental Panel on Climate Change; Cambridge University Press: Cambridge, UK, 2001. [Google Scholar]
- Meehl, G.A.; Stocker, T.F.; Collins, W.D.; Friedlingstein, P.; Gaye, A.T.; Gregory, J.M.; Kitoh, A.; Knutti, R.; Murphy, J.M.; Noda, A.; et al. Global Climate Projections. In Climate Change 2007: The Physical Science Basis. Contribution of Working Group I to the Fourth Assessment Report of the Intergovernmental Panel on Climate Change; Cambridge University Press: Cambridge, NY, USA, 2007. [Google Scholar]
- Albright, R.; Benthuysen, J.; Cantin, N.; Caldeira, K.; Anthony, K. Coral reef metabolism and carbon chemistry dynamics of a coral reef flat. Geophys. Res. Lett. 2015, 42. [Google Scholar] [CrossRef]
- Rasmusson, L.M.; Nualla-ong, A.; Wutiruk, T.; Björk, M.; Gullström, M.; Buapet, P. Sensitivity of photosynthesis to warming in two similar species of the aquatic angiosperm Ruppia from tropical and temperate habitats. Sustainability 2021, 13, 9433. [Google Scholar] [CrossRef]
- Yucharoen, M.; Sinutok, S.; Chotikarn, P.; Buapet, P. Experimental assessment of vulnerability to warming in tropical shallow-water marine organisms. Front. Mar. Sci. 2021, 8, 767628. [Google Scholar] [CrossRef]
- Tano, S.; Eggertsen, M.; Wikström, S.A.; Berkström, C.; Buriyo, A.S.; Halling, C. Tropical seaweed beds are important habitats for mobile invertebrate epifauna. Estuar. Coast. Shelf Sci. 2016, 183, 1–12. [Google Scholar] [CrossRef]
- Eggertsen, L.; Ferreira, C.E.L.; Fontoura, L.; Kautsky, N.; Gullström, M.; Berkström, C. Seaweed beds support more juvenile reef fish than seagrass beds in a south-western Atlantic tropical seascape. Estuar. Coast. Shelf Sci. 2017, 196, 97–108. [Google Scholar] [CrossRef]
- Hill, R.; Bellgrove, A.; Macreadie, P.I.; Petrou, K.; Beardall, J.; Steven, A.; Ralph, P.J. Can macroalgae contribute to blue carbon? An Australian perspective. Limnol. Oceanogr. 2015, 60, 1689–1706. [Google Scholar] [CrossRef]
- Krause-Jensen, D.; Lavery, P.; Serrano, O.; Marbà, N.; Masque, P.; Duarte, C.M. Sequestration of macroalgal carbon: The elephant in the Blue Carbon room. Biol. Lett. 2018, 14, 20180236. [Google Scholar] [CrossRef]
- Raven, J. Blue carbon: Past, present and future, with emphasis on macroalgae. Biol. Lett. 2018, 14, 20180336. [Google Scholar] [CrossRef]
- Ortega, C.; Vargas, G.; Rojas, M.; Rutllant, J.A.; Muñoz, P.; Lange, C.B.; Pantoja, S.; Dezileau, L.; Ortlieb, L. Extreme ENSO-driven torrential rainfalls at the southern edge of the Atacama Desert during the Late Holocene and their projection into the 21th century. Glob. Planet. Chang. 2019, 175, 226–237. [Google Scholar] [CrossRef]
- Bergstrom, E.; Silva, J.; Martins, C.; Horta, P. Seagrass can mitigate negative ocean acidification effects on calcifying algae. Sci. Rep. 2019, 9, 1932. [Google Scholar] [CrossRef] [PubMed]
- McNicholl, C.; Koch, M.S.; Swarzenski, P.W.; Oberhaensli, F.R.; Taylor, A.; Batista, M.G.; Metian, M. Ocean acidification effects on calcification and dissolution in tropical reef macroalgae. Coral Reefs 2020, 39, 1635–1647. [Google Scholar] [CrossRef]
- McNicholl, C.; Koch, M.S. Irradiance, photosynthesis and elevated pCO2 effects on net calcification in tropical reef macroalgae. J. Exp. Mar. Bio. Ecol. 2021, 535, 151489. [Google Scholar] [CrossRef]
- Yang, F.; Wei, Z.; Long, L. Transcriptomic and Physiological Responses of the Tropical Reef Calcified Macroalga Amphiroa fragilissima to Elevated Temperature1. J. Phycol. 2021, 57, 1254–1265. [Google Scholar] [CrossRef]
- Johnson, M.D.; Price, N.N.; Smith, J.E. Contrasting effects of ocean acidification on tropical fleshy and calcareous algae. PeerJ 2014, 2, e411. [Google Scholar] [CrossRef]
- Arina, N.; Raynusha, C.; Hidayah, N.; Zainee, N.F.A.; Prathep, A.; Rozaimi, M. Coralline macroalgae contribution to ecological services of carbon storage in a disturbed seagrass meadow. Mar. Environ. Res. 2020, 162, 105156. [Google Scholar] [CrossRef]
- Kleypas, J.A.; Anthony, K.R.N.; Gattuso, J.-P. Coral reefs modify their seawater carbon chemistry—Case study from a barrier reef (Moorea, French Polynesia). Glob. Chang. Biol. 2011, 17, 3667–3678. [Google Scholar] [CrossRef]
- Macreadie, P.I.; Anton, A.; Raven, J.A.; Beaumont, N.; Connolly, R.M.; Friess, D.A.; Kelleway, J.J.; Kennedy, H.; Kuwae, T.; Lavery, P.S.; et al. The future of Blue Carbon science. Nat. Commun. 2019, 10, 3998. [Google Scholar] [CrossRef] [PubMed]
- Kalokora, O.J.; Buriyo, A.S.; Asplund, M.E.; Gullström, M.; Mtolera, M.S.P.; Björk, M. An experimental assessment of algal calcification as a potential source of atmospheric CO2. PLoS ONE 2020, 15, e0231971. [Google Scholar] [CrossRef]
- Ware, J.R.; Smith, S.V.; Reaka-Kudla, M.L. Coral reefs: Sources or sinks of atmospheric CO2? Coral Reefs 1992, 11, 127–130. [Google Scholar] [CrossRef]
- Frankignoulle, M.; Canon, C.; Gattuso, J.-P. Marine calcification as a source of carbon dioxide: Positive feedback of increasing atmospheric CO2. Limnol. Oceanogr. 1994, 39, 458–462. [Google Scholar] [CrossRef]
- Barker, S.; Higgins, J.A.; Elderfield, H. The future of the carbon cycle: Review, calcification response, ballast and feedback on atmospheric CO2. Philos. Trans. R. Soc. London. Ser. A Math. Phys. Eng. Sci. 2003, 361, 1977–1999. [Google Scholar] [CrossRef]
- Borowitzka, M.A. Calcification in aquatic plants. Plant Cell Environ. 1984, 7, 457–466. [Google Scholar] [CrossRef]
- McConnaughey, T. Biomineralization Mechanisms. In Origin, Evolution, and Modern Aspects of Biomineralization in Plants and Animals; Springer: Bostan, MA, USA, 1989. [Google Scholar]
- Buapet, P.; Gullström, M.; Björk, M. Photosynthetic activity of seagrasses and macroalgae in temperate shallow waters can alter seawater pH and total inorganic carbon content at the scale of a coastal embayment. Mar. Freshw. Res. 2013, 64, 1040–1048. [Google Scholar] [CrossRef]
- Sinutok, S. Interactive Effects of the Ocean Acidification and Warming on Sediment Dwelling Marine Calcifers. Ph.D. Thesis, University of Technology Sydney, Sydney, Australia, 2013. [Google Scholar]
- McNicholl, C.; Koch, M.S.; Hofmann, L.C. Photosynthesis and light-dependent proton pumps increase boundary layer pH in tropical macroalgae: A proposed mechanism to sustain calcification under ocean acidification. J. Exp. Mar. Bio. Ecol. 2019, 521, 151208. [Google Scholar] [CrossRef]
- Van der Heijden, L.H.; Kamenos, N.A. Calculating the global contribution of coralline algae to carbon burial. Biogeosciences 2015, 12, 7845–7877. [Google Scholar] [CrossRef]
- Hofmann, L.C.; Bischof, K.; Baggini, C.; Johnson, A.; Koop-Jakobsen, K.; Teichberg, M. CO2 and inorganic nutrient enrichment affect the performance of a calcifying green alga and its noncalcifying epiphyte. Oecologia 2015, 177, 1157–1169. [Google Scholar] [CrossRef]
- Hofmann, L.C.; Koch, M.; de Beer, D. Biotic control of surface pH and evidence of light-induced H+ pumping and Ca2+-H+ exchange in a tropical crustose coralline alga. PLoS ONE 2016, 11, e0159057. [Google Scholar] [CrossRef]
- Sinutok, S.; Hill, R.; Doblin, M.A.; Kühl, M.; Ralph, P.J. Microenvironmental changes support evidence of photosynthesis and calcification inhibition in Halimeda under ocean acidification and warming. Coral Reefs 2012, 31, 1201–1213. [Google Scholar] [CrossRef]
- Schulz, K.G.; Riebesell, U. Diurnal changes in seawater carbonate chemistry speciation at increasing atmospheric carbon dioxide. Mar. Biol. 2013, 160, 1889–1899. [Google Scholar] [CrossRef] [PubMed]
- Sinutok, S.; Pongparadon, S.; Prathep, A. Seasonal variation in density, growth rate and calcium carbonate accumulation of Halimeda macroloba Decaisne at Tangkhen Bay, Phuket Province, Thailand. Malays. J. Sci. 2008, 27, 1–8. [Google Scholar]
- Sinutok, S.; Hill, R.; Doblin, M.A.; Wuhrer, R.; Ralph, P.J. Warmer more acidic conditions cause decreased productivity and calcification in subtropical coral reef sediment-dwelling calcifiers. Limnol. Oceanogr. 2011, 56, 1200–1212. [Google Scholar] [CrossRef]
- Kleypas, J.A.; Buddemeier, R.W.; Archer, D.; Gattuso, J.-P.; Langdon, D.; Opdyke, B.N. Geochemical consequences of increased atmospheric carbon dioxide on coral reefs. Science 1999, 284, 118–120. [Google Scholar] [CrossRef] [PubMed]
- Hofmann, L.C.; Bischof, K. Ocean acidification effects on calcifying macroalgae. Aquat. Biol. 2014, 22, 261–279. [Google Scholar] [CrossRef]
- Iluz, D.; Fermani, S.; Ramot, M.; Reggi, M.; Caroselli, E.; Prada, F.; Dubinsky, Z.; Goffredo, S.; Falini, G. Calcifying response and recovery potential of the brown alga Padina pavonica under ocean acidification. ACS Earth Sp. Chem. 2017, 1, 316–323. [Google Scholar] [CrossRef]
- Peach, K.E.; Koch, M.S.; Blackwelder, P.L.; Manfrino, C. Calcification and photophysiology responses to elevated pCO2 in six Halimeda species from contrasting irradiance environments on Little Cayman Island reefs. J. Exp. Mar. Bio. Ecol. 2017, 486, 114–126. [Google Scholar] [CrossRef]
- Okazaki, M.; Pentecost, A.; Tanaka, Y.; Miyata, M. A study of calcium carbonate deposition in the genus Padina (Phaeophyceae, Dictyotales). Br. Phycol. J. 1986, 21, 217–224. [Google Scholar] [CrossRef]
- Johnson, V.R.; Russell, B.D.; Fabricius, K.E.; Brownlee, C.; Hall-Spencer, J.M. Temperate and tropical brown macroalgae thrive, despite decalcification, along natural CO2 gradients. Glob. Chang. Biol. 2012, 18, 2792–2803. [Google Scholar] [CrossRef]
- Koch, M.; Bowes, G.; Ross, C.; Zhang, X.-H. Climate change and ocean acidification effects on seagrasses and marine macroalgae. Glob. Chang. Biol. 2013, 19, 103–132. [Google Scholar] [CrossRef]
- Wei, Z.; Long, C.; Zhang, Y.; Huo, Y.; Yang, F.; Long, L. Increased light availability enhances tolerance against ocean acidification stress in Halimeda opuntia. bioRxiv 2020, 1, 1–38. [Google Scholar]
- Mayakun, J.; Bunruk, P.; Kongsaeng, R. Growth rate and calcium carbonate accumulation of Halimeda macroloba Decaisne (Chlorophyta: Halimedaceae) in Thai waters. Songklanakarin J. Sci. Technol. 2014, 36, 419–423. [Google Scholar]
- Wichachucherd, B.; Prathep, A.; Zuccarello, G.C. Phylogeography of Padina boryana (Dictyotales, Phaeophyceae) around the Thai-Malay Peninsula. Eur. J. Phycol. 2014, 49, 313–323. [Google Scholar] [CrossRef]
- Kaewsrikhaw, R.; Prathep, A.; Darakrai, A.; Beer, S. Photosynthesis and calcification in two Halimeda species from Phuket, Thailand. Bot. Mar. 2016, 59, 187–192. [Google Scholar] [CrossRef]
- Prathep, A.; Kaewsrikhaw, R.; Mayakun, J.; Darakrai, A. The effects of light intensity and temperature on the calcification rate of Halimeda macroloba. J. Appl. Phycol. 2018, 30, 3405–3412. [Google Scholar] [CrossRef]
- Diaz-Pulido, G.; Cornwall, C.; Gartrell, P.; Hurd, C.; Tran, D. V Strategies of dissolved inorganic carbon use in macroalgae across a gradient of terrestrial influence: Implications for the Great Barrier Reef in the context of ocean acidification. Coral Reefs 2016, 35, 1327–1341. [Google Scholar] [CrossRef]
- Cornwall, C.E.; Revill, A.T.; Hall-Spencer, J.M.; Milazzo, M.; Raven, J.A.; Hurd, C.L. Inorganic carbon physiology underpins macroalgal responses to elevated CO2. Sci. Rep. 2017, 7, srep46297. [Google Scholar] [CrossRef] [PubMed]
- Borowitzka, M.A.; Larkum, A.W.D. Calcification in the Green Alga Halimeda: III. The sources of inorganic carbon for photosynthesis and calcification and a model of the mechanism of calcification. J. Exp. Bot. 1976, 27, 879–893. [Google Scholar] [CrossRef]
- Böhm, L.; Fütterer, D.; Kaminski, E. Algal calcification in some Codiaceae (Chlorophyta): Ultrastructure and location of skeletal deposits 1, 2. J. Phycol. 1978, 14, 486–493. [Google Scholar] [CrossRef]
- Mauffrey, A.R.L.; Cappelatti, L.; Griffin, J.N. Seaweed functional diversity revisited: Confronting traditional groups with quantitative traits. J. Ecol. 2020, 108, 2390–2405. [Google Scholar] [CrossRef]
- Jokiel, P.L. Ocean acidification and control of reef coral calcification by boundary layer limitation of proton flux. Bull. Mar. Sci. 2011, 87, 639–657. [Google Scholar] [CrossRef]
- Ries, J.B. A physicochemical framework for interpreting the biological calcification response to CO2-induced ocean acidification. Geochim. Cosmochim. Acta 2011, 75, 4053–4064. [Google Scholar] [CrossRef]
- Tyler, C.; Kai, S.; Jokiel, P.L. Predicting the impact of ocean acidification on coral reefs: Evaluating the assumptions involved. ICES J. Mar. Sci. 2016, 73, 550–557. [Google Scholar] [CrossRef]
- Frankignoulle, M.; Pichon, M.; Gattuso, J.-P. Aquatic Calcification as a Source of Carbon Dioxide. In Carbon Sequestration Biosphere; Springer: Berlin/Heidelberg, Germany, 1995. [Google Scholar]
- Semesi, I.S.; Beer, S.; Björk, M. Seagrass photosynthesis controls rates of calcification and photosynthesis of calcareous macroalgae in a tropical seagrass meadow. Mar. Ecol. Prog. Ser. 2009, 382, 41–47. [Google Scholar] [CrossRef]
- Mayakun, J.; Prathep, A. Calcium carbonate productivity by Halimeda macroloba in the tropical intertidal ecosystem: The significant contributor to global carbonate budgets. Phycol. Res. 2019, 67, 94–101. [Google Scholar] [CrossRef]
- Mayakun, J.; Liao, C.-P.; Liu, S.-L. The standing stock and CaCO3 contribution of Halimeda macroloba in the tropical seagrass-dominated ecosystem in Dongsha Island, the main island of Dongsha Atoll, South China Sea. J. Mar. Biol. Assoc. United Kingd. 2020, 100, 1219–1227. [Google Scholar] [CrossRef]
- Pentecost, A. Calcification Processes in Algae and Cyanobacteria. In Calcareous Algae and Stromatolites; Springer: Berlin/Heidelberg, Germany, 1991. [Google Scholar]
- Egilsdottir, H.; Olafsson, J.; Martin, S. Photosynthesis and calcification in the articulated coralline alga Ellisolandia elongata (Corallinales, Rhodophyta) from intertidal rock pools. Eur. J. Phycol. 2016, 51, 59–70. [Google Scholar] [CrossRef]
- Williamson, C.J.; Perkins, R.; Voller, M.; Yallop, M.L.; Brodie, J. The regulation of coralline algal physiology, an in situ study of Corallina officinalis (Corallinales, Rhodophyta). Biogeosciences 2017, 14, 4485–4498. [Google Scholar] [CrossRef]
- Jensen, P.R.; Gibson, R.A.; Littler, M.M.; Littler, D.S. Photosynthesis and calcification in four deep-water Halimeda species (chlorophyceae, caulerpales). Deep Sea Res. Part A Oceanogr. Res. Pap. 1985, 32, 451–464. [Google Scholar] [CrossRef]
- De Beer, D.; Larkum, A.W.D. Photosynthesis and calcification in the calcifying algae Halimeda discoidea studied with microsensors. Plant. Cell Environ. 2001, 24, 1209–1217. [Google Scholar] [CrossRef]
- McConnaughey, T.A.; Whelan, J.F. Calcification generates protons for nutrient and bicarbonate uptake. Earth-Sci. Rev. 1997, 42, 95–117. [Google Scholar] [CrossRef]
- Borowitzka, M.A. Morphological and Cytological Aspects of Algal Calcification. In International Review of Cytology; Elsevier: Amsterdam, The Netherlands, 1982; pp. 127–162. [Google Scholar]
- Hofmann, L.C.; Schoenrock, K.; de Beer, D. Arctic coralline algae elevate surface pH and carbonate in the dark. Front. Plant Sci. 2018, 9, 1416. [Google Scholar] [CrossRef]
- Borowitzka, M.A.; Larkum, A.W.D. Calcification in the green alga Halimeda. I. An Ultrastructure study of thallus development 1. J. Phycol. 1977, 13, 6–16. [Google Scholar] [CrossRef]
- Lee, D.; Carpenter, S.J. Isotopic disequilibrium in marine calcareous algae. Chem. Geol. 2001, 172, 307–329. [Google Scholar] [CrossRef]
- Gil-Díaz, T.; Haroun, R.; Tuya, F.; Betancor, S.; Viera-Rodríguez, M.A. Effects of ocean acidification on the brown alga Padina pavonica: Decalcification due to acute and chronic events. PLoS ONE 2014, 9, e108630. [Google Scholar] [CrossRef]
- Goffredo, S.; Prada, F.; Caroselli, E.; Capaccioni, B.; Zaccanti, F.; Pasquini, L.; Fantazzini, P.; Fermani, S.; Reggi, M.; Levy, O.; et al. Biomineralization control related to population density under ocean acidification. Nat. Clim. Chang. 2014, 4, 593–597. [Google Scholar] [CrossRef]
- Pettit, L.R.; Smart, C.W.; Hart, M.B.; Milazzo, M.; Hall-Spencer, J.M. Seaweed fails to prevent ocean acidification impact on foraminifera along a shallow-water CO2 gradient. Ecol. Evol. 2015, 5, 1784–1793. [Google Scholar] [CrossRef]
- Betancor, S.; Tuya, F.; Gil-Díaz, T.; Figueroa, F.L.; Haroun, R. Effects of a submarine eruption on the performance of two brown seaweeds. J. Sea Res. 2014, 87, 68–78. [Google Scholar] [CrossRef]
- Celis-Plá, P.S.M.; Hall-Spencer, J.M.; Horta, P.A.; Milazzo, M.; Korbee, N.; Cornwall, C.E.; Figueroa, F.L. Macroalgal responses to ocean acidification depend on nutrient and light levels. Front. Mar. Sci. 2015, 2, 26. [Google Scholar] [CrossRef]
- Vogel, N.; Fabricius, K.E.; Strahl, J.; Noonan, S.H.C.; Wild, C.; Uthicke, S. Calcareous green alga Halimeda tolerates ocean acidification conditions at tropical carbon dioxide seeps. Limnol. Oceanogr. 2015, 60, 263–275. [Google Scholar] [CrossRef]
- Price, N.; Hamilton, S.; Tootell, J.; Smith, J. Species-specific consequences of ocean acidification for the calcareous tropical green algae Halimeda. Mar. Ecol. Prog. Ser. 2011, 440, 67–78. [Google Scholar] [CrossRef]
- Schubert, N.; Hofmann, L.C.; Almeida Saá, A.C.; Moreira, A.C.; Arenhart, R.G.; Fernandes, C.P.; de Beer, D.; Horta, P.A.; Silva, J. Calcification in free-living coralline algae is strongly influenced by morphology: Implications for susceptibility to ocean acidification. Sci. Rep. 2021, 11, 11232. [Google Scholar] [CrossRef]
- Borowitzka, M.A. Mechanism in algal calcification. Prog. Phycol. Res. 1982, 1, 137–177. [Google Scholar]
- Ralph, P.J.; Gademann, R. Rapid light curves: A powerful tool to assess photosynthetic activity. Aquat. Bot. 2005, 82, 222–237. [Google Scholar] [CrossRef]
- Schneider, C.A.; Rasband, W.S.; Eliceiri, K.W. NIH Image to ImageJ: 25 years of image analysis. Nat. Methods 2012, 9, 671–675. [Google Scholar] [CrossRef] [PubMed]
- Cappelatti, L.; Mauffrey, A.R.L.; Griffin, J.N. Applying continuous functional traits to large brown macroalgae: Variation across tidal emersion and wave exposure gradients. Mar. Biol. 2019, 166, 145. [Google Scholar] [CrossRef]
- Pierrot, D.; Lewis, E.; Wallace, D.W.R. MS Excel Program Developed for CO2 System Calculations: ORNL/CDIAC-105a. Carbon Dioxide Information Analysis Center, Oak Ridge National Laboratory, U.S. Department of Energy, Oak Ridge, Tennessee. 2006. Available online: http://marine.gov.scot/sma/content/ms-excel-program-developed-co2-system-calculations (accessed on 21 October 2021).
- Smith, S.V.; Key, G.S. Carbon dioxide and metabolism in marine environments1. Limnol. Oceanogr. 1975, 20, 493–495. [Google Scholar] [CrossRef]
- Gazeau, F.; Quiblier, C.; Jansen, J.M.; Gattuso, J.-P.; Middelburg, J.J.; Heip, C.H.R. Impact of elevated CO2 on shellfish calcification. Geophys. Res. Lett. 2007, 34, L07603. [Google Scholar] [CrossRef]
- Haynes, D.; Ralph, P.; Prange, J.; Dennison, B. The Impact of the herbicide Diuron on photosynthesis in three species of tropical Seagrass. Mar. Pollut. Bull. 2000, 41, 288–293. [Google Scholar] [CrossRef]
- Laurent, J.; Tambutté, S.; Tambutté, É.; Allemand, D.; Venn, A. The influence of photosynthesis on host intracellular pH in scleractinian corals. J. Exp. Biol. 2012, 216, 1398–1404. [Google Scholar] [CrossRef]


Publisher’s Note: MDPI stays neutral with regard to jurisdictional claims in published maps and institutional affiliations. |
© 2021 by the authors. Licensee MDPI, Basel, Switzerland. This article is an open access article distributed under the terms and conditions of the Creative Commons Attribution (CC BY) license (https://creativecommons.org/licenses/by/4.0/).