Abstract
Phytophtora capsici causes major diseases in cucurbit crops worldwide. In this study, we inoculated this pathogen into Cucurbita pepo subsp. pepo susceptible MUCU-16 and C. moschata tolerant M63. The gene expression of plant pathogenesis-related proteins chitinase (CpChiIV), lignin-forming peroxidase (CpLPOX), and defensin (CpDEF) and hormone-related enzymes salicylic acid (CpPAL) and ethylene (CpACO) was analyzed for two weeks post-inoculation in root and crown tissues. Differentially expressed genes were found between genotypes, tissues, days post-inoculation, and inoculated/non-inoculated samples. After inoculation, CpPAL and CpChiIV (crown) were downregulated in MUCU-16, while CpLPOX and CpDEF were upregulated in M63. In inoculated samples, higher expression changes were presented on days 10–14 than on day 3 for CpACO, CpLPOX, and CpDEF genes. Overexpression was higher for CpDEF compared to the other tested genes, indicating good suitability as a marker of biotic stress. The overexpression of CpDEF was higher in crown than in roots for both inoculated genotypes. The basal expression of CpPAL and CpDEF was higher in MUCU-16, but after inoculation, CpPAL and CpDEF gene expression were higher in M63. These changes suggest an association between CpDEF upregulation and tolerance, and between CpPAL downregulation and susceptibility.
1. Introduction
Squashes (Cucurbita spp.) are a heterogeneous genus in terms of cultivable species and morphotypes. They are distributed worldwide and some have economic significance, such as gourds and pumpkins (Cucurbita moschata and Cucurbita maxima, among others) and zucchini (Cucurbita pepo subsp. pepo). Their production can be severely affected by soil-borne pathogens, such as the oomycete Phytophthora capsici, which causes foliar blight and root, crown (basal stem), and fruit rot in a wide range of cucurbit species [1]. This pathogen, when present in the soil, causes damage to the crown that leads to stem girdling and plant wilting due to the inability to transport nutrients. P. capsici commonly appears in over-irrigated fields and can survive in plant residues or in the soil for long periods as oospores, which allows the fungi to overcome extreme temperatures or desiccation [1,2]. Therefore, current integrated management relies on soil water management, chemical treatment of soil, seeds, and plants, bio/solarization, or crop rotation [2,3].
Plant resistance has been proven as an efficient method to control fungal diseases; however, there is a lack of commercially available squash varieties with resistance to P. capsici. Reduced crown damage caused by P. capsici has been found in Cucurbita lundelliana and C. okeechobeensis wild species [4], C. pepo [5], and C. moschata [6]. Resistance to P. capsici derived from Cucurbita lundelliana and C. okeechobeensis has been introgressed into C. moschata, and its segregation suggests that this trait is controlled by three dominant genes [7]. Furthermore, in a screening of resistance to P. capsici in C. pepo species, it was found that 16 accessions were less damaged by the pathogen [5]. Backcrossing and phenotypic segregation tests also indicated that the resistance to P. capsici was also controlled by three dominant genes [8]. However, there is still no cultivar resistant to this disease in the highly susceptible Cucurbita pepo subsp. pepo genotype, despite its being one of the main cultivable crops in the Cucurbitaceae family.
The molecular interaction between cucurbits and soil-borne pathogenic fungi has been studied from various perspectives, and some components involved have been described. However, most studies have used Fusarium oxysporum and other crops in the Cucumis genus [9,10], while molecular studies of Phytophthora capsici have used horticultural crops such as pepper [11,12]. Many of the plant defensive tools against soil-borne pathogenic fungi are enzymes that act directly on pathogens, such as chitinases, 1,3-glucanases/glucosidases, and peroxidases [13,14,15]; are involved in the production of defense structures such as lignin [16], tylose [17], and suberin [18]; are antimicrobial molecules (phytoalexins) [19]; or are oligopeptides (defensins) [14].
The chitinases, whose expression is enhanced by numerous biotic and abiotic factors, hydrolyze the N-acetylglucosamine polymer chitin. Chitin is a structural component of the cell wall of many phytopathogenic fungi, so its degradation has been related to fungal resistance [20]. Another highly studied family is the peroxidases, of which there are several types. The ones that are more closely related to plant defense are involved in reactive oxygen species production or in processes such as suberization or lignification. Lignin-forming peroxidases act at the final stages of lignin biosynthesis, forming part of the cell wall of many plant cells, especially the cells of the xylem conduct, which pathogenic fungi use to penetrate plants [21]. Plant defensins are highly stable, cysteine-rich oligopeptides that are found in a wide variety of crops and have conserved structures depending on the cysteine position, which categorizes them into different families [22]. These defensins are part of the plant’s innate immune system and have important antifungal activity, and many studies have linked their overexpression to enhanced disease control [23,24]. All of these pathogenesis-related components are closely regulated by phytohormones such as salicylic acid, jasmonic acid, or ethylene, which are also involved in the plant’s defensive response [9]. Generally, the salicylic acid route is related to plant pathogen tolerance, whereas jasmonic acid, ethylene, abscisic acid, and auxin have complex effects. These hormone signaling pathways are often targeted by pathogens, which can interfere with them [25].
The aim of this work was to describe the expression of some genes that may be part of the Cucurbita spp. response to P. capsici inoculation. For this purpose, we analyzed the gene expression of the susceptible cultivar MUCU-16 (C. pepo subsp. pepo) and the tolerant cultivar M64 (C. moschata) in root and crown tissues for the first two weeks post-inoculation. Three pathogenesis-related proteins—EP3 endochitinase (CpChitIV), lignin-forming peroxidase (CpLPOX), and J1-2 defensin (CpDEF)—were selected for the analysis. In addition, two enzymes related to hormone biosynthesis, phenylalanine ammonia-lyase (CpPAL), which favors the production of salicylic acid precursors [26], and 1-aminocyclopropane-1-carboxylate oxidase (CpACO, ethylene), which participates in the last step of ethylene biosynthesis, converting the 1-aminocyclopropane-1-carboxylic acid into ethylene [27].
2. Results
2.1. Phytophthora capsici Disease Evolution in Cucurbita spp.
The tolerant C. moschata M63 population showed a lower disease severity index (DSI) than the Cucurbita pepo subsp. pepo susceptible MUCU-16 (p = 0.0012; Table 1), although both species were damaged by P. capsici. The symptoms in affected plants were similar. Initially, the cucurbits showed leaf decay and the pathogen progressively damaged the crown, causing girdling and soaking, which led to plant wilting (Figure 1). The symptomatology was on set on day 3 for the susceptible and day 10 for the tolerant species.

Table 1.
Disease development of inoculated plants.
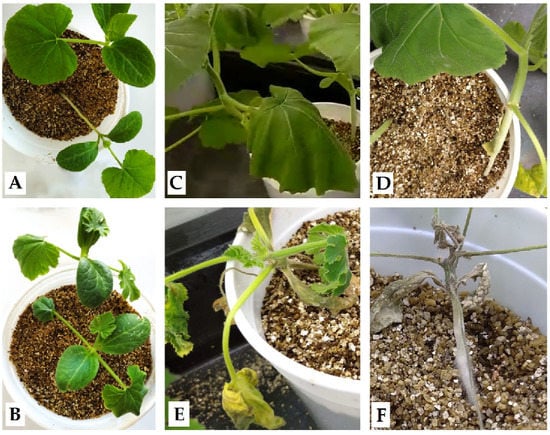
Figure 1.
Phytophthora capsici symptomatology in Cucurbita spp. (A) M63 and (B) MUCU-16 3 days post-inoculation; only MUCU-16 showed damage (leaf decay). After 14 days post-inoculation, some M63 plants showed (C) leaf decay or (D) soaked/girdling crown, while MUCU-16 presented (E) wilt/chlorosis and (F) death.
2.2. Normalized Relative Quantity
Gene expression changes were observed between genotypes, tissues, inoculated/non-inoculated samples, and time post-inoculation (Figure 2, Table 2, Table 3 and Table 4).
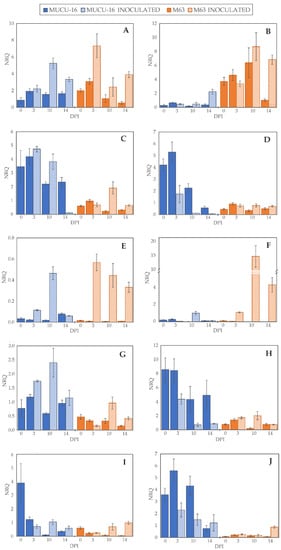
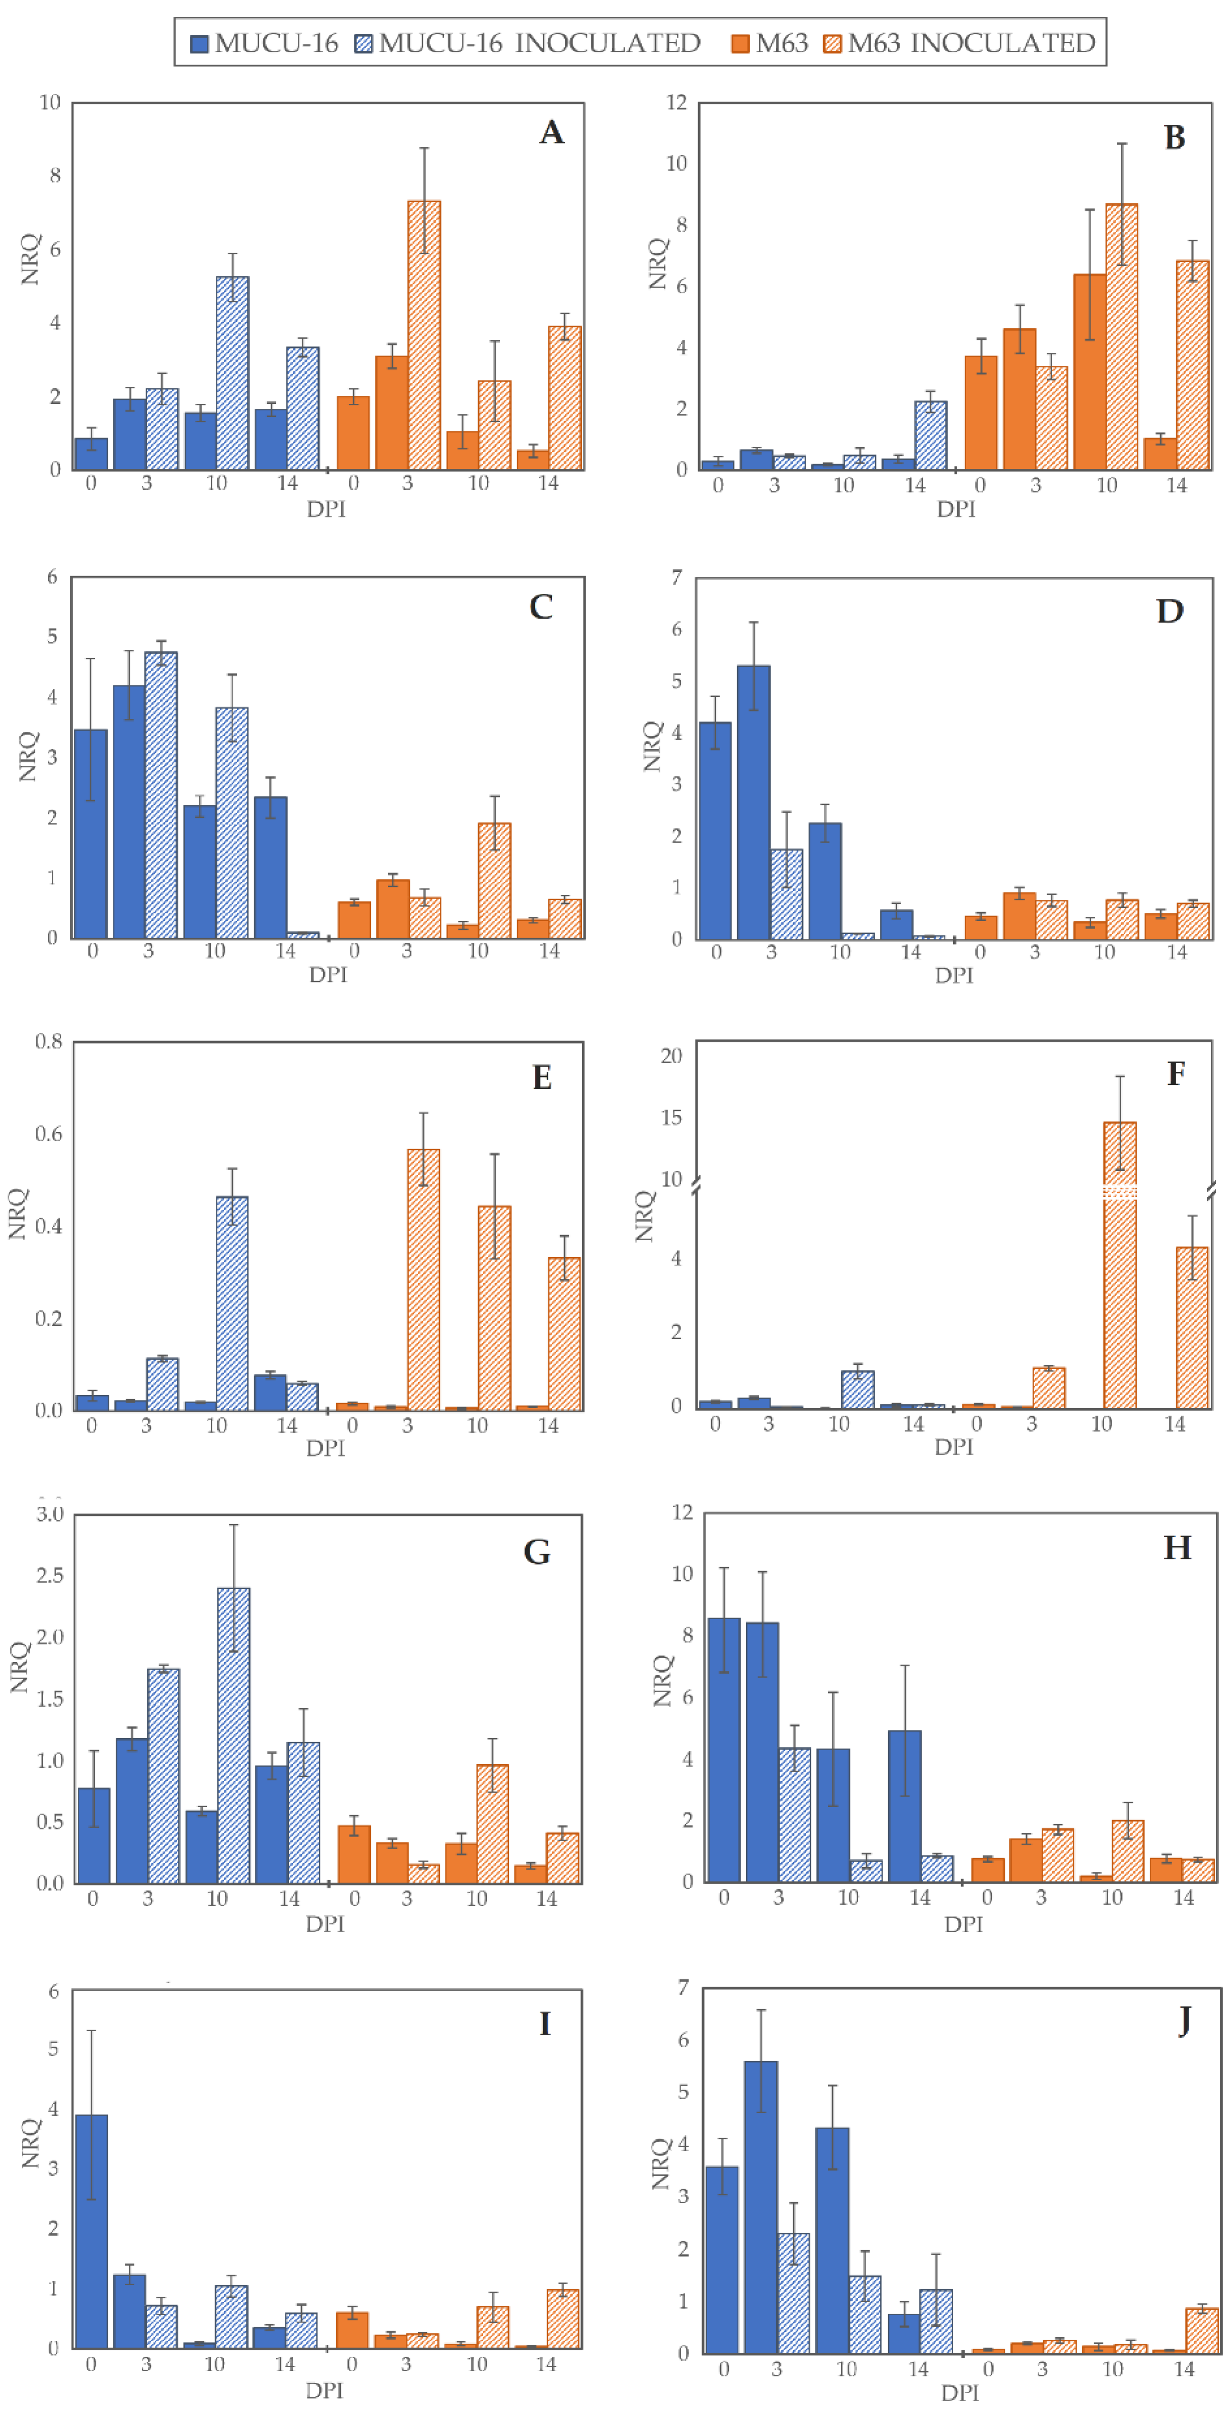
Figure 2.
Normalized relative quantity (NRQ) of selected genes. NRQ (Y-axis) for 0, 3, 10, and 14 days post-inoculation (X-axis) of genotypes MUCU-16 (blue) and M63 (orange) and inoculated (striped bars) and non-inoculated (solid bars) samples: (A,B) 1-aminocyclopropane-1-carboxylate oxidase (CpACO) expression in root and crown, respectively; (C,D) phenylalanine ammonia-lyase (CpPAL) expression in root and crown; (E,F) defensin (CpDEF) expression in root and crown; (G,H) endochitinase EP3 (CpChiIV) expression in root and crown; (I,J) lignin-forming peroxidase (CpLPOX) expression in root and crown. Data were relativized with UBI and EF1a as reference genes [29]. Error bars represent standard error from 3 replicates.
Table 2.
Gene expression (NRQ) pair comparison between inoculated and non-inoculated samples.
Table 3.
Gene expression (NRQ) pair comparison between crown and root samples.
Table 4.
Gene expression (NRQ) pair comparison between M63 and MUCU-16 samples.
On day 3 post-inoculation, fewer changes between inoculated and non-inoculated samples occurred than on days 10–14 (p = 0.004, n = 120) when the data of all genes for the same day were pooled. After inoculation, CpLPOX and CpDEF were upregulated only in M63, while no gene was significantly upregulated in MUCU-16 (Table 2). CpACO gene was upregulated on days 10–14 post-inoculation, suggesting a late plant response through this gene (Table 2). In inoculated samples, CpDEF was significantly upregulated in both crown and root, while CpACO was only in root (Table 2).
Pooling all the samples, there were no significant differences between tissues, with the exception of CpChiIV, which was more expressed in crown than in root (Table 3). However, for the inoculated samples, this difference in CpChiIV expression disappeared, suggesting an effect of the tissue for this gene (Table 3). In addition, in MUCU-16, CpLPOX and CpACO were significantly more expressed in crown and root, respectively (Table 3).
Regardless of the origin of the samples (e.g., day sampling, inoculated/non-inoculated, tissue), the highest differences were found between genotypes, especially in non-inoculated samples (Table 4). All genes tested showed more basal expression in MUCU-16 than in M63, except for CpACO, which was more expressed in M63 (Figure 2, Table 4). These differences were significant in the crown for CpACO, CpChiIV, and CpLPOX and in the roots for CpChiIV and CpPAL (Table 4).
Due to the influences that each analyzed factor (treatment, tissues, genotype and days post-treatment) could have on the interpretation of more than one factor simultaneously, they were relativized by their levels (inoculated/non-inoculated, crown/root, M63/MUCU-16) and reinterpreted in the following sections.
2.3. Differentially Expressed Genes between Inoculated and Non-Inoculated Plants
To avoid the influence of the background gene expression of tissues and genotypes (Table 3 and Table 4), data were relativized comparing inoculated versus non-inoculated samples (Figure 3). The results in Figure 3 show how the tissues (CpChiIV) and genotypes (CpPAL and CpDEF) selected could affect the differential expression between inoculated and non-inoculated samples.
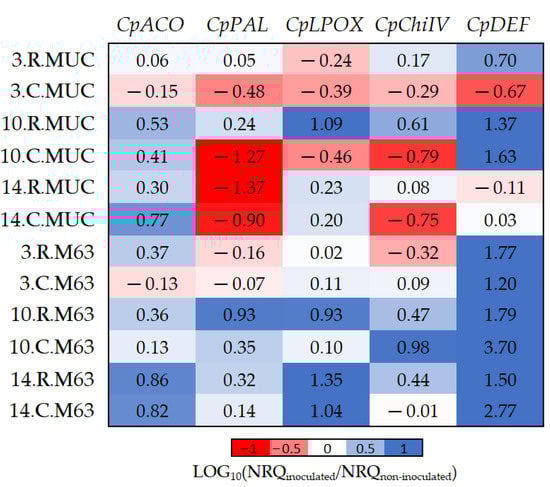
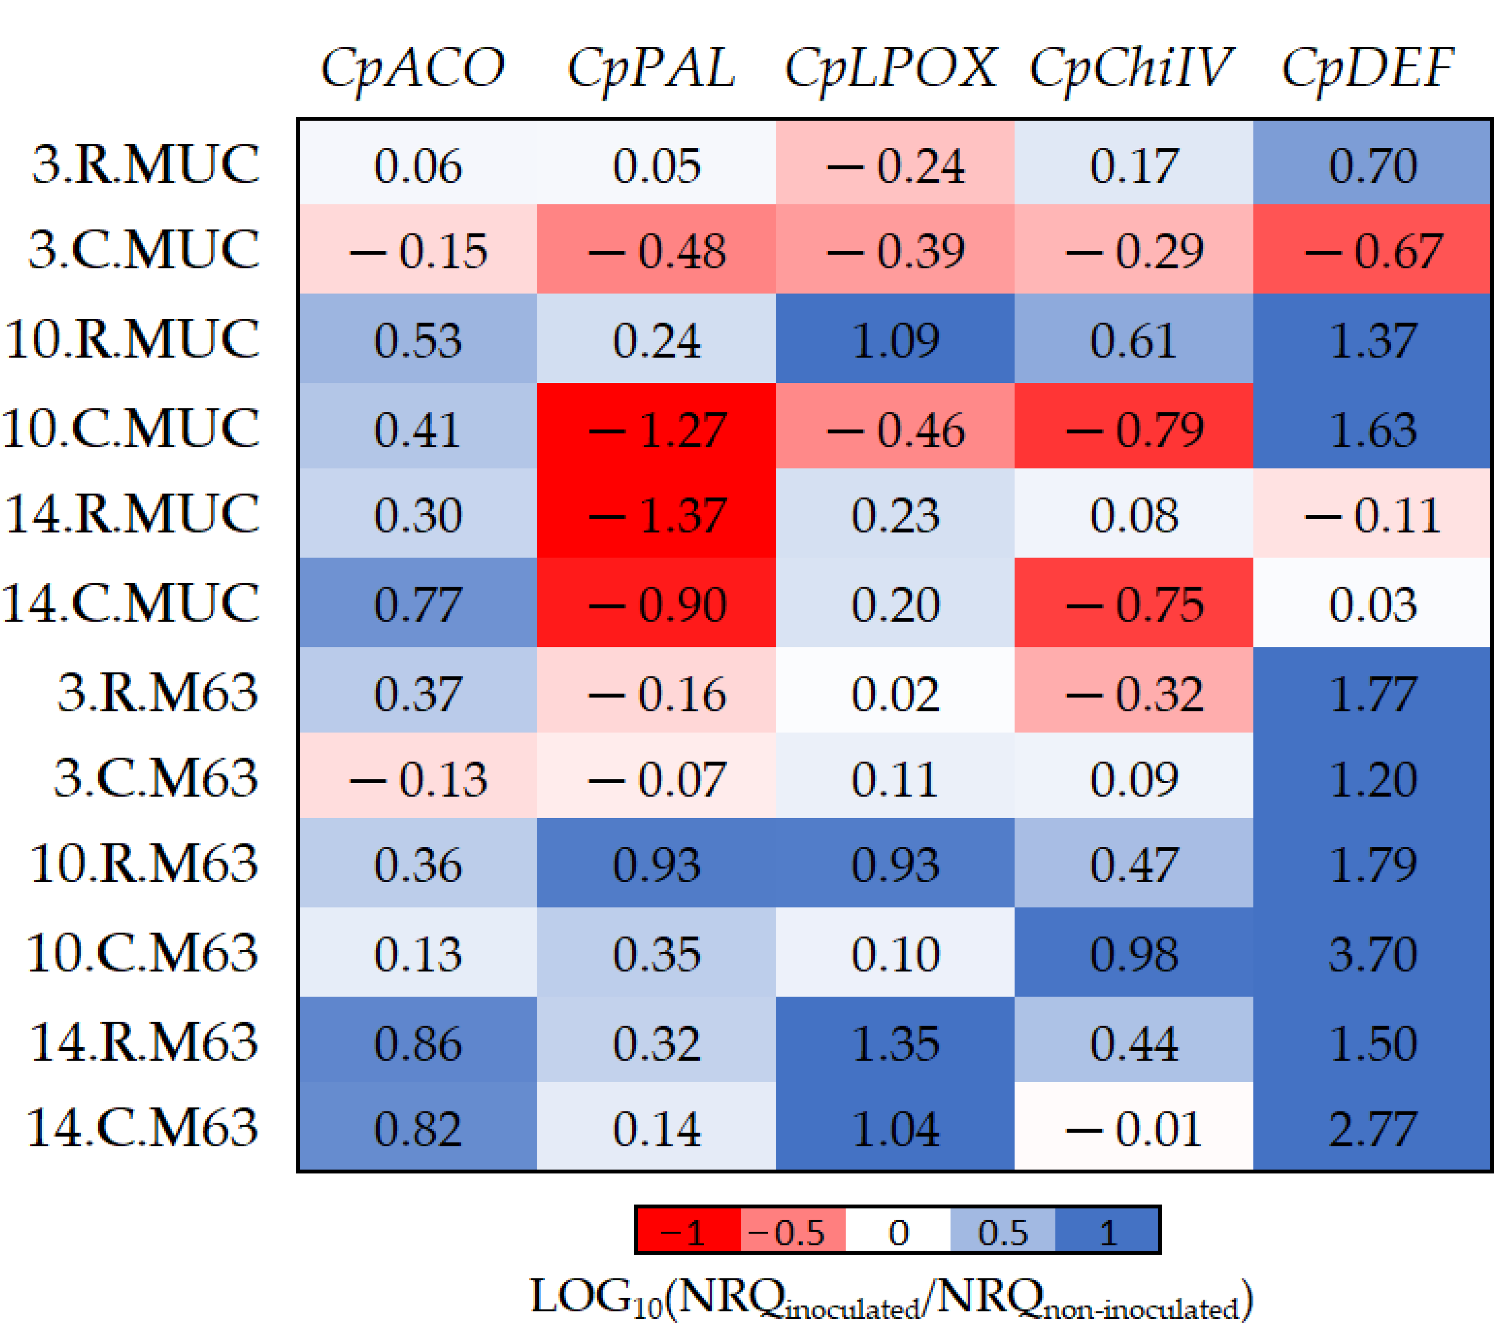
Figure 3.
The log10 fold changes between inoculated and non-inoculated samples. NRQ was transformed with LOG10(NRQinoculated/NRQnon-inoculated). Sample nomenclature: days post-inoculation (3, 10, and 14); root (R) or crown (C); M63 or MUCU-16 (MUC). Each unit represents a 10-fold change in expression of inoculated compared to non-inoculated samples; positive values (blue) mean higher expression in inoculated samples and negative values (red) mean higher expression in non-inoculated samples. CpACO, 1-aminocyclopropane-1-carboxylate oxidase; CpPAL, phenylalanine ammonia-lyase; CpLPOX, lignin-forming peroxidase; CpChiIV, endochitinase EP3; CpDEF, defensin.
While CpDEF was upregulated in inoculated plants (Figure 3, Table 2), the upregulation was significantly higher in M63 (Table 5). The CpPAL gene was significantly more expressed in M63 (especially in crown) due to the downregulation of MUCU-16 after inoculation (Table 5, Figure 3). The lack of CpDEF upregulation on day 14 post-inoculation in both tissues for MUCU-16 (Figure 3) was also remarkable.
Table 5.
Gene expression (Log10(NRQinoculated/NRQnon-inoculated)) pair comparison between MUCU-16 and M63.
To avoid the influence of the inoculation and genotype background on gene expression (Table 2 and Table 4), data were relativized comparing crown versus root tissues (Figure 4). The results in Figure 4 show how the inoculation (CpDEF and CpChiIV) and genotype (CpACO and CpLPOX) affect the tissue expression pattern.
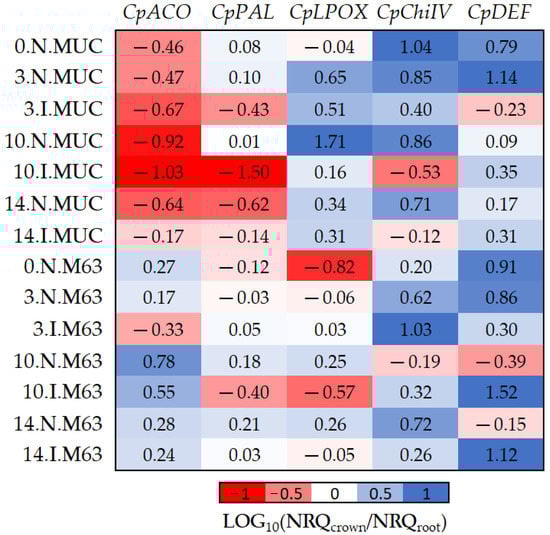
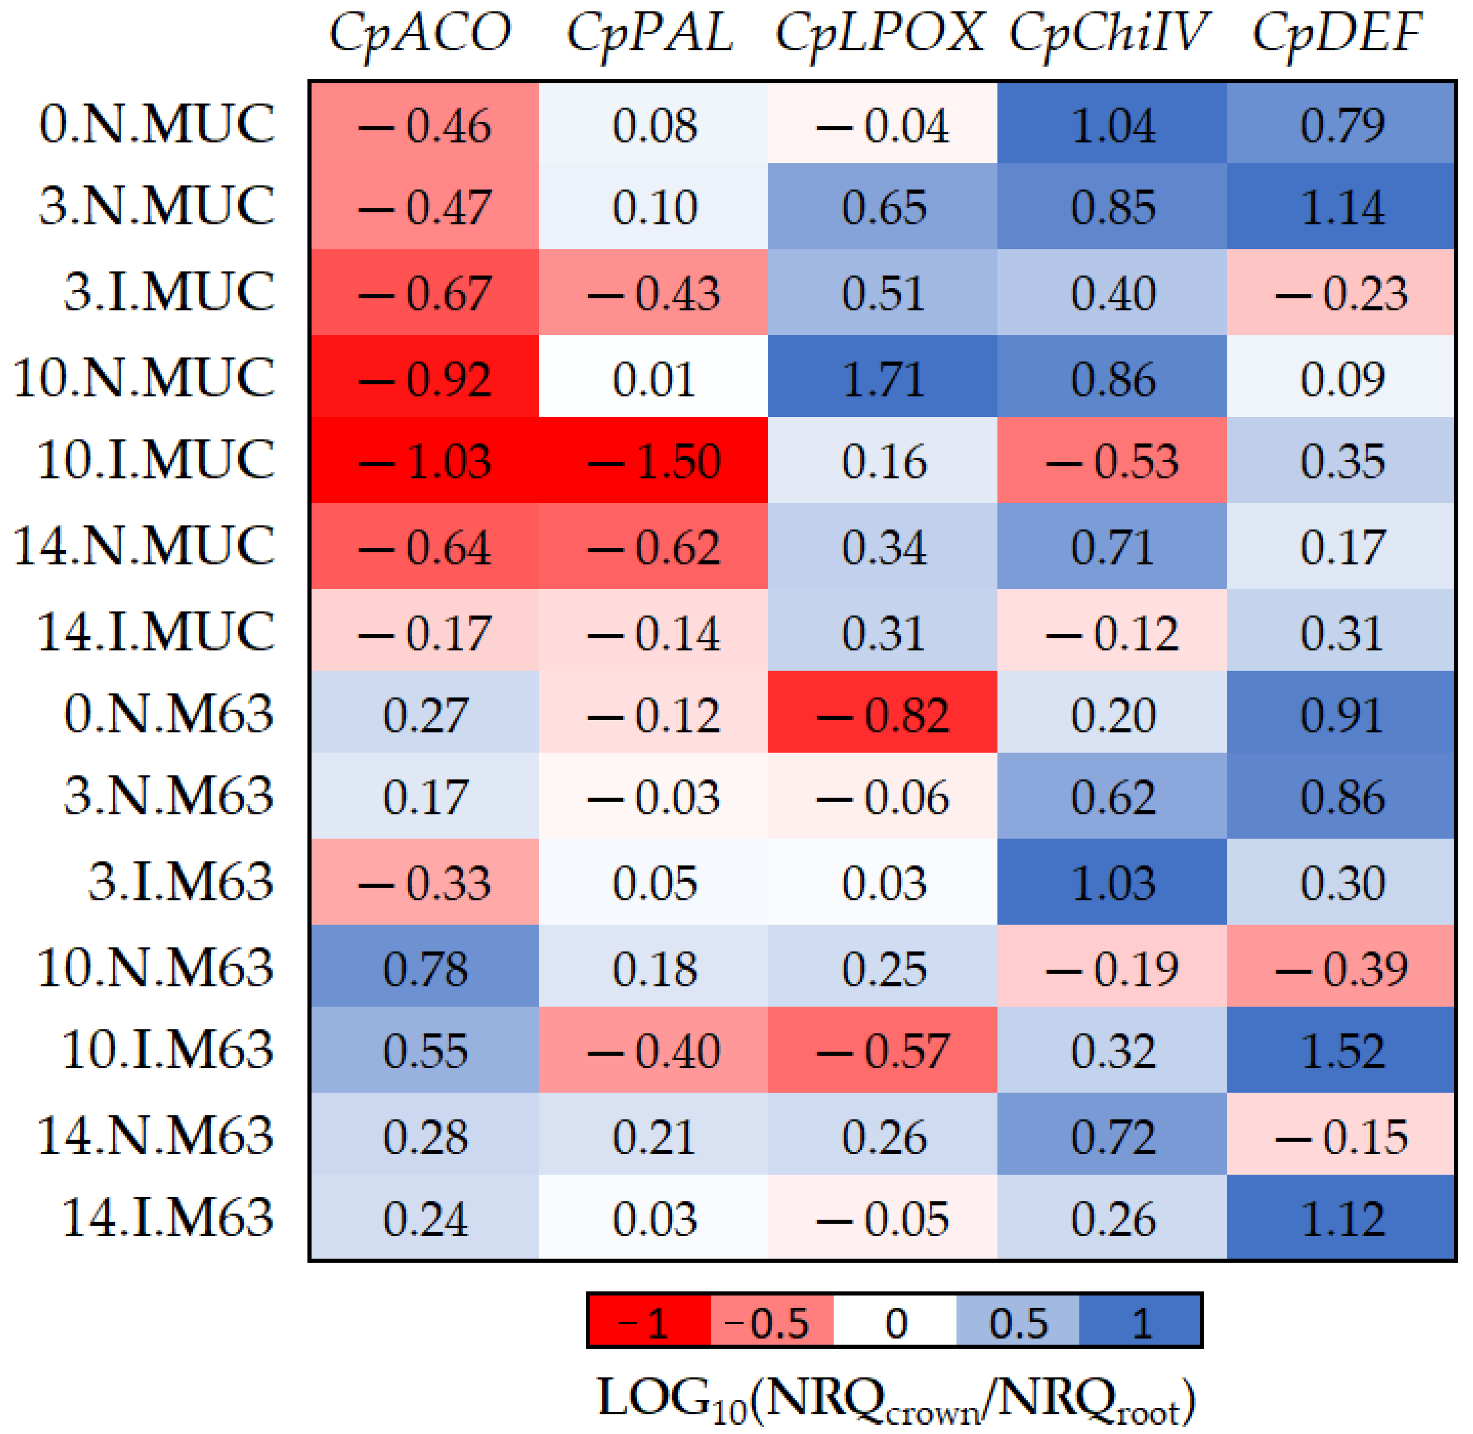
Figure 4.
The log10 fold changes between crown and root samples. NRQ was transformed with LOG10(NRQcrown/NRQroot). Sample nomenclature: days post-inoculation (0, 3, 10, and 14); inoculated (I) or non-inoculated (N); M63 or MUCU-16 (MUC). Each unit represents 10-fold change in expression of crown compared to root samples; positive values (blue) mean higher expression in crown and negative values (red) mean higher expression in roots. CpACO, 1-aminocyclopropane-1-carboxylate oxidase; CpPAL, phenylalanine ammonia-lyase; CpLPOX, lignin-forming peroxidase; CpChiIV, endochitinase EP3; CpDEF, defensin.
The CpDEF gene was upregulated in both the crown and root tissues in inoculated samples (Table 2), but the upregulation was higher in the crown (Figure 4, Table 6) on days 10–14. In addition, it was only in MUCU-16 that the CpChiIV gene significantly changed its tissue expression and was less expressed in crown than in root in inoculated samples (Figure 4, Table 6). These tissue expression changes due to inoculation were significant on days 10–14 (Figure 4, Table 6), because higher expression changes due to inoculation were presented on these days over that of day 3 (Table 2).
Table 6.
Gene expression (log10(NRQcrown/NRQroot)) pair comparison between inoculated and non-inoculated samples.
Furthermore, significant differences in CpACO and CpLPOX tissue expression patterns were also observed between genotypes (Figure 4). Pooling inoculated and non-inoculated samples, MUCU-16 CpACO (p < 0.001, n = 12) and CpLPOX (p = 0.035, n = 12) were more associated with root and crown, respectively, compared to M63 (Figure 4).
2.4. Differentially Expressed Genes between Tolerant and Susceptible Genotypes
To avoid the influence of the inoculation and tissue background on gene expression (Table 2 and Table 3), data were relativized comparing M63 versus MUCU-16 genotypes (Figure 5). The results in Figure 5 show how the inoculation (CpDEF, CpPAL, CpChiIV) and tissue (CpACO and CpLPOX) affect the genotype differential expression.
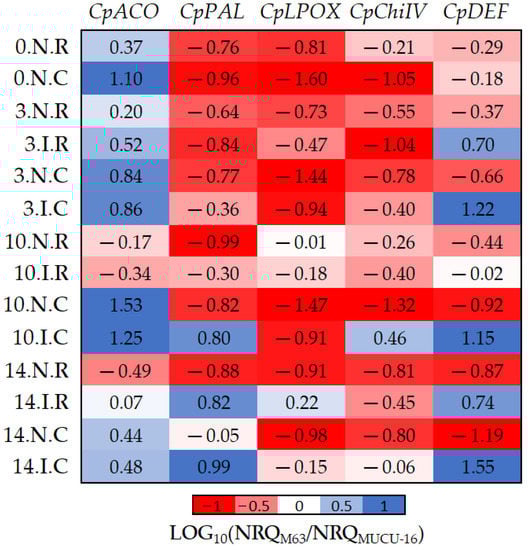
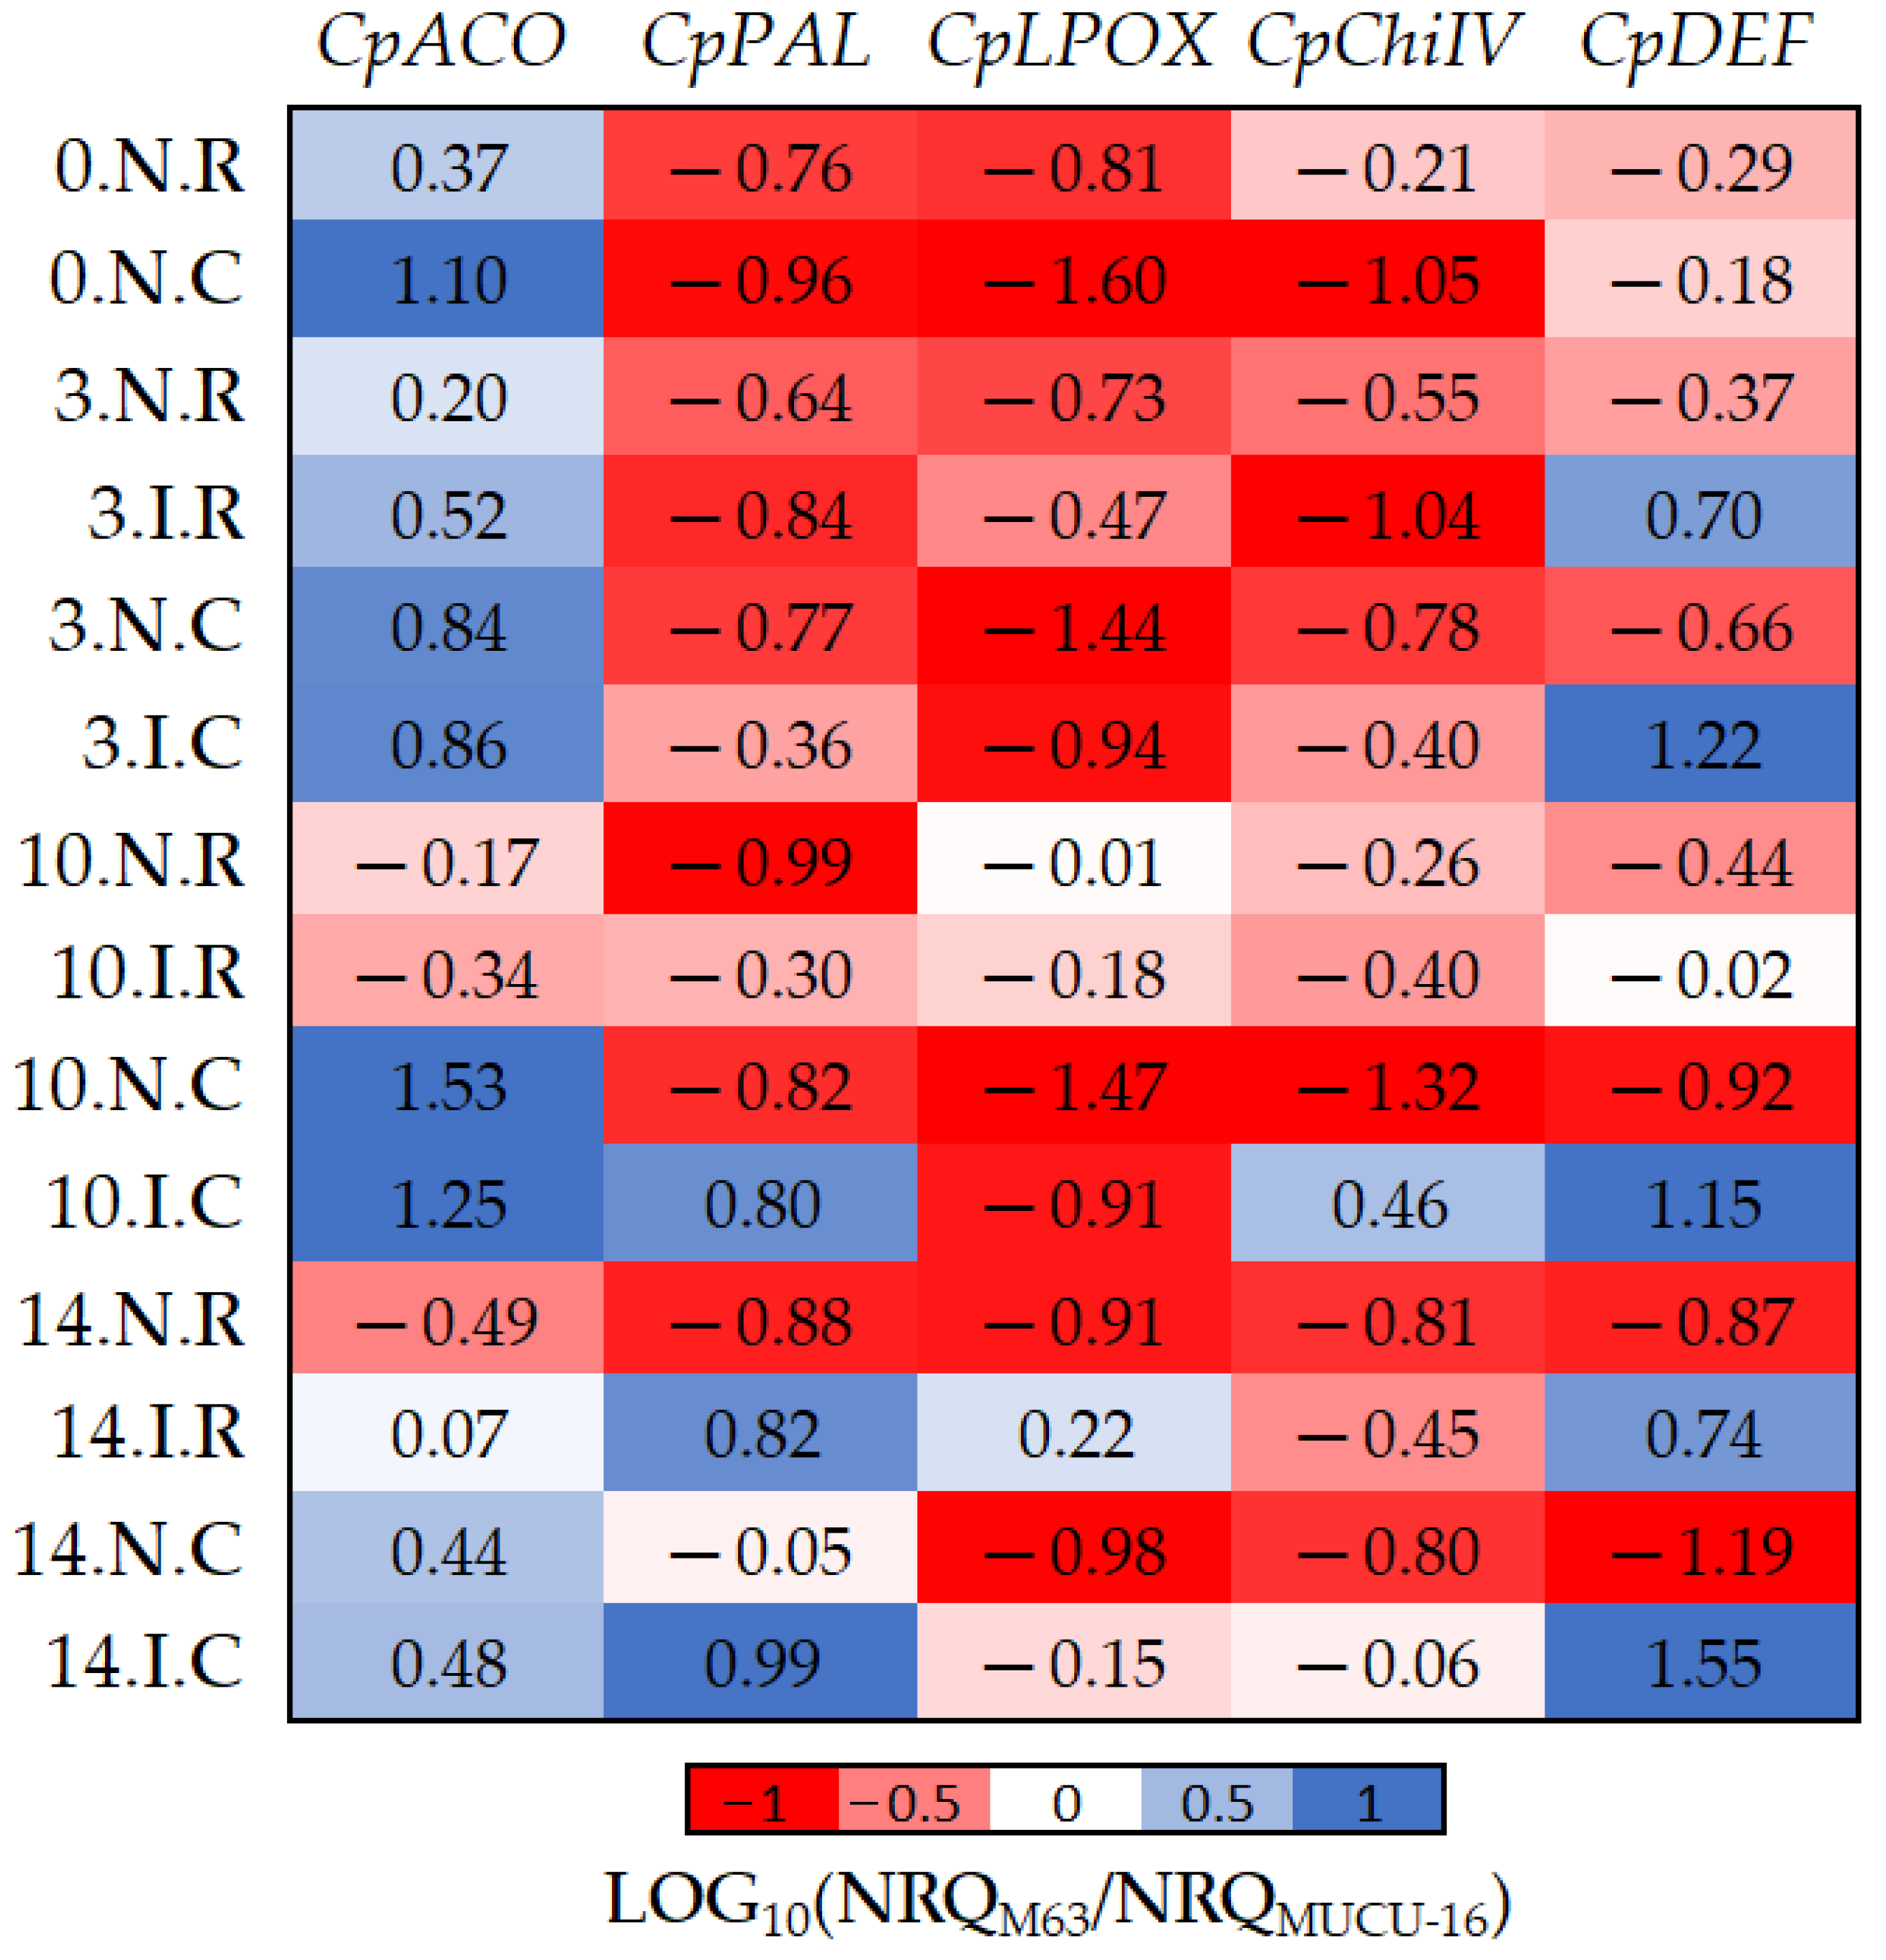
Figure 5.
The log10 fold changes between M63 and MUCU-16 samples. NRQ was transformed with LOG10(NRQM63/NRQMUCU-16). Sample nomenclature: days post-inoculation (0, 3, 10, and 14); inoculated (I) or non-inoculated (N); root (R) or crown (C). Each unit represents 10-fold change in expression of the M63 compared to MUCU-16 samples; positive values (blue) mean higher expression in M63 and negative values (red) mean higher expression in MUCU-16. CpACO, 1-aminocyclopropane-1-carboxylate oxidase; CpPAL, phenylalanine ammonia-lyase; CpLPOX, lignin-forming peroxidase; CpChiIV, endochitinase EP3; CpDEF, defensin.
Basal (non-inoculated) expression of all genes was higher in susceptible plants, with the exception of CpACO (Table 4, Figure 5). However, inoculation led to higher expression of CpDEF, CpChiIV, and CpPAL genes in M63. The CpChiIV upregulation was only observed in crown and CpPAL only on days 10–14, but CpDEF was upregulated in all circumstances (Figure 5, Table 7). These differences between inoculated and non-inoculated samples were especially observable between days 10 and 14 (Figure 5).
Table 7.
Gene expression ((Log10(NRQM63/NRQMUCU-16)) pair comparison between inoculated and non-inoculated samples.
Furthermore, significant differences in CpACO (p = 0.002, n = 12) and CpLPOX (p = 0.036, n = 12) expression were also observed between the tissues of each genotype (Figure 5). Pooling inoculated and non-inoculated samples, the differential expression among genotypes for CpACO differed between crown and roots, because it was more expressed in M63 crown. On the other hand, differential expression among genotypes for CpLPOX also differed between tissues, because this gene was more expressed in MUCU-16 crown (Figure 5).
3. Discussion
To our knowledge, this is the first gene expression study of Cucurbita spp. inoculated with Phytophthora capsici. We studied the expression of genes that other authors have described as being involved in plant responses to biotic stress and we compared the two main tissues damaged by the pathogen, root and crown, in two species, Cucurbita pepo subsp. pepo susceptible MUCU-16 and Cucurbita moschata tolerant M63, during disease development for two weeks.
Basal expression (non-inoculated) differences between species (Table 4) can be explained by the qPCR reaction efficiency. However, we cannot discard the influence of plant development differences such as biomass or architecture. Due to the varied nature of the samples, the influences of inoculation, tissue, and species were corrected through data relativization (Figure 3, Figure 4 and Figure 5). This relativization and subsequent logarithmic transformation allowed new and more reliable information to be found among samples.
The study of gene expression to understand how plants and pathogens interact and react molecularly to each other has already been applied to some horticultural crops. Priming of the plant immune system occurs through resistance genes, as in pathogenesis-related proteins CaPBR1, CaPO1, and CaDEF1 for Phytophthora capsici in pepper (Capsicum annuum) [30]. Likewise, changes in transcript levels have also been observed for Fusarium oxysporum f. sp. niveum (FON) during infection of watermelon, whose defensin-like genes ClPDF2.1 and ClPDF2.4, phenylalanine ammonia lyase, chitinase, and ascorbate peroxidase were significantly induced in roots inoculated with FON race 1, while polyphenol oxidase did not show a significant response to FON 1 infection [14].
In plants, ethylene biosynthesis and downstream signaling occur through a conserved pathway that leads to a cascade of transcription factors that regulate ethylene-mediated responses, including various plant defense mechanisms against pathogens [31]. Wang et al. (2015) [12] showed that in pepper roots infected with P. capsici, there was upregulation of genes related to ethylene and jasmonic acid. Similarly, a melon with P. capsici resistance (ZQK9) showed upregulation of the ACO gene, while for susceptible plants (E31) this gene was downregulated in the roots at 3 and 5 DPI [10]. Our results indicate that the main upregulation of CpACO occurred once the disease had developed on days 10–14 (Table 2).
Plant chitinases are known as pathogenesis-related proteins induced in response to attacks by phytopathogens, elicitors, or growth regulators [32]. However, our results did not show an evident relationship between ethylene (CpACO) biosynthesis and chitinase (CpChiIV) expression. The CpChiIV gene encodes a class IV chitinase that targets the chitin of the true fungal cell wall. Phytophthora capsici, as an oomycete, does not possess chitin, although increased expression of a type IV chitinase has been observed in response to P. capsici in leaves of pepper plants [11]. Our results point out that in inoculated samples, the chitinase was more downregulated in the susceptible crown, while its expression was maintained in the tolerant plant (Table 7). It is important to highlight the relevance of the sample used for each analysis, since the study by Liu et al. (2017) [11] used pepper leaf tissue, because CpChiIV was downregulated in the MUCU-16 crown (Table 7), but not in its roots.
The activation of the salicylic acid-dependent pathway leads to the overexpression of genes that encode pathogenesis-related proteins, such as defensins and peroxidases [30]. We have seen that in inoculated samples, the downregulation of CpPAL in susceptible plants was similar to the CpChiIV only in the crown. No other patterns were observed, so their direct relationship was unclear. In P. capsici-inoculated melon roots, the PAL gene was upregulated in a resistant cultivar (ZQK9) and in susceptible plants (E31), although PAL expression was higher in the resistant melon [10]. In our work, CpPAL was downregulated in MUCU-16 during P. capsici infection compared to M63 (Table 5). This observation corresponds with the results of Li et al. (2019) [33], who pointed out that P. capsici suppresses the plant’s defensive response by targeting salicylic acid signaling. Plants that are defective in salicylic acid synthesis/accumulation always exhibit enhanced susceptibility [33,34], and we have seen a connection between susceptibility and downregulation of CpPAL. The situation was different for CpPAL and CpChiIV, since CpChiIV was only downregulated in the MUCU-16 crown in inoculated samples (Table 7), the expression levels were not significantly different from tolerant plants (Table 5), so CpChiIV downregulation did not seem as closely related to susceptibility as CpPAL downregulation.
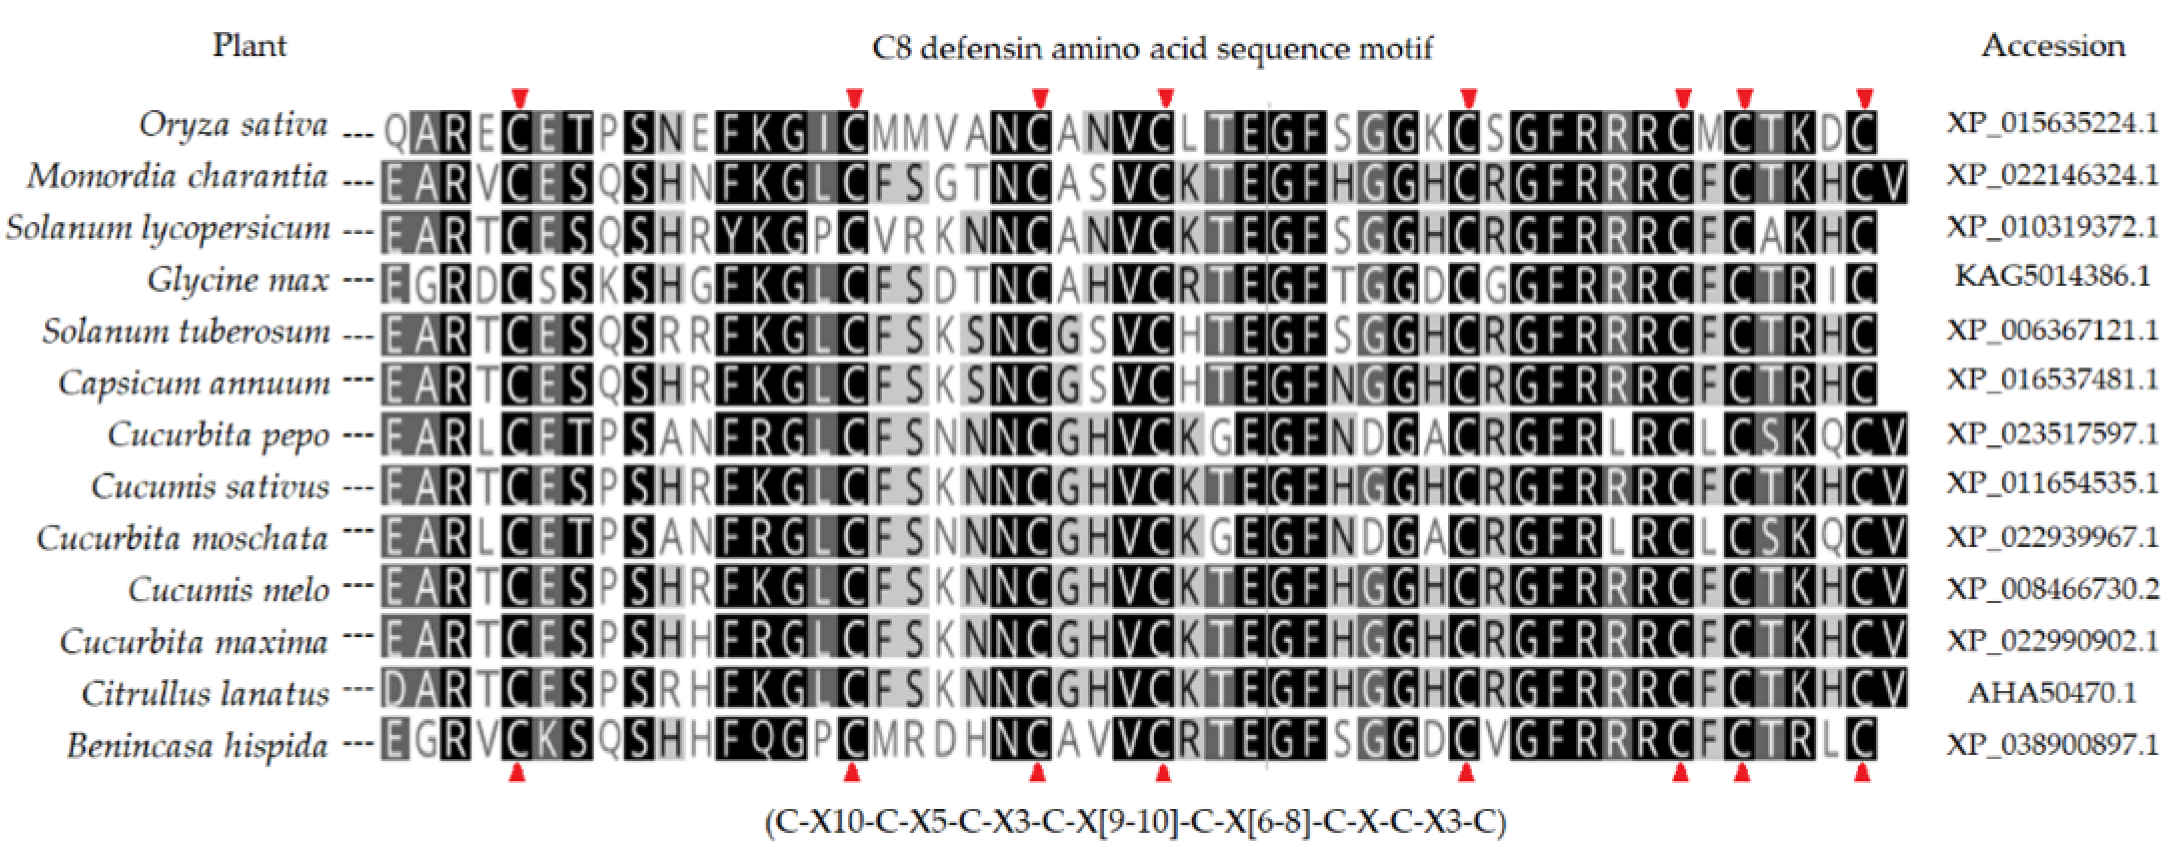
Analogous to our results (Figure 3, Table 5), for defensin-like genes, overexpression in P. capsici-inoculated roots was higher in tolerant melon (ZQK9) than in susceptible melon (E31) [10]. The defensin that was analyzed corresponds to the group with C8 structure [22], which has eight cysteines in a specific position, and whose motif is found across multiple animals, plants, and fungi. This type of defensin is found in several cucurbit plants as well as in other important crop species (Appendix A, Figure A1), and it could be a gene whose overexpression indicates infectious disease stress in all of them. In addition, as other studies [10,14] have also indicated, increased expression could favor disease tolerance, making it a gene of great interest for many cultivable crops.
Lignin accumulation is a general defense mechanism against fungal penetration; higher lignin concentration around the appressoria has been observed in resistant crops [16]. Furthermore, histochemical staining of P. capsici-inoculated roots showed that the epidermal cells of a susceptible melon (E31) were disintegrated, while the cellular structure of the resistant plant (ZQK9) showed no important changes [10]. A gene encoding a type of lignin-forming peroxidase was upregulated in Phytophthora capsici-inoculated samples of Capsicum annuum [12] and in roots of the resistant Cucumis melo (ZQK9) [10]. Both results were similar to ours for the CpLPOX gene, although we have seen that this response can also occur in the crown.
To compare results with other studies, it must be taken into account that a resistant cultivar may not give the same results as a tolerant one (like M63) whose tissues are damaged by the pathogen (Figure 1) and needs to respond to overcome the disease. In addition, it is essential to know the level of infection of the samples at the time of sample collection rather than the day post-infection, so that sample collection will be carried out on the same plant population on which the evolution of the disease is being tested. The results indicate a relationship between the damage observed in the population and the response associated with the infection. The inoculated samples collected on day 3 had slight damage (Table 1), which could explain the minor differences in gene expression between inoculated and non-inoculated samples (Table 2) compared to the following days. Furthermore, it must be taken into account that if a tissue is very damaged, the gene expression response to the pathogen may not be adequate. This could explain the case of susceptible plants on day 14 post-inoculation (Table 1), whose changes in gene expression between inoculated and non-inoculated samples did not show differences in CpDEF in both tissues (Figure 3).
A plant’s defense against pathogens is a process regulated by a complex network of gene families that are also involved in other processes, especially in the case of hormones. The hormonal and enzymatic responses are closely related, as noted in melon challenged by different pathogens, where chitinase and peroxidase activity increased with ethylene and methyl jasmonic gas treatment [35]. Many of them share pathways and functions, such as CpPAL and CpLPOX in lignin formation [36], so elucidating the specific basis of resistance requires a broad study of all agents involved.
4. Materials and Methods
4.1. Materials, Test Conditions, and Inoculation
Two Cucurbita genotypes were used, tolerant Cucurbita moschata (cv. M63, Rijk Zwaan 64-063) [37] and susceptible Cucurbita pepo subsp. pepo (cv. MUCU-16, IFAPA-La Mojonera seed collection). Before transplanting, seeds were disinfected by immersing them in a sodium hypochlorite (35 g L−1 active chloride) solution for 20 min, rinsing with tap water, and incubating at 28 °C in the dark (wrapped in wet filter paper) until the root reached 3–5 cm in length. Only germinated seeds were potted, so it was necessary to arrange sowing and plant development tests beforehand to estimate the date for both species in order to inoculate them simultaneously, because resistance is closely linked to plant development [38]. Both genotypes had germination rates higher than 85% after one week and reached the three true leaves required for inoculation 8–10 days after germination. The substrate used for the experiments was autoclaved (121 °C, 30 min) vermiculite at field capacity with a standard nutrient solution (1.5 dS m−1).
Phytophthora capsici isolate (MI0211) was recovered from infected zucchini in a greenhouse [2] and subsequently inoculated on Cucurbita pepo and obtained again from dead plant roots. P. capsici was inoculated by irrigation through a 50 mL suspension containing 2.4 × 10⁴ CFU mL−1 propagules at 2 cm depth next to the plant’s basal stem, when the plants reached the development of 2–3 true leaves. This solution was obtained by grinding several colonies fully covering the dish surface (10 days) of the isolate previously grown in PDA in nutrient solution. The rate was one plate per 400 mL of final suspension. The inoculum consisted mainly of mycelia, and the concentration was calculated a posteriori using the PDA dilution plate method [39]. The controls were plants not inoculated but watered with a homogenized blend of non-colonized PDA and nutrient solution. Fertigation with nutrient solution was applied until the end of the test according to the plant’s needs, in an effort to maintain the substrate close to saturation [2]. Tests were performed in a growth chamber with a 14 h photoperiod (>12,000 lux) at 20–33 °C (20–30 °C inside the pot) and 45–75% relative humidity. Temperature and humidity were measured using a HOBO data logger (Onset Computer Co., Bourne, MA, USA).
Plants were distributed randomly in the chamber in 16 trays, each one containing two 1 L pots per genotype (2 plants/pot); 8 trays were inoculated and 8 were non-inoculated. A total of 64 plants per genotype, 32 inoculated and 32 non-inoculated, were used. Replicates for the phenotypic analysis (Table 1) were decreased by 8 per day in the qPCR sample collection, and there were always 8 plants for qPCR analysis.
4.2. Sample Collection and qPCR Conditions
Crown and root samples were collected on days 0, 3, 10, and 14 post-inoculation, and the disease evolution was observed by means of a disease severity index (DSI) from 0 to 4: 0 = no symptoms; 1 = leaf decay/crown scar; 2 = soaked or girdling crown; 3 = wilt and chlorosis; 4 = death (Figure 1) [28]. Crown samples were collected from the last 2 cm of the basal stem and root samples contained the roots closest to the stem, including main and secondary roots. Each plant sample was randomly selected from 4 different trays for the same collection time. The entire plant was removed from the pot and immersed in sterile distilled water to remove any remaining vermiculite. Then, both tissues were wrapped in tinfoil, frozen with liquid nitrogen, and preserved at −80 °C until RNA extraction [10].
Samples were homogenized in a mortar with liquid nitrogen and the RNA was extracted using TRIzol reagent (Ambion, Thermo Fisher Scientific, Waltham, MA, USA). Each RNA sample came from 8 different plants, and quality and concentration were checked by electrophoretic gel and NanoDrop2000c (Thermo Scientific, Waltham, MA, USA). DNase I (Invitrogen, Waltham, MA, USA) was applied to remove remaining genomic material, and it was transformed into cDNA using a high-capacity cDNA reverse transcription kit (Applied Biosystems, Waltham, MA, USA). The cDNA obtained was used for qPCR analysis with the PowerUP SYBR green master mix kit (Applied Biosystems, Waltham, MA, USA) in a LightCycler® 96 (Roche Diagnostic, Basel, Switzerland), with three replicates. All enzymes and reagents mentioned were used according to the manufacturer’s instructions.
The primers (Sigma-Aldrich, St. Louis, MO, USA) (Table 8) were designed using Primer3 plus software [40]. Multiple sequence alignment for the primers and both genotypes was done with the EMBL-EBI Clustal omega tool [41] to check that the qPCR would produce the same amplicon in C. pepo subsp. pepo and C. moschata. The expected size of each amplicon was verified by agarose gel electrophoresis (1.5%). For the gene target selection, due to the wide variety of enzymes within each family of the selected pathogenic-related proteins and hormones, we based it on those that presented more homology with other authors’ gene-expression studies in cucurbits and soil-borne pathogenic fungi [10,11,42,43].
Table 8.
Primers and C. pepo and C. moschata targeted transcripts for rt-qPCR analysis.
The qPCR conditions were as follows: 50 °C for 2 min, 95 °C for 10 min, 40 × (95 °C for 15 s, 55 °C for 15 min, 60 °C for 1 s); melting (95 °C for 15 s, 60 °C for 1 min, 95 °C for 1 s). Gene expression was relativized with UFP and EF-1a reference genes [29] following data processing with efficiency correction, multiple reference gene normalization, and the use of error propagation rules [44,45]. Similar melting peak curves for the same gene for the different samples and low reference genes deviations were checked with LightCycler® 96 software v. 1.1 (Roche Diagnostic, Basel, Switzerland).
For statistical analysis, different factors were considered: genotype (levels: M63 and MUCU-16), tissue (levels: crown and root), inoculum (levels: inoculated and non-inoculated), and days post-inoculation (levels: 3, 10, and 14 DPI). Data are expressed as normalized relative quantity (NRQ; Figure 2), and when comparing two factors, the results are shown as 10-fold relative change (log10(NRQa/NRQb); Figure 3, Figure 4 and Figure 5). Comparisons were always made between two levels, pooling the largest possible number of samples from different factors. Data pooling is described in Table 2, Table 3, Table 4, Table 5, Table 6 and Table 7. Data analysis of significant differences (p < 0.05) in NRQ (with different log10 transformations) was carried out by Student’s t-test following homoscedasticity and normal distribution testing. Kruskal–Wallis test was used for the non-parametric DSI test. Statistix v.9.0 (Tallahassee, FL, USA) was used for the analyses.
5. Conclusions
To our knowledge, this is the first gene expression study of crown rot caused by Phytophthora capsici in Cucurbita spp. The results indicate that there were gene expression differences between inoculated and non-inoculated samples, genotypes (C. moschata and C. pepo subsp. pepo), tissues (crown and root), and days post-inoculation.
The data show higher expression changes between inoculated and non-inoculated samples on days 10–14 than on day 3, suggesting a correlation between the DSI observed and plant response. There was overexpression in inoculated samples for CpDEF, CpLPOX, and CpACO genes. Some differentially expressed genes between crown and root were found. CpChiIV was more expressed in crown than in root for both genotypes, while for MUCU-16, CpACO and CpLPOX expression were higher in root and crown, respectively. There was an important disease influence on the tissue pattern expression of CpDEF, since defensin overexpression in inoculated samples was higher in the crown than in the roots. The most overexpressed gene was CpDEF in the tolerant species, which also showed significant differences with respect to the susceptible species, especially in the crown.
These results indicate that CpPAL downregulation could be associated with susceptibility, while the maintenance of CpDEF overexpression could be related to tolerance. In addition, defensin overexpression could be used as a marker of biotic stress, because it was expressed in larger quantities, was upregulated at early disease stages, and is present in many crops.
Author Contributions
Conceptualization, A.A.-D.; methodology, A.A.-D. and M.d.C.-G.; software, A.A.-D.; validation, M.d.C.-G. and P.G.; formal analysis, M.d.C.-G.; investigation, A.A.-D.; resources, M.d.C.-G. and P.G.; data curation, M.d.C.-G. and P.G.; writing—original draft preparation, A.A.-D.; writing—review and editing, M.d.C.-G. and P.G.; visualization, A.A.-D.; supervision, M.d.C.-G. and P.G.; project administration, M.d.C.-G. and P.G.; funding acquisition, M.d.C.-G. and P.G. All authors have read and agreed to the published version of the manuscript.
Funding
This research was funded by the AVANZA Project, Junta de Andalucía, AVA2019. 023. The APC was funded by AVA2019. 023 and CRF2019. 005.
Institutional Review Board Statement
Not applicable.
Informed Consent Statement
Not applicable.
Data Availability Statement
Date is contained within the article
Acknowledgments
Belen Roman, for facilitating the gene expression statistical analysis. A. Ayala-Doñas thanks INIA for economic support through a pre-doctoral grant (FPI-INIA2016 CPD2016-0199).
Conflicts of Interest
The authors declare no conflict of interest.
Appendix A
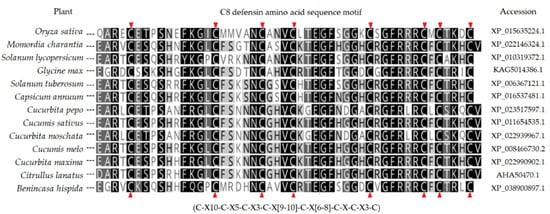
Figure A1.
C8 defensin amino acid sequence in cucurbits and other crops.
Figure A1.
C8 defensin amino acid sequence in cucurbits and other crops.
References
- Babadoost, M. Oomycete Diseases of Cucurbits: History, Significance, and Management. In Horticultural Reviews; Wiley-Blackwell: Hoboken, NJ, USA, 2016; Volume 44, pp. 279–314. [Google Scholar]
- De Cara García, M.; Plaza, M.F.; Vázquez, J.M.G. Pathogenic and Biological Characterization of Phytophthora capsici Isolates from Zucchini and Pepper in Southeast Spain. Span. J. Agric. Res. 2018, 16, 22. [Google Scholar] [CrossRef]
- Sanogo, S.; Ji, P. Integrated Management of Phytophthora capsici on Solanaceous and Cucurbitaceous Crops: Current Status, Gaps in Knowledge and Research Needs. Can. J. Plant Pathol. 2012, 34, 479–492. [Google Scholar] [CrossRef]
- Kabelka, E.; Les Padley, J.; Roberts, P.; Ramos, L.; Martinez, M.; Klassen, W. Resistance to Phytophthora capsici within Winter Squash (Cucurbita moschata) Derived from a Wild Cucurbita Species. HortScience 2007, 42, 1014. [Google Scholar]
- Padley, L.D.; Kabelka, E.A.; Roberts, P.D. Evaluation of Cucurbita Pepo Accessions for Crown Rot Resistance to Isolates of Phytophthora capsici. HortScience 2008, 43, 1996–1999. [Google Scholar] [CrossRef] [Green Version]
- Chavez, D.J.; Kabelka, E.A.; Chaparro, J.X. Screening of Cucurbita moschata Duchesne Germplasm for Crown Rot Resistance to Floridian Isolates of Phytophthora capsici Leonian. HortScience 2011, 46, 536–540. [Google Scholar] [CrossRef] [Green Version]
- Padley, L.D.; Kabelka, E.A.; Roberts, P.D. Inheritance of Resistance to Crown Rot Caused by Phytophthora capsici in Cucurbita. HortScience 2009, 44, 211–213. [Google Scholar] [CrossRef] [Green Version]
- Michael, V.N.; Fu, Y.; Meru, G. Inheritance of Resistance to Phytophthora Crown Rot in Cucurbita pepo. HortScience 2019, 54, 1156–1158. [Google Scholar] [CrossRef] [Green Version]
- Ayala-Doñas, A.; de Cara-García, M.; Talavera-Rubia, M.; Verdejo-Lucas, S. Management of Soil-Borne Fungi and Root-Knot Nematodes in Cucurbits through Breeding for Resistance and Grafting. Agronomy 2020, 10, 1641. [Google Scholar] [CrossRef]
- Wang, P.; Wu, H.; Zhao, G.; He, Y.; Kong, W.; Zhang, J.; Liu, S.; Liu, M.; Hu, K.; Liu, L.; et al. Transcriptome Analysis Clarified Genes Involved in Resistance to Phytophthora capsici in Melon. PLoS ONE 2020, 15, e0227284. [Google Scholar] [CrossRef] [PubMed]
- Liu, Z.; Shi, L.; Yang, S.; Lin, Y.; Weng, Y.; Li, X.; Hussain, A.; Noman, A.; He, S. Functional and Promoter Analysis of ChiIV3, a Chitinase of Pepper Plant, in Response to Phytophthora capsici Infection. Int. J. Mol. Sci. 2017, 17, 1661. [Google Scholar] [CrossRef] [Green Version]
- Wang, P.; Liu, X.; Guo, J.; Liu, C.; Fu, N.; Shen, H. Identification and Expression Analysis of Candidate Genes Associated with Defense Responses to Phytophthora capsici in Pepper Line “PI 201234”. Int. J. Mol. Sci. 2015, 16, 11417–11438. [Google Scholar] [CrossRef] [Green Version]
- Mahdy, A.; Abd-El-Mageed, M.; Abd-El-Latif, F.; Diab, M.; Saied, N. Induction of Resistance in Watermelon Plants against Fusarium Wilt Using Chemical Inducers and Compost under Greenhouse Conditions. Egypt. J. Phytopathol. 2015, 42, 1–19. [Google Scholar] [CrossRef]
- Zhang, M.; Xu, J.H.; Liu, G.; Yao, X.F.; Li, P.F.; Yang, X.P. Characterization of the Watermelon Seedling Infection Process by Fusarium oxysporum f. Sp. niveum. Plant Pathol. 2015, 64, 1076–1084. [Google Scholar] [CrossRef]
- Zvirin, T.; Herman, R.; Brotman, Y.; Denisov, Y.; Belausov, E.; Freeman, S.; Perl-Treves, R. Differential Colonization and Defence Responses of Resistant and Susceptible Melon Lines Infected by Fusarium oxysporum Race 1·2: Response of Melon to Fusarium oxysporum Race 1·2. Plant Pathol. 2010, 59, 576–585. [Google Scholar] [CrossRef]
- Hammerschmidt, R.; Bonnen, A.M.; Bergstrom, G.C.; Baker, K.K. Association of Epidermal Lignification with Nonhost Resistance of Cucurbits to Fungi. Can. J. Bot. 1985, 63, 2393–2398. [Google Scholar] [CrossRef]
- Chen, M.; Wang, G.; Wu, D.; Cheng, Y. Histopathological Differences between Cucumber Cultivars with Different Resistances to Fusarium Wilt. J. South China Agric. Univ. 2003, 24, 110–112. [Google Scholar]
- Alfaro-Fernández, A.; García-Luis, A. Colonisation and Histological Changes in Muskmelon and Autumn Squash Tissues Infected by Acremonium cucurbitacearum or Monosporascus cannonballus. Eur. J. Plant Pathol. 2009, 125, 73–85. [Google Scholar] [CrossRef]
- Ongena, M.; Daayf, F.; Jacques, P.; Thonart, P.; Benhamou, N.; Paulitz, T.C.; Belanger, R.R. Systemic Induction of Phytoalexins in Cucumber in Response to Treatments with Fluorescent Pseudomonads. Plant Pathol. 2000, 49, 523–530. [Google Scholar] [CrossRef]
- Punja, Z.K.; Zhang, Y.-Y. Plant Chitinases and Their Roles in Resistance to Fungal Diseases. J. Nematol. 1993, 25, 526–540. [Google Scholar] [PubMed]
- Bhuiyan, N.H.; Selvaraj, G.; Wei, Y.; King, J. Role of Lignification in Plant Defense. Plant Signal. Behav. 2009, 4, 158–159. [Google Scholar] [CrossRef] [Green Version]
- Shafee, T.M.A.; Lay, F.T.; Hulett, M.D.; Anderson, M.A. The Defensins Consist of Two Independent, Convergent Protein Superfamilies. Mol. Biol. Evol. 2016, 33, 2345–2356. [Google Scholar] [CrossRef] [Green Version]
- van der Weerden, N.L.; Bleackley, M.R.; Anderson, M.A. Properties and Mechanisms of Action of Naturally Occurring Antifungal Peptides. Cell. Mol. Life Sci. 2013, 70, 3545–3570. [Google Scholar] [CrossRef]
- Stotz, H.U.; Thomson, J.; Wang, Y. Plant Defensins: Defense, Development and Application. Plant Signal. Behav. 2009, 4, 1010–1012. [Google Scholar] [CrossRef] [PubMed] [Green Version]
- Di, X.; Takken, F.L.W.; Tintor, N. How Phytohormones Shape Interactions between Plants and the Soil-Borne Fungus Fusarium oxysporum. Front. Plant Sci. 2016, 7, 170. [Google Scholar] [CrossRef] [PubMed] [Green Version]
- Chen, Z.; Zheng, Z.; Huang, J.; Lai, Z.; Fan, B. Biosynthesis of Salicylic Acid in Plants. Plant Signal. Behav. 2009, 4, 493–496. [Google Scholar] [CrossRef]
- Houben, M.; van de Poel, B. 1-Aminocyclopropane-1-Carboxylic Acid Oxidase (ACO): The Enzyme That Makes the Plant Hormone Ethylene. Front. Plant Sci. 2019, 10, 695. [Google Scholar] [CrossRef] [Green Version]
- Krasnow, C.S.; Naegele, R.P.; Hausbeck, M.K. Evaluation of Fruit Rot Resistance in Cucurbita Germplasm Resistant to Phytophthora capsici Crown Rot. HortScience 2014, 49, 285–288. [Google Scholar] [CrossRef] [Green Version]
- Obrero, Á.; Die, J.V.; Román, B.; Gómez, P.; Nadal, S.; González-Verdejo, C.I. Selection of Reference Genes for Gene Expression Studies in Zucchini (Cucurbita pepo) Using QPCR. J. Agric. Food Chem. 2011, 59, 5402–5411. [Google Scholar] [CrossRef] [Green Version]
- Bellini, A.; Pugliese, M.; Guarnaccia, V.; Meloni, G.R.; Gullino, L.M. Calcium Oxide, Potassium Phosphite and a Trichoderma Enriched Compost Water Suspension Protect Capsicum annuum against Phytophthora capsici by Priming the Immune System. Pest. Manag. Sci. 2021, 77, 3484–3490. [Google Scholar] [CrossRef] [PubMed]
- Broekaert, W.F.; Delauré, S.L.; de Bolle, M.F.C.; Cammue, B.P.A. The Role of Ethylene in Host-Pathogen Interactions. Annu. Rev. Phytopathol. 2006, 44, 393–416. [Google Scholar] [CrossRef] [PubMed]
- Kasprzewska, A. Plant Chitinases—Regulation and Function. Cell. Mol. Biol. Lett. 2003, 8, 809–824. [Google Scholar]
- Li, Q.; Chen, Y.; Wang, J.; Zou, F.; Jia, Y.; Shen, D.; Zhang, Q.; Jing, M.; Dou, D.; Zhang, M. A Phytophthora capsici Virulence Effector Associates with NPR1 and Suppresses Plant Immune Responses. Phytopathol. Res. 2019, 1, 6. [Google Scholar] [CrossRef] [Green Version]
- Wildermuth, M.C.; Dewdney, J.; Wu, G.; Ausubel, F.M. Isochorismate Synthase Is Required to Synthesize Salicylic Acid for Plant Defence. Nature 2001, 414, 562–565. [Google Scholar] [CrossRef]
- Buzi, A.; Chilosi, G.; Magro, P. Induction of Resistance in Melon Seedlings against Soil-Borne Fungal Pathogens by Gaseous Treatments with Methyl Jasmonate and Ethylene. J. Phytopathol. 2004, 152, 491–497. [Google Scholar] [CrossRef]
- Frei, M. Lignin: Characterization of a Multifaceted Crop Component. Sci. World J. 2013, 2013, 436517. [Google Scholar] [CrossRef] [Green Version]
- Ayala-Doñas, A.; Fernandez-Plaza, M.; de Cara, M. Evaluación de La Tolerancia a Fusarium solani f. Sp. Cucurbita. In Libro de Actas del II Congreso de Jóvenes Investigadores en Ciencias Agroalimentarias; Almería University: Almería, Spain, 2019. [Google Scholar]
- Meyer, M.D.; Hausbeck, M.K. Age-Related Resistance to Phytophthora Fruit Rot in ‘Dickenson Field’ Processing Pumpkin and ‘Golden Delicious’ Winter Squash Fruit. Plant Disease 2013, 97, 446–552. [Google Scholar] [CrossRef] [Green Version]
- Tello, J.C.; Varés, F.; Lacasa, A. Manual de Laboratorio. Diagnóstico de Hongos, Bacterias y Nematodos Fitopatógenos; Ministerio de Agricultura y Pesca: Madrid, Spain, 1991.
- Untergasser, A.; Cutcutache, I.; Koressaar, T.; Ye, J.; Faircloth, B.C.; Remm, M.; Rozen, S.G. Primer3—New Capabilities and Interfaces. Nucleic Acids Res. 2012, 40, e115. [Google Scholar] [CrossRef] [Green Version]
- Madeira, F.; Park, Y.M.; Lee, J.; Buso, N.; Gur, T.; Madhusoodanan, N.; Basutkar, P.; Tivey, A.R.N.; Potter, S.C.; Finn, R.D.; et al. The EMBL-EBI Search and Sequence Analysis Tools APIs in 2019. Nucleic Acids Res. 2019, 47, W636–W641. [Google Scholar] [CrossRef] [Green Version]
- Derbalah, A.; Elsharkawy, M.M.; Hamza, A.; El-Shaer, A. Resistance Induction in Cucumber and Direct Antifungal Activity of Zirconium Oxide Nanoparticles against Rhizoctonia solani. Pestic. Biochem. Phys. 2019, 157, 230–236. [Google Scholar] [CrossRef]
- Shoresh, M.; Yedidia, I.; Chet, I. Involvement of Jasmonic Acid/Ethylene Signaling Pathway in the Systemic Resistance Induced in Cucumber by Trichoderma asperellum T203. Phytopathology 2005, 95, 76–84. [Google Scholar] [CrossRef] [Green Version]
- Hellemans, J.; Mortier, G.; Paepe, A.D.; Speleman, F.; Vandesompele, J. QBase Relative Quantification Framework and Software for Management and Automated Analysis of Real-Time Quantitative PCR Data. Genome Biol. 2007, 8, R19. [Google Scholar] [CrossRef] [Green Version]
- Pomares-Viciana, T.; Die, J.; Del Río-Celestino, M.; Román, B.; Gómez, P. Auxin Signalling Regulation during Induced and Parthenocarpic Fruit Set in Zucchini. Mol. Breed. 2017, 37, 56. [Google Scholar] [CrossRef]

Publisher’s Note: MDPI stays neutral with regard to jurisdictional claims in published maps and institutional affiliations. |
© 2021 by the authors. Licensee MDPI, Basel, Switzerland. This article is an open access article distributed under the terms and conditions of the Creative Commons Attribution (CC BY) license (https://creativecommons.org/licenses/by/4.0/).