1. Introduction
With the consequences of global warming and the rapidly increasing world population, there is a growing need for increasing and securing crop yields [
1,
2]. Soil salinity, however, is one of the most common environmental threats affecting agricultural productivity [
1,
3,
4,
5]. Salinity causes growth reductions and yield losses in most of the crops worldwide especially in arid and semi-arid areas [
6,
7,
8,
9]. Salinity inhibits plant growth due to both the osmotic stress caused by the existence of salts in the soil solution and by the ionic-specific effects caused by the accumulation of salts in the transpiring leaves [
7,
10,
11,
12]. Reactive oxygen species (ROS) generation is a common consequence of salt stress. Salt stress may induce closure of stomata which results in a lowering of the intracellular CO
2 concentration in leaves, impeding carbon fixation, resulting in excessive excitation energy in the chloroplasts [
1,
7,
13,
14].
ROS are highly active by-products that have an essential signaling role in plants [
15,
16,
17]. Low levels of ROS act in signaling the adaptation responses to biotic and abiotic stresses, and for regulating plant growth and development, whereas elevated amounts of ROS are toxic and cause oxidative stress [
6,
18,
19]. A maintained balance between ROS production and scavenging is important for sustained cellular and plant functions [
6,
15,
19,
20]. The antioxidant defense system has a pivotal role in controlling the ROS production–scavenging balance and in protecting plants from damage caused by the oxidative stress [
15,
18,
20]. Enzymatic components of the antioxidant system include ascorbate peroxidase (APX), peroxiredoxin (PRX), dehydroascorbate reductase (DHAR), glutathione-S- transferase (GST), glutathione reductase (GR), superoxide dismutase (SOD), catalase (CAT), and guaiacol peroxidase (GPX). The non-enzymatic components include reduced glutathione (GSH), ascorbate (AsA), proline (Pro), and others such as α-tocopherol, flavonoids, phenolics, and carotenoids [
15,
18,
19,
20,
21].
AsA is a powerful antioxidant and is the most prevalent one in almost all plant tissues, especially in leaves (almost 5−10 times higher than glutathione) [
19,
22]. It has several functions as an antioxidant and as an enzyme cofactor in plants [
22,
23]. It functions as a cofactor for the biosynthesis of some plant phytohormones and their transduction pathways [
24]. It has a key role in the regulation of cell division, elongation, and consequently growth and development [
22,
25,
26,
27]. It may influence the expression of many defense genes and the genes responsible for plant growth [
24,
28,
29,
30].
GSH is a main non-enzymatic antioxidant that has a small intracellular thiol group in plant tissues [
31]. This thiol group makes GSH suitable for many biochemical processes such as sulfur metabolism and storage, transport and alterations of various hormones, and regulation of enzyme activities [
32]. It also moderates processes such as gene expression, synthesis of proteins, cell proliferation, cell growth, development, and senescence [
15,
21,
33]. It reversibly shifts between its reduced (GSH) and oxidized forms (GSSG) because of the cysteine sulfur group in redox reactions. It is a member of the AsA–GSH cycle for the ascorbate generation and consequently has a role in the defense system of plants. GSH protects the proteins from the oxidative denaturation under the stressful environmental conditions [
23,
26,
34,
35,
36]. Interestingly, GSH functions in chelating toxic metals to be sequestered in the vacuoles [
32,
37,
38].
Osmotic adjustment of the cells is the first adaptive response to water and salt stresses [
39,
40,
41,
42]. Accumulation of compatible solutes in the cytosol is one of the tolerance mechanisms to salinity stress [
43,
44,
45,
46]. Proline (Pro) is a low-molecular-weight amino acid and is one of the compatible and non-toxic osmolytes that acts in the osmotic regulation between the cytosol and the vacuoles [
44,
47]. Different plant species have different accumulation levels of proline in plants and it can be 100 times higher in some stressful conditions compared to the control conditions [
48]. Pro is an important antioxidant that acts as a free radical scavenger in plants too. Pro accumulation helps in the balance of the cellular redox status, protects proteins and membrane structures, and serves as a molecular chaperone [
41,
48].
Faba bean (
Vicia faba L.) is a very nutritious grain legume that provides 20–36% of protein supply in human and animal diet [
49]. Legumes can be sustainable as they can fix nitrogen through their nodules, facilitating their growth in poor-nitrogen soils, and can be used in saline-affected lands to help improve soil fertility. However, salinity can affect legume growth, nodulation, rhizobium symbiosis, and nitrogen fixation [
50]. Legumes are classified as sensitive (or only moderately tolerant) to salt stress [
51]. Faba bean is categorized as moderately sensitive to salinity [
52]. In Egypt, no faba bean cultivars were released as salt-tolerant for cultivation [
53]. Selection for salt tolerance in faba bean has been limited because of the lack of reliable and precise measures for salt tolerance criteria [
53]. It is anticipated that soil salinity problems will exacerbate because of the wrong agricultural practices [
54] along with global climate change [
1,
55]. Consequently, in addition to amending saline soils, efforts should be made to increase plants’ tolerance to salinity [
1]. Antioxidant applications were proved to have a positive influence on a plant’s tolerance to abiotic stresses [
56,
57,
58,
59,
60].
To our knowledge, there is a noted shortage of data about the influence of AsA, Pro, and GSH including its prospective role in ameliorating salinity stress in strategic crops under large-scale field experiments. Therefore, the aim of the present research is to examine the effects of these antioxidants, at field scale, on salinity tolerance of faba bean plants. The study also aims at comparing the effects of using sequential (AsA-Pro-GSH or GSH-Pro-AsA) vs. singular (AsA, Pro, or GSH) antioxidant foliar application.
2. Materials and Methods
2.1. Plant Materials, Growth Conditions, and Treatments
Two-season field experiments were conducted consecutively in 2016/17 and 2017/18 at the Experimental Farm of the Faculty of Agriculture, Fayoum University, Southeast Fayoum Governorate (29° 17′ N; 30° 53′ E), Egypt. Healthy seeds of Vicia faba L. (CV. Sakha-1; a commercial variety, Sakha Agricultural Research Station, Agricultural Research Centre, Egypt) were sown on 15 and 20 October 2016 and 2017, respectively. Seeds were obtained from Agricultural Research Centre, Giza, Egypt. Healthy, uniform seeds of similar size and color were selected. They were washed with distilled water followed by sterilization in 1% (v/v) sodium hypochlorite for about 2 min. Seeds were then washed thoroughly again with distilled water and left overnight to air-dry at room temperature.
At the recommended planting density of 120 kg ha−1, faba bean seeds were sown in 3.0 m × 3.5 m plots, in hills spaced 20–25 cm apart and the rows were spaced 70 cm apart, with a total of 240 plant plot−1. Thinning was done before the first irrigation to leave only two plants per hill. According to the recommendations of the Egyptian Ministry of Agriculture and Land Reclamation, soil was supplemented with a complete dose of NPK fertilizer throughout soil preparation and plant growth period. Throughout seed-bed preparation, plants were fertilized with 450 kg ha−1 of calcium superphosphate (15.5% P2O5), 250 kg ha−1 of ammonium sulfate (20.5% N), and 120 kg ha−1 of potassium sulfate (48% K2O). All 100% of the reference crop evapotranspiration (ETo) values from the Fayoum Meteorology Station were used for the calculations of the added irrigation water. In each growing season, plants received seven irrigations through a furrow irrigation system with total water rates of approximately 2800 m3 ha−1. Agricultural practices were as recommended by the Egyptian Ministry of Agriculture and Land Reclamation.
The experimental site was the same for both seasons. The methods of [
61,
62] were carried out for soil analyses and the analysis data are presented in
Table 1. Based on its EC values, the soil is classified as strongly saline according to [
63]. The treatments of the experiments were arranged in a randomized complete block design. At the 20
th day, around 8–9 a.m., after sowing (DAS), seedlings in each plot were sprayed to the point of run-off with singular or sequential antioxidant treatments, i.e., tap water as a control, 0.5 mM AsA, 0.5 mM Pro, and 0.5 mM GSH with three replicate plots
−1. Each plot had six treatments (control, AsA, Pro, GSH, AsA-Pro-GSH, and GSH-Pro-AsA). Sprays were repeated at 30 and 40 DAS with 10-day intervals.
2.2. Measurements of Plant Growth, Yield, and Yield Attributes
Fifty days after sowing (DAS)-9 plants were randomly selected from each experimental plot followed by removal of all adhering soil particles by gently shaking the plants before the length of their shoots was measured. Numbers of leaves and branch number plant
−1 were then counted. The fresh weight of the shoots was recorded, and then they were placed in an oven at 80 °C for 24 h to determine their dry weights afterwards. Leaf areas were measured using leaf area—leaf weight relationship as demonstrated by [
64]. Green pods of 10 plants from each experimental plot were harvested repeatedly and number of pods per plant were counted and weighed to calculate the total number of green pods and pods weight per plant and per hectare. At harvest time (15 April 2017 and 20 April 2018), all dry pods were collected and counted before seeds were extracted for weight measurement including 100-seed weight and seed yield per plant. The seed yield per hectare was calculated.
2.3. Measurements of Photosynthetic Efficiency and Stomatal Conductance
Measurements of chlorophyll content were conducted with the use of a chlorophyll meter (SPAD-502, Minolta, Japan) on the top third and fourth leaves of 3 plants/experimental plot/ treatment (
n = 9). Chlorophyll fluorescence was measured in the first fully expanded dark adapted (for at least 20 min) leaf in two sunny days using a portable fluorometer (Handy PEA, Hansatech Instruments Ltd, Kings Lynn, UK). The maximum quantum yield of PS II Fv/Fm was calculated as =(Fm − Fo)/Fm [
65]. Performance index of photosynthesis based on the equal absorption (PI
ABS) was calculated as reported by [
66]. Stomatal conductance (gs; mmol m
−2 S
−1) was measured thrice at 8:00 h, 10:00 h, and noon using a leaf porometer (Decagon Devices Inc., Pullman, WA, USA).
2.4. Membrane Stability Index and Relative Water Content Measurements
Membrane stability indices (MSI) were estimated from 9 samples for each treatment according to [
67]. Leaf relative water content (RWC) was measured according to [
68]. After excluding the midrib of leaves, fresh mass (FM), turgid mass (TM), and dry mass (DM) of 2 cm leaf discs were recorded. Leaf RWC was calculated according to the following formula:
Leaf RWC (%) = [(FM − DM) ÷ (TM − DM)] × 100 [
68].
For the MSI measurement, 0.2 g leaf sample was placed in a test-tube containing 10 mL of distilled water. Tubes were then heated at 40 °C in a water bath for half an hour, and the electrical conductivity (C1) of the solution was recorded using a conductivity bridge. A second sample was boiled at 100 °C for 10 min, and the conductivity was measured (C2). The MSI was calculated using the formula:
MSI (%) = [1 − (C1/C2)] × 100.
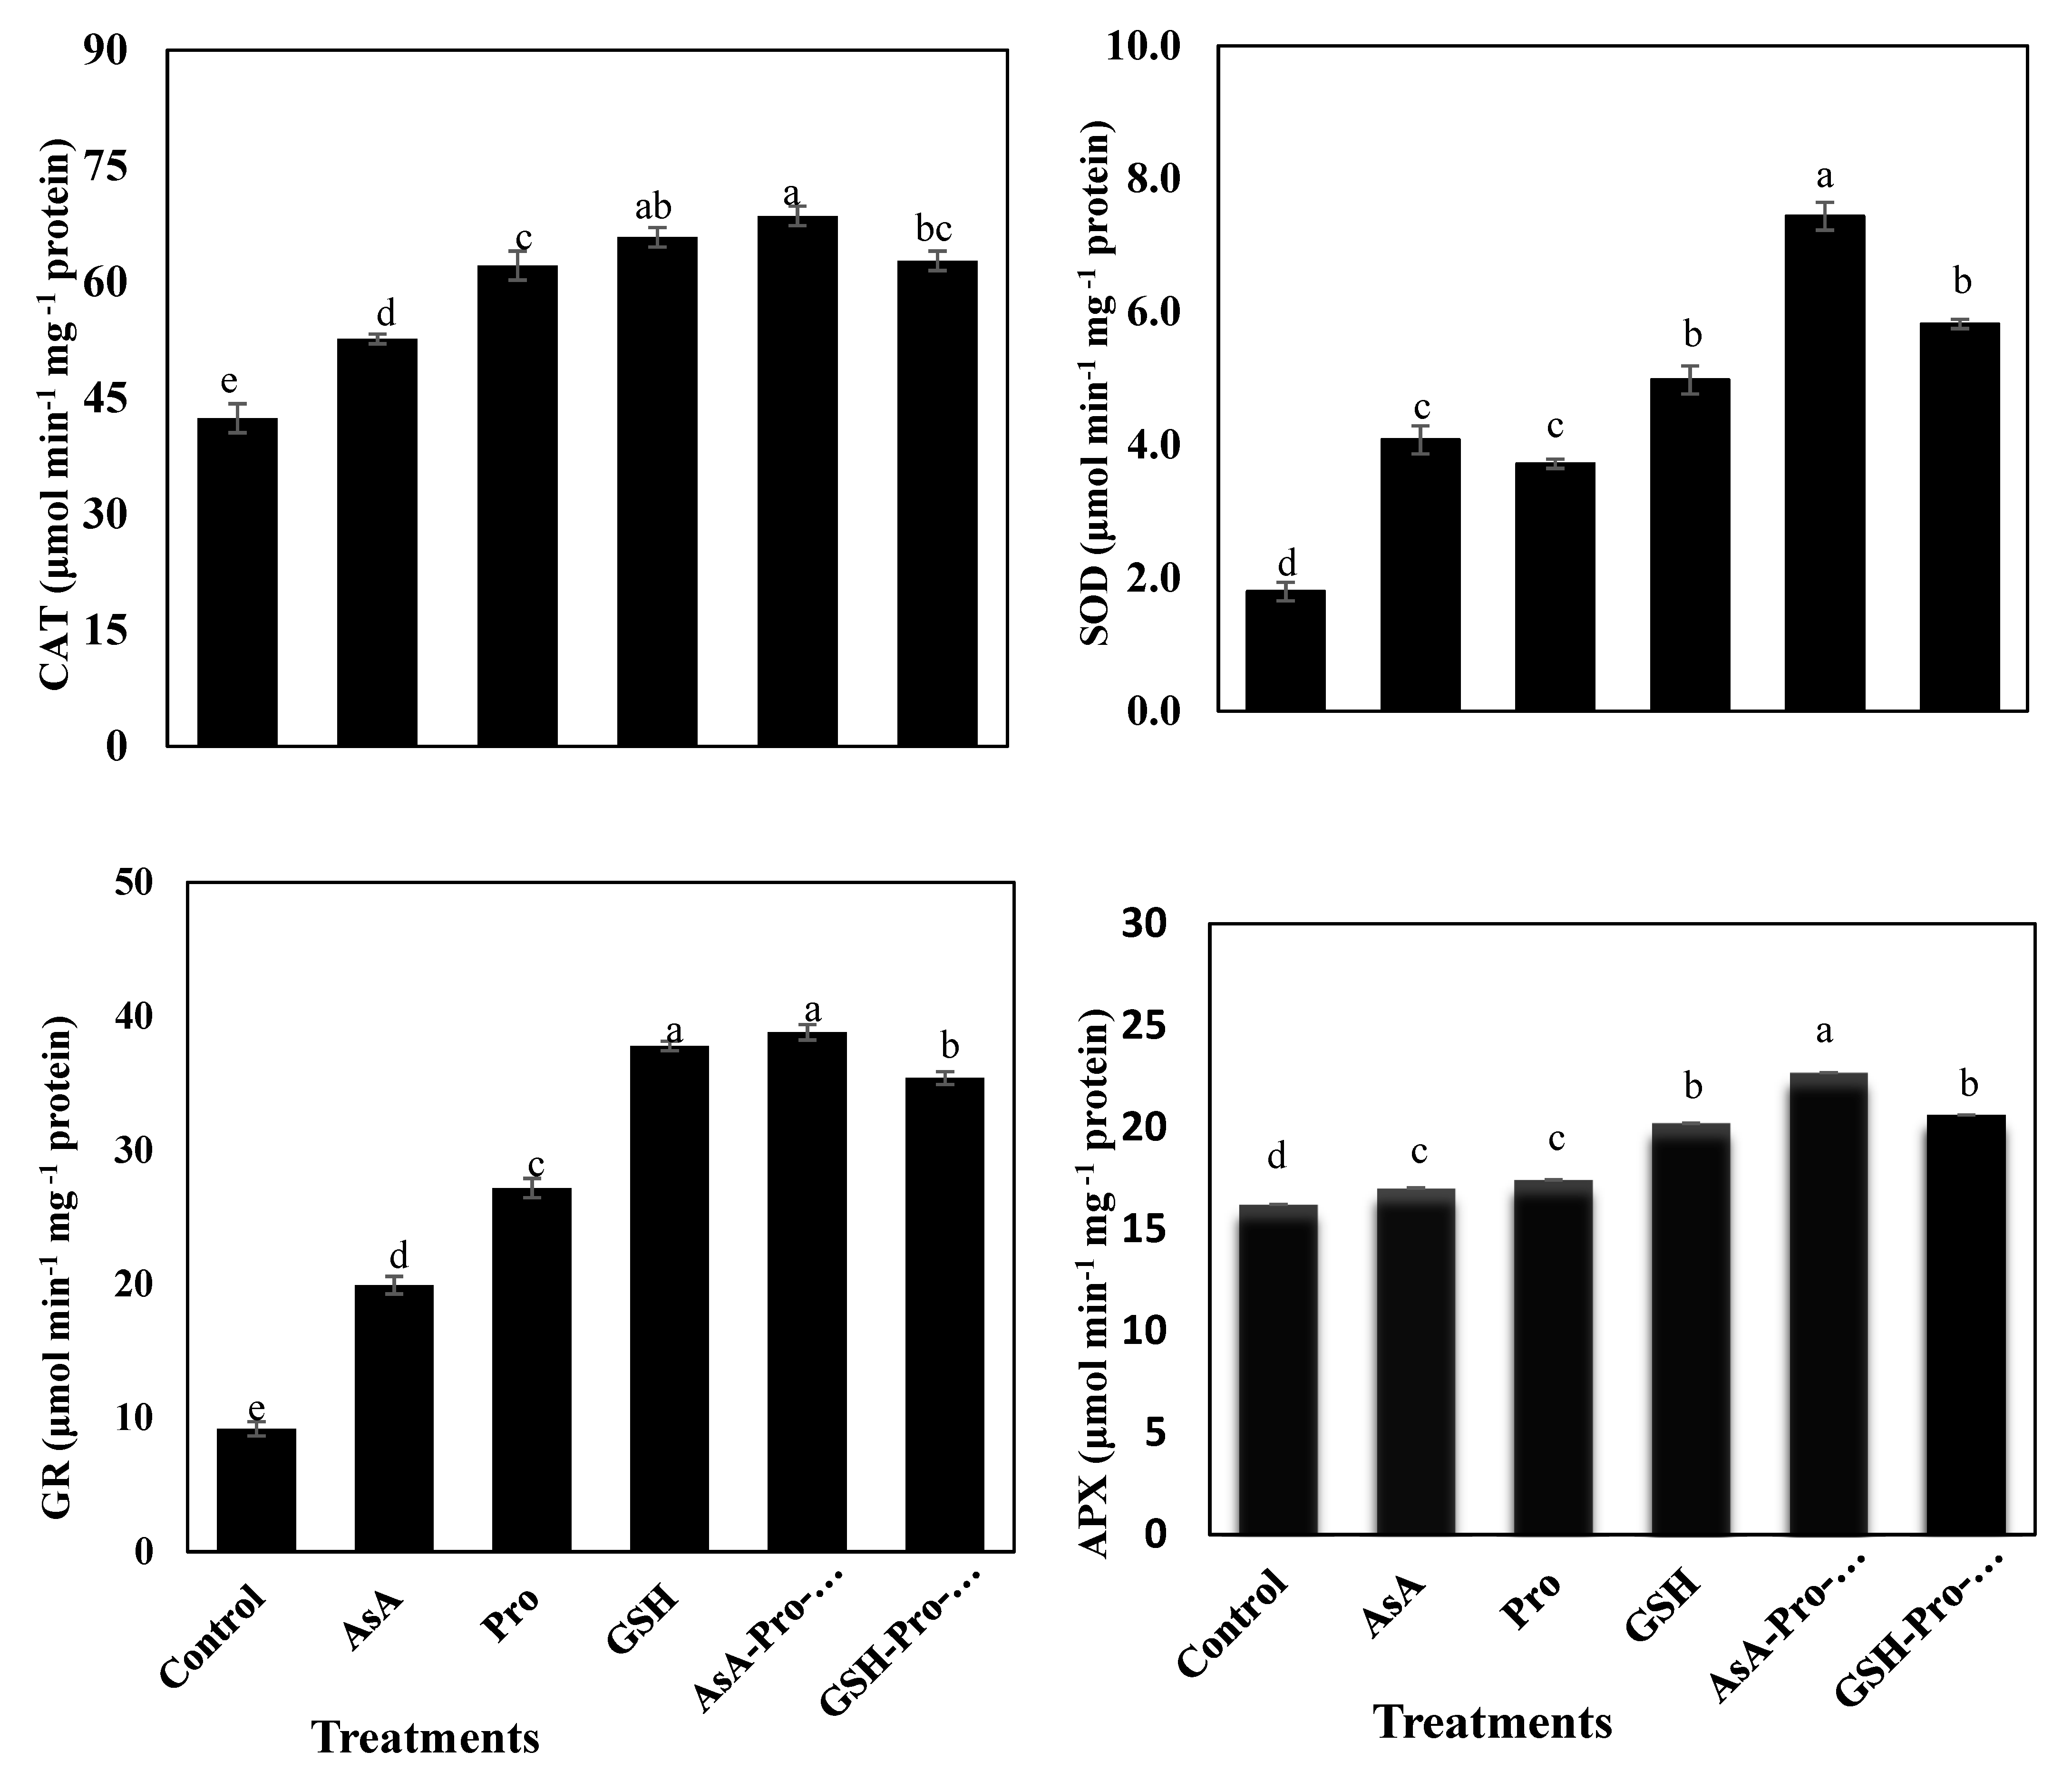
2.5. Enzymatic Antioxidants Assays
Fresh leaf tissue (0.5 g fresh sample) was used for SOD, CAT, GR and APX extraction, samples were homogenized in 0.1 M ice cold phosphate buffer (pH = 7.5) containing 0.5 mM EDTA with pre-chilled pestle and mortar. Each homogenate was transferred to centrifuge tubes and was centrifuged at 4 °C in a Beckman refrigerated centrifuge for 15 min at 15,000 ×
g; supernatant was used for enzyme activity assay [
23]. The concentration of the extracted protein was determined using the technique reported by [
69]. The enzymes activities determinations were performed, and all expressed as μmol min
−1 mg
−1 protein. The activity of superoxide dismutase (SOD; EC 1.15.1.1) was assessed from recording an inhibition of cytochrome reduction in nitroblue tetrazolium (NBT) at 540 nm [
70]. About 3 mL of reaction mixture, containing 0.1 ml of 200 mM methionine, 0.1 mL of 2.25 mM nitro-blue tetrazolium (NBT), 0.1 mL of 3 mM EDTA, 1.5 mL of 100 mM potassium phosphate buffer, 1 ml distilled water and 0.05 mL of enzyme extraction, were taken in test tubes in duplicate from each enzyme sample. Two tubes without enzyme extract were taken as control. The reaction was started by adding 0.1 mL riboflavin (60 µM) and placing the tubes below a light source of two florescent lamps (15 W) for 15 min. the reaction was stopped by switching off the light and covering the tubes with black cloth. Tubes without enzyme extract developed maximal color. A non-irradiated complete reaction mixture which did not develop color served as blank. Absorbance was recorded at 560 nm and one unit of enzyme activity was taken as the quantity of enzyme which reduced the absorbance reading of samples to 50% in comparison with tubes lacking enzymes. Glutathione reductase (GR; EC 1.6.4.1) activity was determined by measuring the oxidation of NADPH at 340 nm [
71]. The reaction mixture contained 1 mL of 0.2 M potassium phosphate buffer (pH = 7.5) containing 0.1 mM EDTA, 0.5 mL of 3 mM DTNB in 0.01 M potassium phosphate buffer (pH = 7.5), 0.1 mL of 2 mM NADPH, 0.1 mL enzyme extract and distilled water to make up a final volume of 2.9 mL. The reaction was initiated by adding 0.1 mL of 2 mM GSSG. The increase in absorbance at 412 nm was recorded at 25 °C over a period of 5 min on a spectrophotometer. Ascorbate peroxidase (APX; EC 1.11.1.11) activity was measured according to [
71] by monitoring the rate of ascorbate oxidation at 290 nm (E=2.8 mM
−1 cm
−1). The reaction mixture contained 25 mM phosphate buffer (pH = 7), 0.1 mM EDTA, 1 mM H
2O
2, 0.25 mM AsA and the enzyme sample. No change in absorption was found in the absence of AsA in the test medium. Catalase (CAT; EC 1.11.1.6) activity was performed by measuring the decomposition rate of H
2O
2 at 240 nm [
72]. The 3 mL reaction mixture contained 1.5 mL of 100 mM potassium phosphate buffer (pH = 7), 0.5 mL of 75 mM H
2O
2, 0.05 mL enzyme extraction and distilled water to make up the volume to 3 mL. The reaction started by adding H
2O
2 and with a decrease in absorbance recorded at 240 nm for 1 min. Enzyme activity was computed by calculating the amount of decomposed H
2O
2.
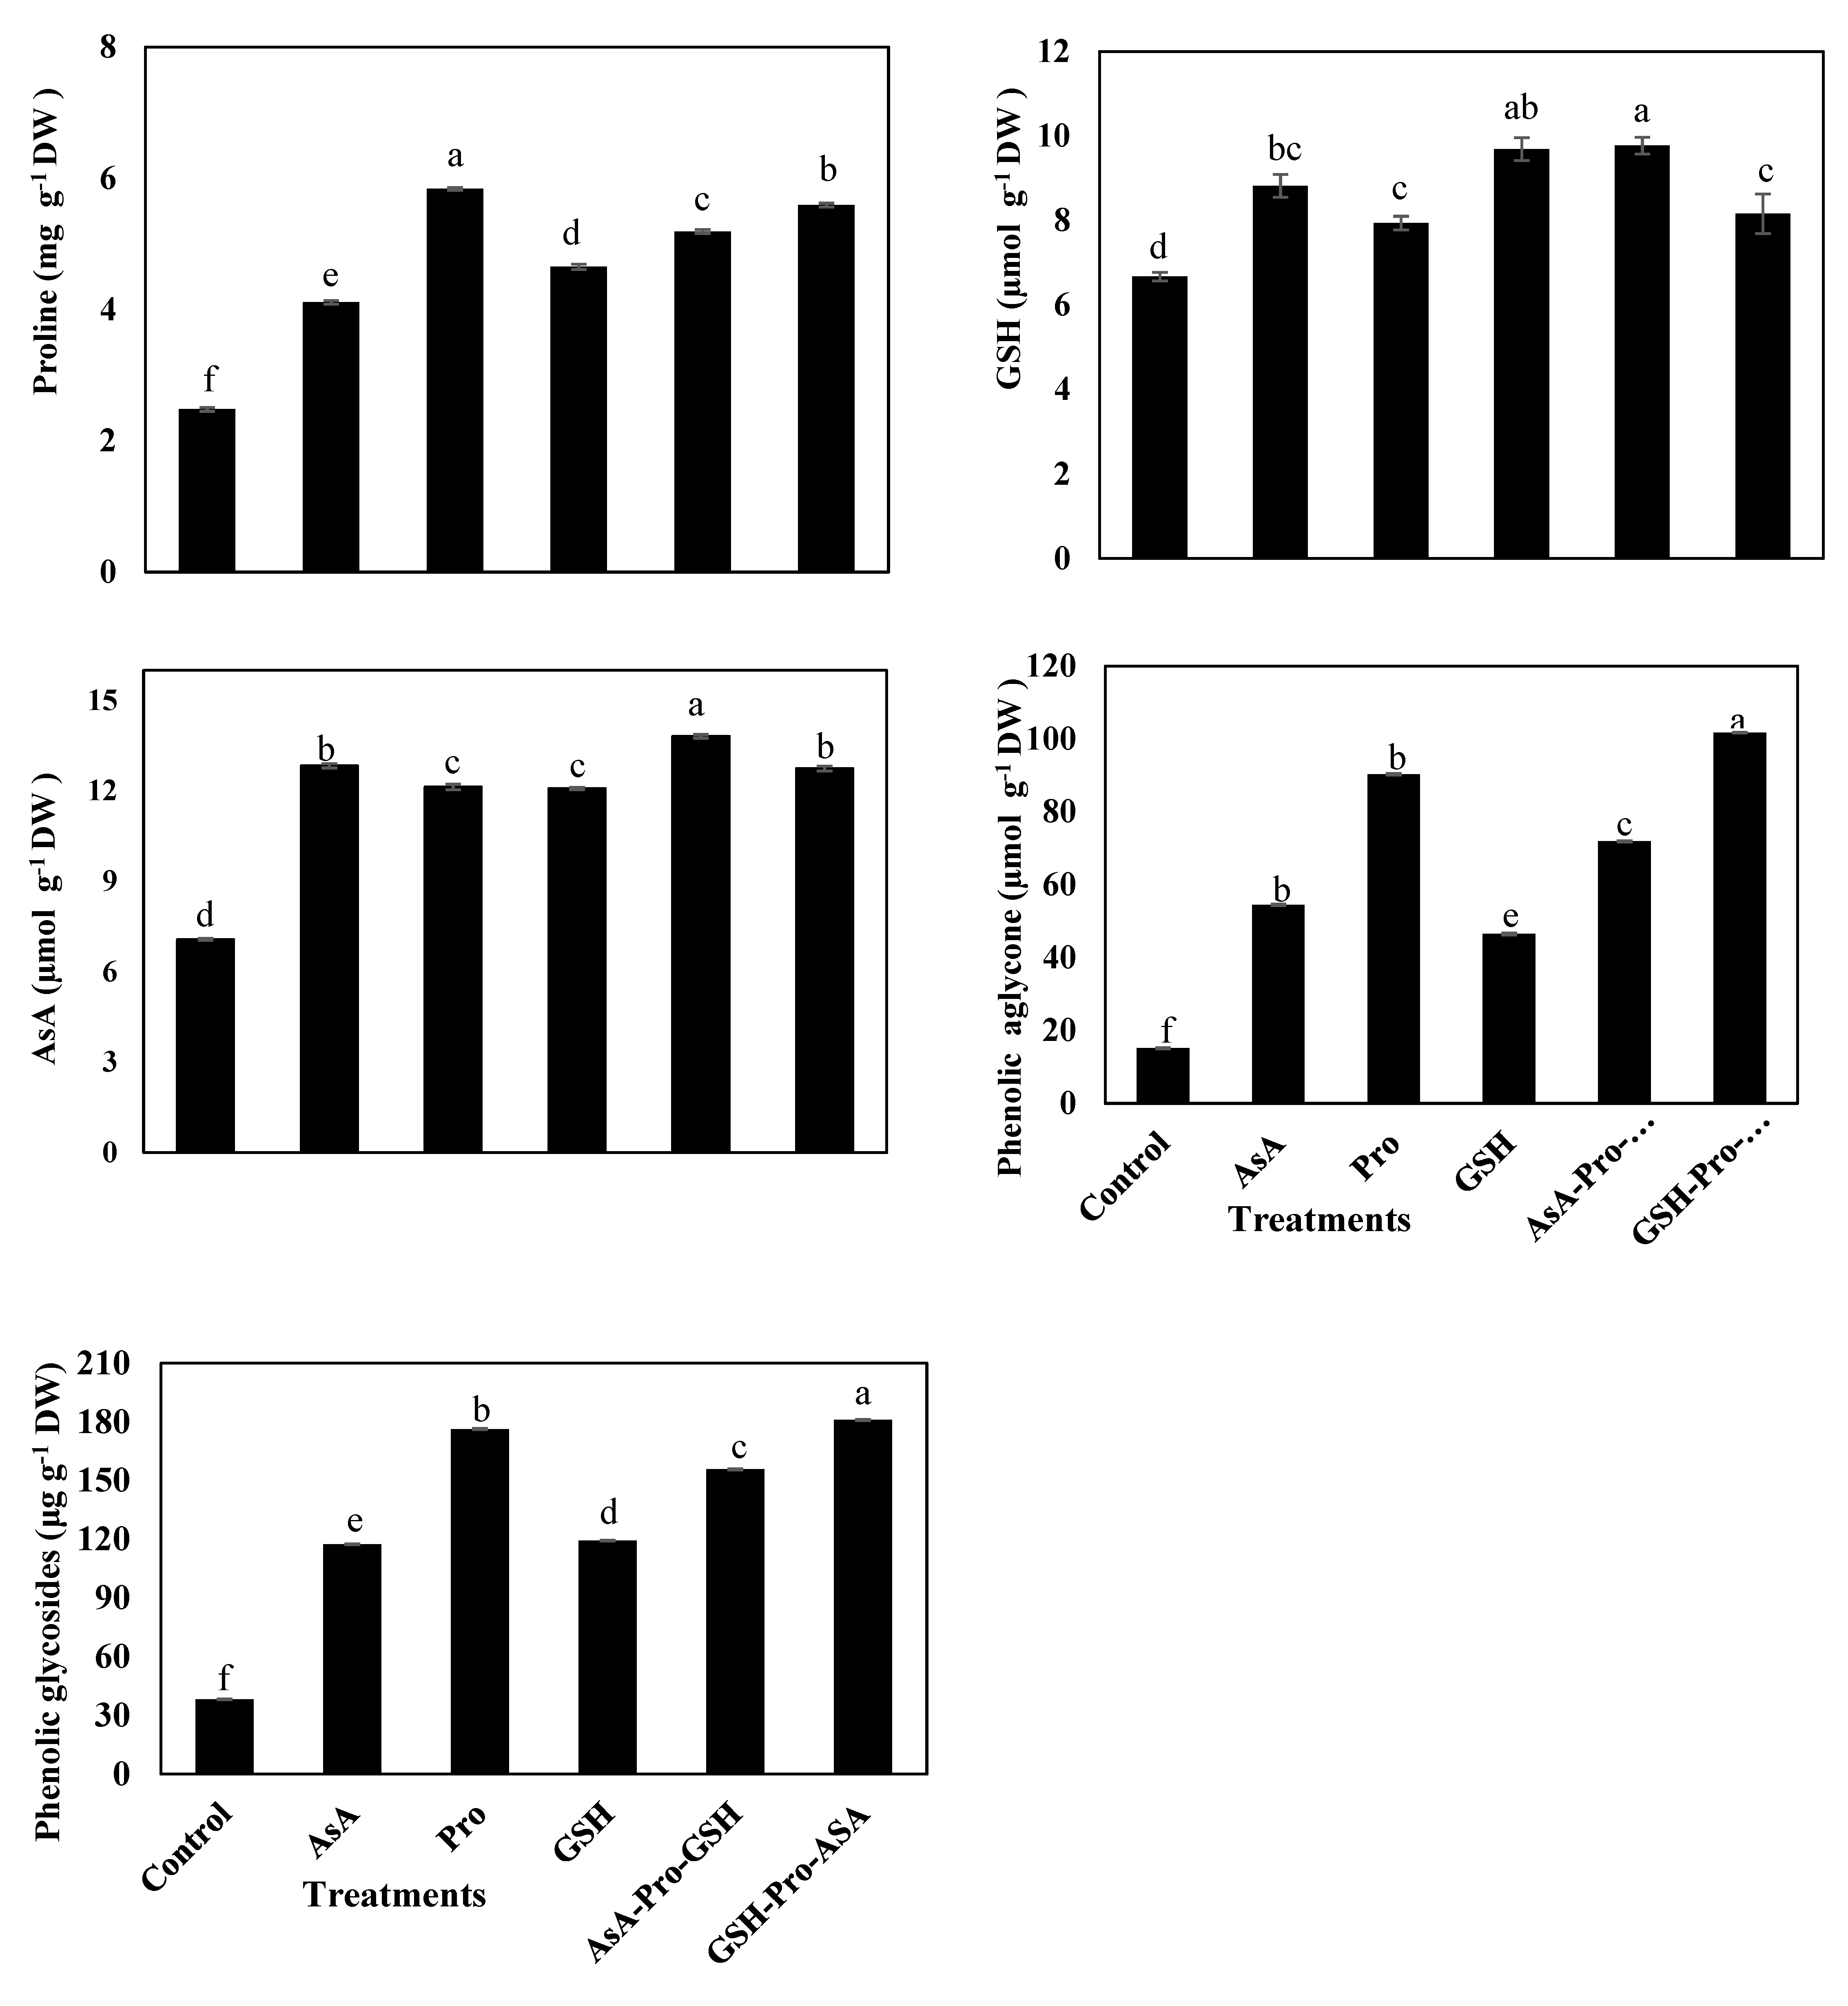
2.6. Non-Enzymatic Antioxidants
Ascorbate (AsA) was determined using the method of [
73], by extracting fresh leaves (1.0 g) in 5% (w/v) trichloroacetic acid (centrifuged at 15,600 ×
g) at 4°C for 5 min. AsA content was then assayed by the method described by [
23]. According to [
74], the rapid colorimetric method was used for proline content measurement (in mg 100 g
−1 DW of leaf) described in [
23]. Dried leaf tissue (0.5 g) was homogenized in 10 mL of 3% (
v/v) sulfosalicylic acid and centrifuged at 10,000 ×
g for 10 min. The supernatant was mixed with acid-ninhydrin solution, incubated in a water bath at 90 °C for 30 min, cooled in an ice bath, then 5 mL of toluene was added. The toluene phase was then collected carefully into a test tube and read spectrophotometrically at 520 nm.
To determine GSH contents, the methodology of [
75] was followed in fresh fully expanded leaves, homogenized in 2% (
v/v) metaphsphoric acid, then centrifuged at 17,000 ×
g for 10 min. The supernatant was neutralized by mixing it with 10% (
w/v) sodium citrate. The assay was conducted in triplicates as described in [
23], and absorbance was recorded at 412 nm. Phenolic compounds, i.e., phenolic aglycone, and phenolic glycosides, were extracted from dried tissues according to method adopted by [
76], and The Folin–Ciocalteau phenol method [
77] was used for phenolic determination.
2.7. Statistical Analysis
The experimental layout was randomized complete block design with three replications for each treatment. All data were subjected to an analysis of variance (ANOVA), and differences between the means were compared by Duncan’s multiple range test (p ≤ 0.05) using Genstat statistical package (version 11; VSN International Ltd, Oxford, UK).


 ,
, 


