
PEG-Induced Osmotic Stress Alters Root Morphology and Root Hair Traits in Wheat Genotypes


Abstract
:1. Introduction
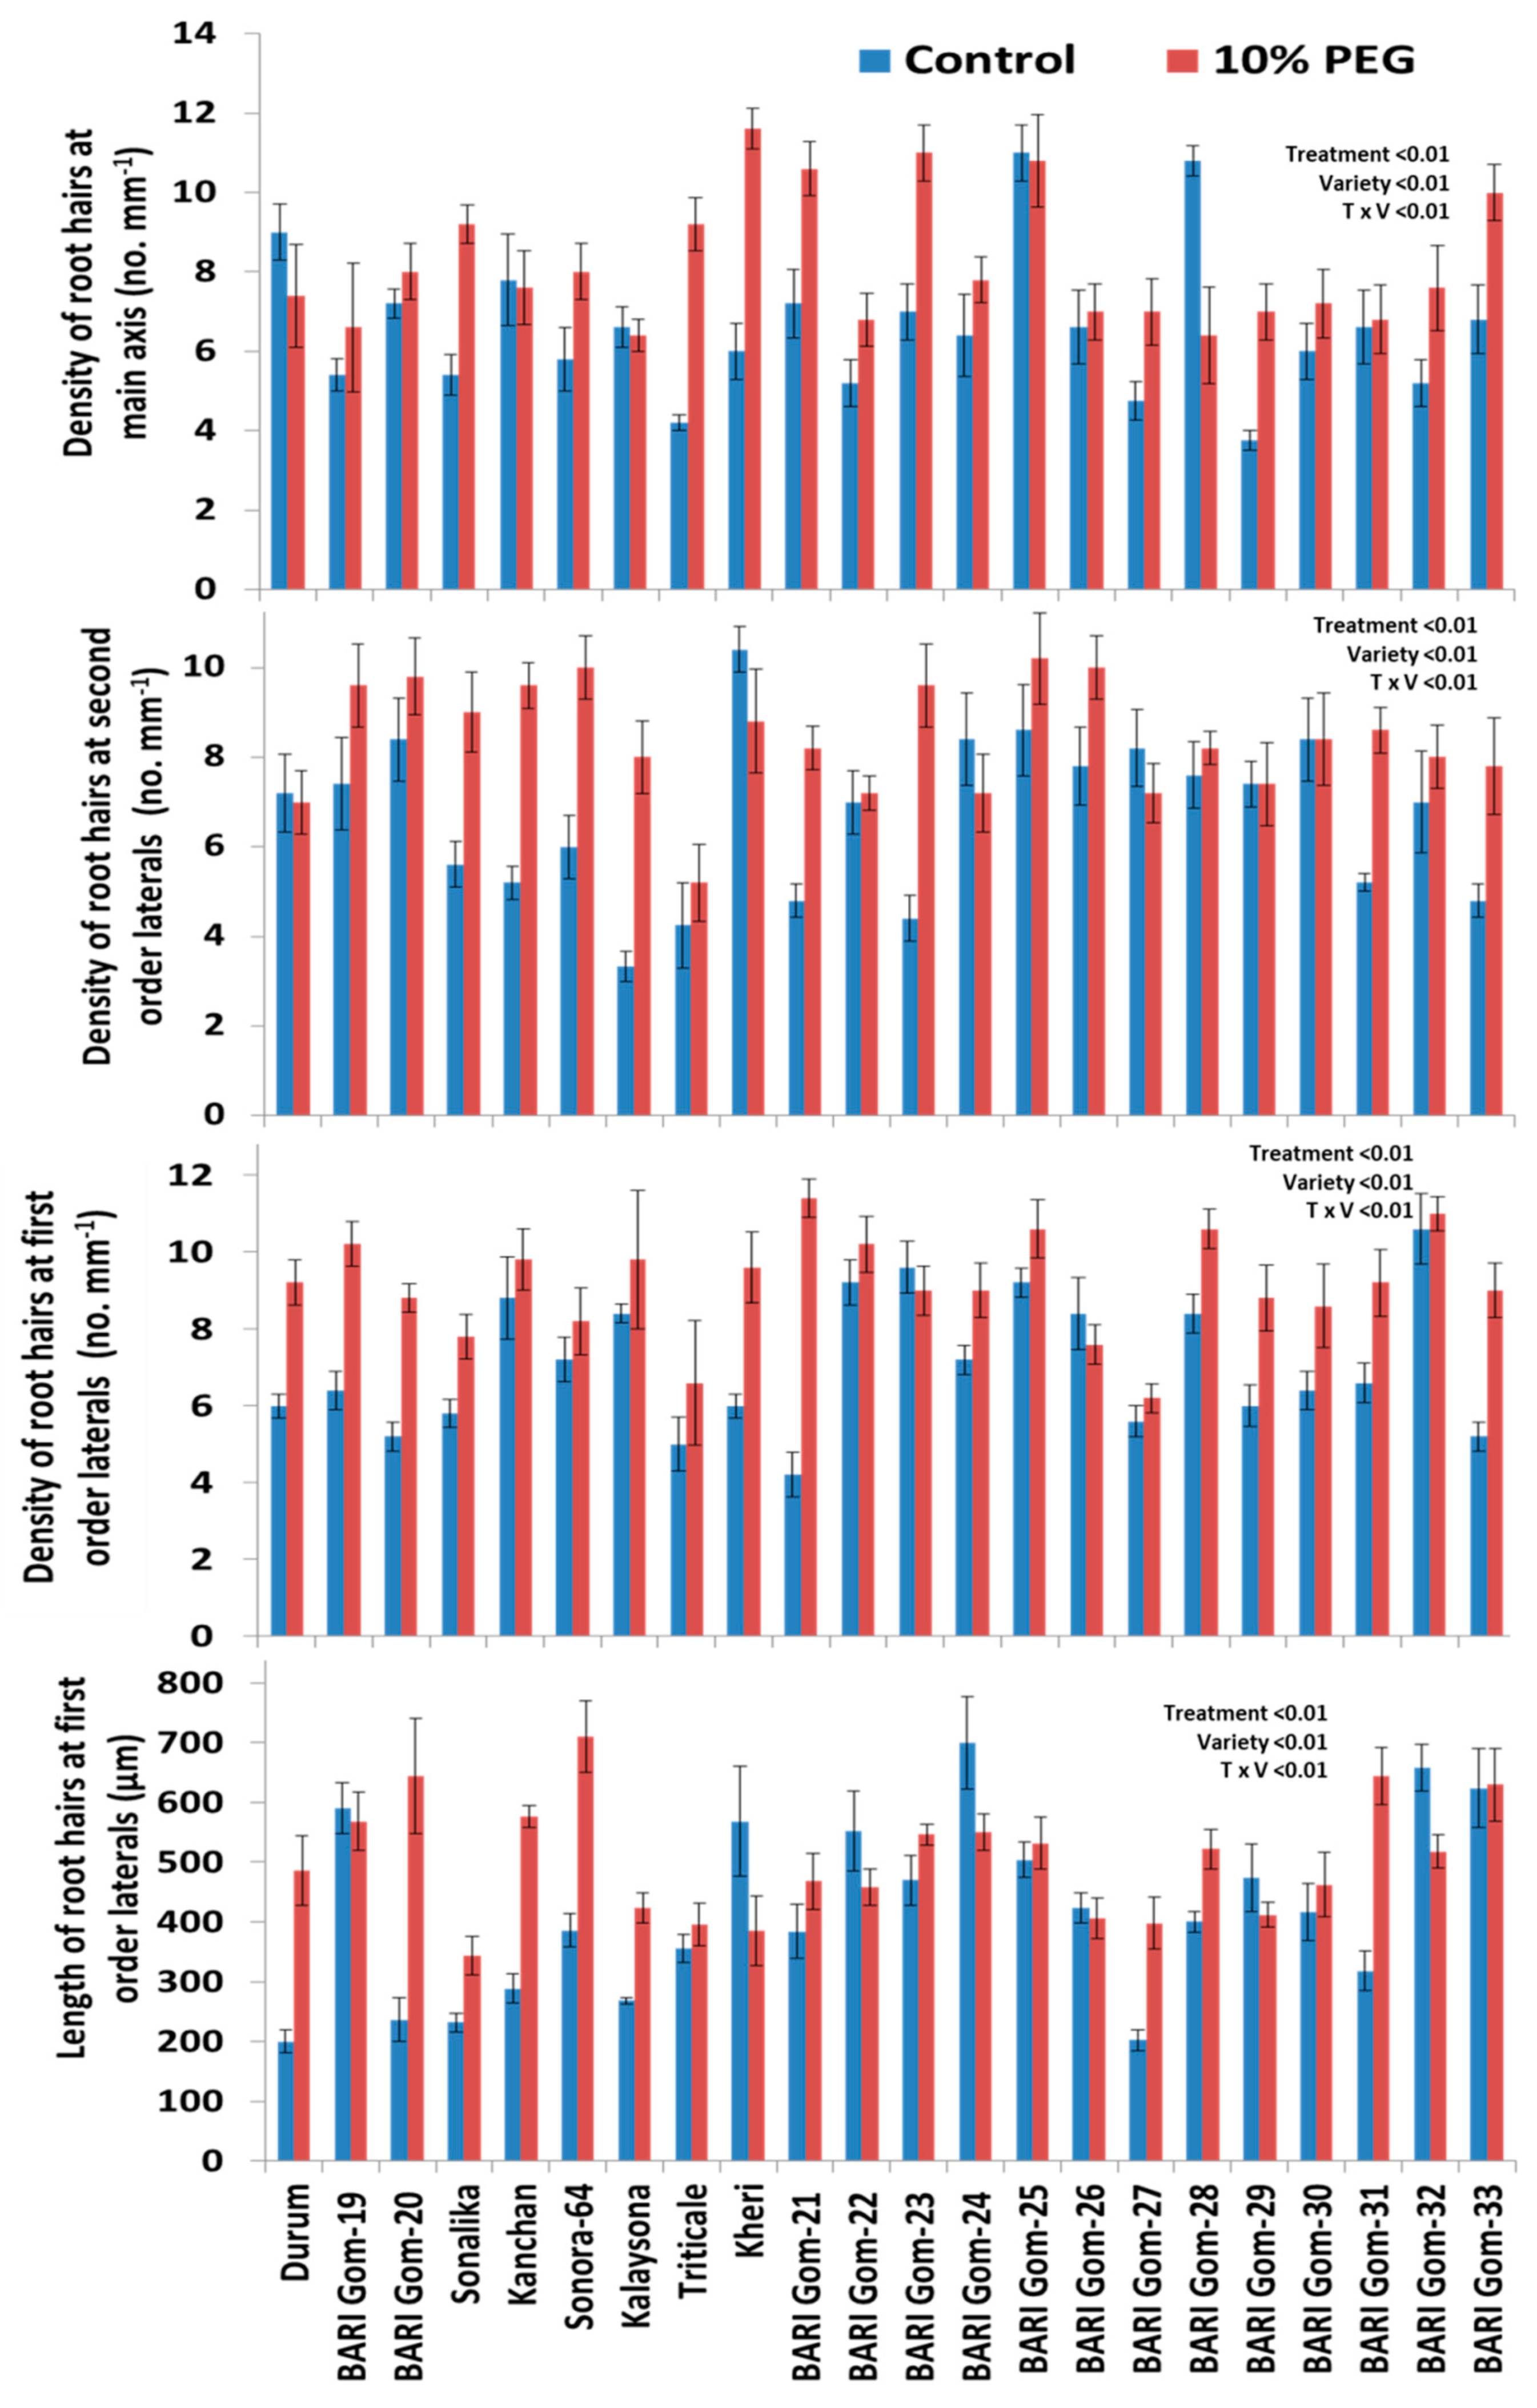
2. Results
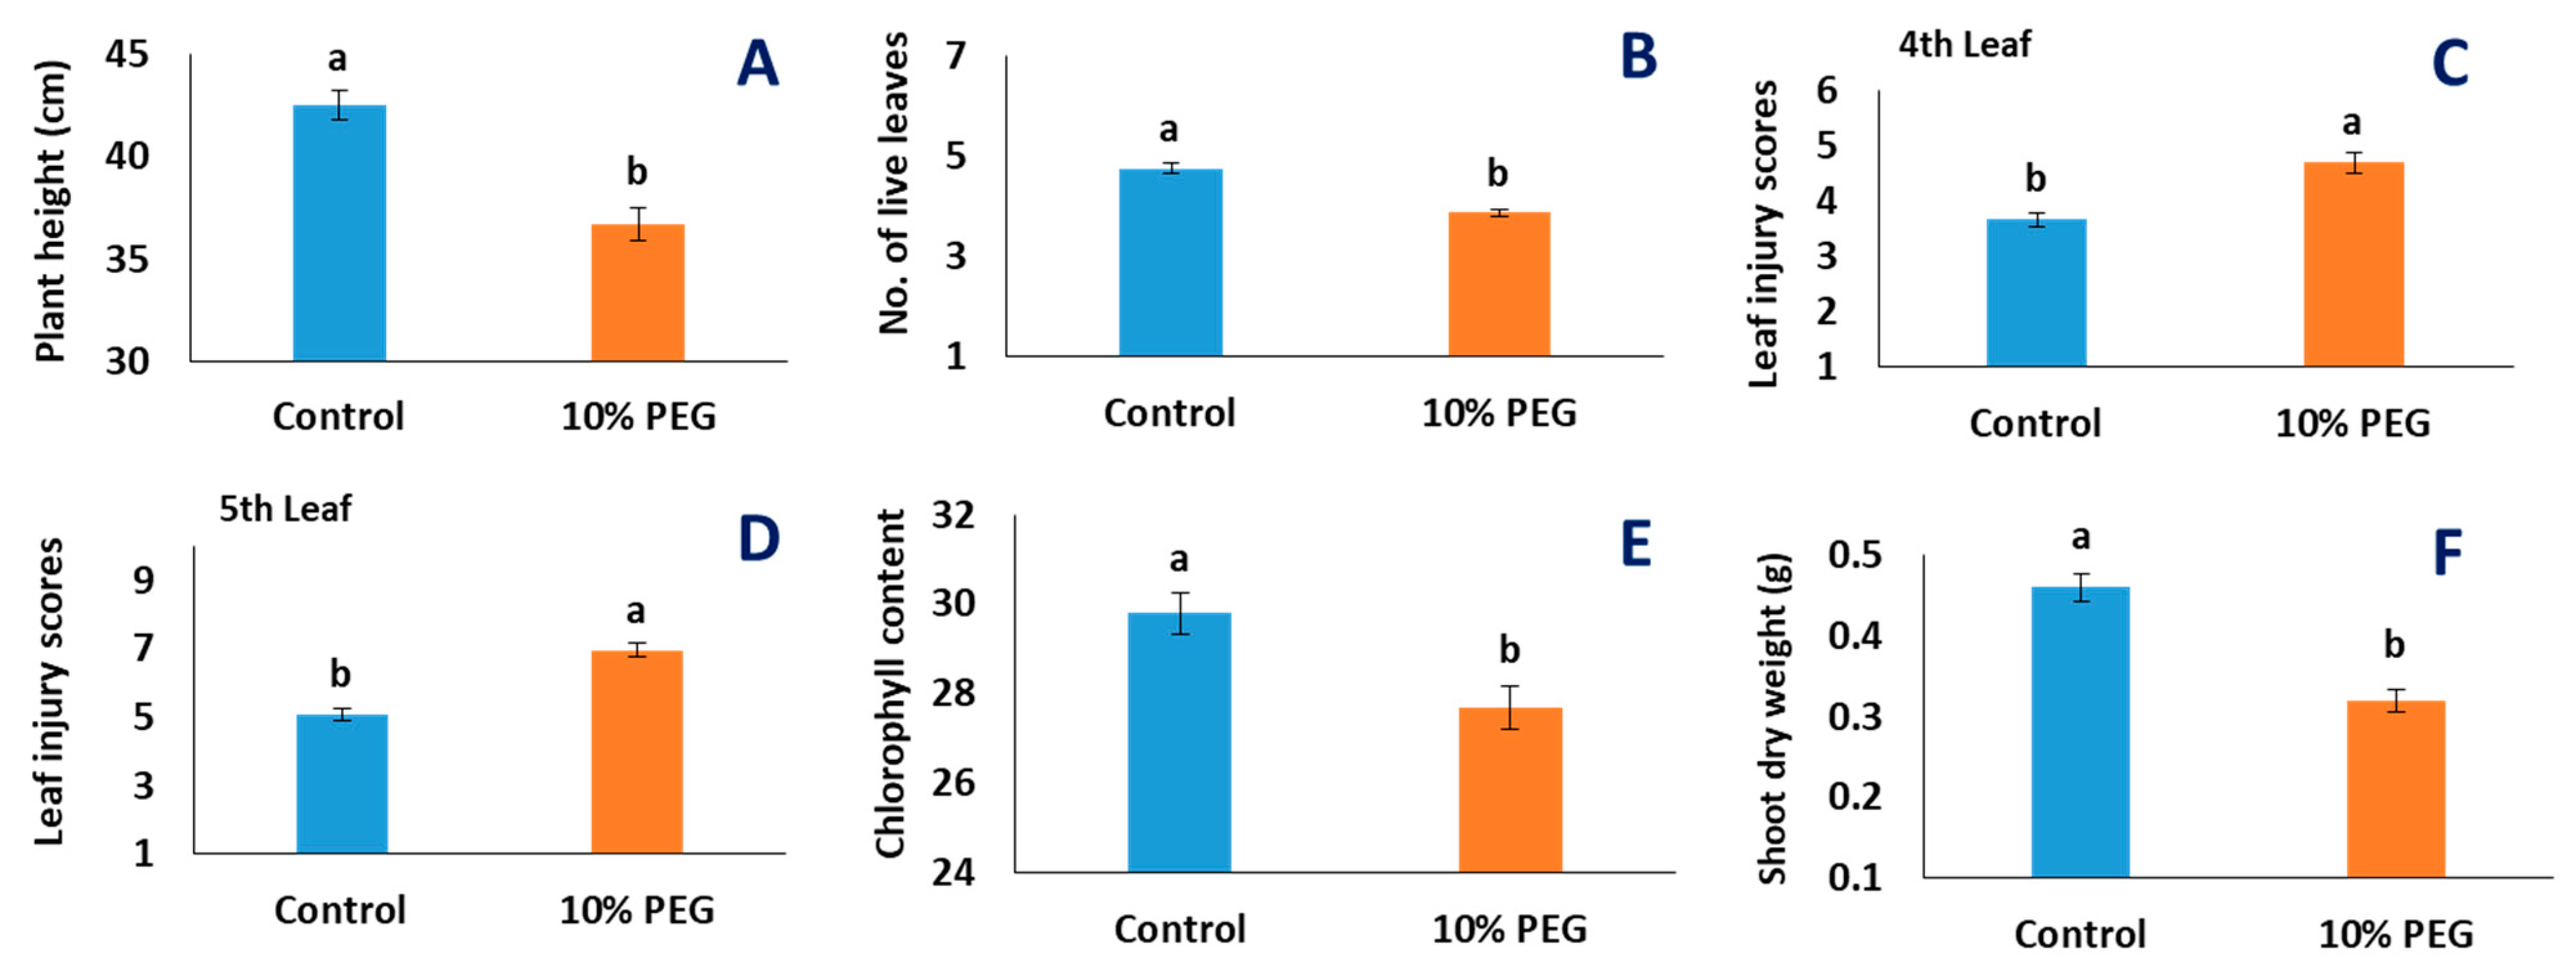
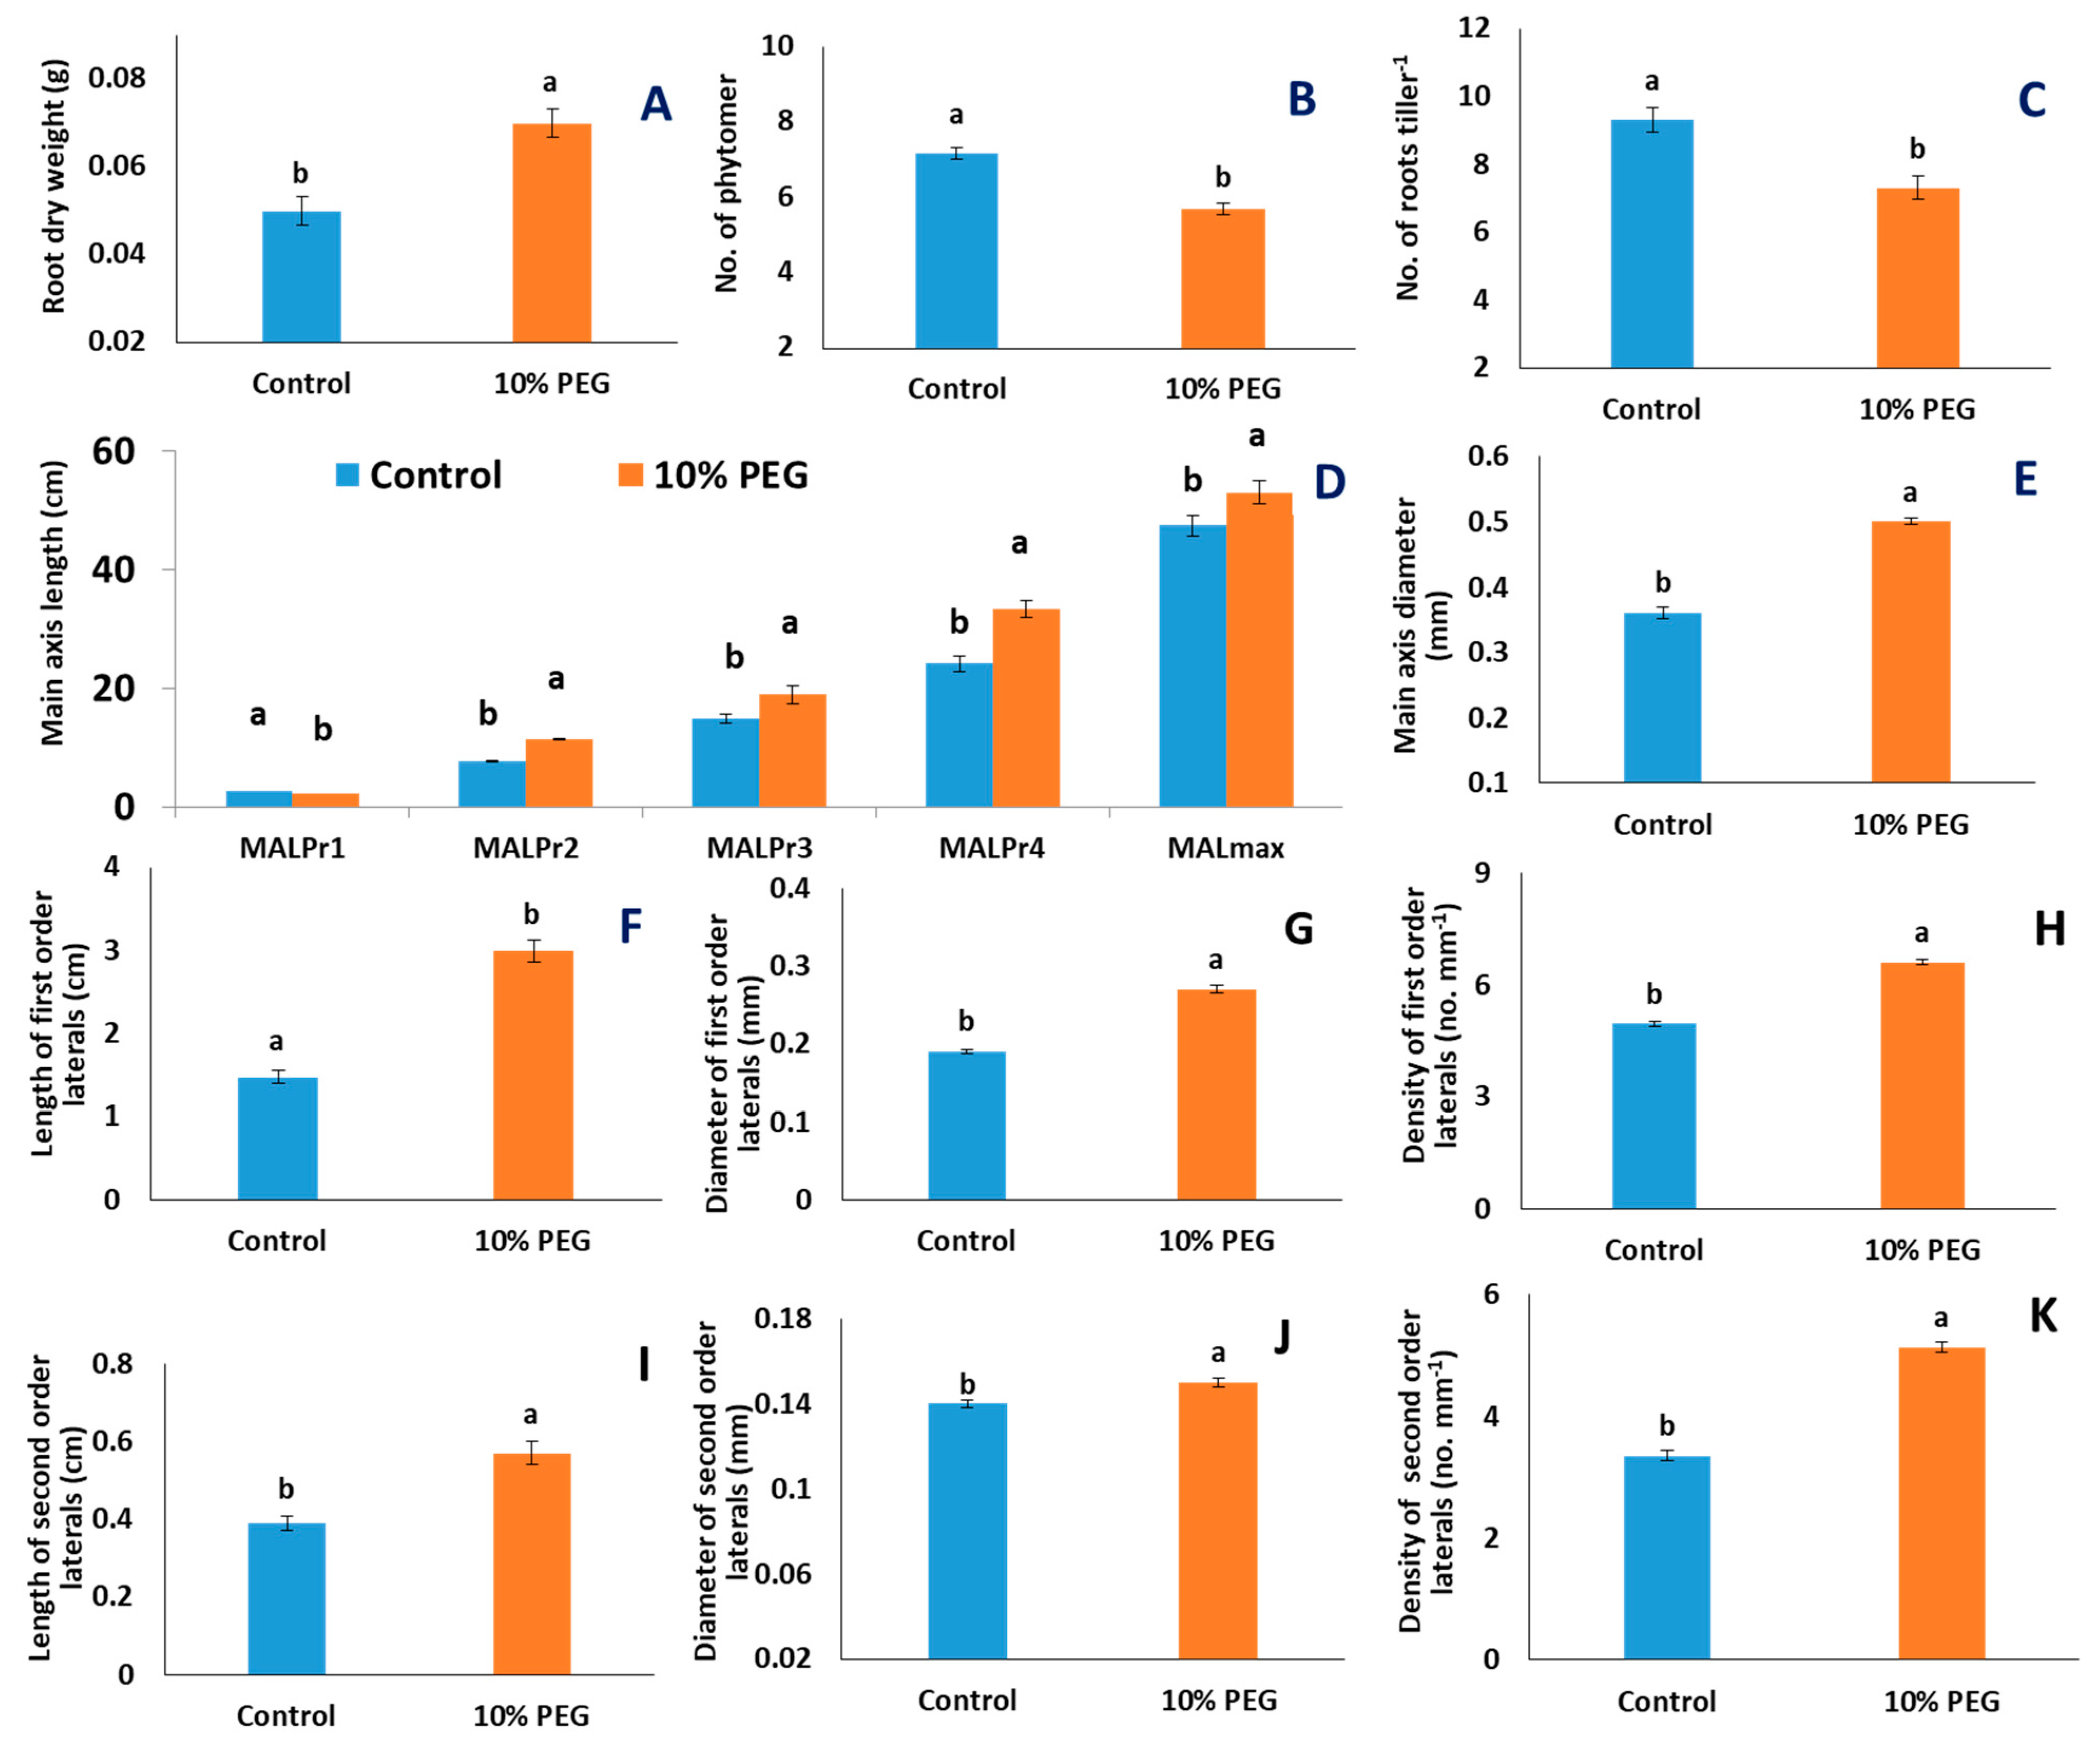
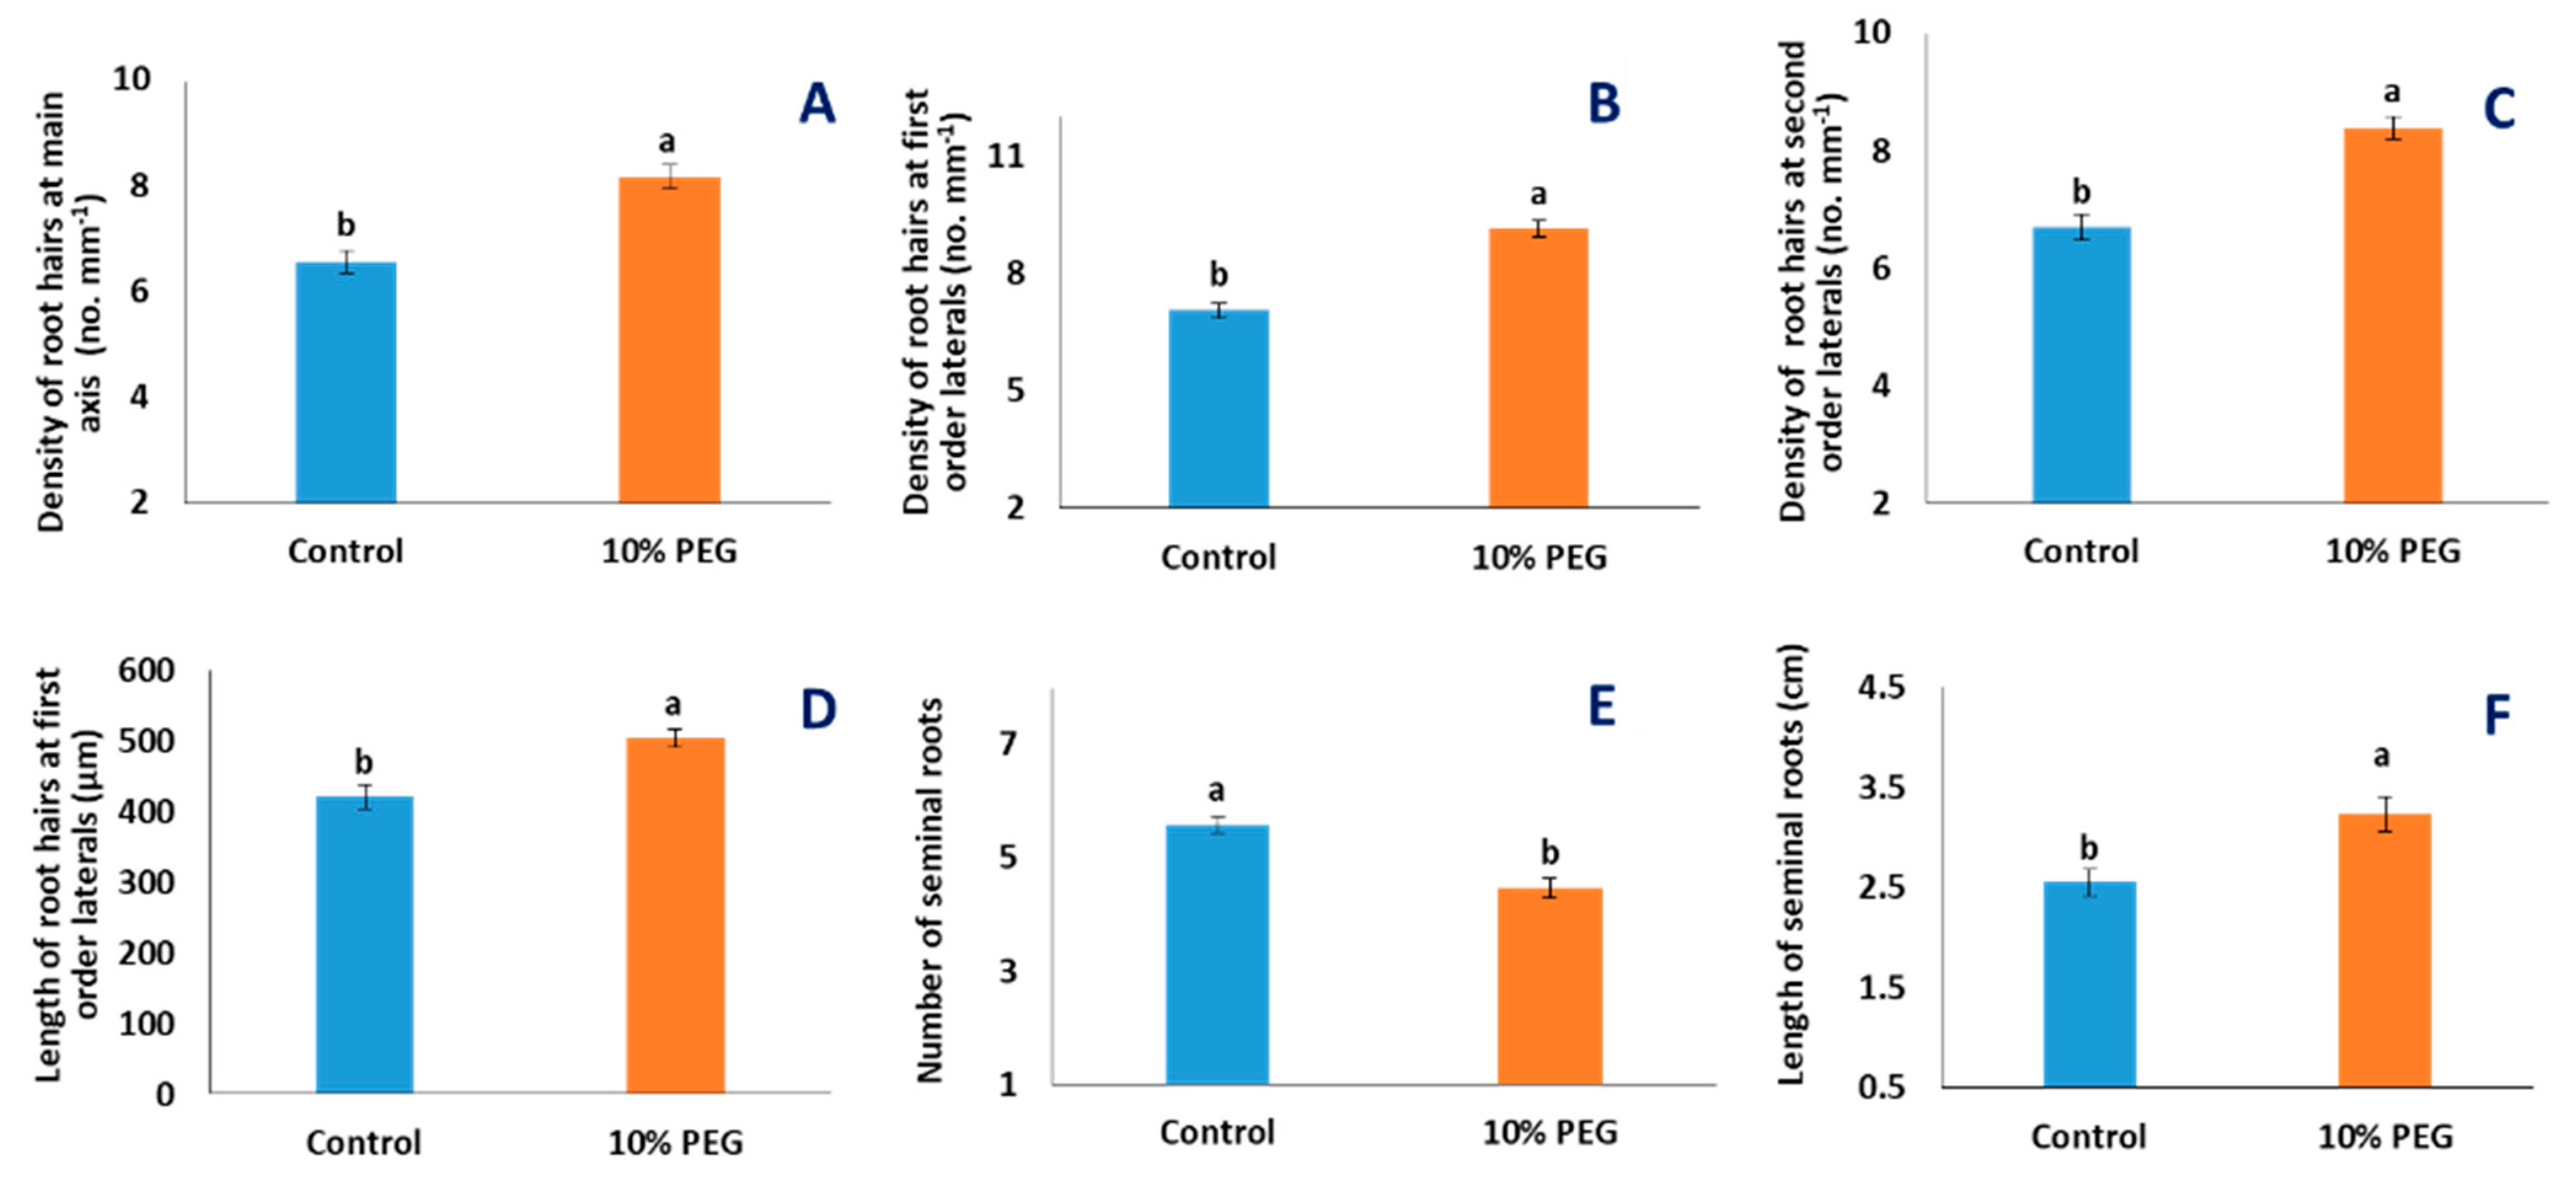
2.1. Effects of PEG Treatment
2.2. Varietal Differences
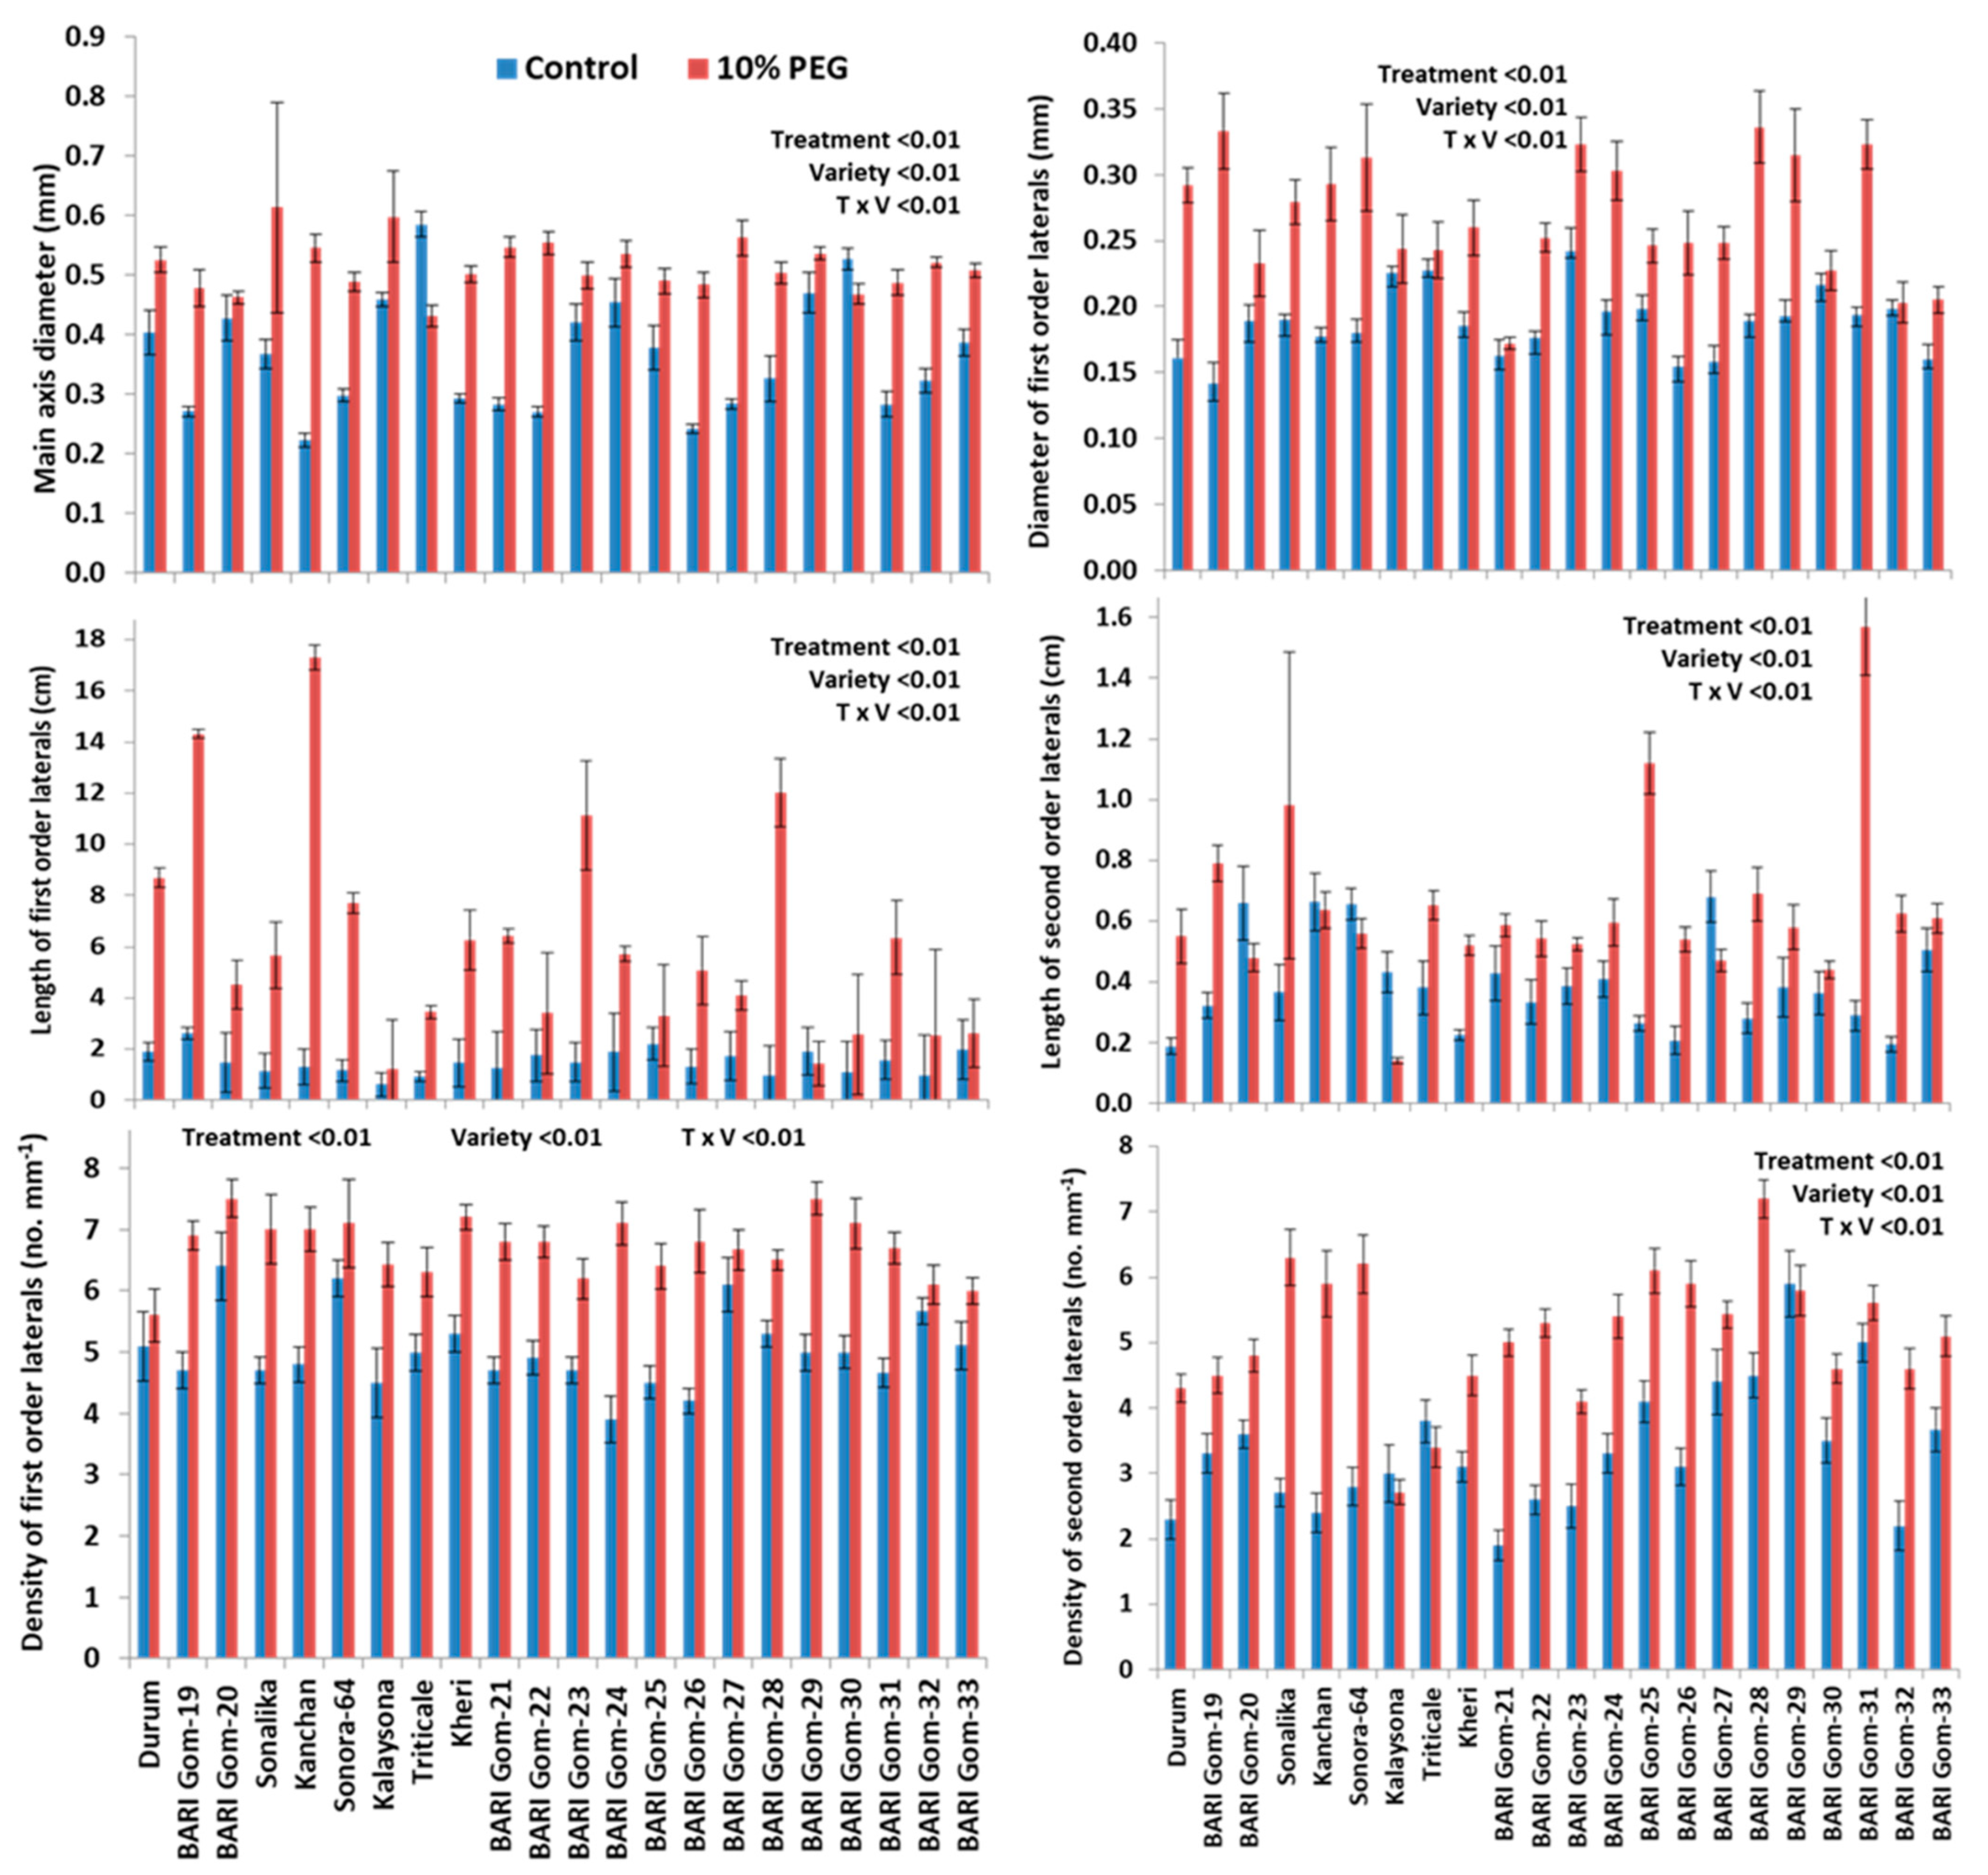
2.3. Treatment–Genotype Interactions
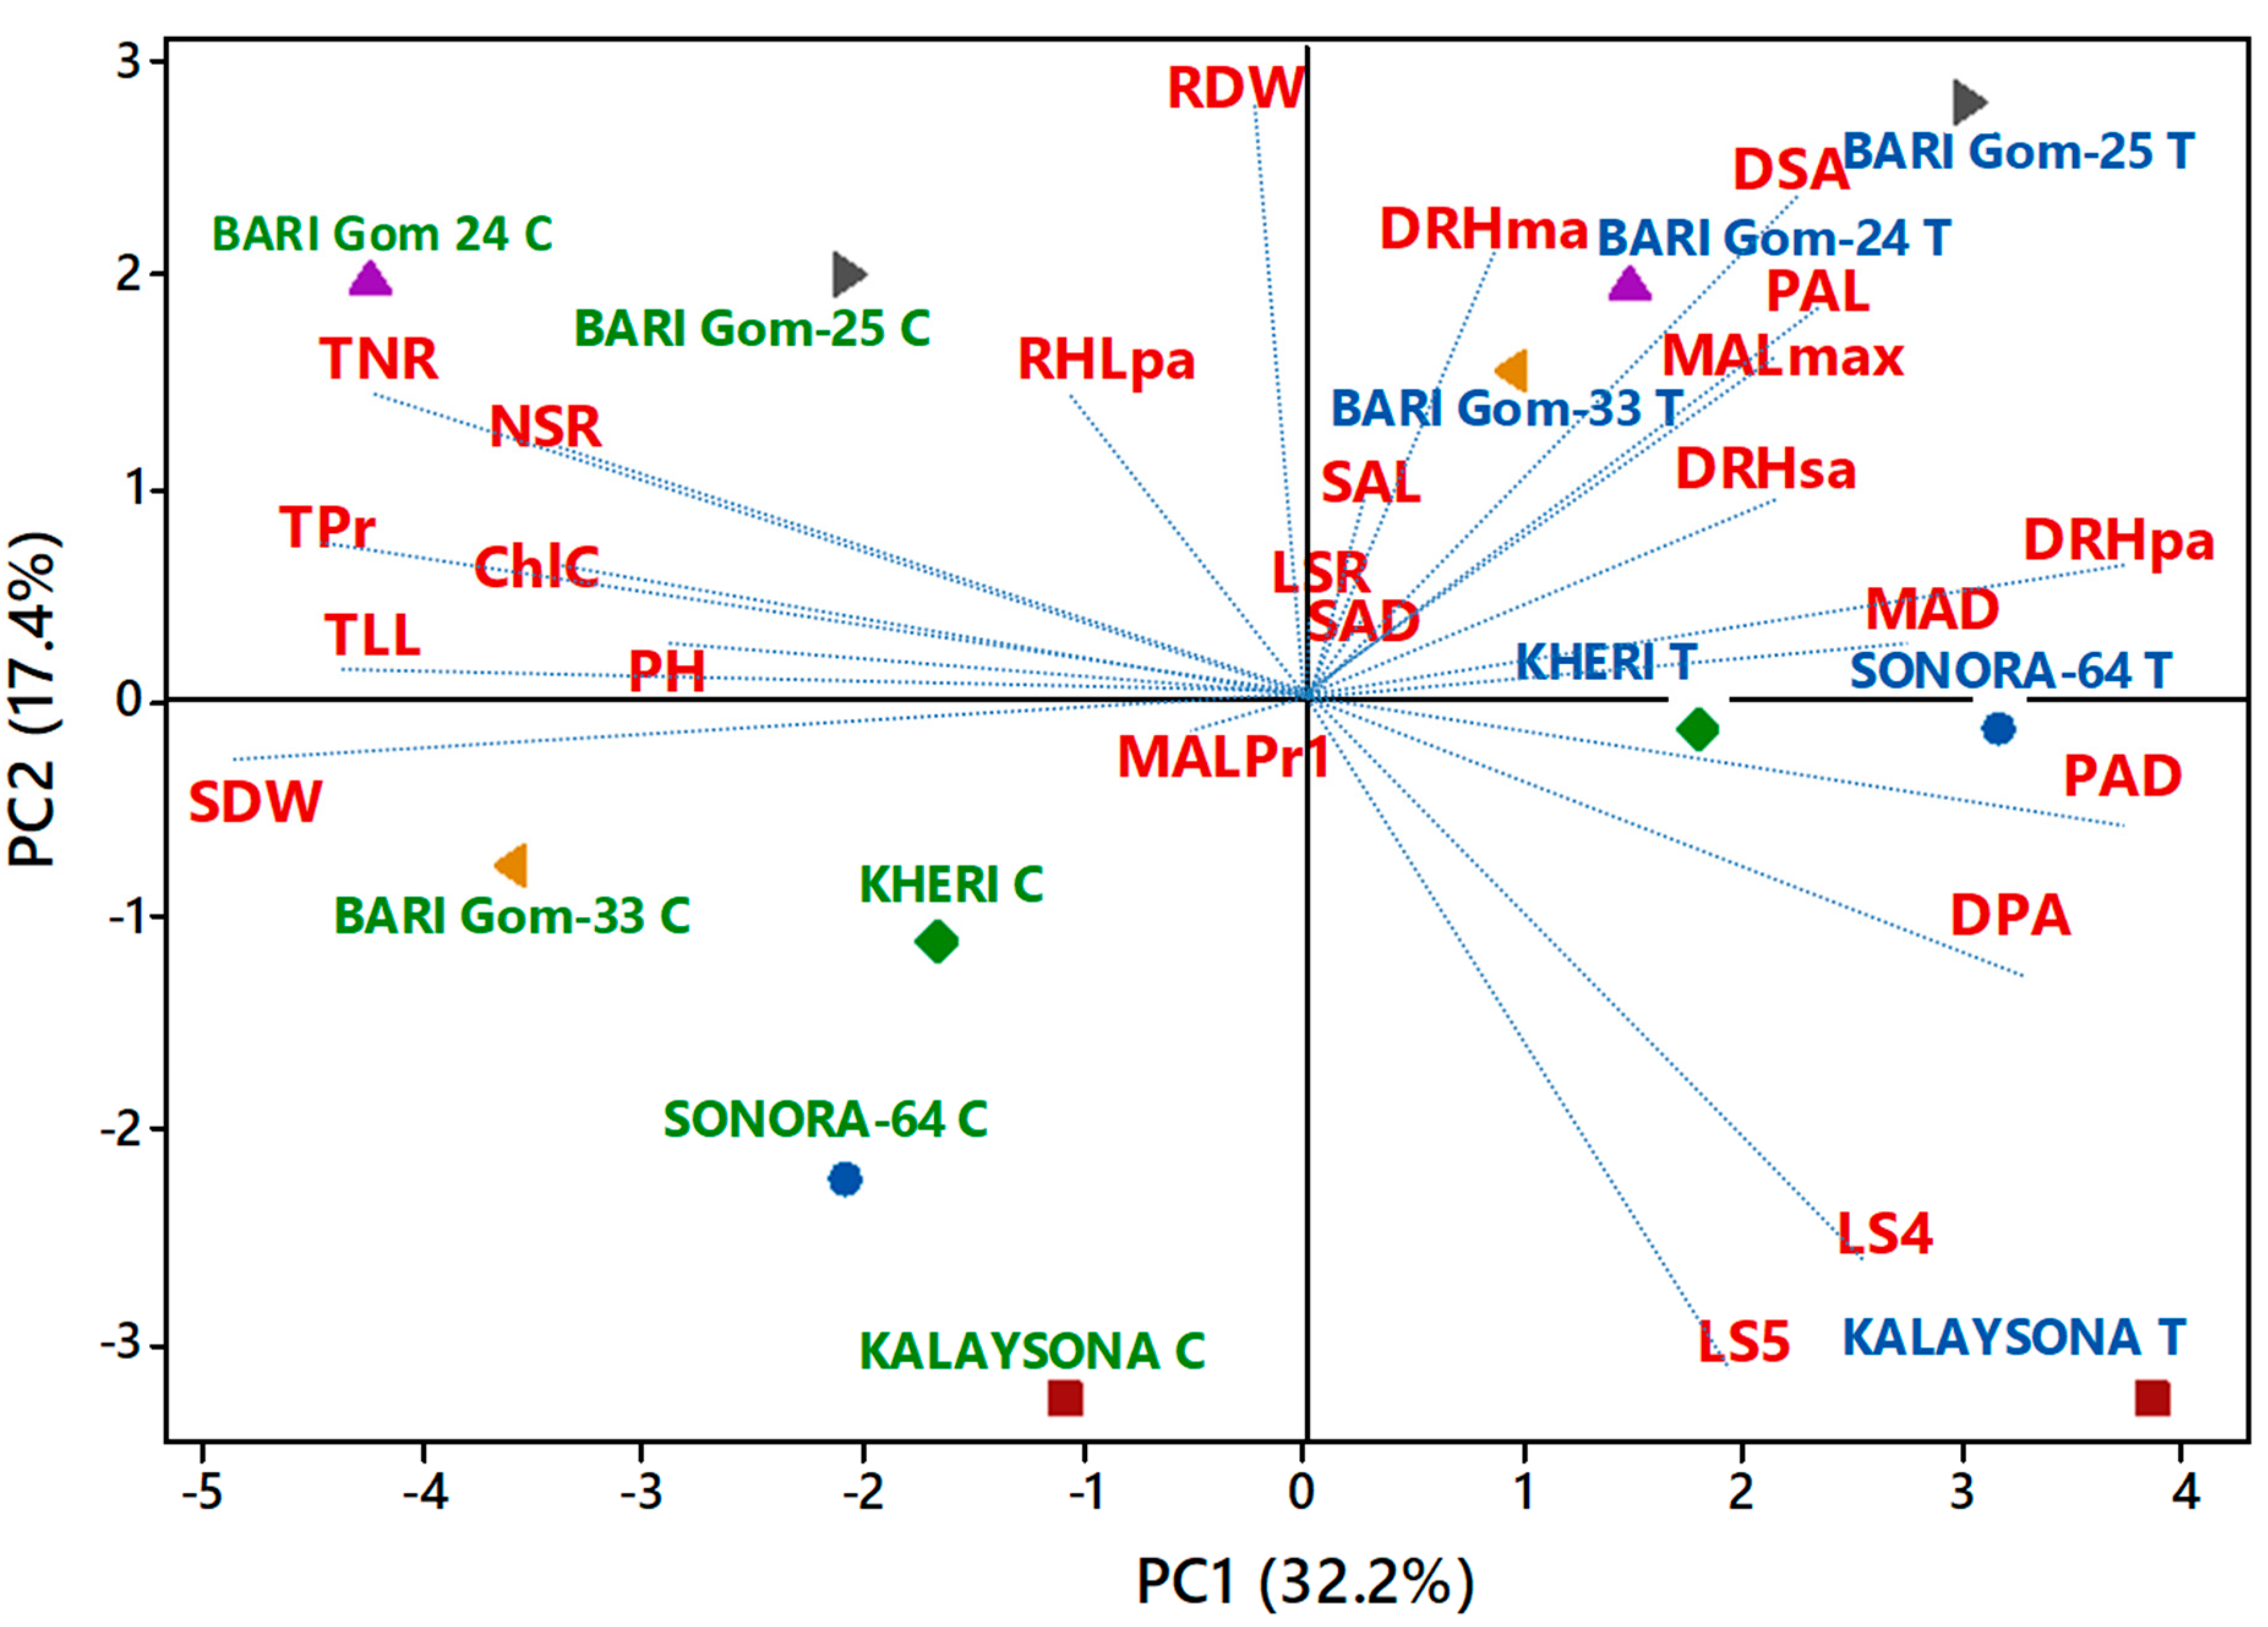
2.4. Trait Association
3. Discussion
3.1. PEG Stress Reduced New Root Formation Activity but Increased Length of Root Axes
3.2. PEG-Induced Osmotic Stress Altered the Morphology of Lateral Roots
3.3. Effect of PEG Stress on Root Hairs
3.4. Density of Lateral Roots and Root Hairs, Length and Diameter of the Main Axis, and First-Order Lateral Roots Were Strongly Associated with the Treatment Effect
3.5. Root Dry Weight, Density of Root Hairs and Second-Order Lateral Roots, Length of the Main axis, and First-Order Lateral Roots Traits Separated High-Yielding and Low-Yielding Genotypes
4. Materials and Methods
4.1. Plant Culture and Management
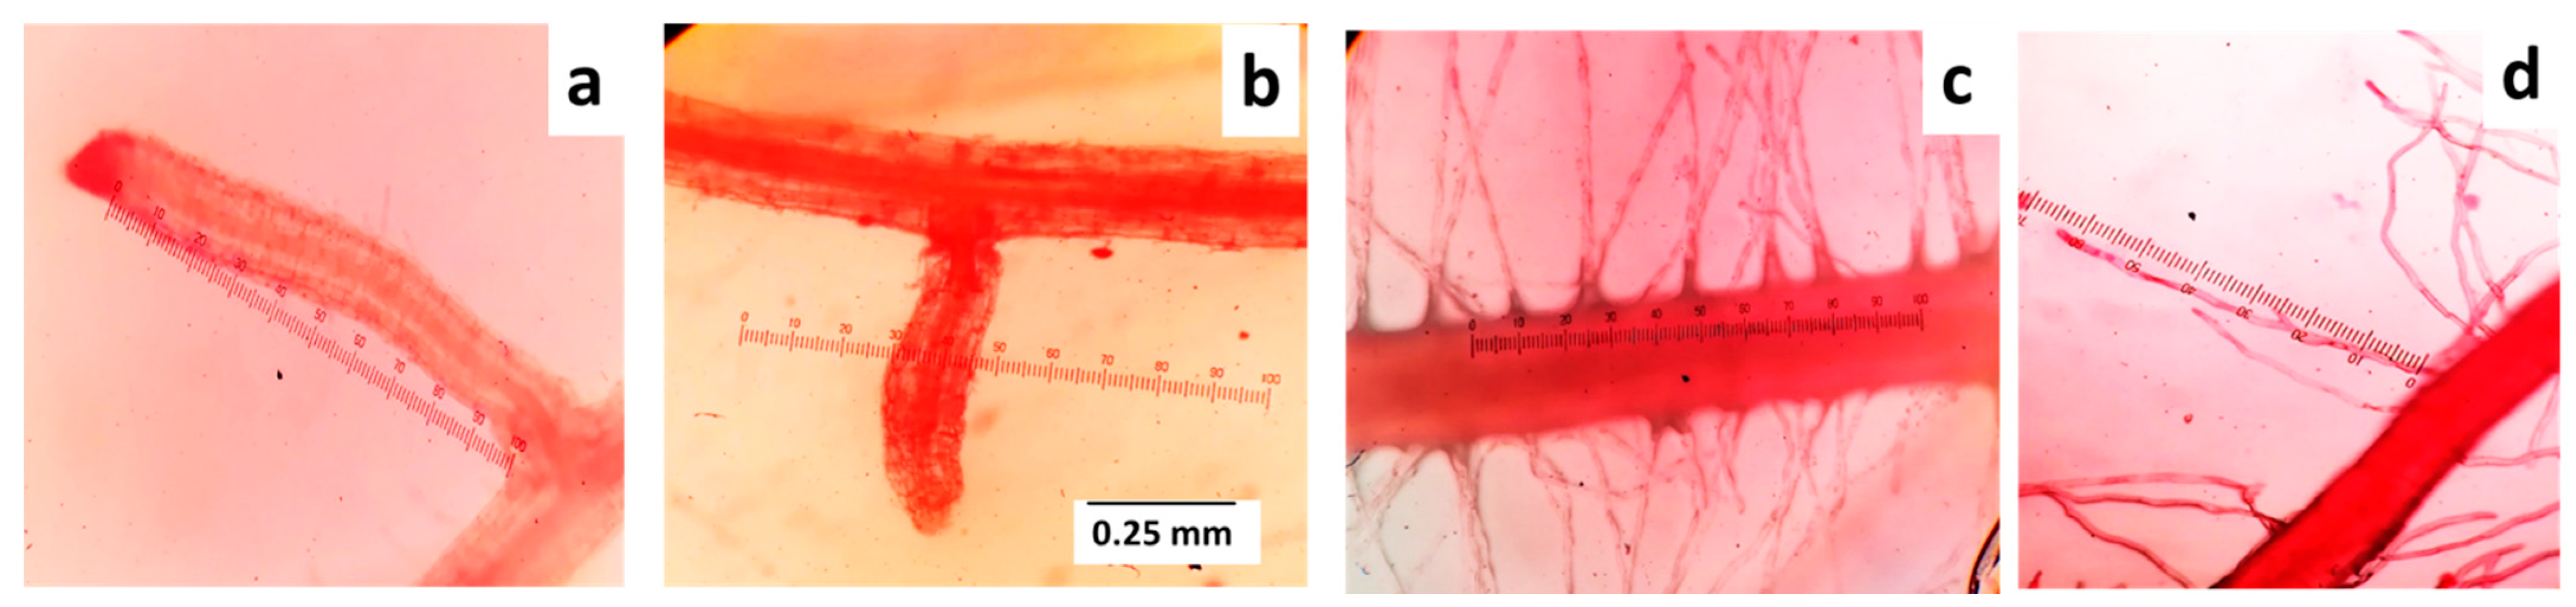
4.2. Measurements and Data Collection
4.3. Statistical Analysis of Data
5. Conclusions
Supplementary Materials
Author Contributions
Funding
Institutional Review Board Statement
Informed Consent Statement
Data Availability Statement
Acknowledgments
Conflicts of Interest
References
- United States Department of Agriculture (USDA). World Agricultural Production. Available online: https://apps.fas.usda.gov/PSDOnline/Circulars/2019/10/production.pdf (accessed on 20 January 2021).
- Zhang, J.; Zhang, S.; Cheng, M.; Jiang, H.; Zhang, X.; Peng, C.; Jin, J. Effect of drought on agronomic traits of rice and wheat: A meta-analysis. Int. J. Environ. Res. Pub. Health 2018, 15, 839. [Google Scholar] [CrossRef] [PubMed] [Green Version]
- Macharia, G.; Ngina, B. Wheat in Kenya: Past and twenty-first century breeding. Wheat Improv. Manag. Utilizat. 2017, 1. [Google Scholar] [CrossRef] [Green Version]
- Zhao, T.; Dai, A. Uncertainties in historical changes and future projections of drought. Part II: Model-simulated historical and future drought changes. Clim. Chan. 2017, 144, 535–548. [Google Scholar] [CrossRef]
- Barlow, P.W. Meristems, metamers and modules and the development of shoot and root systems. Bot. J. Linn. Soci. 1989, 100, 255–279. [Google Scholar] [CrossRef]
- Klepper, B.; Belford, R.K.; Rickman, R.W. Root and shoot development in winter wheat. Agron. J. 1984, 76, 117–122. [Google Scholar] [CrossRef]
- Bossinger, G.; Rohde, W.; Lundqvist, U.; Salamini, F.; Shewry, P.R. Barley: Genetics, biochemistry, molecular biology and biotechnology. In Genetics of Barley Development: Mutant Phenotypes and Molecular Aspects; Shewry, P.R., Ed.; CAB International: Wallingford, UK, 1992; pp. 231–263. [Google Scholar]
- Forster, B.P.; Franckowiak, J.D.; Lundqvist, U.; Lyon, J.; Pitkethly, I.; Thomas, W.T.B. The barley phytomer. Ann. Bot. 2007, 100, 725–733. [Google Scholar] [CrossRef] [Green Version]
- Robin, A.; Matthew, C.; Crush, J.R. Time course of root initiation and development in perennial ryegrass—A new perspective. N. Z. Grassl. Assoc. 2010, 72, 233–237. [Google Scholar] [CrossRef]
- Rauf, M.; Munir, M.; ul Hassan, M.; Ahmad, M.; Afzal, M. Performance of wheat genotypes under osmotic stress at germination and early seedling growth stage. Afr. J. Biotech. 2007, 6, 971–975. [Google Scholar]
- Cajero-Sanchez, W.; Aceves-Garcia, P.; Fernández-Marcos, M.; Gutiérrez, C.; Rosas, U.; García-Ponce, B.; Garay-Arroyo, A. Natural Root Cellular Variation in Responses to Osmotic Stress in Arabidopsis thaliana Accessions. Genes 2019, 10, 983. [Google Scholar] [CrossRef] [Green Version]
- Dhanda, S.; Sethi, G.; Behl, R. Indices of drought tolerance in wheat genotypes at early stages of plant growth. J. Agron. Crop Sci. 2004, 190, 6–12. [Google Scholar] [CrossRef]
- Jackson, R.B.; Sperry, J.S.; Dawson, T.E. Root water uptake and transport: Physiological processes in global predictions. Trends Plant Sci. 2000, 5, 482–488. [Google Scholar] [CrossRef]
- Kumar, N.; Nandwal, A.; Devi, S.; Sharma, K.; Yadav, A.; Waldia, R. Root characteristics, plant water status and CO2 exchange in relation to drought tolerance in chickpea. J. SAT Agric. Res. 2010, 8, 5. [Google Scholar]
- Richards, R.A.; Condon, A.G.; Rebetzke, G.J. Application of physiology in wheat breeding. In Traits to Improve Yield in Dry Environments; Reynolds, M.P., Ortiz-Monasterio, J.I., McNab, A., Eds.; CIMMYT: Apdo, Mexico, 2001; pp. 88–100. [Google Scholar]
- Ji, H.; Liu, L.; Li, K.; Xie, Q.; Wang, Z.; Zhao, X.; Li, X. PEG-mediated osmotic stress induces premature differentiation of the root apical meristem and outgrowth of lateral roots in wheat. J. Exp. Bot. 2014, 65, 4863–4872. [Google Scholar] [CrossRef] [Green Version]
- Brown, L.; George, T.; Dupuy, L.; White, P. A conceptual model of root hair ideotypes for future agricultural environments: What combination of traits should be targeted to cope with limited P availability? Ann. Bot. 2013, 112, 317–330. [Google Scholar] [CrossRef] [Green Version]
- Haling, R.E.; Simpson, R.J.; Delhaize, E.; Hocking, P.J.; Richardson, A.E. Effect of lime on root growth, morphology and the rhizosheath of cereal seedlings growing in an acid soil. Plant Soil 2010, 327, 199–212. [Google Scholar] [CrossRef]
- Brown, L.K.; George, T.S.; Thompson, J.A.; Wright, G.; Lyon, J.; Dupuy, L.; Hubbard., S.; White, P. What are the implications of variation in root hair length on tolerance to phosphorus deficiency in combination with water stress in barley (Hordeum vulgare L.)? Ann. Bot. 2012, 110, 319–328. [Google Scholar] [CrossRef]
- Bengough, A.G.; McKenzie, B.M.; Hallett, P.D.; Valentine, T.A. Root elongation, water stress, and mechanical impedance: A review of limiting stresses and beneficial root tip traits. J. Exp. Bot. 2011, 62, 59–68. [Google Scholar] [CrossRef] [Green Version]
- Manschadi, A.M.; Christopher, J.; deVoil, P.; Hammer, G.L. The role of root architectural traits in adaptation of wheat to water-limited environments. Funct. Plant Biol. 2006, 33, 823–837. [Google Scholar] [CrossRef] [Green Version]
- Palta, J.A.; Chen, X.; Milroy, S.P.; Rebetzke, G.J.; Dreccer, M.F.; Watt, M. Large root systems: Are they useful in adapting wheat to dry environments? Funct. Plant Biol. 2011, 38, 347–354. [Google Scholar] [CrossRef] [Green Version]
- Chazen, O.; Neumann, P.M. Hydraulic signals from the roots and rapid cell-wall hardening in growing maize (Zea mays L.) leaves are primary responses to polyethylene glycol-induced water deficits. Plant Physiol. 1994, 104, 1385–1392. [Google Scholar] [CrossRef] [Green Version]
- Robin, A.H.K.; Uddin, M.J.; Bayazid, K.N. Polyethylene glycol (PEG) treated hydroponic culture reduces length and diameter of root hairs of wheat varieties. Agronomy 2015, 5, 506–518. [Google Scholar] [CrossRef] [Green Version]
- Shi, G.; Xia, S.; Ye, J.; Huang, Y.; Liu, C.; Zhang, Z. PEG-simulated drought stress decreases cadmium accumulation in castor bean by altering root morphology. Environ. Exp. Bot. 2015, 111, 127–134. [Google Scholar] [CrossRef]
- Hannan, A.; Hassan, L.; Hoque, M.N.; Tahjib-Ul-Arif, M.; Robin, A.H.K. Increasing new root length reflects survival mechanism of rice (Oryza sativa L.) genotypes under PEG-induced osmotic stress. Plant Breed. Biotech. 2020, 8, 46–57. [Google Scholar] [CrossRef]
- Nupur, J.A.; Hannan, A.; Islam, M.A.U.; Sagor, G.H.M.; Robin, A.H.K. Root development and anti-oxidative response of rice genotypes under polyethylene glycol induced osmotic stress. Plant Breed. Biotech. 2020, 8, 151–162. [Google Scholar] [CrossRef]
- Baloch, M.J.; Dunwell, J.; Khakwani, A.A.; Dennett, M.; Jatoi, W.A.; Channa, S.A. Assessment of wheat cultivars for drought tolerance via osmotic stress imposed at early seedling growth stages. J. Agric. Res. 2012, 50, 299–310. [Google Scholar]
- Ayalew, H.; Ma, X.; Yan, G. Screening wheat (Triticum spp.) genotypes for root length under contrasting water regimes: Potential sources of variability for drought resistance breeding. J. Agron. Crop Sci. 2015, 201, 189–194. [Google Scholar] [CrossRef]
- Comeau, A.; Nodichao, L.; Collin, J.; Baum, M.; Samsatly, J.; Hamidou, D.; Picard, E. New approaches for the study of osmotic stress induced by polyethylene glycol (PEG) in cereal species. Cereal Res. Commun. 2010, 38, 471–481. [Google Scholar] [CrossRef]
- Volgger, M.; Lang, I.; Ovečka, M.; Lichtscheidl, I. Plasmolysis and cell wall deposition in wheat root hairs under osmotic stress. Protoplasma 2010, 243, 51–62. [Google Scholar] [CrossRef] [PubMed]
- Ahmad, P.; Prasad, M.N.V. Environmental Adaptations and Stress Tolerance of Plants in the Era of Climate Change; Springer: New York, NY, USA, 2011; p. 515. [Google Scholar]
- Robin, A.H.K.; Irving, L.J.; Khaembah, E.N.; Matthew, C. Modelling carbon fluxes as an aid to understanding perennial ryegrass (Lolium perenne) root dynamics. Agronomy 2018, 8, 236. [Google Scholar] [CrossRef] [Green Version]
- Robin, A.H.K.; Matthew, C.; Uddin, M.J.; Bayazid, K.N. Salinity-induced reduction in root surface area and changes in major root and shoot traits at the phytomer level in wheat. J. Exp. Bot. 2016, 67, 3719–3729. [Google Scholar] [CrossRef]
- Ehdaie, B.; Layne, A.P.; Waines, J.G. Root system plasticity to drought influences grain yield in bread wheat. Euphytica 2012, 186, 219–232. [Google Scholar] [CrossRef]
- Palta, J.A.; Yang, J.C. Crop root system behaviour and yield. Field Crops Res. 2014, 165, 1–149. [Google Scholar] [CrossRef]
- Marcińska, I.; Czyczyło-Mysza, I.; Skrzypek, E.; Filek, M.; Grzesiak, S.; Grzesiak, M.T.; Quarrie, S.A. Impact of osmotic stress on physiological and biochemical characteristics in drought-susceptible and drought-resistant wheat genotypes. Acta Physio. Plant. 2013, 35, 451–461. [Google Scholar] [CrossRef] [Green Version]
- Van der Weele, C.M.; Spollen, W.G.; Sharp, R.E.; Baskin, T.I. Growth of Arabidopsis thaliana seedlings under water deficit studied by control of water potential in nutrient-agar media. J. Exp. Bot. 2000, 51, 1555–1562. [Google Scholar] [CrossRef] [Green Version]
- Arnon, I. Crop Production in Dry Regions; Cambridge University Press: London, UK, 1972; p. 683. [Google Scholar]
- Kumari, A.; Sairam, R.K.; Singh, S.K.; Krishna, G.K. Early growth response: An indicator of subsequent growth and yield of wheat genotypes grown under simulated water stress condition. Indian J. Plant Physiol. 2014, 19, 94–100. [Google Scholar] [CrossRef]
- Wang, X.; Wang, N.; Rui, Q.; Zhang, P.; Xu, L. Jasmonates modulate the promotion effects induced by SNP on root development of wheat under osmotic stress through lipoxygenase activation. J. Plant Biochem. Biotech. 2013, 22, 295–303. [Google Scholar] [CrossRef]
- Ochoa, I.E.; Blair, M.W.; Lynch, J.P. QTL analysis of adventitious root formation in common bean under contrasting phosphorus availability. Crop Sci. 2006, 46, 1609–1621. [Google Scholar] [CrossRef] [Green Version]
- Ali, A.; Arshad, M.; Naqvi, S.S.; Rasheed, A.; Sher, H.; Kazi, A.G.; Mujeeb-Kazi, A. Comparative assessment of synthetic-derived and conventional bread wheat advanced lines under osmotic stress and implications for molecular analysis. Plant Mol. Biol. Repor. 2015, 33, 1907–1917. [Google Scholar] [CrossRef]
- Robin, A.H.K.; Uddin, M.J.; Afrin, S.; Paul, P.R. Genotypic variations in root traits of wheat varieties at phytomer level. J. Bang. Agri. Uni. 2014, 12, 45–54. [Google Scholar] [CrossRef] [Green Version]
- Hu, B.; Henry, A.; Brown, K.M.; Lynch, J.P. Root cortical aerenchyma inhibits radial nutrient transport in maize (Zea mays). Ann. Bot. 2014, 113, 181–189. [Google Scholar] [CrossRef] [Green Version]
- Giehl, R.F.H.; von Wirén, N. Root nutrient foraging. Plant Physiol. 2014, 166, 509–517. [Google Scholar] [CrossRef] [Green Version]
- Gahoonia, T.S.; Care, D.; Nielsen, N.E. Root hairs and phosphorus acquisition of wheat and barley cultivars. Plant Soil 1997, 191, 181–188. [Google Scholar] [CrossRef]
- Haling, R.E.; Brown, L.K.; Bengough, A.G.; Young, I.M.; Hallett, P.D.; White, P.J.; George, T.S. Root hairs improve root penetration, root–soil contact, and phosphorus acquisition in soils of different strength. J. Exp. Bot. 2013, 64, 3711–3721. [Google Scholar] [CrossRef] [Green Version]
- Ghosh, S.; Shahed, M.A.; Robin, A.H.K. Polyethylene glycol induced osmotic stress affects germination and seedling establishment of wheat genotypes. Plant Breed. Biotech. 2020, 8, 174–185. [Google Scholar] [CrossRef]
- Trejo-Téllez, L.I.; Gómez-Merino, F.C. Hydroponics—A standard methodology for plant biological researches. In Nutrient Solutions for Hydroponic Systems; Asao, T., Ed.; Intech: Rijeka, Croatia; Texcoco, Mexico, 2012. [Google Scholar]
- Ghosh, S.; Shahed, M.A.; Robin, A.H.K. Root traits differentiates osmotic stress tolerant and susceptible wheat genotypes under PEG-treatment. In Proceedings of the 1st International Electronic Conference on Plant Science, Online, 1–15 December 2020; Volume 1, p. 15. [Google Scholar]


| Sources of Variation | Traits | ||||
|---|---|---|---|---|---|
| PH | TLL | ChlC | LS4 | LS5 | |
| Treatment (T) | 1075.6 *** | 25.5 *** | 138.1 *** | 8.8 *** | 35.0 *** |
| Genotype (G) | 135.7 *** | 1.1 ** | 36.2 *** | 3.5 *** | 4.7 *** |
| T × G | 35.4 ** | 0.5 | 15.4 | 2.9 *** | 2.3 ** |
| SDW | RDW | TPr | TR | NSR | |
| Treatment (T) | 0.59 *** | 0.14 *** | 45.9 *** | 90.01 *** | 26.67 *** |
| Genotype (G) | 0.045 ** | 0.002 *** | 1.19 | 12.27 *** | 1.69 ** |
| T × G | 0.015 * | 0.0007 *** | 1.43 * | 7.25 *** | 1.705 ** |
| LSR | MALPr1 | MALPr2 | MALPr3 | MALPr4 | |
| Treatment (T) | 46.80 *** | 2.13 ** | 639.1 *** | 408.4 ** | 1534.7 ** |
| Genotype (G) | 13.63 *** | 0.72 ** | 135.12 ** | 149.2 ** | 169.9 NS |
| T × G | 7.58 ** | 0.78 *** | 118.2 * | 91.9 NS | 138.7 NS |
| MALmax | MAD | PAL | PAD | DPA | |
| Treatment (T) | 669.06 *** | 2.13 *** | 244.309 *** | 0.63 *** | 280.98 *** |
| Genotype (G) | 96.59 ** | 0.038 *** | 6.02 *** | 0.014 *** | 2.77 *** |
| T × G | 82.16 * | 0.065 *** | 5.15 *** | 0.01 *** | 3.37 *** |
| SAL | SAD | DSA | DRHMA | DRHSA | |
| Treatment (T) | 3.24 *** | 0.005 ** | 331.26 *** | 140.01 *** | 1256.64 *** |
| Genotype (G) | 0.28 *** | 0.003 *** | 11.83 *** | 17.14 *** | 12.98 *** |
| T × G | 0.51 *** | 0.003 *** | 6.93 *** | 12.87 *** | 9.79 *** |
| DRHPA | RHLPA | ||||
| Treatment (T) | 238.36 *** | 380557 *** | |||
| Genotype (G) | 16.42 *** | 93217 *** | |||
| T × G | 7.62 *** | 69821 *** | |||
| Traits | PC1 | PC2 | PC3 | PC4 |
|---|---|---|---|---|
| Plant height | −0.203 | 0.114 | 0.227 | 0.227 |
| Number of live leaves | −0.270 | 0.042 | −0.153 | 0.155 |
| Chlorophyll content | −0.265 | 0.153 | 0.183 | 0.135 |
| Leaf injury scores for the fourth leaf | 0.217 | −0.133 | −0.279 | 0.304 |
| Leaf injury scores at the fifth leaf | 0.178 | −0.179 | −0.116 | 0.322 |
| Shoot dry weight | −0.235 | 0.021 | 0.009 | 0.303 |
| Root dry weight | −0.025 | 0.406 | −0.173 | 0.103 |
| Maximum main axis length | 0.239 | 0.123 | −0.114 | 0.275 |
| Main axis diameter | 0.213 | 0.291 | −0.115 | 0.1 |
| Length of first-order lateral roots | 0.283 | 0.097 | −0.021 | −0.092 |
| Diameter of first-order lateral roots | 0.26 | 0.002 | 0.268 | 0.023 |
| Density of first-order lateral roots | 0.059 | 0.182 | 0.365 | −0.061 |
| Length of second-order lateral roots | −0.055 | 0.2 | 0.088 | −0.297 |
| Diameter of second-order lateral roots | 0.207 | 0.321 | 0.128 | −0.079 |
| Density of second-order lateral roots | 0.058 | 0.173 | 0.372 | 0.208 |
| Length of seminal roots | −0.313 | 0.163 | −0.057 | 0.121 |
| Number of phytomers per tiller | −0.305 | 0.227 | −0.102 | 0.029 |
| Number of roots | 0.09 | 0.259 | −0.367 | −0.187 |
| Number of seminal roots | −0.257 | 0.194 | −0.077 | 0.095 |
| Main root axis length at phytomer 1 | −0.032 | 0.012 | −0.382 | 0.176 |
| Root hair density on main axis | 0.135 | 0.287 | 0.182 | 0.33 |
| Density of root hairs on second-order lateral roots | 0.148 | 0.253 | −0.098 | −0.206 |
| Density of root hairs on first-order lateral roots | 0.265 | 0.137 | −0.036 | 0.259 |
| Length of root hairs on first-order lateral roots | −0.037 | 0.289 | −0.178 | −0.253 |
| P(treatment) | <0.001 | 0.425 | 0.853 | 0.728 |
| P(genotype) | 0.944 | 0.010 | 0.583 | 0.205 |
| % Variation explained | 32.2 | 17.4 | 11.9 | 9.2 |
| Eigenvalue | 7.73 | 4.17 | 2.85 | 2.22 |
| Sl. No | Genotype | Given Identity | Year Released | Yield (t ha−1) | Characteristics |
|---|---|---|---|---|---|
| 1 | Durum | V1 | Tetra-ploid wheat | — | — |
| 2 | BARI Gom-19 (Sourav) | V2 | 1998 | 3.5–4.5 | Moderately heat tolerant |
| 3 | BARI Gom-20 (Gourab) | V3 | 1998 | 3.6–4.8 | Heat sensitive |
| 4 | Sonalika * | V4 | 1974 | 3.0–3.5 | Low-yielding variety |
| 5 | Kanchan | V5 | 1983 | 3.5–4.5 | Low-yielding variety |
| 6 | Sonora-64 | V6 | 1974 | 1.6–2.2 | Low-yielding variety |
| 7 | Kalaysona | V7 | 1974 | 2.6–3.2 | Low-yielding variety |
| 8 | Triticale | V8 | Hexa-ploid | — | — |
| 9 | Kheri * | V9 | Indigenous cultivar | 2.0–2.5 | Low yielding variety |
| 10 | BARI Gom-21 (Shatabdi) | V10 | 2000 | 3.6–5.0 | Good level of tolerance to terminal heat stress |
| 11 | BARI Gom-22 (Sufi) | V11 | 2005 | 3.6–5.0 | Tolerant to late heat stress |
| 12 | BARI Gom-23 (Bijoy) | V12 | 2005 | 4.3–5.0 | Moderately heat tolerant |
| 13 | BARI Gom-24 (Prodip) | V13 | 2005 | 4.3–5.1 | High-yielding, but heat sensitive |
| 14 | BARI Gom-25 | V14 | 2010 | 3.6–5.0 | Moderate level of tolerance to heat stress |
| 15 | BARI Gom-26 | V15 | 2010 | 3.6–5.0 | Tolerant to terminal heat stress in late seeding |
| 16 | BARI Gom-27 | V16 | 2012 | 4.0–5.4 | Moderate level of tolerance to heat stress |
| 17 | BARI Gom-28 | V17 | 2012 | 4.0–5.5 | Tolerant to terminal heat stress in late seeding |
| 18 | BARI Gom-29 | V18 | 2014 | 4.0–5.0 | Moderately tolerant to terminal heat stress |
| 19 | BARI Gom-30 | V19 | 2014 | 4.5–5.5 | Resistant to stem rust race, Ug 99 and leaf rust and moderately resistant to Bipolaris leaf blight disease |
| 20 | BARI Gom-31 | V20 | 2017 | 4.5–5.0 | Resistant to leaf rust and moderately resistant to Bipolaris leaf blight disease |
| 21 | BARI Gom-32 | V21 | 2017 | 4.6–5.0 | High yielding, early in maturity and tolerant to terminal heat stress, leaf rust, and tolerant to Bipolaris leaf blight disease |
| 22 | BARI Gom-33 | V22 | 2017 | 4.0–5.0 | Zn enriched (55–60 ppm) and tolerant to wheat blast disease |
| Types of Variable | Traits | Number of Data Recorded per Genotype | Data Availability (Supplementary Data File) | Unit |
|---|---|---|---|---|
| Number of roots | Number of seminal roots (NSR) | 2 | File S1 | no. |
| Total number of roots (TR) per tiller | 2 | File S1 | no. | |
| Total number of phytomer (TPr) per tiller | 2 | File S1 | no. | |
| Length | Main axis length at the root-bearing phytomer position (Pr) 1 and 4 | 2 | File S1 | cm |
| Length of first-order lateral roots (PAL) | 10 | File S1 | cm | |
| length of second-order lateral roots (SAL) | 10 | File S1 | cm | |
| Length of seminal roots (LSR) | 10 | File S1 | cm | |
| Diameter | Main axis diameter (MAD) | 10 | File S1 | mm |
| Diameter of first-order lateral roots (PAD) | 10 | File S1 | mm | |
| Diameter of second-order lateral roots (SAD) | 10 | File S1 | mm | |
| Density | Density of first-order lateral roots (DPA) | 10 | File S1 | no. mm−1 |
| Density of second-order lateral roots (DSA) | 10 | File S1 | no. mm−1 | |
| Root hair traits | Density of root hairs of main axis (DRHMA) | 5 | File S2 | no. mm−1 |
| Density of root hairs of second-order lateral roots (DRHSA) | 5 | File S2 | no. mm−1 | |
| Density of root hairs of first-order lateral roots (DRHPA) | 5 | File S2 | no. mm−1 | |
| Length of root hairs of first-order lateral roots (RHLPA) | 5 | File S2 | µm |
Publisher’s Note: MDPI stays neutral with regard to jurisdictional claims in published maps and institutional affiliations. |
© 2021 by the authors. Licensee MDPI, Basel, Switzerland. This article is an open access article distributed under the terms and conditions of the Creative Commons Attribution (CC BY) license (https://creativecommons.org/licenses/by/4.0/).
Share and Cite
Robin, A.H.K.; Ghosh, S.; Shahed, M.A. PEG-Induced Osmotic Stress Alters Root Morphology and Root Hair Traits in Wheat Genotypes. Plants 2021, 10, 1042. https://doi.org/10.3390/plants10061042
Robin AHK, Ghosh S, Shahed MA. PEG-Induced Osmotic Stress Alters Root Morphology and Root Hair Traits in Wheat Genotypes. Plants. 2021; 10(6):1042. https://doi.org/10.3390/plants10061042
Chicago/Turabian StyleRobin, Arif Hasan Khan, Shatabdi Ghosh, and Md. Abu Shahed. 2021. "PEG-Induced Osmotic Stress Alters Root Morphology and Root Hair Traits in Wheat Genotypes" Plants 10, no. 6: 1042. https://doi.org/10.3390/plants10061042