Abstract
Ralstonia solanacearum is the pathogen responsible for wilting, yield losses, and death in tomato plants. The use of resistant cultivars has been proven as the most appropriate solution to controlling this pathogen. Therefore, further study of host-plant resistance mechanisms in tomatoes is urgently needed. 1H-NMR (nuclear magnetic resonance) spectroscopy combined with multivariate data analysis has been used to identify the biochemical compounds that play a crucial role in the defense mechanisms of tomato against bacterial wilt. Eleven metabolites consisting of amino acids, sugars and organic acids were identified and presented at different concentrations in each cultivar. Leucine and valine were determined as distinguishable metabolites of resistant and susceptible cultivars. Permata and Hawaii 7996 as resistant cultivars had a significant decrease of valine after inoculation about 1.5–2 times compared to the susceptible cultivar (GM2). Meanwhile, the resistant cultivars had a higher level of leucine, about 1.3–1.5 times compared to the susceptible ones. Synthesis of leucine and valine are linked as a member of the pyruvate family. Therefore, the decrease in valine may be related to the higher need for leucine to form the leucine-rich receptor, which plays a role in the plant’s immune system against the bacterial wilt.
Keywords:
bacterial wilt; defense mechanism; leucine; metabolites; nuclear magnetic resonance; tomato; valine 1. Introduction
Bacterial wilt caused by the soil-borne pathogen Ralstonia solanacearum is responsible for the greatest economic losses in tomato production [1]. This bacterium has a wide host plants and causes severe yield losses in many crops, including tomato, eggplants, tobacco, potato, and other important crops [2]. R. solanacearum colonizes the root surface, attacks the plant through the xylem vessel, degrades the cell wall by releasing the enzymes cellulase and pectinase, and then inhibits nutrient and water translocation [3]. In severe attacks, R. solanacearum causes wilting, chlorosis, and death of tomato plants [4].
Ralstonia solanacearum can survive for a long period in the soil, which infects a broad plant species and wide geographical distribution, making pathogen prevention difficult. Bactericides used to control bacterial wilt are harmful to humans, food, and the environment. The use of biological control and resistant plants are the recommended means of reducing toxicity and residual effects [5]. The use of resistant varieties is considered less expensive and more environmentally friendly [6]. The resistance mechanism of tomato to bacterial wilt often involves biochemical defense mechanisms [7]. This mechanism includes the production of various biochemical compounds that have a negative effect on R. solanacearum.
Lowe-Power et al. [8] reported the involvement of R-genes in tomato plants resistant to bacterial wilt. R-genes induce the cell to produce a set of biochemical compounds that activate the immune system. These compounds prevent infection by facilitating metabolomic changes, including the production of primary and secondary metabolites related to defense systems [7]. These biochemical changes can be studied by metabolomics analysis. Metabolomics gives information about omics technology, revealing the total of primary and secondary metabolites in biological systems [9]. Zeiss et al. [7] used a metabolomics approach to identify the secondary metabolites in the tomato cultivars resulting from breeding programs with tomato plants infected by R. solanacearum using LC-MS. Nuclear magnetic resonance (NMR) based metabolomics has been applied successfully to determine the metabolites responsible for root-knot nematode resistance in tomatoes [10]. Bisht et al. [11] explained the advantage of using NMR spectroscopy to investigate tomato plant resistance to pests and diseases, as the technique is non-destructive, has high sensitivity and is highly reproducible. For these reasons, it is considered a suitable approach for detecting plant-biotic interactions [12].
A review study of Galeano Garcia et al. [13] stated several studies have reported on host-plant resistance to tomato plant diseases. Most of them, such as Zeiss et al. [7], used a reductionist approach by applying several analyses or technologies to detect metabolites and different plant cultivars. In this study, we applied NMR metabolomics analysis to revisit the chemical defense mechanisms of tomato to bacterial wilt caused by R. solanacearum.
2. Results
2.1. Disease Symptoms in Plants of Three Cultivars
Disease intensity scores showed that the three cultivars differed in their resistance levels to R. solanacearum, and two groups could be distinguished (Figure 1). The first group was resistant cultivars, including Permata and Hawaii 7996, with a DI value of 13.1% and 4.76%, respectively. In contrast, GM2 was categorized as a highly susceptible cultivar with a DI value of 86.31%.
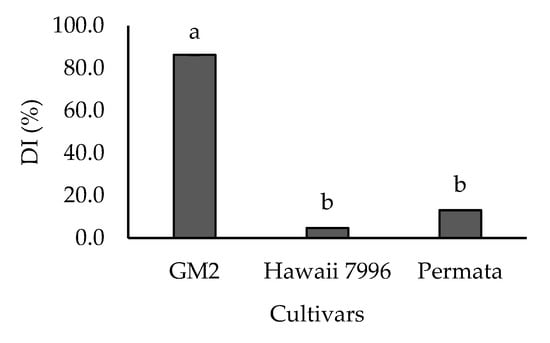
Figure 1.
Disease Intensity (DI) of three cultivars tomatoes treated with Ralstonia solanacearum. Bars with the same letter were not significantly different at p = 0.05 based on Tukey’s HSD tests. Bars show the average disease intensity from 5 replicates.
2.2. Plant Metabolomics
The 1H-NMR spectra obtained from tomato leaf extract are shown in Figure 2. These spectra were processed by Mnova software using a semi-quantitative analysis and based on metabolite data from the references of previous studies [10]. Eleven primary metabolites were identified, including am ino acids, organic acids, and sugar groups (Table 1).
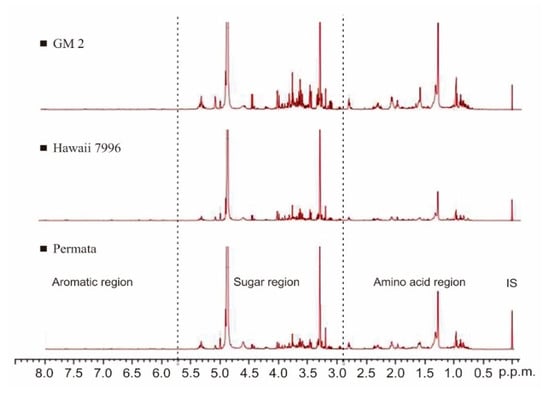
Figure 2.
1H-NMR spectra of tomatoes show different peak intensities among three cultivars. IS: internal standard TMS.

Table 1.
Peak assignments for the 1H-NMR spectrum of tomato leaf in Methanol-d4 (MeOD4).
The identified metabolites consisted of leucine, placed in the region of δ 0.94 with d, J = 0.7 Hz; valine (δ 1.00 [d, J = 7.0 Hz]) and (δ 1.05, [d, J = 7.0 Hz]; alanine (δ 1.45 [d, J = 7.2 Hz]); acetic acid (δ 1.95 [s]); γ-amino-butyric acid (GABA) (δ 1.88 [m], 2.37 [t, J = 7.2 Hz], and 2.96 [t, J = 7.08 Hz]); ethanolamine (δ 3.12, [t, J = 5.5 Hz]); Choline δ (3.19, [s]); Glycine (δ 3.5 [s]); β-glucose in the region δ 4.45 (d, [J = 7.8 Hz]); and α-glucose in the region δ 5.09 (d, [J = 3.76 Hz]) (Table 1). These metabolites varied in concentration between cultivars (Figure 3a). The Variable Importance in Projection (VIP) of defined metabolites shown in Figure 3b indicated that resistant cultivars had a higher concentration of leucine and glycine than susceptible ones. In contrast, susceptible cultivars had higher levels of valine, α-glucose, β-glucose, GABA (γ-amino-butyric acid), ethanolamine, acetic acid, choline, succinate, and alanine than resistant cultivars. The most promising metabolites with VIP values higher than 1.5 allowed identification of two important amino acids valine and leucine.
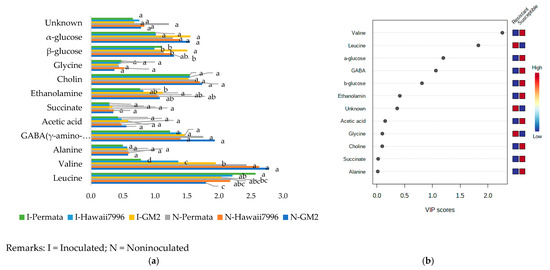
Figure 3.
The concentration of peak assignment of tomato metabolites (a) and Variable Importance in Projection (VIP) of defined metabolites (b). Bars with the same letter in each group were not significantly different at p = 0.05 based on Tukey’s HSD tests.
The results of the 1H-NMR data analysis described different metabolites between resistant and susceptible cultivars in the scores plot (Figure 4a) and loading plot (Figure 4b). Before processing using multivariate data analysis, the data has been normalized with a feature-wise normalization i.e., auto scaling. This model explained 69.9% (PC1) and 23.1% (PC2) variation of the data and had a variance of the response R2 = 0.94 and a predictive ability Q2 = 0.88 (Figure 5a). The model was validated using a permutation test statistic, giving p < 0.05, as shown in Figure 5b. R2 is explained the calibration of model samples. However, Q2 described an estimate of the predictive ability of the model. Based on a study by Bevilacqua and Bro [14], when R2 and Q2 had a sufficiently small difference, the score plot models displayed a meaningful result. Therefore, it is clear that the result implied a good model.
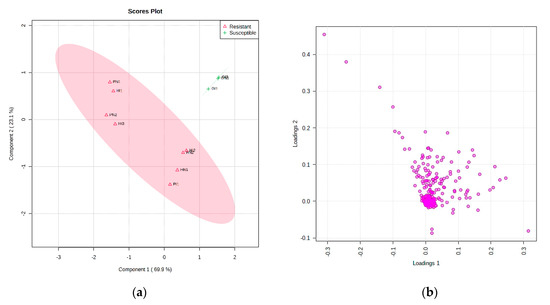
Figure 4.
Scores (a) and loadings (b) of resistant and susceptible cultivars tomatoes with inoculation and non-inoculation. Non-inoculation of GM2 (GN), inoculation of GM2 (GI), Non-inoculation of Hawaii 7996 (HN), inoculation of Hawaii 7996 (HI), Non-inoculation of Permata (PN), inoculation of Permata (PI).
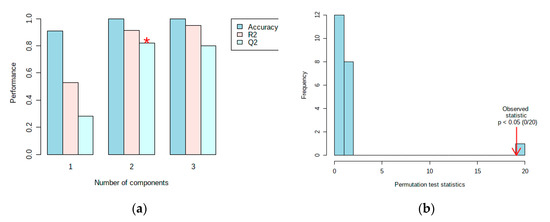
Figure 5.
Validation of the PLS-DA model showing the variance of the response and predictive ability of the model (a) and a permutation test statistic (b). (*) indicates the optimal number of components included in order to make this model work.
The scores plot depicted perfect separation of resistant and susceptible cultivars, indicating that several metabolites play a role in the discrimination of these cultivars. However, some undefined metabolites that were also distinguishable between resistant and susceptible cultivars were presented clearly in the VIP (Figure 6). These metabolites were shortlisted among the top 9 with the highest concentration. VIP described that metabolites with chemical shifts at δ 5.02, δ 1.31, δ 5.06, δ 3.79, δ 1.35, δ 3.66, δ 1.62, δ 2.1, and δ 5.098 were sufficiently clear to differentiate between tomato resistant and susceptible to R. solanacearum. Moreover, resistant cultivars had higher levels of metabolites in the chemical shifts of δ 5.02, δ 5.06, and δ 5.098. In contrast, susceptible cultivars had higher levels of metabolites in the regions of δ 1.3, δ 3.78, δ 1.35, δ 3.67, δ 1.62, and δ 2.1.
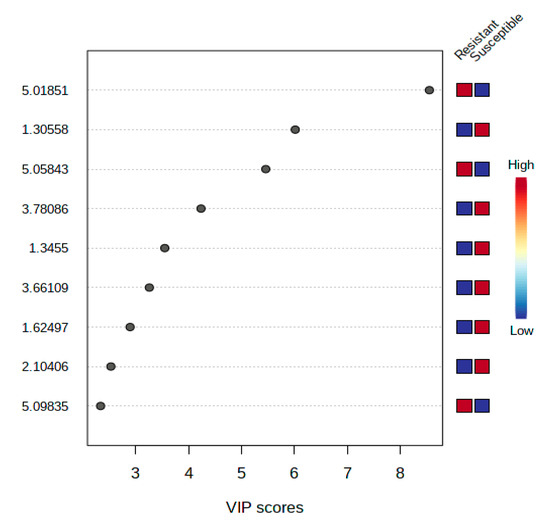
Figure 6.
Variable Importance in Projection (VIP) of the metabolites in the top nine by the highest concentration.
Statistical analysis of 11 identified metabolites resulted that valine and leucine had a significant difference between resistant and susceptible cultivars based on Tukey’s HSD test with α = 5% (Figure 7). The histogram of valine presented in Figure 7a indicated that inoculation treatment decreased the valine concentration of resistant and susceptible cultivars. However, the fall of the valine level in the resistant cultivars (Hawaii 7996 and Permata) was higher than the susceptible cultivar (GM2). Valine concentration in the susceptible cultivars GM2 decreased 30 % from 2.78 nmol (mg dry weight)−1 to 1.95 nmol (mg dry weight)−1. Meanwhile, in the resistant cultivar (Hawaii 7996) decreased 48 % from 2.63 nmol (mg dry weight)−1 to 1.36 nmol (mg dry weight)−1. Furthermore, a resistant cultivar (Permata) decreased 68 % from 2.43 nmol (mg dry weight)−1 to 0.78 nmol (mg dry weight)−1.
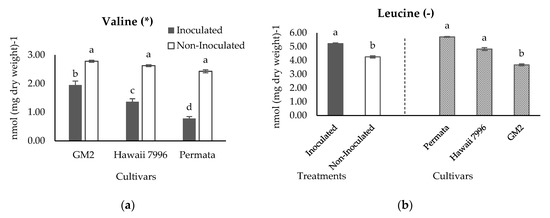
Figure 7.
Concentration of Valine (a) and Leucine (b) in three cultivars tomatoes inoculated and non inoculated with Ralstonia solanacearum. Bars with the same letter in each group were not significantly different at p = 0.05 based on Tukey’s HSD tests. (*) indicates a significant interaction between treatments and cultivars; (-) indicates no significant interaction between treatments and cultivars; therefore, the histogram is separated between treatments and cultivars. Valine has the pcultivars = < 0.0001, ptreatments = < 0.0001, pcultivars × treatments = 0.0016. Leucine has the pcultivars = 0.0005, ptreatments = 0.0075, pcultivars × treatments = 0.1588.
The statistical analysis of leucine concentrations did not show an interaction between treatments and cultivars (Figure 7b). In consequence, leucine was evaluated separately between treatments and cultivars. The result revealed a rise in leucine after inoculation treatment. Meanwhile, Permata had a significantly higher level of leucine at 5.71 nmol (mg dry weight)−1, compared with the susceptible cultivar (GM2) at 3.68 nmol (mg dry weight)−1. A higher level of leucine was consistently observed in Hawaii 7996, a resistant cultivar, at 4.83 nmol (mg dry weight)−1. This result suggested that leucine is one of the metabolites that affected the distinction between resistant and susceptible cultivars. Permata, the most resistant cultivar, had a higher concentration of leucine, followed by Hawaii 7996, and the lowest was the susceptible cultivar GM2. Interestingly, leucine and valine showed a negative correlation at −0.68 analysed using Pearson correlation. This may underline that both amino acids are a member of the pyruvate family in terms of their biosynthesis.
3. Discussion
Based on the disease intensity criteria, according to Aslam et al. [3], Hawaii 7996 and Permata are the most resistant plants against R. solanacearum. Based on a previous study by Truong and Wang [15], plants possess physical and chemical barriers, which allow them to mount a counterattack against pathogens such as fungi, nematodes, viruses, and bacteria. Resistant plants develop an immune system comprising several structural, biochemical, and protein-based defense systems to intercept pathogen invasion, including microbes, pests and herbivores [16]. Resistant plants involve highly complex biochemical defense mechanisms [17], including primary and secondary metabolites produced by inductive and defensive. Isah [18] explained that the defensive system in the plant had a relationship through the metabolite product, such as hypersensitive reaction, protein synthesis, and production of some phytoalexin.
Based on the identified metabolites successfully found in this study, several metabolites strongly differentiated between two resistant and one susceptible plants against R. solanacearum. These metabolites were identified as leucine, valine, and other unknown signals which placed in the region of 5.02, δ 1.31, δ 5.06, δ 3.79, δ 1.35, δ 3.66, δ 1.62, δ 2.1, and δ 5.098. Indeed, this study found that resistant cultivars had a higher concentration of leucine and metabolites in the chemical shifts of δ 5.02, δ 5.06, and δ 5.098. These metabolites strongly contributed to the separation between resistant and susceptible cultivars. This finding might indicate that leucine allegedly plays an important role in the tomato resistance to R. solanacearum. Indeed, leucine was reported to act as an essential element in antibacterial activity in the resistance mechanism [19]. In that study, leucine was demonstrated essential for antimicrobial activity by incorporated with a cationic charge into amino acid-based polymers. Mukherjee et al. [20] reported that the side-chain amino acid-based cationic polymers with pendant leucine moieties indicated efficient antibacterial activity.
Moreover, the role of leucine in conferring resistance to bacterial wilt was reported by Padnabhan et al. [21]. The study described that leucine-rich repeat (LRR) plays a role in the immune receptors. Leucine-rich repeat could recognize microbe-associated molecular pattern (MAMPs) and induce the plant immune response that inhibits pathogen access by various chemical and physical barriers. This in line with the study of Yuan et al. [22] and Chakraborty et al. [23]. The Leucine-rich repeat (LRR)-RLKs were identified to have a fundamental role in plant immunity and have function in signal transduction pathway upon the pathogen invasion. Thus, the leucine metabolic pathway constitutes an essential part of the plant immune system [24].
In addition, leucine is one of the amino acids that have a crucial role in the plant metabolism system, including contribution to the defense system. Fan et al. [25] also explained that many plant defensive compounds were derived from an amino acid, such as glucosinolates, a secondary metabolite produced by Brassicales to protect from a fungal pathogen, bacteria, and insect. Aliphatic glucosinolates are derived from alanine, leucine, valine, isoleucine, and methionine. Higher concentration of leucine upon infection with Pseudomonas syringae in Arabidopsis thaliana suggests the importance of this amino acid in the defense system mechanism in plants [26]. Hence, Zeiss et al. [7] also underlined the branched-chain amino acids (BCAA), including isoleucine, leucine, and valine, contribution to the pre-existing secondary metabolite for the plant defense system. The secondary metabolites associated with host-plant resistance are influenced by amino acids that modulate to cross-talk of jasmonic acid (JA) and salicylic acid (SA). JA and SA are known as secondary metabolites-derived signals that regulate plant stress responses [27].
Besides leucine, another amino acid that contributes to the separation between resistant and susceptible cultivars was valine. This study revealed that inoculation with R. solanacearum lowered valine concentration in both resistant and susceptible cultivars. Valine is one of the amino acids that isare important for the plant metabolism system. Mikkelsen and Halkier [28] explained that numbers of amino acids included valine, alanine, leucine, isoleucine, methionine, phenylalanine, tyrosine, and tryptophan generate glucosinolates which had great potential for improving resistance against herbivores and other pathogens. Furthermore, as part of the BCAA, both valine and leucine share a similar biosynthesis pathway, the pyruvate-family amino acid [29]. Thus, it may explain the negative correlation between valine and leucine. When the plant synthesis a high concentration of leucine, then a lower concentration of valine may occur as a consequence of having similar precursors.
Another interesting point is that several metabolites (a group of undefined metabolites) also contributed to the separation between resistant and susceptible varieties. Furthermore, according to Al Sinani and Eltayeb [30], generally, plants have the ability to involve and adapting several metabolites for improving a wide range of resistance mechanisms toward pathogens. For instance, plants synthesized and developed various biochemical compounds to counterattack the infection of the pathogen. Many studies had been reported the secondary metabolites associated with R. solanacearum. These metabolites vary in each genotype and are based on the method used to detect metabolomic in that plant. Zeiss et al. [7] studied tomato-host-plant resistance to R. solanacearum. In that study, they observed that flavonoids, HBAs, and HCAs had important roles in the defense mechanism of tomato against R. solanacearum.
4. Materials and Methods
4.1. Bacterial Inoculum
This research used bacterial wilt (R. solanacearum), race 1 and biovar 3, which was obtained from the culture collection of Plant Protection Laboratory, Faculty of Agriculture, Universitas Gadjah Mada, Yogyakarta, Indonesia. It had been collected from wilted tomato plants from Seyegan sub-district, Sleman district, Yogyakarta, Indonesia. Firstly, infected tomato plants were cleaned with distilled water, the stem cut into 0.5 cm and sterilized with alcohol 70%, followed by soaking into sterile water for 10 min. The bacterial suspension was streaked into YPGA (yeast peptone glucose agar) media containing yeast extract (5 g), 10 g peptone and glucose, 15 g agar in 1 L distilled water and then incubated for 48 h. Furthermore, the bacteria cells were suspended in sterile distilled water, and the density of inoculum was set to 1 × 10⁸ cfu·mL−1 [31].
4.2. Plant Materials
Three tomato cultivars, GM2, Permata, and Hawaii 7998 were used in this study. GM2 is a cultivar owned by the Faculty of Agriculture, Universitas Gadjah Mada. It was used as the susceptible cultivar, as it is known to have a high susceptibility to R. solanacearum, as reported by Maulida et al. [32]. Permata is a commercial tomato hybrid produced by a private company, East West Seed Indonesia, Purwakarta, West Java, Indonesia. Based on the cultivar description, this hybrid is resistant to bacterial wilt caused by R. solanacerum [33]. Hawaii 7996 is a cultivar introduced from World Vegetable Center (WVC), previously identified as resistant to R. solanacearum [34].
4.3. Experimental Procedure
The study was carried out in a greenhouse, Faculty of Agriculture, Universitas Gadjah Mada. Tomato seeds were sown in the sterile media added nitrogen, phosphorus, and potassium (NPK) fertilizer (1:1:1) with a ratio of 1:50 (w/w) (fertilizer and sterile soil). Twenty-one days after germination, these plants were moved into polybag 130 × 130 mm individually. Seven days after transplanting, tomato plants were inoculated with bacterial wilt (100 mL per plant). Before infection, tomato roots were injured by the knife through plant media and then 100 mL of inoculum solution with a density of 1 × 10⁸ cfu·mL−1 was poured into the wounded area to make infection through the plant.
Observation and scoring of the disease symptoms were based on Chen et al. [35]; 1 = no symptoms, 2 = Less than a half of leaves wilted, 3 = a half of leaves being wilted, 4 = All of leaves wilted, 5 = whole the plant wilted and dead. Furthermore, the disease intensity was used as a classification of plant resistance. Cultivars have a disease intensity of 0–20% were categorized as high resistant (HR), 21–30 was Resistant, 31–40% was Moderately Resistant (MR), 41–50 was Moderately Susceptible (MS), 51–60 was Susceptible (S), 61–90 was Highly Susceptible (HS), and 91–100 was Extremely Susceptible (ES) [6]. Hence, DI was calculated using the formula of Chen et al. [35]:
Remarks: = A sum from ratings of all plants scored at 1–2, e.g., 3C + 4D + 5E), whereas A, B, C, D, and E were a total of the plants that categorized at score 1, 2, 3, 4, and 5; N = The number of inoculated plants; 5 = the highest category of symptom scale.
The leaves of plants were harvested 14 days after R. solanacearum inoculation. Leaves were collected 5 g per plant for freez drying process. The leaves were ground with mortar and pestle in liquid nitrogen then immediately sent to freeze drier for 48 h and then taken about 50 mg for NMR analysis The method used in this study was based on the modification of Schripsema and Dagnino [36].
4.4. Statistical Analysis
This study was arranged in a Split Plot Design with the cultivars served as the main factor (GM2 vs. Permata vs. Hawaii 7998) and the bacterial infection as a sub-factor (Healthy vs. infected). The collected data (Disease intensity and the semi-quantitative concentration of identified metabolites) were statistically analysed by analysis of variance (ANOVA) and continuous with Tukey’s HSD test for determining the significant difference with α = 5%. Furthermore, the multivariate data were performed using Partial Least-Squares Discriminant Analysis (PLS-DA) by MetaboAnalyst Software version 5.0 (www.metaboanalyst.ca accessed on 27 May 2021).
4.5. 1H-NMR Measurement
NMR conditions were based on López-Gresa et al. [37] modified by Afifah et al. [10]. Approximately 50 mg freeze-dried tomato leaves were used for 1H-NMR analysis. Each of the samples was placed into a 2 mL Eppendorf tube, added 1 mL of deuterated methanol (CD3OD) containing 0.05% of internal standard (trimethyl silyl-3-propionic acid (C6H14O2Si)). The tubes were vortexed for 1 min and sonicated for 20 min. Subsequently, the tubes were centrifuged at 13,000 rpm for 10 min. Approximately ~800 μL of the supernatant was transferred into the NMR tube for 1H-NMR measurement using a 500 MHz ECZR-JEOL NMR spectrometer (JEOL USA Inc., Peabody, MA, USA). Each NMR spectra was recorded at 30 °C, 128 scans, 26 s acquisition time, 0.16 Hz per point, with pulse’ width of 30 and relaxation delay of 1.5 s.
4.6. Data Quantification
Spectra from 1H-NMR were analysed using Mnova software version 11 from Mestrelab Research (Timber Glen, Escondido, CA, USA) for metabolites identification and semi-quantitative analysis following the published data of Kim et al. [38], López-Gresa et al. [37], and Escudero et al. [39]. Previously, the spectra were manually corrected, phased, and baselined correction. Furthermore, an internal standard (trimethyl silyl-3-propionic acid (C6H14O2Si)) was calibrated by setting at 0.0 ppm. Residual water in a range of δ 4.7–4.9 and methanol in a range of δ 3.28–3.34 was excluded from the analysis.
5. Conclusions
1H-NMR is the appropriate metabolomic study to reveal the biochemical compounds that associated to the defense mechanism in the tomato plants against R. solanacearum. This study identified that leucine, valine, and other metabolites which placed in the region of 5.02, δ 1.31, δ 5.06, δ 3.79, δ 1.35, δ 3.66, δ 1.62, δ 2.1, and δ 5.098 were alleged to differentiate between resistant and susceptible tomato against R. solanacearum. Leucine dominated in the resistant plant (Permata). Meanwhile, resistant cultivars had a significant decrease of valine after inoculation about 1.5–2 times compared to the susceptible cultivar. Leucine is alleged to contribute to the immune system and the existence of secondary metabolites for defense systems in plants toward bacterial wilt.
Author Contributions
Conceptualization, R.H.M.; methodology, E.N.A. and T.R.N.; software, T.R.N.; validation, R.H.M., T.R.N. and E.N.A.; formal analysis, T.R.N. and E.N.A.; investigation, R.H.M.; resources, E.N.A.; data curation, R.H.M. and T.R.N.; writing—original draft preparation, R.H.M. and E.N.A.; writing—review and editing, R.H.M., T.R.N. and E.N.A.; visualization, T.R.N.; supervision, R.H.M. and T.R.N.; project administration, E.N.A.; funding acquisition, R.H.M. All authors have read and agreed to the published version of the manuscript.
Funding
This research did not receive an external funding.
Institutional Review Board Statement
Not applicable.
Informed Consent Statement
Not applicable.
Data Availability Statement
The data presented in this study are available within the article.
Acknowledgments
A big thank you is given to the Faculty of Agriculture, Universitas Gadjah Mada for supporting this research and facilitating it in full. We are also grateful to the Ministry of Research, Technology and Higher Education for supporting the financial research and Ir. Triwidodo Arwiyanto for giving the inoculum of R. solanacearum.
Conflicts of Interest
The authors declare no conflict of interest.
References
- Baichoo, Z.; Jaufeerally-Fakim, Y. Ralstonia solanacearum upregulates marker genes of the salicylic acid and ethylene signaling pathways but not those of the jasmonic acid pathway in leaflets of Solanum lines during early stage of infection. Eur. J. Plant Pathol. 2017, 147, 615–625. [Google Scholar] [CrossRef]
- Peeters, N.; Guidot, A.; Vailleau, F.; Valls, M. Ralstonia solanacearum, a widespread bacterial plant pathogen in the post-genomic era. Mol. Plant Pathol. 2013, 14, 651–662. [Google Scholar] [CrossRef]
- Raza, W.; Ling, N.; Yang, L.; Huang, Q.; Shen, Q. Response of tomato wilt pathogen Ralstonia solanacearum to the volatile organic compounds produced by a biocontrol strain Bacillus amyloliquefaciens SQR-9. Sci. Rep. 2016, 6, 24856. [Google Scholar] [CrossRef] [PubMed]
- Singh, S.; Singh, D.R.; Kumar, K.; Birah, A. Eco-friendly management modules for bacterial wilt (Ralstonia solanacearum) of tomato for protected cultivation in a tropical Island ecosystem. Biol. Agric. Hortic. 2014, 30, 219–227. [Google Scholar] [CrossRef]
- Hong, Y.; Liu, S.P.; Zhu, Y.P.; Xie, C.; Jue, D.W.; Chen, M.; Kaleri, H.A.; Yang, Q. Expression of the MSI-99 m gene in transgenic potato plants confers resistance to Phytophthora infestans and Ralstonia solanacearum. Plant Mol. Biol. Rep. 2013, 31, 418–424. [Google Scholar] [CrossRef]
- Aslam, M.N.; Mukhtar, T.; Hussain, M.A.; Raheel, M. Assessment of resistance to bacterial wilt incited by Ralstonia solanacearum in tomato germplasm. J. Plant Dis. Prot. 2017, 124, 585–590. [Google Scholar] [CrossRef]
- Zeiss, D.R.; Mhlongo, M.I.; Tugizimana, F.; Steenkamp, P.A.; Dubery, I.A. Metabolomic profiling of the host response of tomato (Solanum lycopersicum) following infection by Ralstonia solanacearum. Int. J. Mol. Sci. 2019, 20, 3945. [Google Scholar] [CrossRef]
- Lowe-Power, T.M.; Hendrich, C.G.; Roepenack-Lahaye, E.V.; Li, B.; Wu, D.; Mitra, R.; Dalsing, B.L.; Ricca, P.; Naidoo, J.; Cook, D.; et al. Metabolomics of tomato xylem sap during bacterial wilt reveals Ralstonia solanacearum produces abundant putrescine, a metabolite that accelerates wilt disease. Environ. Microbiol. 2018, 20, 1330–1349. [Google Scholar] [CrossRef]
- Courant, F.; Antignac, J.P.; Dervilly-Pinel, G.; Le Bizec, B. Basics of mass spectrometry-based metabolomics. Proteomics 2014, 14, 2369–2388. [Google Scholar] [CrossRef]
- Afifah, E.N.; Murti, R.H.; Nuringtyas, T.R. Metabolomics approach for the analysis of resistance of four tomato genotypes (Solanum lycopersicum L.) to root-knot nematodes (Meloidogyne incognita). Open Life Sci. 2019, 14, 141–149. [Google Scholar] [CrossRef]
- Bisht, H.; Bhagat, D.; Bhatnagar, M.K. Metabolic profiling of tomatoes with pest infestation using GC-MS and NMR spectroscopy. IJPPR 2014, 6, 550–556. [Google Scholar]
- Leiss, K.A.; Choi, Y.H.; Verpoorte, R.; Klinkhamer, P.G. An overview of NMR-based metabolomics to identify secondary plant compounds involved in host plant resistance. Phytochem. Rev. 2011, 10, 205–216. [Google Scholar] [CrossRef] [PubMed]
- Garcia, G.P.; Neves dos Santos, F.; Zanotta, S.; Eberlin, M.N.; Carazzone, C. Metabolomics of Solanum lycopersicum infected with Phytophthora infestans leads to early detection of Late Blight in asymptomatic plants. Molecules 2018, 23, 3330. [Google Scholar] [CrossRef]
- Bevilacqua, M.; Bro, R. Can we trust score plots? Metabolites 2020, 10, 278. [Google Scholar] [CrossRef]
- Truong, T.H.H.; Esch, E.; Wang, J.F. Screening of wild tomato germplasm for resistance to race 1 strain of Ralstonia solanacearum. In Proceedings of the Second International Symposium on Tomato Diseases, Kusadasi, Turkey, 8–12 October 2007. [Google Scholar]
- Doughari, J.H. An overview of plant immunity. J. Plant Pathol. Microbiol. 2015, 6, 11. [Google Scholar]
- Karre, S.; Kumar, A.; Dhokane, D.; Kushalappa, A.C. Metabolo-transcriptome profiling of barley reveals induction of chitin elicitor receptor kinase gene (HvCERK1) conferring resistance against Fusarium graminearum. Plant Mol. Biol. 2017, 93, 247–267. [Google Scholar] [CrossRef] [PubMed]
- Isah, T. Stress and defense responses in plant secondary metabolites production. Biol. Res. 2019, 52, 39. [Google Scholar] [CrossRef]
- Ji, E.; Parthasarathy, A.; Corbitt, T.S.; Schanze, K.S.; Whitten, D.G. Antibacterial activity of conjugated polyelectrolytes with variable chain lengths. Langmuir 2011, 27, 10763–10769. [Google Scholar] [CrossRef]
- Mukherjee, I.; Ghosh, A.; Bhadury, P.; Priyadarsi-De, Y. Side-chain amino acid-based cationic antibacterial polymers: Investigating the morphological switching of a polymer-treated bacterial cell. ACS Omega 2017, 2, 1633–1644. [Google Scholar] [CrossRef]
- Padmanabhan, M.; Cournoyer, P.; Dinesh-Kumar, S.P. The leucine-rich repeat domain in plant innate immunity: A wealth of possibilities. Cell Microbiol. 2009, 11, 191–198. [Google Scholar] [CrossRef] [PubMed]
- Yuan, N.; Yuan, S.; Li, Z.; Zhou, M.; Wu, P.; Hu, Q.; Mendu, V.; Wang, L.; Luo, H. Stress induced factor 2, a Leucine-Rich Repeat Kinase regulates basal plant pathogen defense. Plant Physiol. 2018, 176, 3062–3080. [Google Scholar] [CrossRef]
- Chakraborty, S.; Nguyen, B.; Wasti, S.D.; Xu, G. Plant Leucine-Rich Repeat Receptor Kinase (LRR-RK): Structure, ligand perception, and activation mechanism. Molecules 2019, 24, 3081. [Google Scholar] [CrossRef]
- Zeier, J. New insights into the regulation of plant immunity by amino acid metabolic pathways. Plant Cell Environ. 2013, 36, 2085–2103. [Google Scholar] [CrossRef] [PubMed]
- Fan, J.; Crooks, C.; Creissen, G.; Hill, L.; Fairhurst, S.; Doerner, P.; Lamb, C. Pseudomonas sax genes overcome aliphatic isothiocyanate-mediated non-host resistance in Arabidopsis. Science 2011, 331, 1185–1188. [Google Scholar] [CrossRef] [PubMed]
- Návarová, H.; Bernsdorff, F.; Döring, A.-C.; Zeier, J. Pipecolic acid, an endogenous mediator of defense amplification and priming, is a critical regulator of inducible plant immunity. Plant Cell 2012, 24, 5123–5141. [Google Scholar] [CrossRef] [PubMed]
- Yang, J.; Duan, G.; Li, C.; Liu, L.; Han, G.; Zhang, Y.; Wang, C. The cross-talks between jasmonic acid and other plant hormone signaling highlight the involvement of jasmonic acid as a core component in plant response to biotic and abiotic stresses. Front. Plant Sci. 2019, 10, 1349. [Google Scholar] [CrossRef]
- Mikkelsen, M.D.; Halkier, B.A. Metabolic engineering of valine- and isoleucine-derived glucosinolates in Arabidopsis expressing CYP79D2 from cassava. Plant Physiol. 2003, 131, 773–779. [Google Scholar] [CrossRef] [PubMed]
- Azevedo, R.A.; Lancien, M.; Lea, P.J. The aspartic acid metabolic pathway, an exciting and essential pathway in plants. Amino Acids 2006, 30, 143–162. [Google Scholar] [CrossRef]
- Al Sinani, S.; Eltayeb, E. The steroidal glycoalkaloids solamargine and solasonine in Solanum plants. S. Afr. J. Bot. 2017, 112, 253–269. [Google Scholar] [CrossRef]
- Kim, S.G.; Hur, O.S.; Ro, N.Y.; Ko, H.C.; Rhee, J.H.; Sung, J.S.; Ryu, K.Y.; Lee, S.Y.; Baek, H.J. Evaluation of resistance to Ralstonia solanacearum in tomato genetic resources at seedling stage. Plant Pathol. J. 2016, 32, 58–64. [Google Scholar] [CrossRef]
- Maulida, I.; Murti, R.H.; Arwiyanto, T. Selection and inheritance of tomato resistance against Ralstonia solanacearum. JPTI 2019, 23, 61–67. [Google Scholar] [CrossRef]
- East West Seed Indonesia. Available online: https://www.panahmerah.id/product/permata-f1 (accessed on 11 May 2021).
- Fan, X.-Y.; Lin, W.-P.; Liu, R.; Jiang, N.-H.; Cai, K.Z. Physiological response and phenolic metabolism in tomato (Solanum lycopersicum) mediated by silicon under Ralstonia solanacearum infection. JIA 2018, 17, 2160–2171. [Google Scholar] [CrossRef]
- Chen, K.; Khan, R.A.A.; Cao, W.; Ling, M. Sustainable and ecofriendly approach of managing soil born bacterium Ralstonia solanacearum (Smith) using dried powder of Conyza canadensis. Pathogens 2020, 9, 327. [Google Scholar] [CrossRef]
- Schripsema, J.; Dagnino, D. Two-phase extraction for comprehensive analysis of the plant metabolome by NMR. Methods Mol. Biol. 2018, 1738, 195–202. [Google Scholar]
- López-Gresa, M.P.; Federica, M.; Jose, M.B. Metabolic response of tomato leaves upon different plant–pathogen interactions. Phytochem. Anal. 2010, 21, 89–94. [Google Scholar] [CrossRef] [PubMed]
- Kim, H.K.; Verporte, R. Sample preparation for plant metabolomics. Phytochem. Anal. 2010, 21, 4–13. [Google Scholar] [CrossRef]
- Escudero, N.; Marhuenda-Egea, F.C.; Ibanco-Can, R.; Zavala-Gonzalez, E.A.; Lopez-Llorca, L.V. A metabolomic approach to study the rhizodeposition in the tritrophic interaction: Tomato, Pochoniachlamydosporia and Meloidogyne javanica. Metabolomics 2014, 10, 788–804. [Google Scholar] [CrossRef]


Publisher’s Note: MDPI stays neutral with regard to jurisdictional claims in published maps and institutional affiliations. |
© 2021 by the authors. Licensee MDPI, Basel, Switzerland. This article is an open access article distributed under the terms and conditions of the Creative Commons Attribution (CC BY) license (https://creativecommons.org/licenses/by/4.0/).