
Estimation of Genome Size in the Endemic Species Reseda pentagyna and the Locally Rare Species Reseda lutea Using comparative Analyses of Flow Cytometry and K-Mer Approaches

 ,
,
Abstract
:1. Introduction
2. Material and Methods
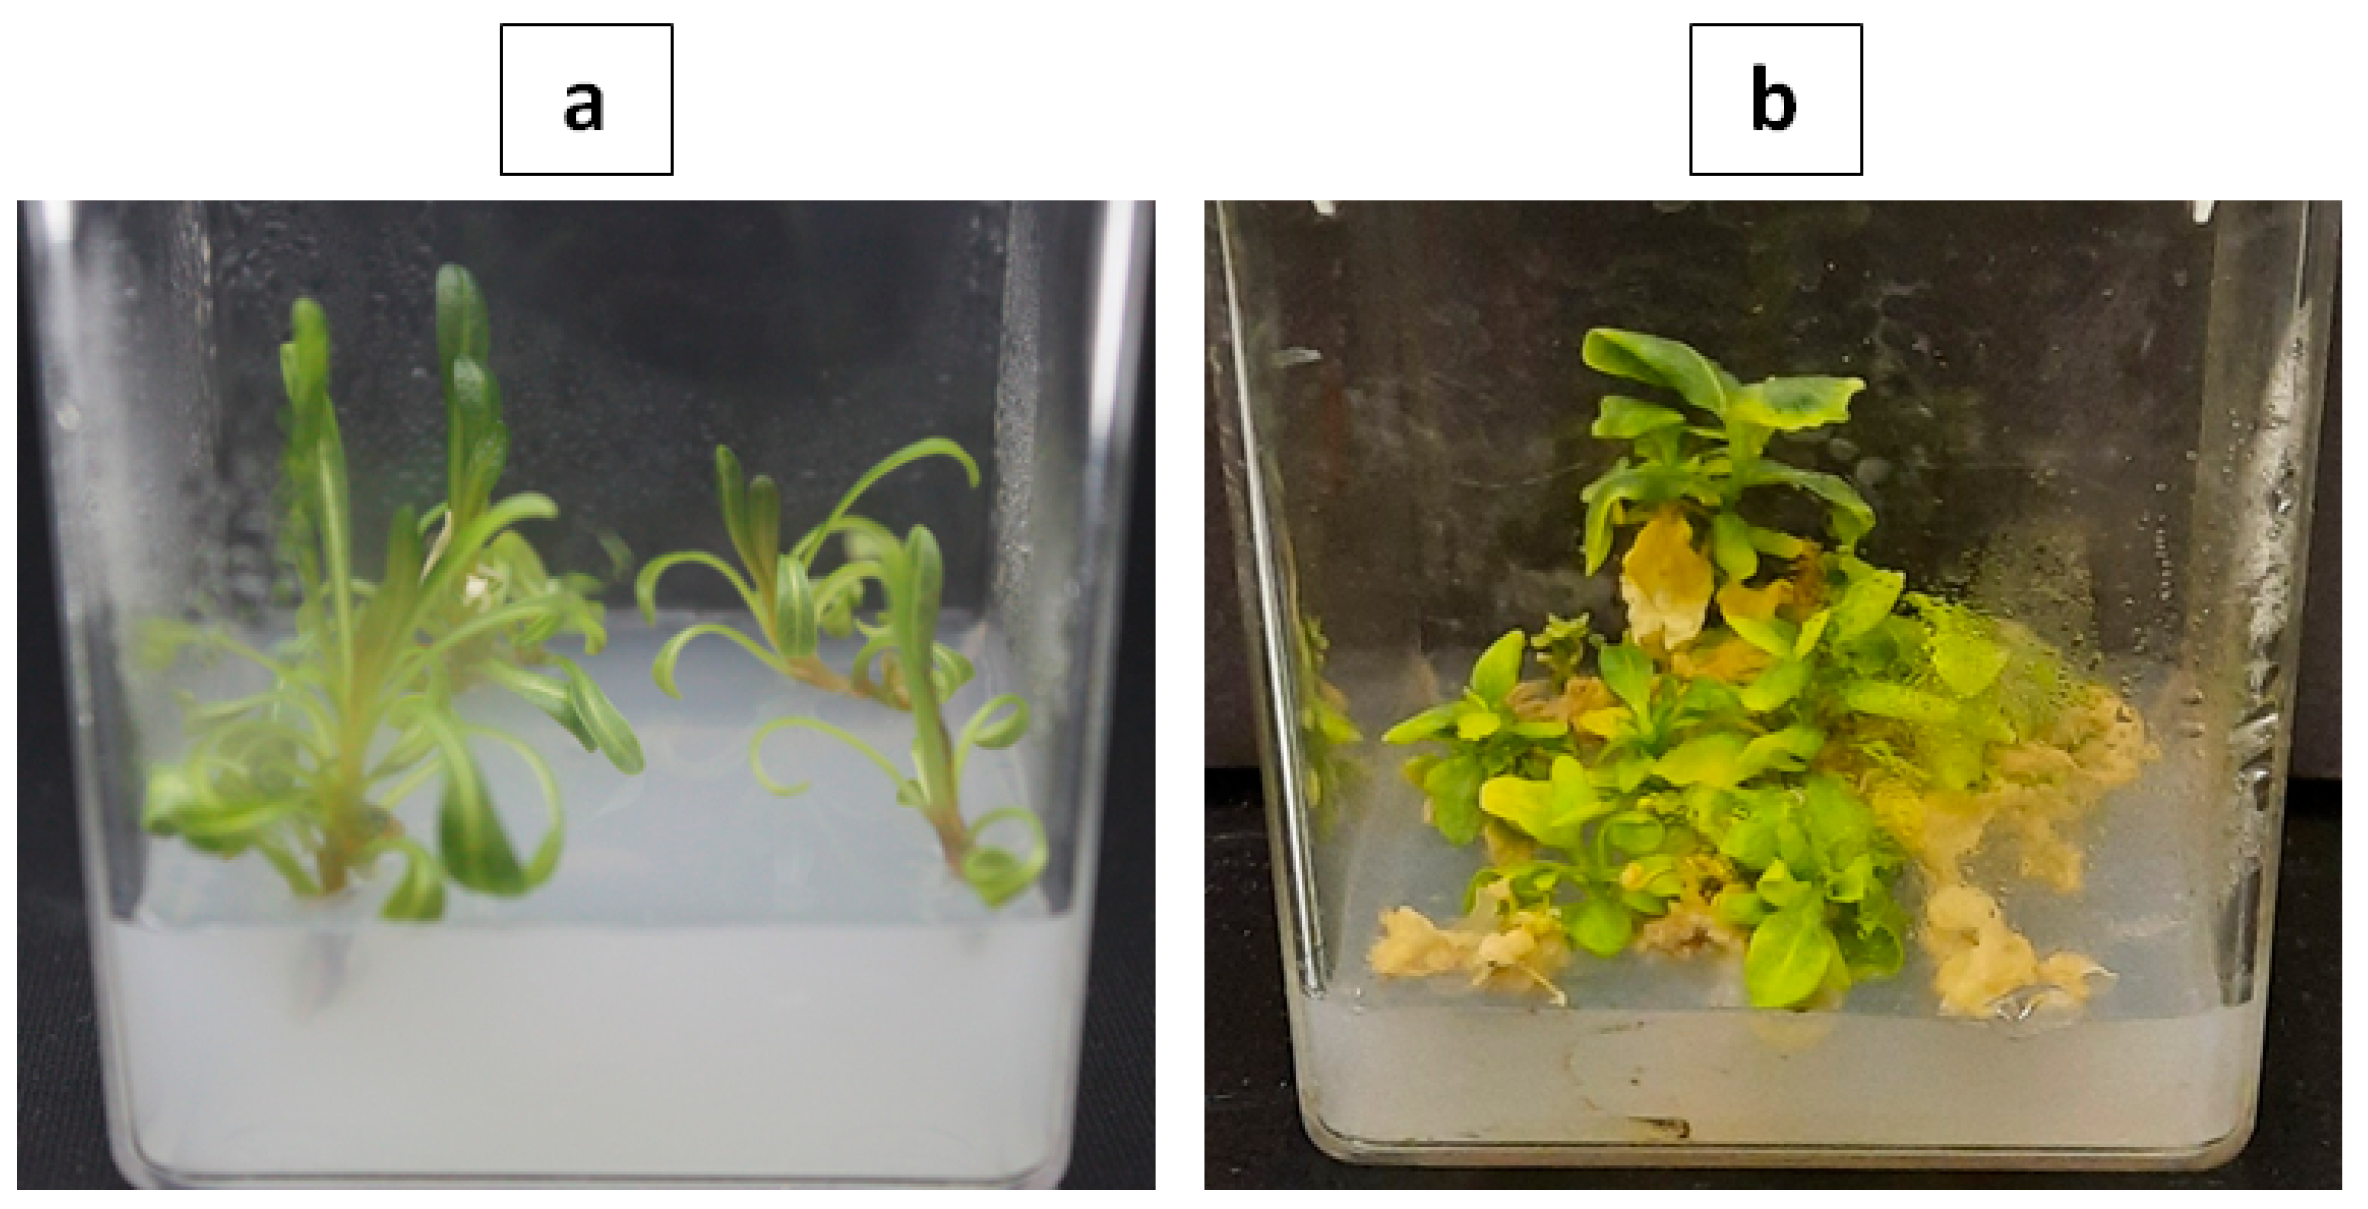
2.1. Plant Material
2.2. Genomic DNA Extraction
2.3. Molecular Identification
2.4. Flow Cytometric Genome Size
2.5. Whole-Genome Sequencing and Filtering Contaminated Reads
2.6. K-Mer Based Genome Size
3. Result and Discussions
3.1. Molecular Identification
3.2. C-Value Determination via Flow cytometry
3.3. Whole-Genome Sequencing
3.4. K-Mer Based Genome Size and Complexity
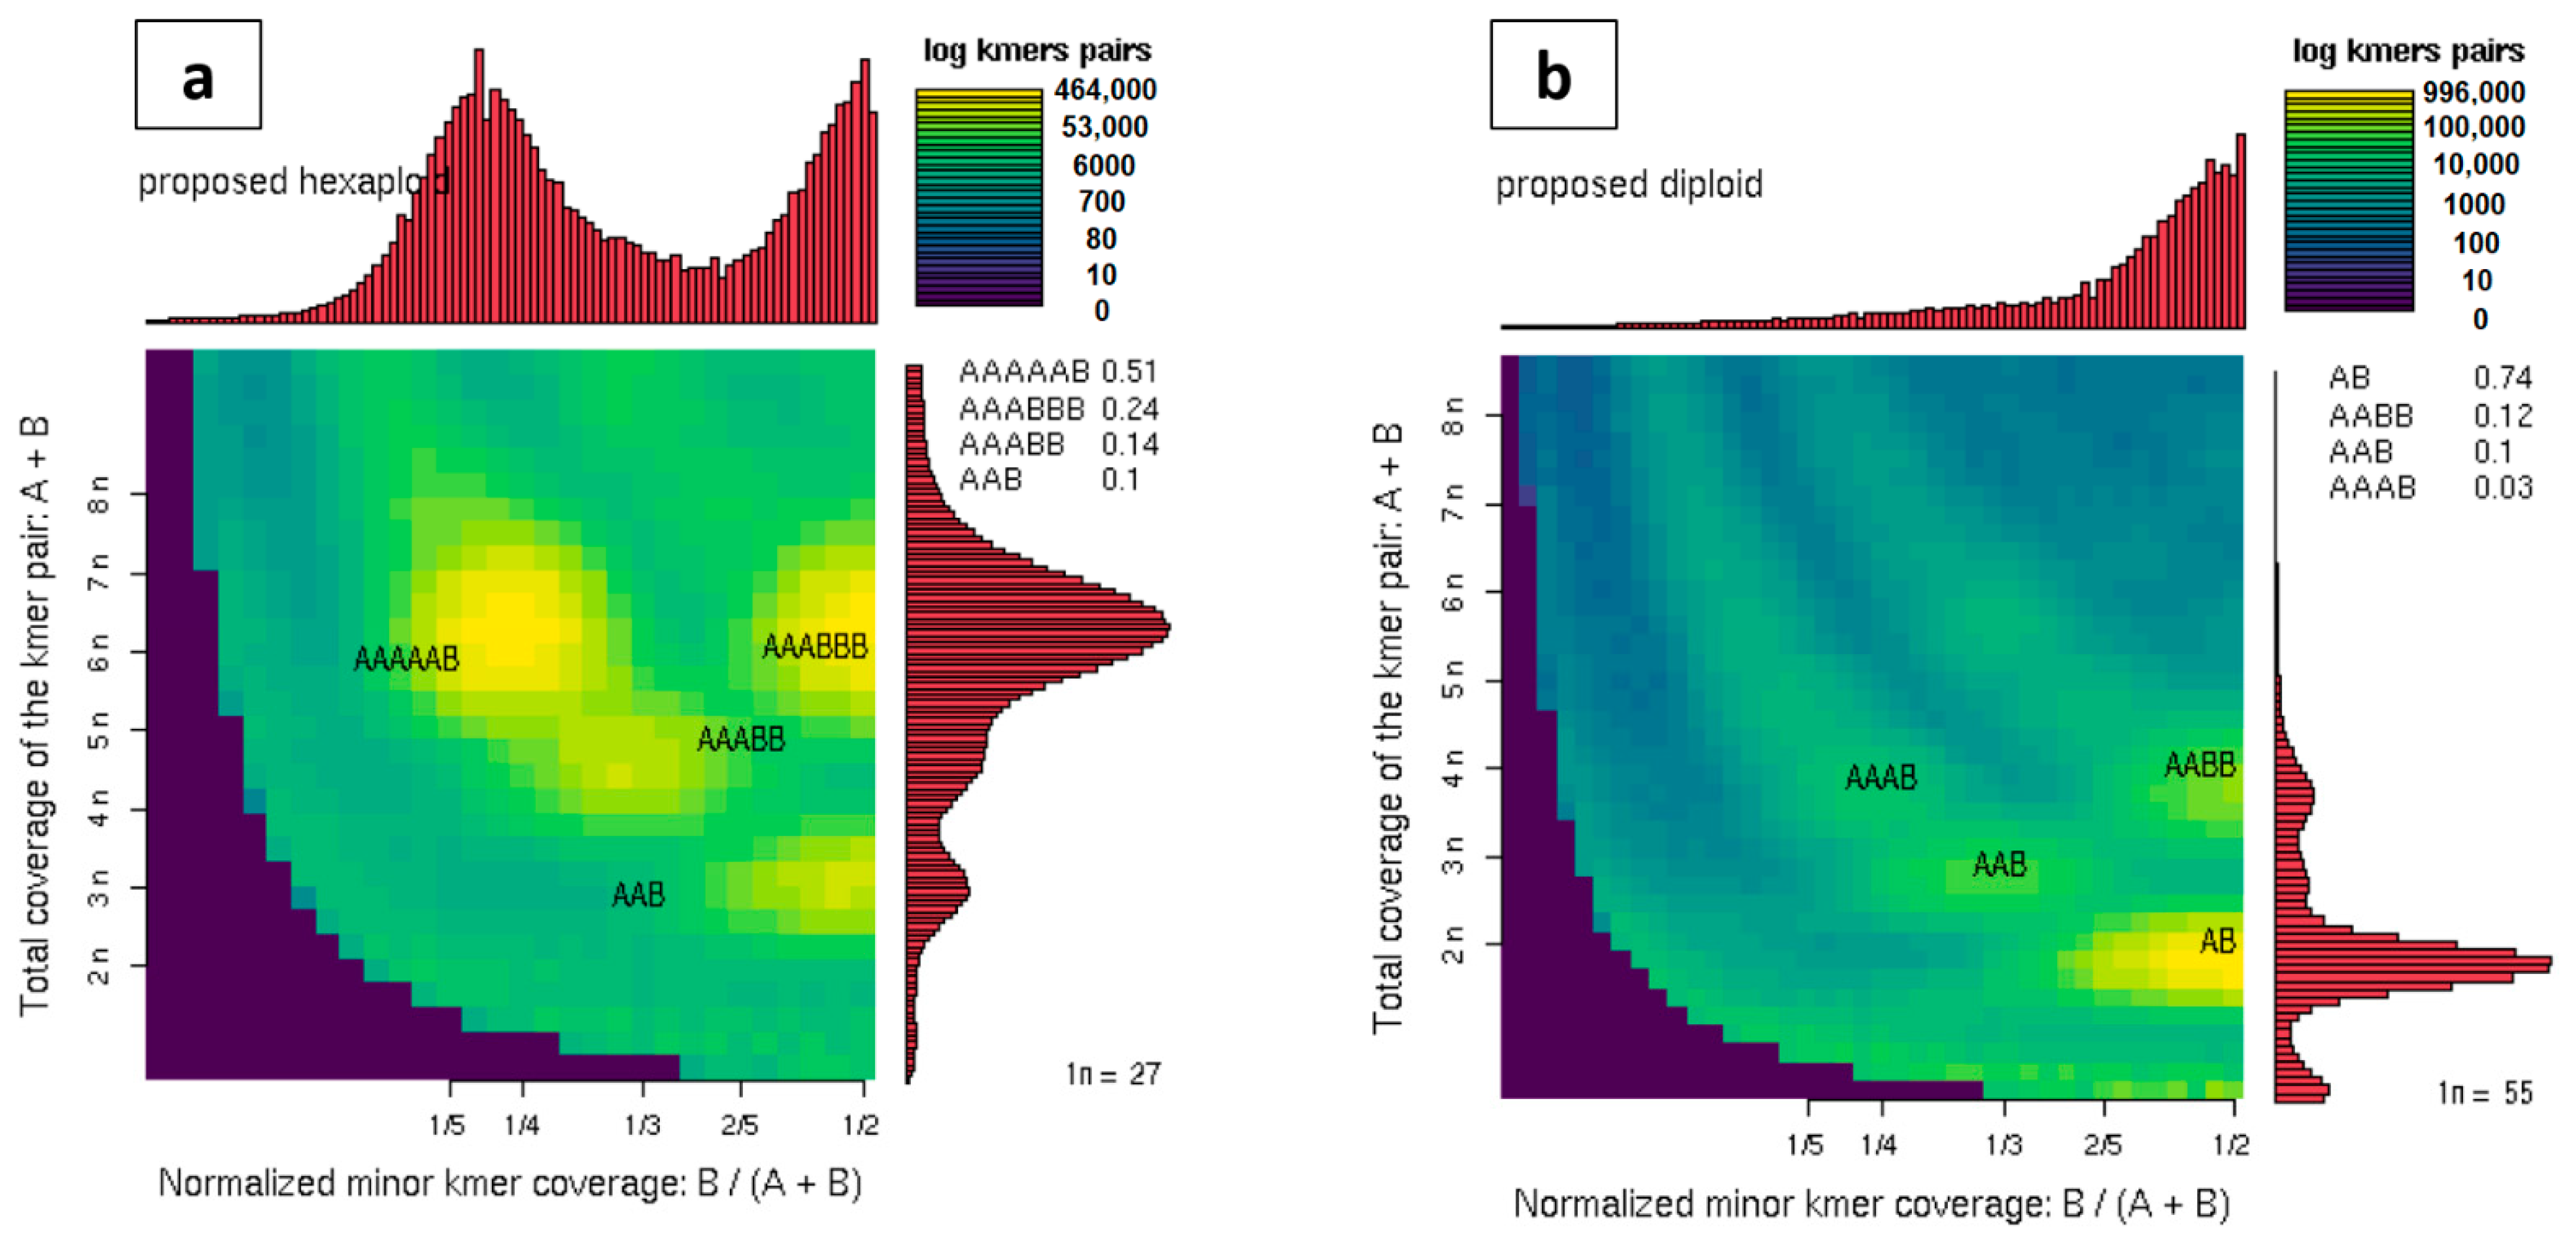
3.5. Ploidy Level Estimation
4. Conclusions
Author Contributions
Funding
Institutional Review Board Statement
Informed Consent Statement
Data Availability Statement
Conflicts of Interest
References
- Dolezel, J.; Bartos, J. Plant DNA flow cytometry and estimation of nuclear genome size. Ann. Bot. 2005, 95, 99–110. [Google Scholar] [CrossRef] [Green Version]
- Dolezel, J.; Bartos, J.; Voglmayr, H.; Greilhuber, J. Nuclear DNA content and genome size of trout and human. Cytom. Part A 2003, 51, 127–128. [Google Scholar]
- Greilhuber, J.; Doležel, J.; Lysak, M.A.; Bennett, M.D. The origin, evolution and proposed stabilization of the terms ‘genome size’ and ‘C-value’ to describe nuclear DNA contents. Ann. Bot. 2005, 95, 255–260. [Google Scholar] [CrossRef] [PubMed]
- Swift, H. The constancy of desoxyribose nucleic acid in plant nuclei. Proc. Natl. Acad. Sci. USA 1950, 36, 643–654. [Google Scholar] [CrossRef] [Green Version]
- Fay, M.F.; Cowan, R.S.; Leitch, I.J. The effects of nuclear, DNA content (C-value) on the quality and utility of AFLP fingerprints. Ann. Bot 2005, 95, 237–246. [Google Scholar] [CrossRef] [Green Version]
- Leitch, I.J.; Bennett, M.D. Genome size and its uses: The impact of flow cytometry. In Flow Cytometry with Plant Cells: Analysis of Genes, Chromosomes and Genomes; Wiley-VCH: Weinheim, Germany, 2007; pp. 153–176. [Google Scholar]
- Gregory, T.R. Genome size evolution in animals. In The Evolution of the Genome; Elsevier: Amsterdam, The Netherlands, 2005; pp. 3–87. [Google Scholar]
- Leong-Škorničková, J.; Šída, O.; Jarolímová, V.; Sabu, M.; Fér, T.; Trávníček, P.; Suda, J. Chromosome numbers and genome size variation in Indian species of Curcuma (Zingiberaceae). Ann. Bot. 2007, 100, 505–526. [Google Scholar] [CrossRef] [PubMed] [Green Version]
- Kelly, L.J.; Leitch, A.R.; Fay, M.F.; Renny-Byfield, S.; Pellicer, J.; Macas, J.; Leitch, I.J. Why size really matters when sequencing plant genomes. Plant. Ecol. Divers. 2012, 5, 415–425. [Google Scholar] [CrossRef]
- Doležel, J.; Greilhuber, J.; Suda, J. Estimation of nuclear DNA content in plants using flow cytometry. Nat. Protoc. 2007, 2, 2233. [Google Scholar] [CrossRef] [PubMed]
- Sliwinska, E. Flow cytometry—A modern method for exploring genome size and nuclear DNA synthesis in horticultural and medicinal plant species. Folia Hortic. 2018, 30, 103–128. [Google Scholar] [CrossRef] [Green Version]
- Hanrahan, S.J.; Johnston, J.S. New genome size estimates of 134 species of arthropods. Chromosome Res. 2011, 19, 809–823. [Google Scholar] [CrossRef]
- Li, X.; Waterman, M.S. Estimating the repeat structure and length of DNA sequences using ℓ-tuples. Genome Res. 2003, 13, 1916–1922. [Google Scholar]
- Guo, L.T.; Wang, S.L.; Wu, Q.J.; Zhou, X.G.; Xie, W.; Zhang, Y.J. Flow cytometry and K-mer analysis estimates of the genome sizes of Bemisia tabaci B and Q (Hemiptera: Aleyrodidae). Front. Physiol. 2015, 6, 144. [Google Scholar] [CrossRef] [PubMed] [Green Version]
- He, K.; Lin, K.; Wang, G.; Li, F. Genome Sizes of Nine Insect Species Determined by Flow Cytometry and k-mer Analysis. Front. Physiol. 2016, 7, 569. [Google Scholar] [CrossRef] [PubMed] [Green Version]
- Li, R.; Fan, W.; Tian, G.; Zhu, H.; He, L.; Cai, J.; Huang, Q.; Cai, Q.; Li, B.; Bai, Y.; et al. The sequence and de novo assembly of the giant panda genome. Nature 2010, 463, 311–317. [Google Scholar] [CrossRef] [Green Version]
- Potato Genome Sequencing Consortium. Genome sequence and analysis of the tuber crop potato. Nature 2011, 475, 189. [Google Scholar] [CrossRef] [Green Version]
- Martin-Bravo, S.; Meimberg, H.; Luceno, M.; Markl, W.; Valcarcel, V.; Brauchler, C.; Vargas, P.; Heubl, G. Molecular systematics and biogeography of Resedaceae based on ITS and trnL-F sequences. Mol. Phylogenet. Evol. 2007, 44, 1105–1120. [Google Scholar] [CrossRef] [PubMed]
- Yildirim, H.; Şenol, S.G. Reseda malatyana (Resedaceae), a new chasmophytic species from eastern Anatolia, Turkey. Turk. J. Bot. 2014, 38, 1013–1021. [Google Scholar] [CrossRef]
- Sales, A.; Bagherizadeh, Y.; Malekzadeh, P.; Ahmadi, B.; Bonab, F. Evaluation of the antimicrobial effects of essential oil of reseda lutea L on pathogenic bacteria: Staphylococcus aureus, Staphylococcus epidermidis, and Escherichia coli. Arch. Clin. Microbiol. 2017, 8, 1–6. [Google Scholar] [CrossRef] [Green Version]
- Casetti, F.; Jung, W.; Wolfle, U.; Reuter, J.; Neumann, K.; Gilb, B.; Wahling, A.; Wagner, S.; Merfort, I.; Schempp, C.M. Topical application of solubilized Reseda luteola extract reduces ultraviolet B-induced inflammation in vivo. J. Photochem. Photobiol. B 2009, 96, 260–265. [Google Scholar] [CrossRef] [PubMed]
- Berrehal, D.; Khalfallah, A.; Bencharif-Betina, S.; Kabouche, Z.; Kacem, N.; Kabouche, A.; Calliste, C.-A.; Duroux, J.-L. Comparative antioxidant activity of two Algerian Reseda species. Chem. Nat. Compd. 2010, 46, 456–458. [Google Scholar] [CrossRef]
- Ali, M.A.; Al-Hemaid, F.M.; Choudhary, R.K.; Lee, J.; Kim, S.-Y.; Rub, M. Status of Reseda pentagyna Abdallah & AG Miller (Resedaceae) inferred from combined nuclear ribosomal and chloroplast sequence data. Bangladesh J. Plant. Taxon. 2013, 20, 233–238. [Google Scholar]
- Llewellyn, O.; Hall, M.; Miller, A.; Al-Abbasi, T.; Al-Wetaid, A.; Al-Harbi, R.; Al-Shammari, K.; Al-Farhan, A. Important Plant Areas in the Arabian Peninsula: 1. Jabal Qaraqir. Edinb. J. Bot. 2010, 67, 37. [Google Scholar] [CrossRef]
- Abdallah, M.S. The Resedaceae: A Taxonomical Revision of the Family; De Landbouwhogeschool te Wageningen: Wageningen, Germany, 1967. [Google Scholar]
- Alwadi, H.; Moustafa, F. Altitudinal impact on the weeds species distribution in the semi-arid mountainous region of Abha, Saudi Arabia. J. Crop. Weed 2016, 12, 87–95. [Google Scholar]
- Pagnotta, E.; Montaut, S.; Matteo, R.; Rollin, P.; Nuzillard, J.-M.; Lazzeri, L.; Bagatta, M. Glucosinolates in Reseda lutea L: Distribution in plant tissues during flowering time. Biochem. Syst. Ecol. 2020, 90, 104043. [Google Scholar] [CrossRef]
- Chaudhary, S. Resedaceae. In Flora of the Kingdom of Saudi Arabia; Chaudhary, S., Ed.; Ministry of Agriculture and Water, National Herbarium, National Agriculture and Water Research Center: Riyadh, Saudi Arabia, 1999; pp. 536–543. [Google Scholar]
- Miller, A.; Nyberg, J. Studies in the Flora of Arabia: XXVII. Some new taxa from the Arabian Peninsula. Edinb. J. Bot. 1994, 51, 33–47. [Google Scholar] [CrossRef]
- Murashige, T.; Skoog, F. A revised medium for rapid growth and bio assays with tobacco tissue cultures. Physiol. Plant. 1962, 15, 473–497. [Google Scholar] [CrossRef]
- White, T.J.; Bruns, T.; Lee, S.; Taylor, J. Amplification and direct sequencing of fungal ribosomal RNA genes for phylogenetics. PCR Protoc. A Guide Methods Appl. 1990, 18, 315–322. [Google Scholar]
- Gardes, M.; Bruns, T.D. ITS primers with enhanced specificity for basidiomycetes-application to the identification of mycorrhizae and rusts. Mol. Ecol. 1993, 2, 113–118. [Google Scholar] [CrossRef] [PubMed]
- Kumar, S.; Stecher, G.; Li, M.; Knyaz, C.; Tamura, K.; Mega, X. Molecular Evolutionary Genetics Analysis across Computing Platforms. Mol. Biol. Evol. 2018, 35, 1547–1549. [Google Scholar] [CrossRef]
- Kumar, S.; Gadagkar, S.R. Efficiency of the neighbor-joining method in reconstructing deep and shallow evolutionary relationships in large phylogenies. J. Mol. Evol. 2000, 51, 544–553. [Google Scholar] [CrossRef] [Green Version]
- Doležel, J.; Sgorbati, S.; Lucretti, S. Comparison of three DNA fluorochromes for flow cytometric estimation of nuclear DNA content in plants. Physiol. Plant. 1992, 85, 625–631. [Google Scholar] [CrossRef]
- Sadhu, A.; Bhadra, S.; Bandyopadhyay, M. Novel nuclei isolation buffer for flow cytometric genome size estimation of Zingiberaceae: A comparison with common isolation buffers. Ann. Bot. 2016, 118, 1057–1070. [Google Scholar] [CrossRef] [PubMed] [Green Version]
- Yan, J.; Zhang, J.; Sun, K.; Chang, D.; Bai, S.; Shen, Y.; Huang, L.; Zhang, J.; Zhang, Y.; Dong, Y. Ploidy level and DNA content of Erianthus arundinaceus as determined by flow cytometry and the association with biological characteristics. PloS ONE 2016, 11, e0151948. [Google Scholar] [CrossRef]
- Bennett, M.D.; Bhandol, P.; Leitch, I.J. Nuclear DNA amounts in angiosperms and their modern uses—807 new estimates. Ann. Bot. 2000, 86, 859–909. [Google Scholar] [CrossRef] [Green Version]
- Andrews, S. FastQC V0.11.9: A quality control tool for high throughput sequence data. In Babraham Bioinformatics; Babraham Institute: Cambridge, UK, 2019; Available online: www.bioinformatics.babraham.ac.uk/projects/fastqc (accessed on 10 April 2021).
- Bolger, A.M.; Lohse, M.; Usadel, B. Trimmomatic: A flexible trimmer for Illumina sequence data. Bioinformatics 2014, 30, 2114–2120. [Google Scholar] [CrossRef] [PubMed] [Green Version]
- Luo, R.; Liu, B.; Xie, Y.; Li, Z.; Huang, W.; Yuan, J.; He, G.; Chen, Y.; Pan, Q.; Liu, Y.; et al. SOAPdenovo2: An empirically improved memory-efficient short-read de novo assembler. Gigascience 2012, 1, 18. [Google Scholar] [CrossRef]
- Xu, H.; Luo, X.; Qian, J.; Pang, X.; Song, J.; Qian, G.; Chen, J.; Chen, S. FastUniq: A fast de novo duplicates removal tool for paired short reads. PLoS ONE 2012, 7, e52249. [Google Scholar] [CrossRef] [Green Version]
- Bushnell, B. BBMap: A fast, accurate, splice-aware aligner. In Proceedings of the 9th Annual, Genomics of Energy & Environment Meeting, Walnut Creek, CA, USA, 17–20 March 2014; Lawrence Berkeley National Lab: Berkeley, CA, USA, 2014. [Google Scholar]
- Wingett, S.W.; Andrews, S. FastQ Screen: A tool for multi-genome mapping and quality control. F1000Research 2018, 7, 1338. [Google Scholar] [CrossRef]
- Chen, W.; Hasegawa, D.K.; Arumuganathan, K.; Simmons, A.M.; Wintermantel, W.M.; Fei, Z.; Ling, K.S. Estimation of the Whitefly Bemisia tabaci Genome Size Based on k-mer and Flow Cytometric Analyses. Insects 2015, 6, 704–715. [Google Scholar] [CrossRef] [Green Version]
- Liu, B.; Shi, Y.; Yuan, J.; Hu, X.; Zhang, H.; Li, N.; Li, Z.; Chen, Y.; Mu, D.; Fan, W. Estimation of genomic characteristics by analyzing k-mer frequency in de novo genome projects. arXiv 2013, arXiv:1308.2012. [Google Scholar]
- Marcais, G.; Kingsford, C. A fast, lock-free approach for efficient parallel counting of occurrences of k-mers. Bioinformatics 2011, 27, 764–770. [Google Scholar] [CrossRef] [PubMed] [Green Version]
- Chikhi, R.; Medvedev, P. Informed and automated k-mer size selection for genome assembly. Bioinformatics 2014, 30, 31–37. [Google Scholar] [CrossRef]
- Vurture, G.W.; Sedlazeck, F.J.; Nattestad, M.; Underwood, C.J.; Fang, H.; Gurtowski, J.; Schatz, M.C. GenomeScope: Fast reference-free genome profiling from short reads. Bioinformatics 2017, 33, 2202–2204. [Google Scholar] [CrossRef] [Green Version]
- Sun, H.; Ding, J.; Piednoël, M.; Schneeberger, K. findGSE: Estimating genome size variation within human and Arabidopsis using k-mer frequencies. Bioinformatics 2018, 34, 550–557. [Google Scholar] [CrossRef] [PubMed] [Green Version]
- Hozza, M.; Vinař, T.; Brejová, B. How big is that genome? Estimating genome size and coverage from k-mer abundance spectra. In International Symposium on String Processing and Information Retrieval: 2015; Springer: Berlin/Heidelberg, Germany, 2015; pp. 199–209. [Google Scholar]
- Lander, E.S.; Waterman, M.S. Genomic mapping by fingerprinting random clones: A mathematical analysis. Genomics 1988, 2, 231–239. [Google Scholar] [CrossRef]
- Ryan, J. Estimate_Genome_Size. Pl (Version 0.03) [Computer Software]. Sars International Centre for Marine Molecular Biology, Bergen, Norway 2013. Available online: http://josephryan.github.com/estimate_genome_size.pl/ (accessed on 10 April 2021).
- Ranallo-Benavidez, T.R.; Jaron, K.S.; Schatz, M.C. GenomeScope 2.0 and Smudgeplot for reference-free profiling of polyploid genomes. Nat. Commun. 2020, 11, 1432. [Google Scholar] [CrossRef] [PubMed] [Green Version]
- Loureiro, J.; Doležel, J.; Greilhuber, J.; Santos, C.; Suda, J. Plant Flow Cytometry—Far beyond the Stone Age. Cytom. Part A 2008, 73a, 579–580. [Google Scholar] [CrossRef] [PubMed]
- Knight, C.A.; Ackerly, D.D. Variation in nuclear DNA content across environmental gradients: A quantile regression analysis. Ecol. Lett. 2002, 5, 66–76. [Google Scholar] [CrossRef] [Green Version]
- Beaulieu, J.M.; Moles, A.T.; Leitch, I.J.; Bennett, M.D.; Dickie, J.B.; Knight, C.A. Correlated evolution of genome size and seed mass. New Phytol. 2007, 173, 422–437. [Google Scholar] [CrossRef] [Green Version]
- Knight, C.A.; Beaulieu, J.M. Genome size scaling through phenotype space. Ann. Bot. 2008, 101, 759–766. [Google Scholar] [CrossRef] [Green Version]
- Knight, C.A.; Molinari, N.A.; Petrov, D.A. The large genome constraint hypothesis: Evolution, ecology and phenotype. Ann. Bot 2005, 95, 177–190. [Google Scholar] [CrossRef] [PubMed] [Green Version]
- Vinogradov, A.E. Selfish DNA is maladaptive: Evidence from the plant Red List. Trends Genet. 2003, 19, 609–614. [Google Scholar] [CrossRef]
- Vidic, T.; Greilhuber, J.; Vilhar, B.; Dermastia, M. Selective significance of genome size in a plant community with heavy metal pollution. Ecol. Appl. 2009, 19, 1515–1521. [Google Scholar] [CrossRef]
- Doležel, J.; Greilhuber, J.; Lucretti, S.; Meister, A.; Lysák, M.; Nardi, L.; Obermayer, R. Plant genome size estimation by flow cytometry: Inter-laboratory comparison. Ann. Bot. 1998, 82 (Suppl. 1), 17–26. [Google Scholar] [CrossRef] [Green Version]
- Soltis, D.E.; Soltis, P.S.; Bennett, M.D.; Leitch, I.J. Evolution of genome size in the angiosperms. Am. J. Bot. 2003, 90, 1596–1603. [Google Scholar] [CrossRef] [PubMed]
- González-Aguilera, J.; Fernández-Peralta, A.M. Phylogenetic relationships in the family Resedaceae L. Genetica 1984, 64, 185–197. [Google Scholar] [CrossRef]
- Eigsti, O.J. Cytological studies in the Resedaceae. Bot. Gaz. 1936, 98, 363–369. [Google Scholar] [CrossRef]
- Michael, T.P.; VanBuren, R. Progress, challenges and the future of crop genomes. Curr. Opin. Plant. Biol. 2015, 24, 71–81. [Google Scholar] [CrossRef]
- Williams, D.; Trimble, W.L.; Shilts, M.; Meyer, F.; Ochman, H. Rapid quantification of sequence repeats to resolve the size, structure and contents of bacterial genomes. BMC Genom. 2013, 14, 1–11. [Google Scholar] [CrossRef] [Green Version]
- Gregory, T.R.; Nathwani, P.; Bonnett, T.R.; Huber, D.P. Sizing up arthropod genomes: An evaluation of the impact of environmental variation on genome size estimates by flow cytometry and the use of qPCR as a method of estimation. Genome 2013, 56, 505–510. [Google Scholar] [CrossRef]
- DeSalle, R.; Gregory, T.R.; Johnston, J.S. Preparation of samples for comparative studies of arthropod chromosomes: Visualization, in situ hybridization, and genome size estimation. Methods Enzym. 2005, 395, 460–488. [Google Scholar]
- Hardie, D.C.; Gregory, T.R.; Hebert, P.D. From pixels to picograms: A beginners’ guide to genome quantification by Feulgen image analysis densitometry. J. Histochem. Cytochem. 2002, 50, 735–749. [Google Scholar] [CrossRef] [PubMed]
- Zhang, G.; Fang, X.; Guo, X.; Li, L.; Luo, R.; Xu, F.; Yang, P.; Zhang, L.; Wang, X.; Qi, H.; et al. The oyster genome reveals stress adaptation and complexity of shell formation. Nature 2012, 490, 49–54. [Google Scholar] [CrossRef] [PubMed] [Green Version]
- Edwards, R.J.; Tuipulotu, D.E.; Amos, T.G.; O’Meally, D.; Richardson, M.F.; Russell, T.L.; Vallinoto, M.; Carneiro, M.; Ferrand, N.; Wilkins, M.R.; et al. Draft genome assembly of the invasive cane toad, Rhinella marina. Gigascience 2018, 7, giy095. [Google Scholar] [CrossRef]
- Hu, Y.; Resende, M.F.; Bombarely, A.; Brym, M.; Bassil, E.; Chambers, A.H. Genomics-based diversity analysis of Vanilla species using a Vanilla planifolia draft genome and Genotyping-By-Sequencing. Sci. Rep. 2019, 9, 1–16. [Google Scholar] [CrossRef] [PubMed]
- Hedgecock, D.; Gaffney, P.M.; Goulletquer, P.; Guo, X.; Reece, K.; Warr, G.W. The case for sequencing the Pacific oyster genome. J. Shellfish. Res. 2005, 24, 429–441. [Google Scholar]
- Elliott, T.A.; Gregory, T.R. What’s in a genome? The C-value enigma and the evolution of eukaryotic genome content. Philos. Trans. R. Soc. B Biol. Sci. 2015, 370, 20140331. [Google Scholar] [CrossRef]
- Jansen, H.J.; Liem, M.; Jong-Raadsen, S.A.; Dufour, S.; Weltzien, F.A.; Swinkels, W.; Koelewijn, A.; Palstra, A.P.; Pelster, B.; Spaink, H.P.; et al. Rapid de novo assembly of the European eel genome from nanopore sequencing reads. Sci. Rep. 2017, 7, 7213. [Google Scholar] [CrossRef] [Green Version]
- Jimenez, A.G.; Kinsey, S.T.; Dillaman, R.M.; Kapraun, D.F. Nuclear DNA content variation associated with muscle fiber hypertrophic growth in decapod crustaceans. Genome 2010, 53, 161–171. [Google Scholar] [CrossRef]
- Kidwell, M.G. Transposable elements and the evolution of genome size in eukaryotes. Genetica 2002, 115, 49–63. [Google Scholar] [CrossRef]
- Li, S.F.; Su, T.; Cheng, G.Q.; Wang, B.X.; Li, X.; Deng, C.L.; Gao, W.J. Chromosome Evolution in Connection with Repetitive Sequences and Epigenetics in Plants. Genes 2017, 8, 290. [Google Scholar] [CrossRef] [Green Version]
- Baeza, J.A.; MacManes, M. De novo assembly and functional annotation of the heart + hemolymph transcriptome in the Caribbean spiny lobster Panulirus argus. Mar. Genom. 2020, 54, 100783. [Google Scholar] [CrossRef]
- SanMiguel, P.; Tikhonov, A.; Jin, Y.K.; Motchoulskaia, N.; Zakharov, D.; Melake-Berhan, A.; Springer, P.S.; Edwards, K.J.; Lee, M.; Avramova, Z.; et al. Nested retrotransposons in the intergenic regions of the maize genome. Science 1996, 274, 765–768. [Google Scholar] [CrossRef] [Green Version]
- Chandler, V.L.; Brendel, V. The Maize Genome Sequencing Project. Plant. Physiol. 2002, 130, 1594–1597. [Google Scholar] [CrossRef] [PubMed] [Green Version]
- Jain, M.; Koren, S.; Miga, K.H.; Quick, J.; Rand, A.C.; Sasani, T.A.; Tyson, J.R.; Beggs, A.D.; Dilthey, A.T.; Fiddes, I.T.; et al. Nanopore sequencing and assembly of a human genome with ultra-long reads. Nat. Biotechnol. 2018, 36, 338–345. [Google Scholar] [CrossRef] [PubMed] [Green Version]
- Rhoads, A.; Au, K.F. PacBio Sequencing and Its Applications. Genom. Proteom. Bioinform. 2015, 13, 278–289. [Google Scholar] [CrossRef] [PubMed] [Green Version]
- Rang, F.J.; Kloosterman, W.P.; de Ridder, J. From squiggle to basepair: Computational approaches for improving nanopore sequencing read accuracy. Genome Biol. 2018, 19, 90. [Google Scholar] [CrossRef] [PubMed] [Green Version]
- Pellicer, J.; Leitch, I.J. The Plant DNA C-values database (release 7.1): An updated online repository of plant genome size data for comparative studies. New Phytol. 2020, 226, 301–305. [Google Scholar] [CrossRef] [Green Version]
- Rice, A.; Glick, L.; Abadi, S.; Einhorn, M.; Kopelman, N.M.; Salman-Minkov, A.; Mayzel, J.; Chay, O.; Mayrose, I. The Chromosome Counts Database (CCDB)—A community resource of plant chromosome numbers. New Phytol. 2015, 206, 19–26. [Google Scholar] [CrossRef] [PubMed]
- Goldblatt, P.; Johnson, D. Index to Plant Chromosome Numbers (ICPN Reports); Missouri Botanical Garden: St. Louis, Missouri, 2015. [Google Scholar]
- Gonzhlez-Aguilera, J.; FernCtndez-Peralta, A.; Safiudo, A. Cytogenetic and evolutionary studies on the Spanish species of the Family Resedaceae L: Sections Phyteuma L and Resedastrum Duby. Bol. Soc. Brot. Ser. 1980, 2, 519–536. [Google Scholar]
- Pustahija, F.; Brown, S.C.; Bogunić, F.; Bašić, N.; Muratović, E.; Ollier, S.; Hidalgo, O.; Bourge, M.; Stevanović, V.; Siljak-Yakovlev, S. Small genomes dominate in plants growing on serpentine soils in West Balkans, an exhaustive study of 8 habitats covering 308 taxa. Plant. Soil 2013, 373, 427–453. [Google Scholar] [CrossRef]
- Sañudo, A.; Rejon, R. Sobre la Naturaleza Autoploide de Algunas Plantas Silvestre. An. Inst. Bot. Cavanilles 1975, 32, 633–648. [Google Scholar]


| n | G0/G1 (%) | 2C DNA Content (pg) | 1C DNA Content (pg) | 1C DNA Content (Mbp) | 2C K-Mer (pg) | 1C K-Mer (pg) | 1C K-Mer (Mbp) | |
|---|---|---|---|---|---|---|---|---|
| Reseda lutea | 3 | 86.53 ± 2.20 | 1.91 ± 0.02 | 0.955 ± 0.01 | 973.11 | 1.78 | 0.89 | 867.7 |
| Reseda pentagyna | 3 | 80.96 ± 0.83 | 2.09 ± 0.029 | 1.045 ± 0.015 | 1026.9 | 1.84 | 0.92 | 896.3 |
| Species | 2C (pg) | Chromosome Number | Ploidy Level | Basic Chromosome Number | Section | |
|---|---|---|---|---|---|---|
| 1 | R. lutea | 2.06 | 24, 48 | 4-8 | 6 | Resedastrum |
| 2 | R. stricta | 2.86 | 24 | 4 | 6 | |
| 3 | R. lanceolata | 1.70 | 24 | 4 | 6 | |
| 4 | R. odorata | 0.96 | 12 | 2 | 6 | Phyteuma |
| 5 | R. phyteuma | 1.34 | 24 | 4 | 6 | |
| 6 | R. media | 2.09 | 12 | 2 | 6 | |
| 7 | R. undata | 1.22 | 20 | 4 | 5 | Leucoreseda |
| 8 | R. barrelieri | 1.68 | 20 | 4 | 5 | |
| 9 | R. suffruticosa | 0.92 | 20 | 4 | 5 | |
| 10 | R. alba | 1.45 | 40 | 8 | 5 | |
| 11 | R. luteola | 1.75 | 24 | 4 | 6 | Luteola |
| 12 | R. glauca | 2.11 | 28 | 4 | 7 | Glaucoreseda |
| 13 | R. complicata | 1.71 | 28 | 4 | 7 | |
| 14 | R. virgata | 1.44 | 28 | 4 | 7 | |
| 15 | R. gredensis | 2.63 | 28 | 4 | 7 |
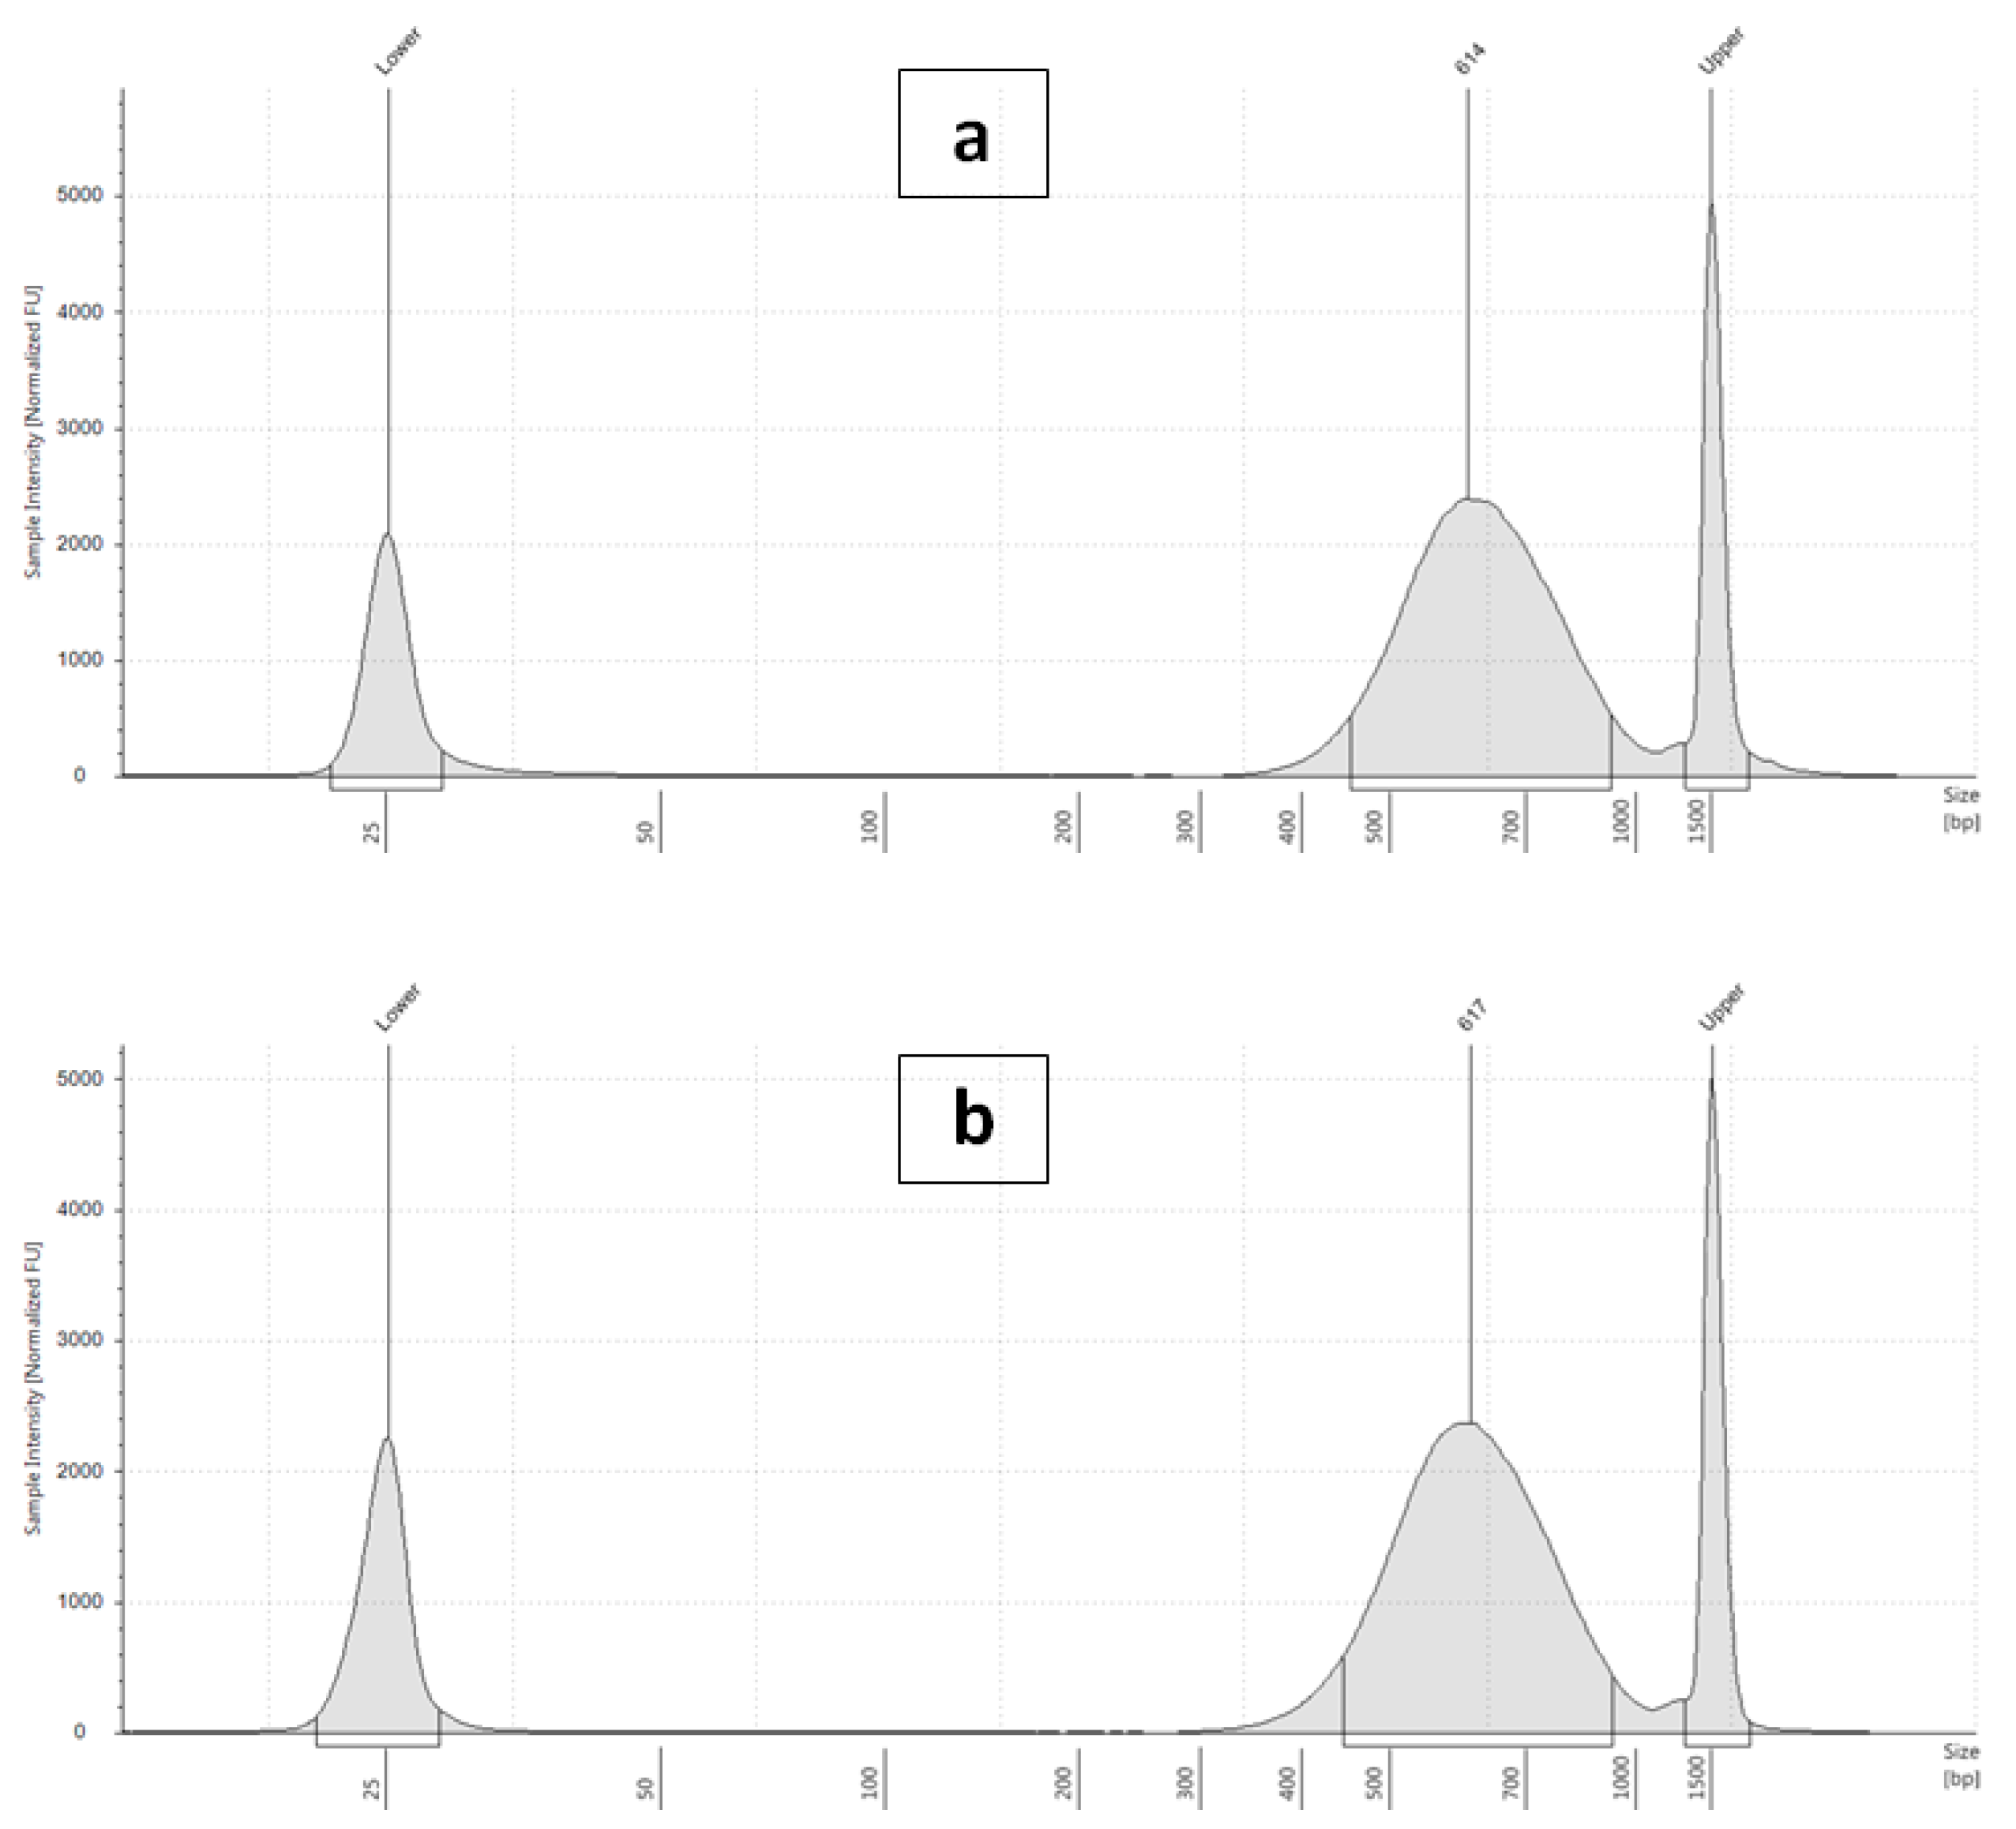
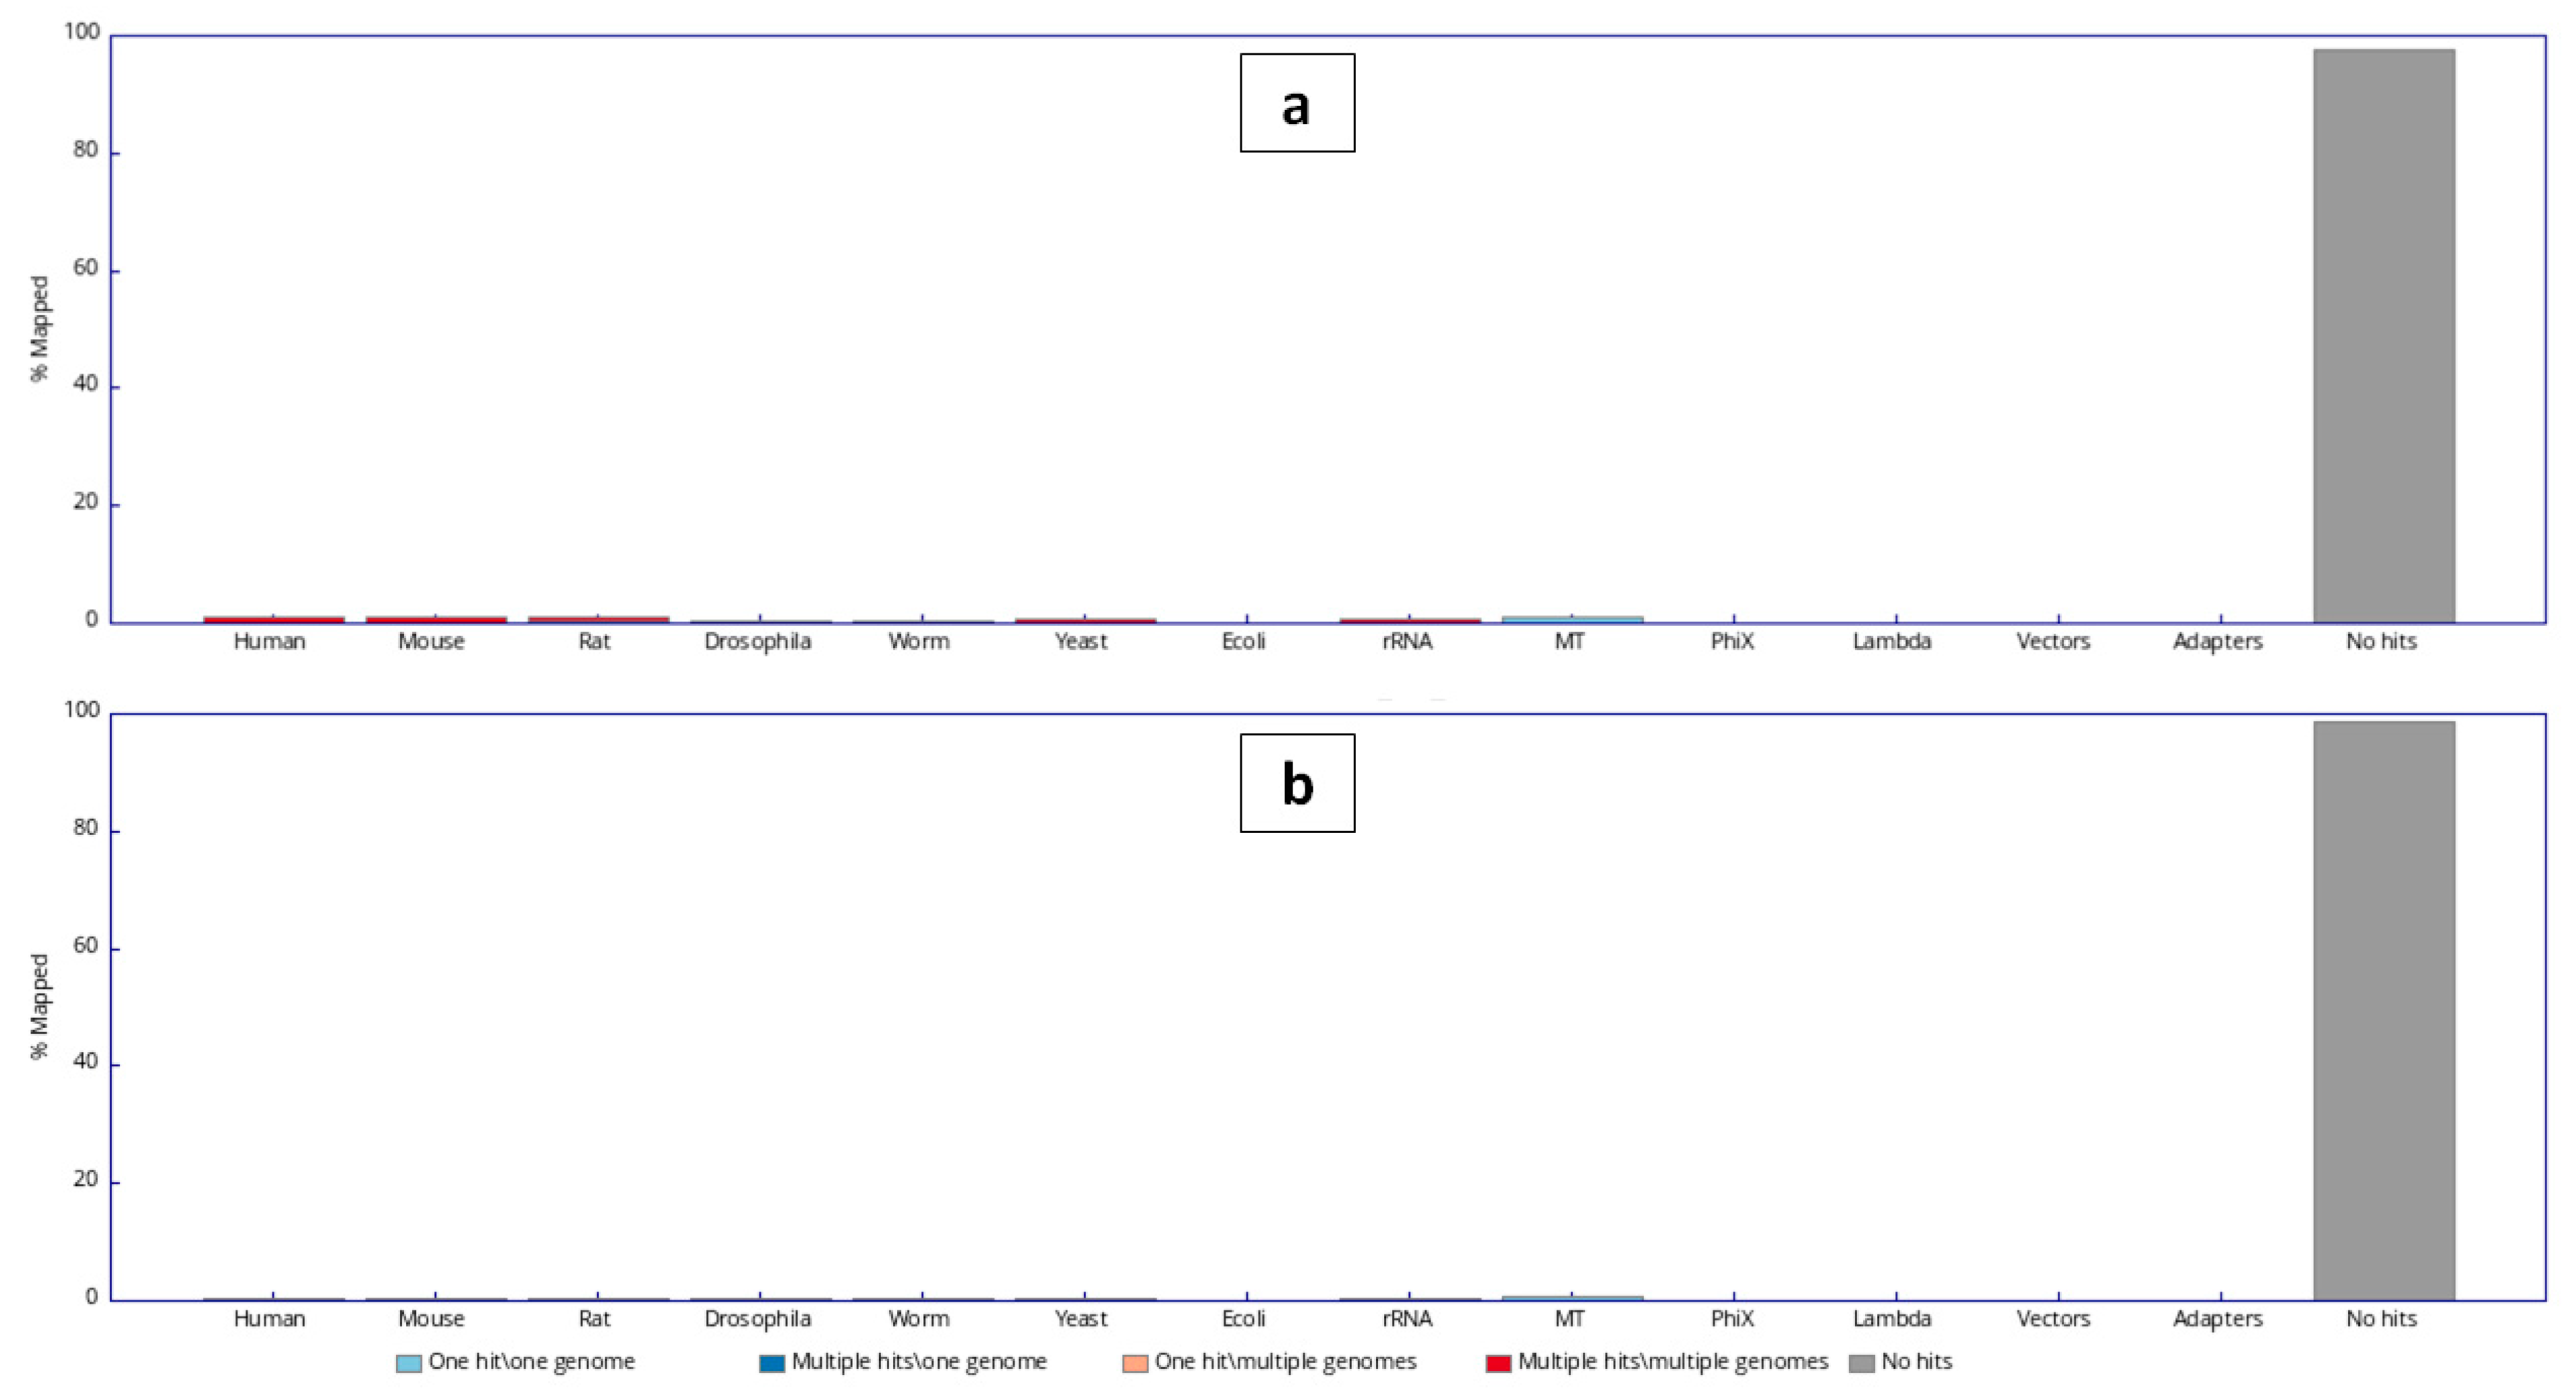
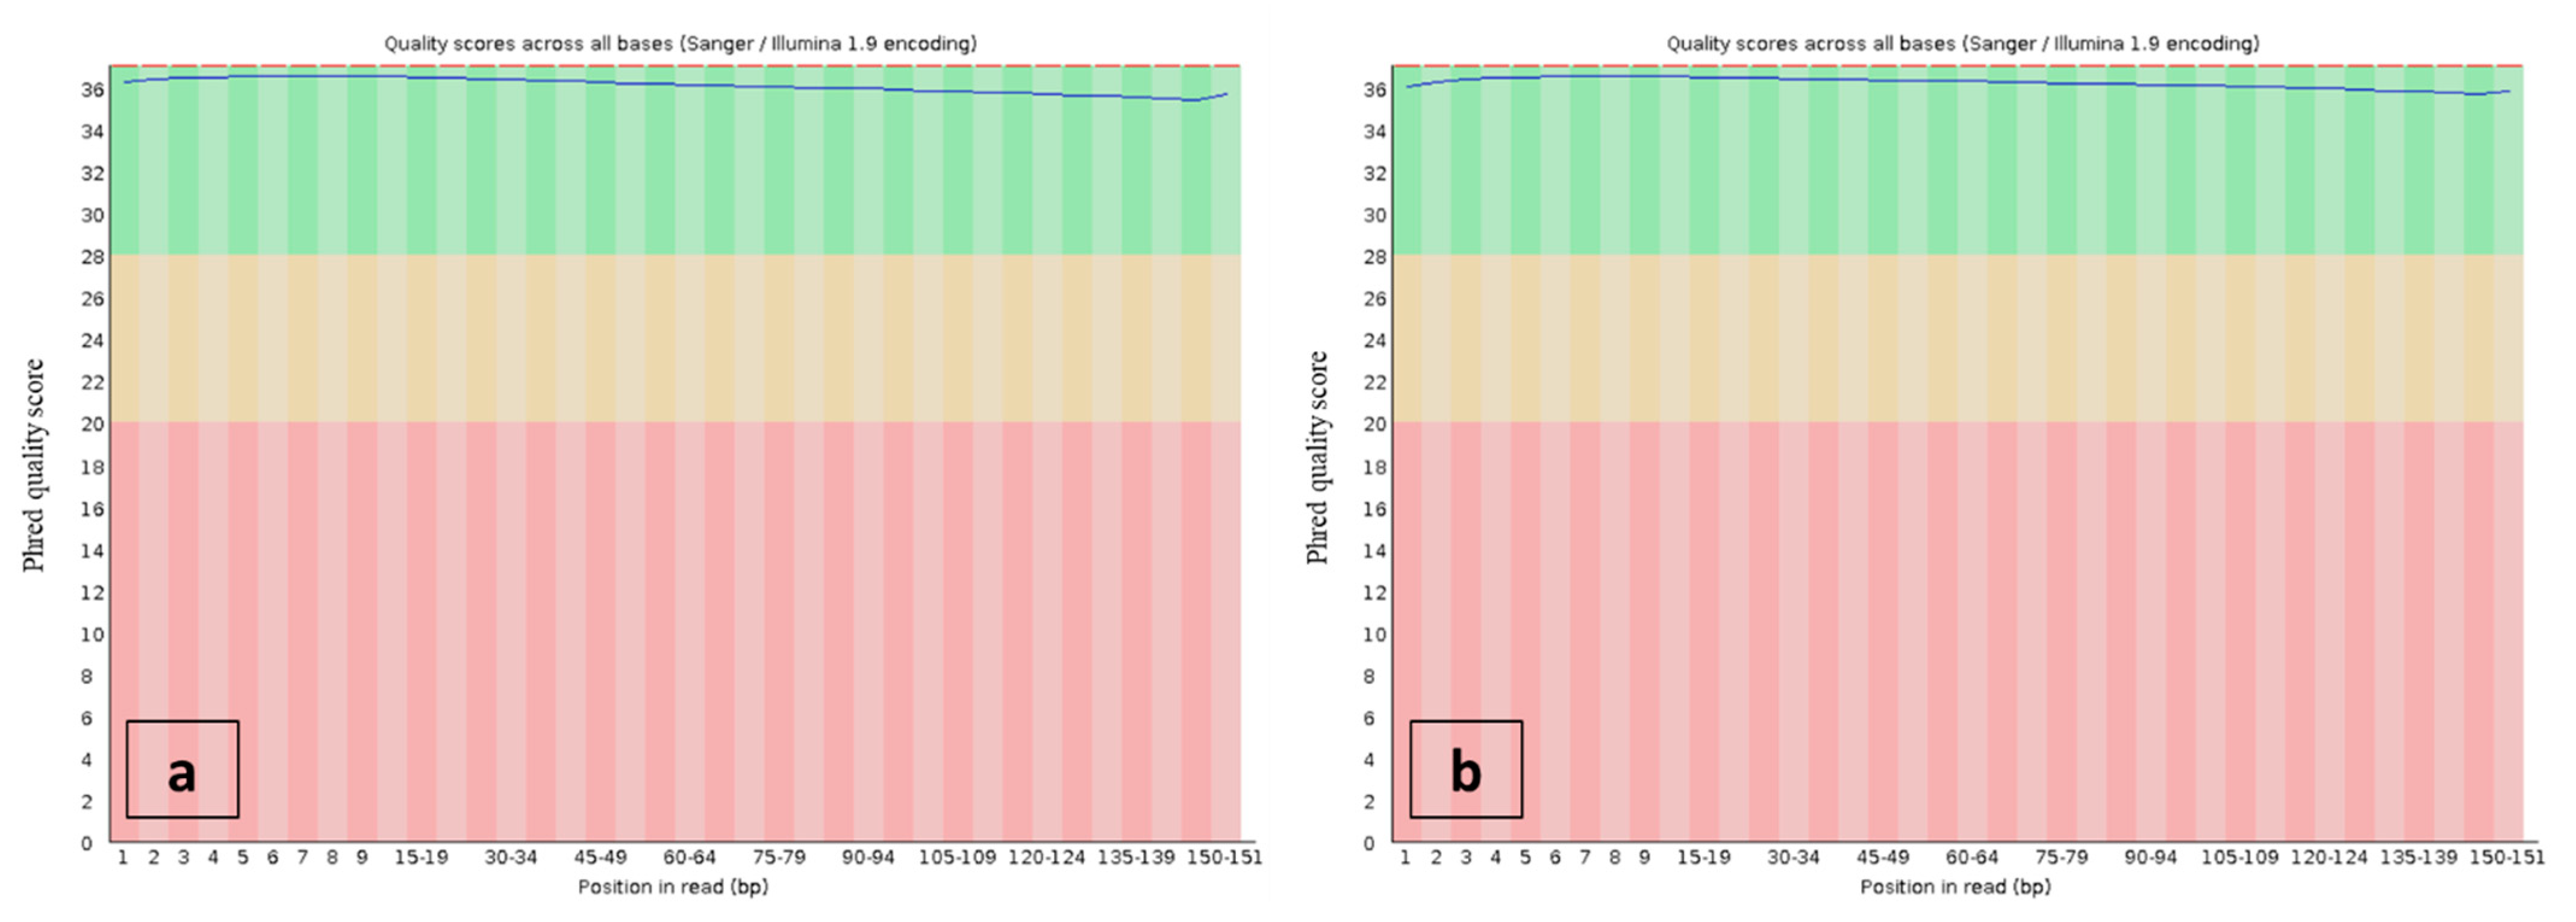
| Sample ID | Fragment Length (bp) | Read Length (bp) | Total Reads | Clean Unmapped Reads a | GC(%) | AT(%) | Q20(%) | Q30(%) |
|---|---|---|---|---|---|---|---|---|
| Reseda lutea | 614 | 2 × 151 | 716,375,240 | 637,861,144 | 45.01 | 54.99 | 95.83 | 90.59 |
| Reseda pentagyna | 617 | 2 × 151 | 704,839,182 | 632,346,592 | 52.83 | 47.17 | 97.18 | 92.59 |
| Reseda lutea | |||||||
| Genome Estimation Software | K21 | K31 | K41 | Average Processed data (SD) | |||
| R | P | R | P | R | P | ||
| General Formula | 845 | 851 | 860 | 868 | 876 | 884 | 867.7 (16.5) |
| FindGSE | 864 | 876 | 972 | 988 | 1077 | 1078 | 980.7 (101.2) |
| Covest-Repeat | 826 | 772 | 885 | 958 | 1123 | 1209 | 979.67 (219.3) |
| Kmergenie | 391 | 401 | 471 | 483 | 542 | 559 | 447.7 (132.6) |
| GenomeScope V1 | 584 | 591 | 652 | 665 | 788 | 796 | 684 (103.8) |
| Reseda pentagyna | |||||||
| Genome Estimation Software | K21 | K31 | K41 | Average Processed data (SD) | |||
| R | P | R | P | R | P | ||
| General Formula | 871 | 880 | 874 | 882 | 931 | 927 | 896.3 (26.6) |
| FindGSE | 768 | 781 | 825 | 848 | 935 | 971 | 866.7 (96.4) |
| Covest-Repeat | 817 | 825 | 1010 | 1067 | 1249 | 1318 | 1070 (246.51) |
| Kmergenie | 484 | 486 | 582 | 591 | 611 | 614 | 552.3 (66.4) |
| GenomeScope V1 | 515 | 524 | 602 | 619 | 723 | 748 | 630.3 (112.4) |
| Genome size Property * | Reseda lutea | Reseda pentagyna | ||
|---|---|---|---|---|
| min | max | min | max | |
| Homozygous (%) | 98.96 | 98.96 | 98.63 | 98.63 |
| Heterozygous (%) | 1.04 | 1.04 | 1.37 | 1.37 |
| Genome Haploid Length (bp) | 789,888,133 | 796,236,693 | 747,545,978 | 747,661,754 |
| Genome Repeat Length (bp) | 562,888,521 | 566,147,654 | 424,413,611 | 424,480,553 |
| Genome Unique Length (bp) | 226,999,612 | 230,089,039 | 323,132,368 | 323,181,201 |
| Model Fit (%) | 91.35 | 97.38 | 95.13 | 98.3 |
| Read Error Rate (%) | 0.06 | 0.06 | 0.12 | 0.12 |
| Repeats (%) | 71.26 | 71.1 | 56.77 | 56.77 |
Publisher’s Note: MDPI stays neutral with regard to jurisdictional claims in published maps and institutional affiliations. |
© 2021 by the authors. Licensee MDPI, Basel, Switzerland. This article is an open access article distributed under the terms and conditions of the Creative Commons Attribution (CC BY) license (https://creativecommons.org/licenses/by/4.0/).
Share and Cite
Al-Qurainy, F.; Gaafar, A.-R.Z.; Khan, S.; Nadeem, M.; Alshameri, A.M.; Tarroum, M.; Alansi, S.; Almarri, N.B.; Alfarraj, N.S. Estimation of Genome Size in the Endemic Species Reseda pentagyna and the Locally Rare Species Reseda lutea Using comparative Analyses of Flow Cytometry and K-Mer Approaches. Plants 2021, 10, 1362. https://doi.org/10.3390/plants10071362
Al-Qurainy F, Gaafar A-RZ, Khan S, Nadeem M, Alshameri AM, Tarroum M, Alansi S, Almarri NB, Alfarraj NS. Estimation of Genome Size in the Endemic Species Reseda pentagyna and the Locally Rare Species Reseda lutea Using comparative Analyses of Flow Cytometry and K-Mer Approaches. Plants. 2021; 10(7):1362. https://doi.org/10.3390/plants10071362
Chicago/Turabian StyleAl-Qurainy, Fahad, Abdel-Rhman Z. Gaafar, Salim Khan, Mohammad Nadeem, Aref M. Alshameri, Mohamed Tarroum, Saleh Alansi, Naser B. Almarri, and Norah S. Alfarraj. 2021. "Estimation of Genome Size in the Endemic Species Reseda pentagyna and the Locally Rare Species Reseda lutea Using comparative Analyses of Flow Cytometry and K-Mer Approaches" Plants 10, no. 7: 1362. https://doi.org/10.3390/plants10071362