Article

Genome-Wide Identification of the HMA Gene Family and Expression Analysis under Cd Stress in Barley

College of Life and Environmental Sciences, Hangzhou Normal University, Hangzhou 311121, China
*
Authors to whom correspondence should be addressed.
Plants 2021, 10(9), 1849; https://doi.org/10.3390/plants10091849
Submission received: 15 August 2021 / Revised: 31 August 2021 / Accepted: 3 September 2021 / Published: 6 September 2021
(This article belongs to the Special Issue Crop Molecular Physiology of Abiotic Stress)

Abstract

:
In recent years, cadmium (Cd) pollution in soil has increased with increasing industrial activities, which has restricted crop growth and agricultural development. The heavy metal ATPase (HMA) gene family contributes to heavy metal stress resistance in plants. In this study, 21 HMA genes (HvHMAs) were identified in barley (Hordeum vulgare L., Hv) using bioinformatics methods. Based on phylogenetic analysis and domain distribution, barley HMA genes were divided into five groups (A–E), and complete analyses were performed in terms of physicochemical properties, structural characteristics, conserved domains, and chromosome localization. The expression pattern analysis showed that most HvHMA genes were expressed in barley and exhibited tissue specificity. According to the fragments per kilobase of exon per million fragments values in shoots from seedlings at the 10 cm shoot stage (LEA) and phylogenetic analysis, five HvHMA genes were selected for expression analysis under Cd stress. Among the five HvHMA genes, three (HvHMA1, HvHMA3, and HvHMA4) were upregulated and two (HvHMA2 and HvHMA6) were downregulated following Cd treatments. This study serves as a foundation for clarifying the functions of HvHMA proteins in the heavy metal stress resistance of barley.

1. Introduction

Cadmium (Cd) pollution is one of the negative consequences of industrialization. Cd is highly toxic to plants and is easily absorbed by the roots and accumulates in the tissues [1], which influences various processes including water and mineral uptake, respiration, and photosynthesis, and leads to the inhibition of growth and even death [2]. Cd ions with a lack of specificity enter the plant through other transporters (Fe2+/Fe3+, Zn2+, and Mn2+) and compete with other nutrients for plant uptake, resulting in deficient nutrition [3,4]. In response to Cd poisoning, various defense mechanisms have evolved in plants, such as extrusion across plasma membrane, chelation in the cytosol, and vacuolar sequestration [5]. Previous studies have identified multiple proteins related to Cd transport, including heavy metal ATPase (HMA) [6], yellow stripe-like proteins (YSL) [7], and natural resistance-associated macrophage proteins (NRAMP) [8], to name a few.
HMA, also known as P1B-ATPase, is a type of protein combining ATP hydrolysis with metal ion transport across membranes [9,10] participating in absorbing and transporting heavy metal ions (Cu2+, Zn2+, Co2+, Cd2+, and Pb2+) [6]. Typical HMA proteins contain the E1–E2 ATPase domain and haloacid dehalogenase-like hydrolase (Hydrolase) domain [11]. Additionally, both sides of the N-terminal and C-terminal metal-binding sites may possess one or more soluble metal-binding domains (MBDs) that interact with or bind to specific metal ions [6]. At present, a number of HMA genes have been identified in plants, including 8 in Arabidopsis thaliana [12], 9 in rice (Oryza sativa L.) [12] 11 in maize (Zea mays L.) [13], 11 in sorghum (Sorghum bicolor L.) [13], 17 in Populus trichocarpa [11], and 20 in soybean (Glycine max L.) [14]. Studies have demonstrated that AtHMA2 and AtHMA4 are two essential genes mediating Cd translocation in A. thaliana [15]. The translocation of Cd from the roots to shoots was near-completely abolished in the hma2 hma4 double mutant. TcHMA3, a tonoplast-localized transporter highly specific for Cd, is responsible for sequestering Cd into the leaf vacuoles so as to detoxify Cd in Thlaspi caerulescens [16]. OsHMA3, which localizes to vacuolar membranes, was identified as the gene that controls root-to-shoot Cd translocation rates in rice [17]. These results indicate that the HMA gene family plays diverse roles in plant resistance to Cd stress.
Barley (Hordeum vulgare L., Hv), an important cereal crop, is widely used in numerous industries, including animal feed, brewing, and food [18]. The exploration of vital genes related to heavy metal stress resistance is beneficial for cultivating Cd-tolerant barley varieties. Recent barley genome sequencing accomplishments have facilitated further studies on barley genomics. Studies on the SBP-box [19], WRKY [20], ABC [21], F-box [22], and SOD [23] gene family in barley have been successfully completed. Although the functions of several HMA proteins in barley have been reported [24,25], genome-wide analysis of the HvHMA family is lacking. In this study, the HvHMA gene family was genome-widely identified in barley, and the phylogenetic relationships, structural characteristics, physicochemical properties, chromosomal location, as well as the tissue expression of identified members were analyzed. Moreover, the expression of some members following Cd treatment was investigated using quantitative real-time polymerase chain reaction (qRT-PCR). These combined analyses of the biological characteristics and expression changes of the HvHMA gene family provide helpful information for studying the function of HvHMA genes and improve the Cd tolerance of barley varieties.

2. Materials and Methods

2.1. Plant Materials and Treatment

The ‘ZJU3’ barley variety was used in this study. Seeds uniform in size and with a full shape were selected and sterilized in 2.5% NaClO for 10 min, rinsed with distilled water four times, and then germinated at 28 °C under dark conditions. After 48 h, seedlings with a root length of approximately 0.5 cm were moved to hydroponic culture boxes (day/night temperatures of 26 °C/24 °C, light/dark photoperiod of 14 h/10 h, and light intensity of 18000 Lx). At the one-leaf stage, the seedlings were treated with 1/4 Hoagland’s nutrient solution. At the two-leaf stage, Cd stress experiments were performed. The CdCl2 solutions (50 μmol/L and 100 μmol/L) prepared with Hoagland’s nutrient solution were used to simulate Cd stress, and Hoagland’s nutrient solution without CdCl2 was used as the control. After 120 h of treatment, more than 10 barley seedlings were selected for each sample, and quickly stored at −80 °C until analysis. The experiment was performed in triplicate. The Hoagland’s nutrient solution formula was as described by Zhang et al. [26].

2.2. RNA Isolation and cDNA Synthesis

The total RNA was isolated from barley leaves using an RNA extraction kit (Tiangen, Beijing, China) and reverse transcribed to generate cDNA using a reverse transcription kit (Yeasen, Shanghai, China). The cDNA obtained was stored at −20 °C for qRT-PCR analysis.

2.3. Bioinformatics Analysis of the Barley HMA Gene Family

2.3.1. Identification and Structural Analysis of Barley HMA Genes

The HMA protein sequences of A. thaliana and rice were obtained from TAIR (https://www.arabidopsis.org/index.jsp; accessed on 3 July 2020) and RiceData (https://www.ricedata.cn/gene/; accessed on 3 July 2020), respectively. The HMMER profiles related to the conserved domains of HMA proteins (E1–E2 ATPase: PF00122; Hydrolase: PF00702) were downloaded from the Pfam database (http://pfam.xfam.org/; accessed on 9 July 2020) [27]. First, the candidate protein sequences were uploaded onto the CD-HIT website (http://weizhong-lab.ucsd.edu/cdhit-web-server/cgi-bin/index.cgi?cmd=cd-hit; accessed on 16 July 2020) [28] and SMART Web server (http://smart.embl-heidelberg.de/; accessed on 17 July 2020) [29] to remove sequences without E1-E2 ATPase and Hydrolase domains. Afterward, the non-redundant barley HMA proteins were obtained by manually removing the redundant sequences. The batch sequence search function in the Pfam database was used to obtain gene annotation files, and TBtools v1.087 (Chen, C.C., South China Agricultural University (SCAU), Guangdong, China) was then used to draw the domain map. The molecular characteristics of the HvHMA proteins were analyzed in ExPASy (Compute pI/Mwtool) (https://web.expasy.org/protparam/; accessed on 26 July 2020) including the number of amino acid (aa) residues, molecular weight (MW), theoretical isoelectric point (pI), and grand average of hydropathicity (GRAVY). WoLF PSORT (https://wolfpsort.hgc.jp/; accessed on 31 July 2020) [30] was used to predict the subcellular localization of the HvHMA proteins. The conserved motifs of the HvHMA proteins were mapped using the MEME online tool (http://meme-suite.org/tools/meme; accessed on 4 August 2020) [31]. The intron-exon organizations of the HvHMA genes were generated using Gene Structure Display Server v2.0 (GSDS v2.0, http://gsds.cbi.pku.edu.cn/; accessed on 6 August 2020) (Center for Bioinformatics (CBI), Beijing, China) [32] by comparing the cDNAs to their corresponding genomic DNA sequences. The HvHMA genes were mapped to barley chromosomes based on physical location information from the EnsemblPlants database (http://plants.ensembl.org/Hordeum_vulgare/Info/Index; accessed on 6 August 2020) using Tbtools v1.087.

2.3.2. Phylogenetic Analysis of the Barley HMA Family

The HMA protein sequences of A. thaliana, rice, and barley were imported into the MEGA v7.0 program (Sudhir Kumar, Temple University, Philadelphia, PA, USA) and multiple sequence alignments were performed using ClustalW. The alignment file was then used to construct a neighbor-joining (NJ) phylogenetic tree, with the following parameters: p-distance model, 1000 bootstrap replications, and other default parameters [33]. The tree was displayed and modified using the iTOL website (https://itol.embl.de/; accessed on 12 August 2020) [34].

2.3.3. Expression Profiling of the Barley HMA Family and Candidate Gene Selection

The RNA-Seq data of 15 developmental stages were downloaded from the IPK website (https://apex.ipk-gatersleben.de/apex/f?p=284:10; accessed on 20 August 2020) for mapping HvHMA expression profiles. The 15 developmental stages were as follows: 4-day embryos (EMB); roots from seedlings (10 cm shoot stage) (ROO1); shoots from seedlings (10 cm shoot stage) (LEA); developing inflorescences (INF2); developing tillers, 3rd internode (5 DAP) (NOD); developing grain (5 DAP) (CAR5); developing grain (15 DAP) (CAR15); etiolated seeding, dark conditions (10 DAP) (ETI); inflorescences, lemma (42 DAP) (LEM); inflorescences, lodicule (42 DAP) (LOD); dissected inflorescences (42 DAP) (PAL); epidermal strips (28 DAP) (EPI); inflorescences, rachis (35 DAP) (RAC); roots (28 DAP) (ROO2); and senescing leaves (56 DAP) (SEN). The expression of HvHMA genes was normalized and represented in fragments per kilobase of exon per million fragments mapped (FPKM). The HvHMA expression profile based on the FPKM values was then drawn using the Multiple Experiment Viewer (MeV) (J. Craig Venter Institute, La Jolla, CA, USA) [35]. Based on the FPKM values at the 10 cm shoot stage and phylogenetic analysis, the candidate genes were selected for qRT-PCR experiments.

2.4. Quantitative RT-PCR Analysis of Barley HMA Genes

Five pairs of primers related to specific genes were designed using Primer Premier v5.0 (PREMIER Biosoft, San Francisco, CA, USA) for qRT-PCR (Table 1). The barley actin gene HvActin (HORVU1Hr1G002840) was used as an internal control. The qRT-PCR analysis was performed on the CFX96 Real-Time PCR Detection System (Bio-Rad, Hercules, CA, USA), and the data were analyzed using the 2−ΔΔCt method with three biological replicates [36]. IBM SPSS Statistics v20 (IBM, Armonk, NY, USA) statistical software was then used to analyze significance (*, **, and *** indicates p < 0.05, p < 0.01, and p < 0.001 respectively). Histograms were drawn with SigmaPlot v10.0 (SYSTAT, San Jose, CA, USA).

3. Results

3.1. Identification and Molecular Characteristics of Barley HMA Proteins

Through multiple bioinformatics analyses, a total of 21 barley HMA proteins were screened by removing redundant sequences and validating domains, which were named HvHMA1-21. The basic information on HvHMA1-21, including the number of amino acid residues, molecular weight, theoretical isoelectric point, grand average of hydropathicity, and subcellular localization, which indicated molecular characteristics of barley HMA proteins, is listed in Table 2. The results showed that the 21 HvHMA proteins contained 672 (HvHMA5) to 1083 (HvHMA21) amino acid residues with molecular weights ranging from 73112.29 (HvHMA5) to 118116.93 (HvHMA21) Da. The theoretical isoelectric points of the 21 HvHMA proteins ranged from 5.00 (HvHMA8) to 7.82 (HvHMA17), with the majority constituting acidic proteins. The GRAVY numeric values of the 21 HvHMA proteins varied from −0.090 (HvHMA1) to 0.422 (HvHMA3), indicating that these proteins were likely amphoteric proteins. Additionally, the subcellular localization results showed that the 18 HvHMA proteins were localized in the plasma membrane, whereas three proteins (HvHMA9, HvHMA14, and HvHMA19) were localized in the endoplasmic reticulum.

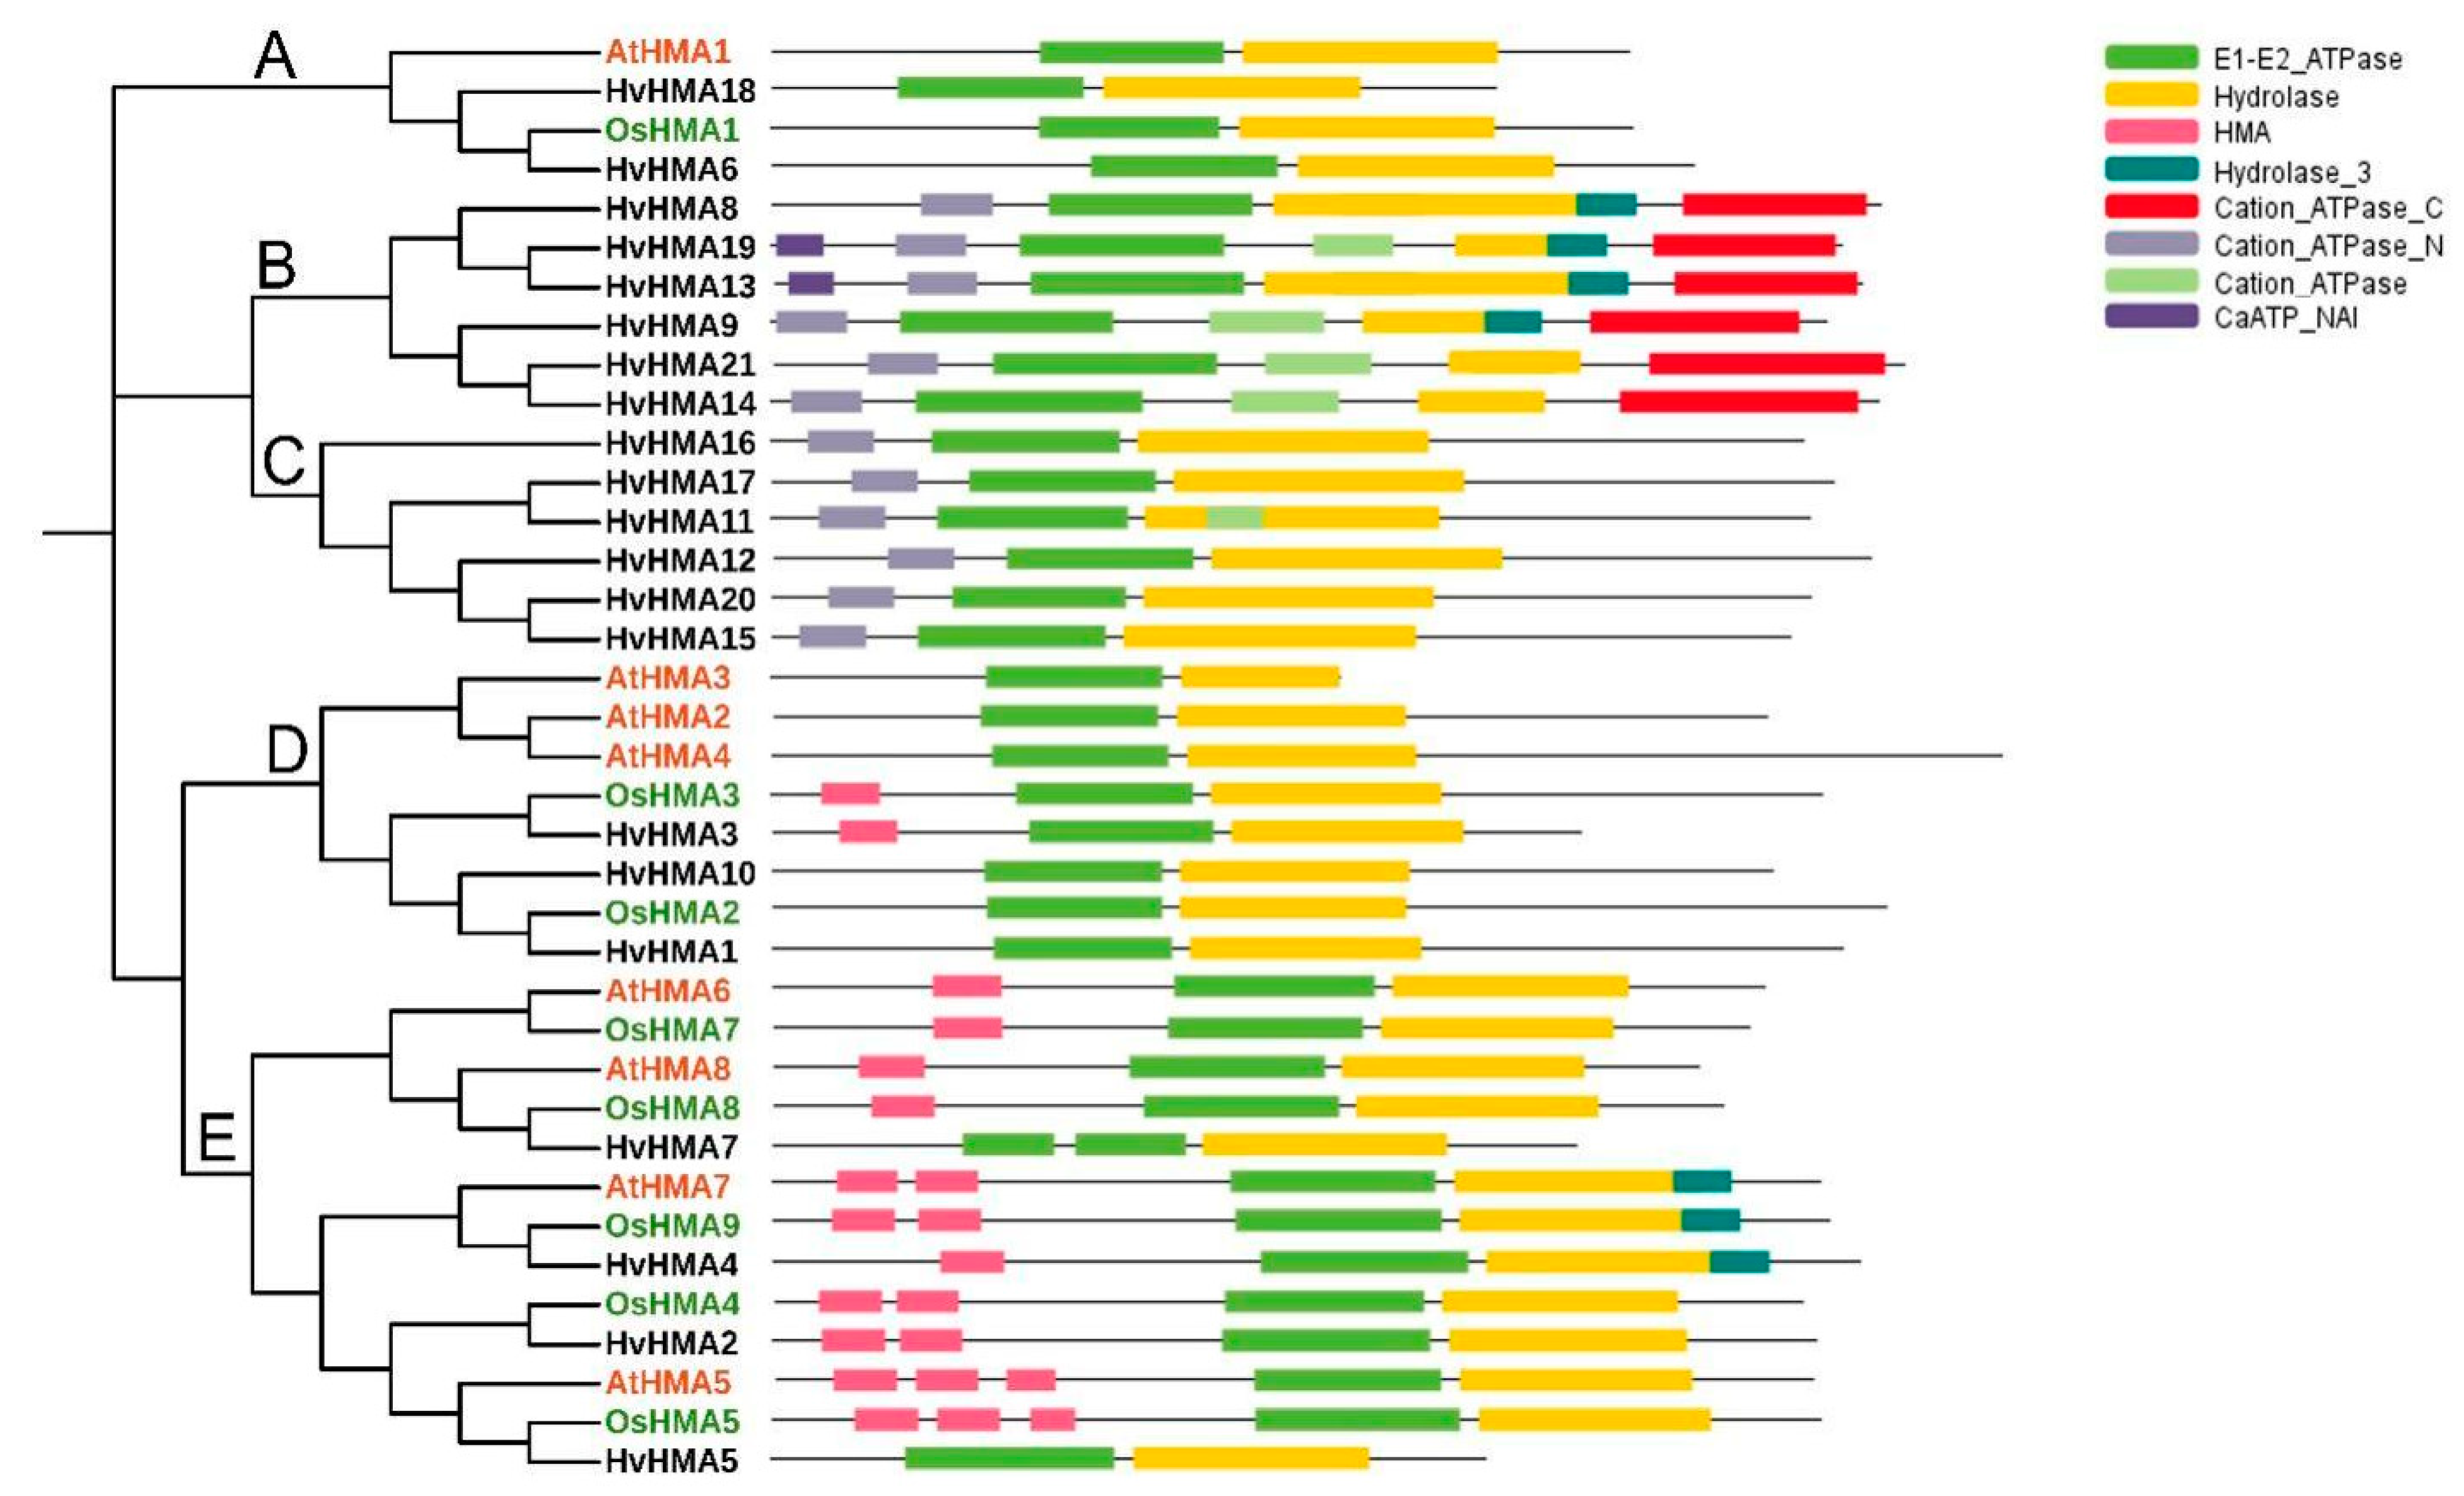
3.2. Phylogenetic Analysis and Classification of Barley HMA Genes

To explore the evolutionary characteristics of HvHMA genes and the evolutionary relationships between the AtHMA, OsHMA, and HvHMA genes, HMA sequences from A. thaliana, rice, and barley, including 8 AtHMA proteins, 8 OsHMA proteins, and 21 HvHMA proteins, were subjected to phylogenetic analysis. As shown in Figure 1, the HvHMA genes were divided into five groups (A–E). Among the 21 HvHMA genes, 2 belong to group A, 6 to group B, 6 to group C, 3 to group D, and 4 to group E. The phylogenetic tree indicated that members of groups A, D, and E were homologous to the AtHMA and OsHMA proteins. Moreover, compared to dicotyledonous A. thaliana, monocotyledonous barley and rice were more closely related. With the exception of the E1-E2 ATPase and Hydrolase domains, some HvHMA proteins contained other domains including an HMA domain, Cation_ATPase_N domain, Cation_ATPase_C domain, Cation_ATPase domain, Hydrolase_3 domain, and CaATP_NAI domain, which revealed that the HvHMA proteins contained more abundant domains than the AtHMA and OsHMA proteins. Thus, it is inferred that members of the barley HMA gene family are more functionally diverse and therefore worth exploring. Additionally, there were some differences among groups in the domain distribution of the HvHMA proteins. The HMA domains were concentrated in groups D and E, the Cation_ATPase_N domains and Cation_ATPase domains were distributed in groups B and C, and Cation_ATPase_C domains were all distributed in group B. In relation to other groups, there were more types of domains in group B, indicating that members of group B might be complex in terms of function.

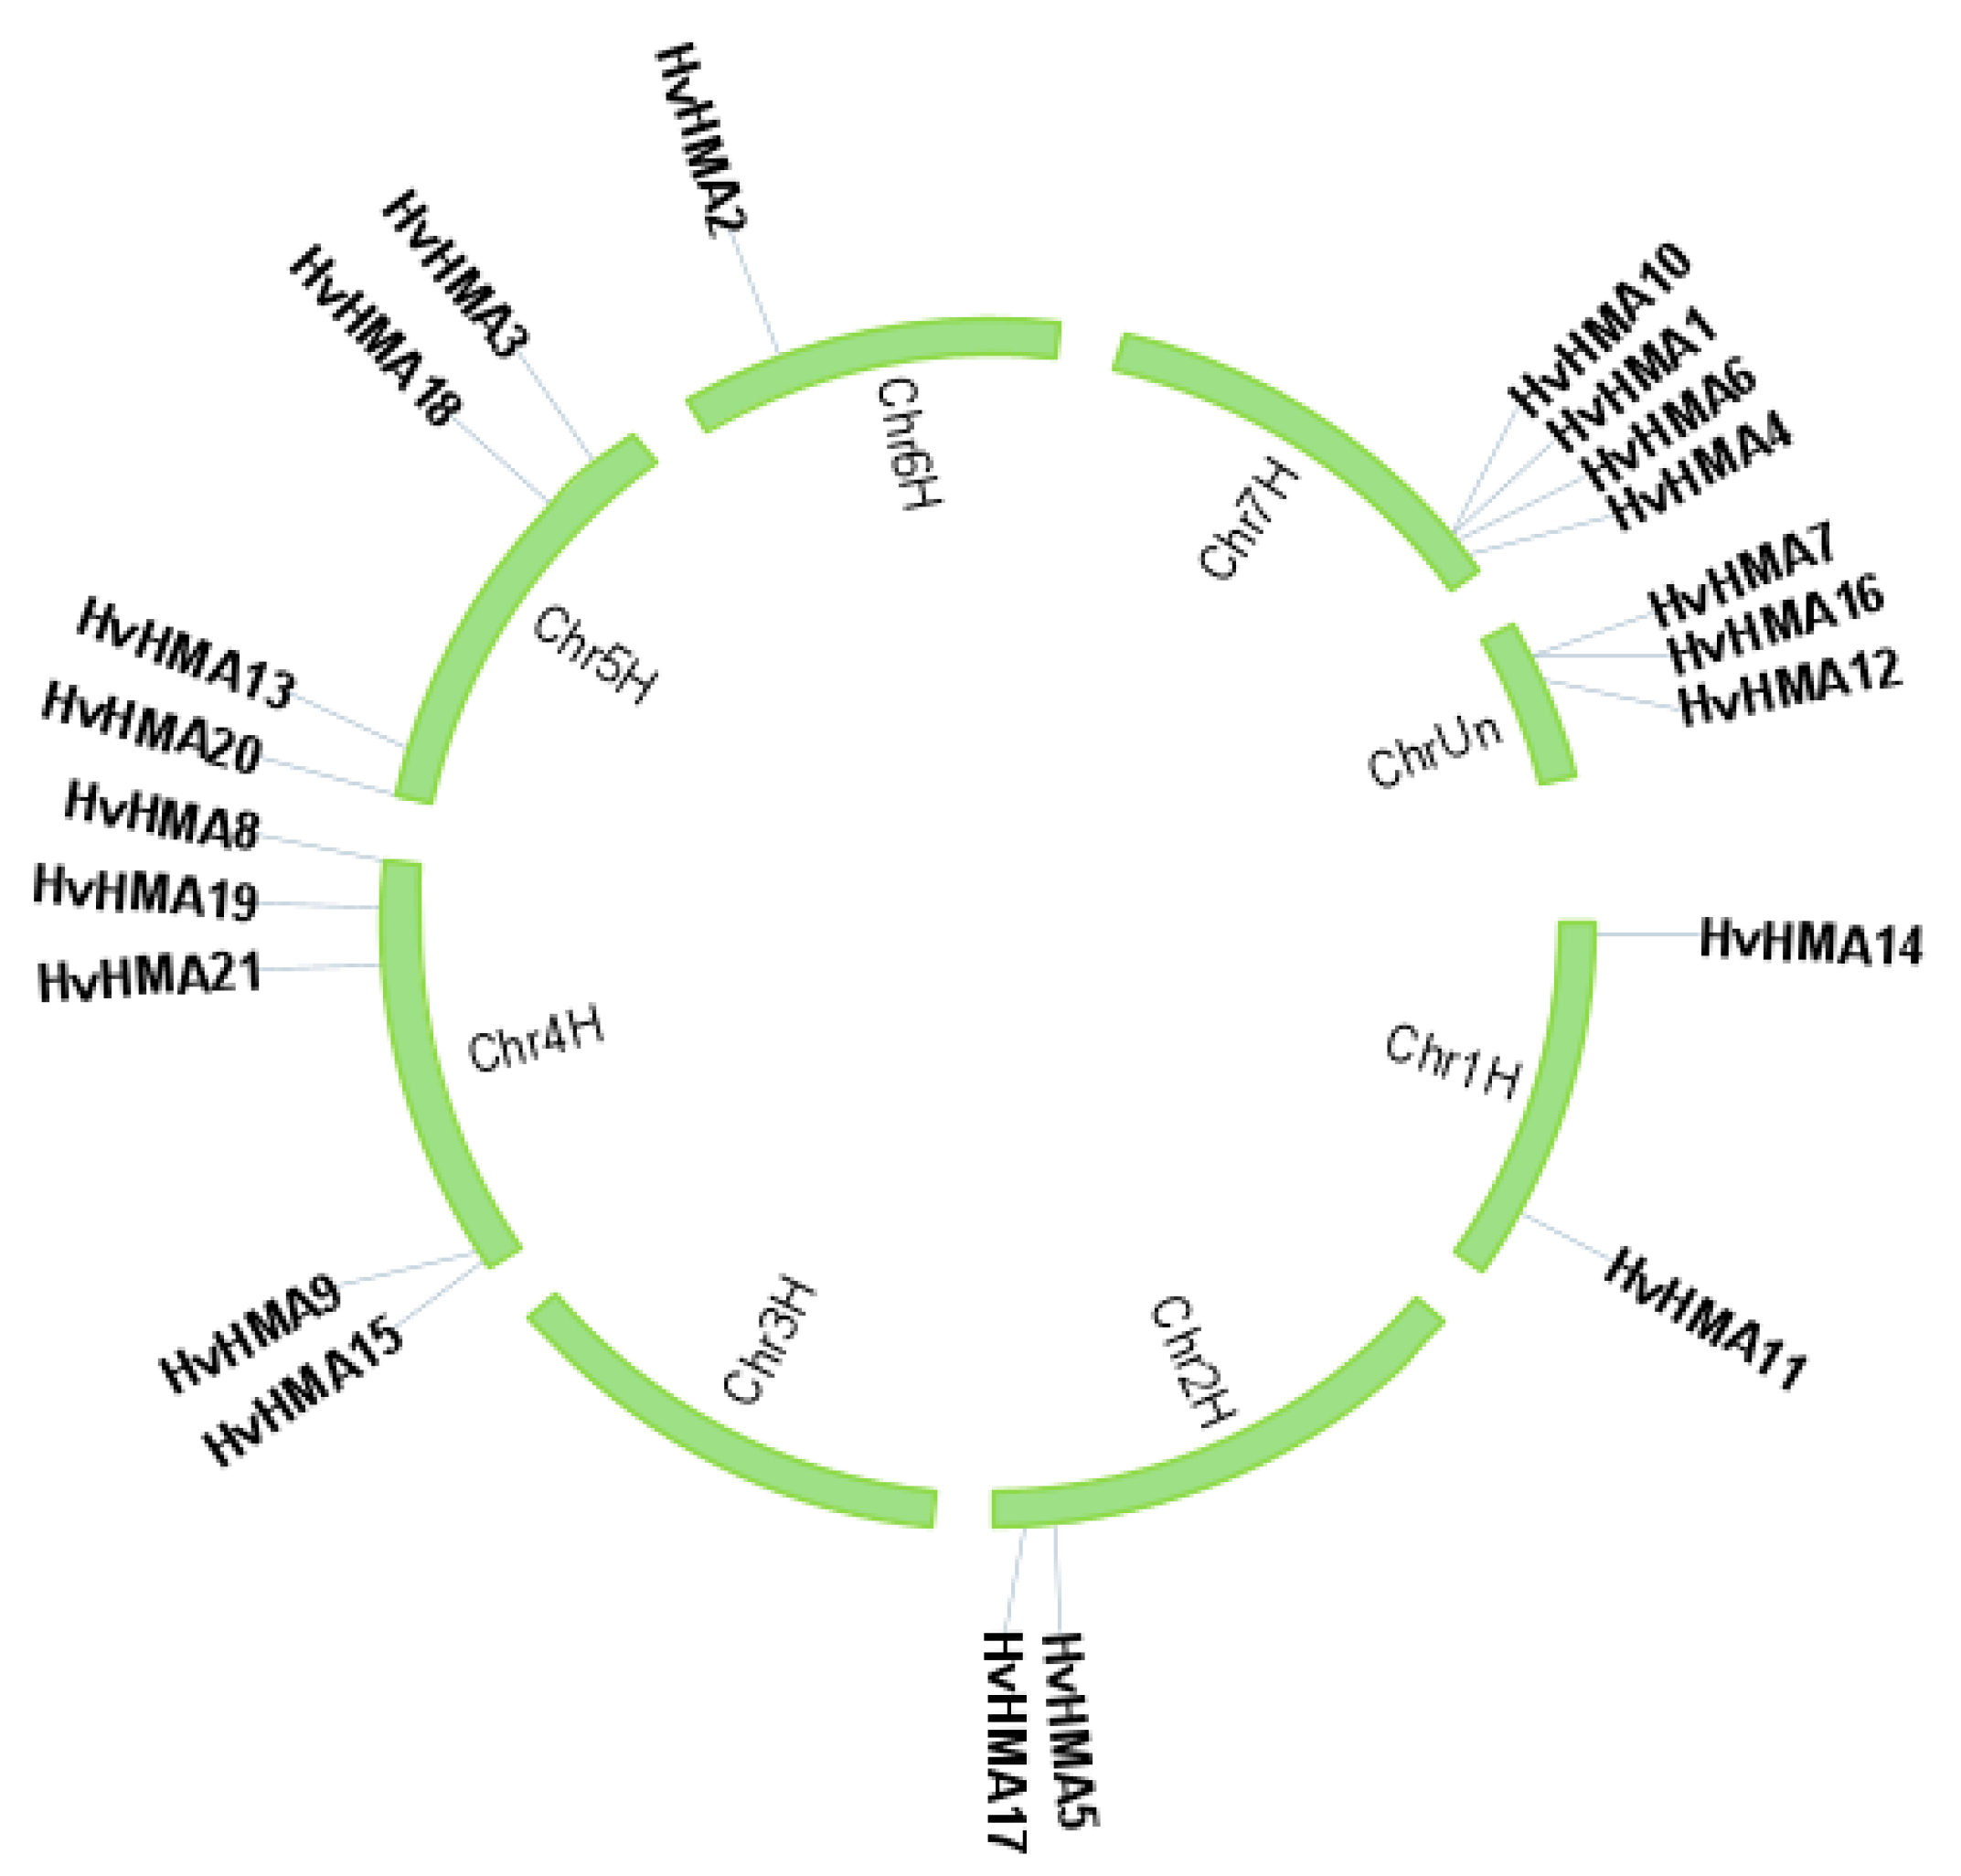
3.3. Chromosomal Location of Barley HMA Genes

According to the genome annotations, 18 of the 21 HvHMA genes were distributed on the six barley chromosomes (Figure 2), with the largest number of genes located on Chr4 (5), followed by Chr5 (4), Chr7 (4), Chr1 (2), Chr2 (2), and Chr6 (1). However, HvHMA7, HvHMA12, and HvHMA16, without clear localization information, were not positioned onto barley chromosomes. In addition, most of the HvHMA genes were concentrated on or near the end of the barley chromosomes. These results suggested that the distribution of HvHMA genes was uneven.

3.4. Motif Composition of the Barley HMA Proteins

Conserved motif analysis of the HvHMA proteins helped elucidate the conservation as well as the diversification of this family, and a total of 10 distinct conserved motifs were revealed. As exhibited in Figure 3, all HvHMA proteins contained common motifs including motif 1 and motif 10, which suggested that the two motifs might be the characteristic motifs of HvHMA proteins. With the exception of HvHMA21, all HvHMA proteins contained motif 3. Additionally, HvHMA proteins within the same group were generally found to show a similar motif composition. For example, motif 2 was distributed in all groups except group A, whereas motif 4, motif 5, motif 6, motif 8, and motif 9 were unique to group C. Moreover, the differences in motif composition among groups combined with the phylogenetic analysis results supported the reliability of the group classifications and indicated that HvHMA genes in distinct groups might be functionally divergent.

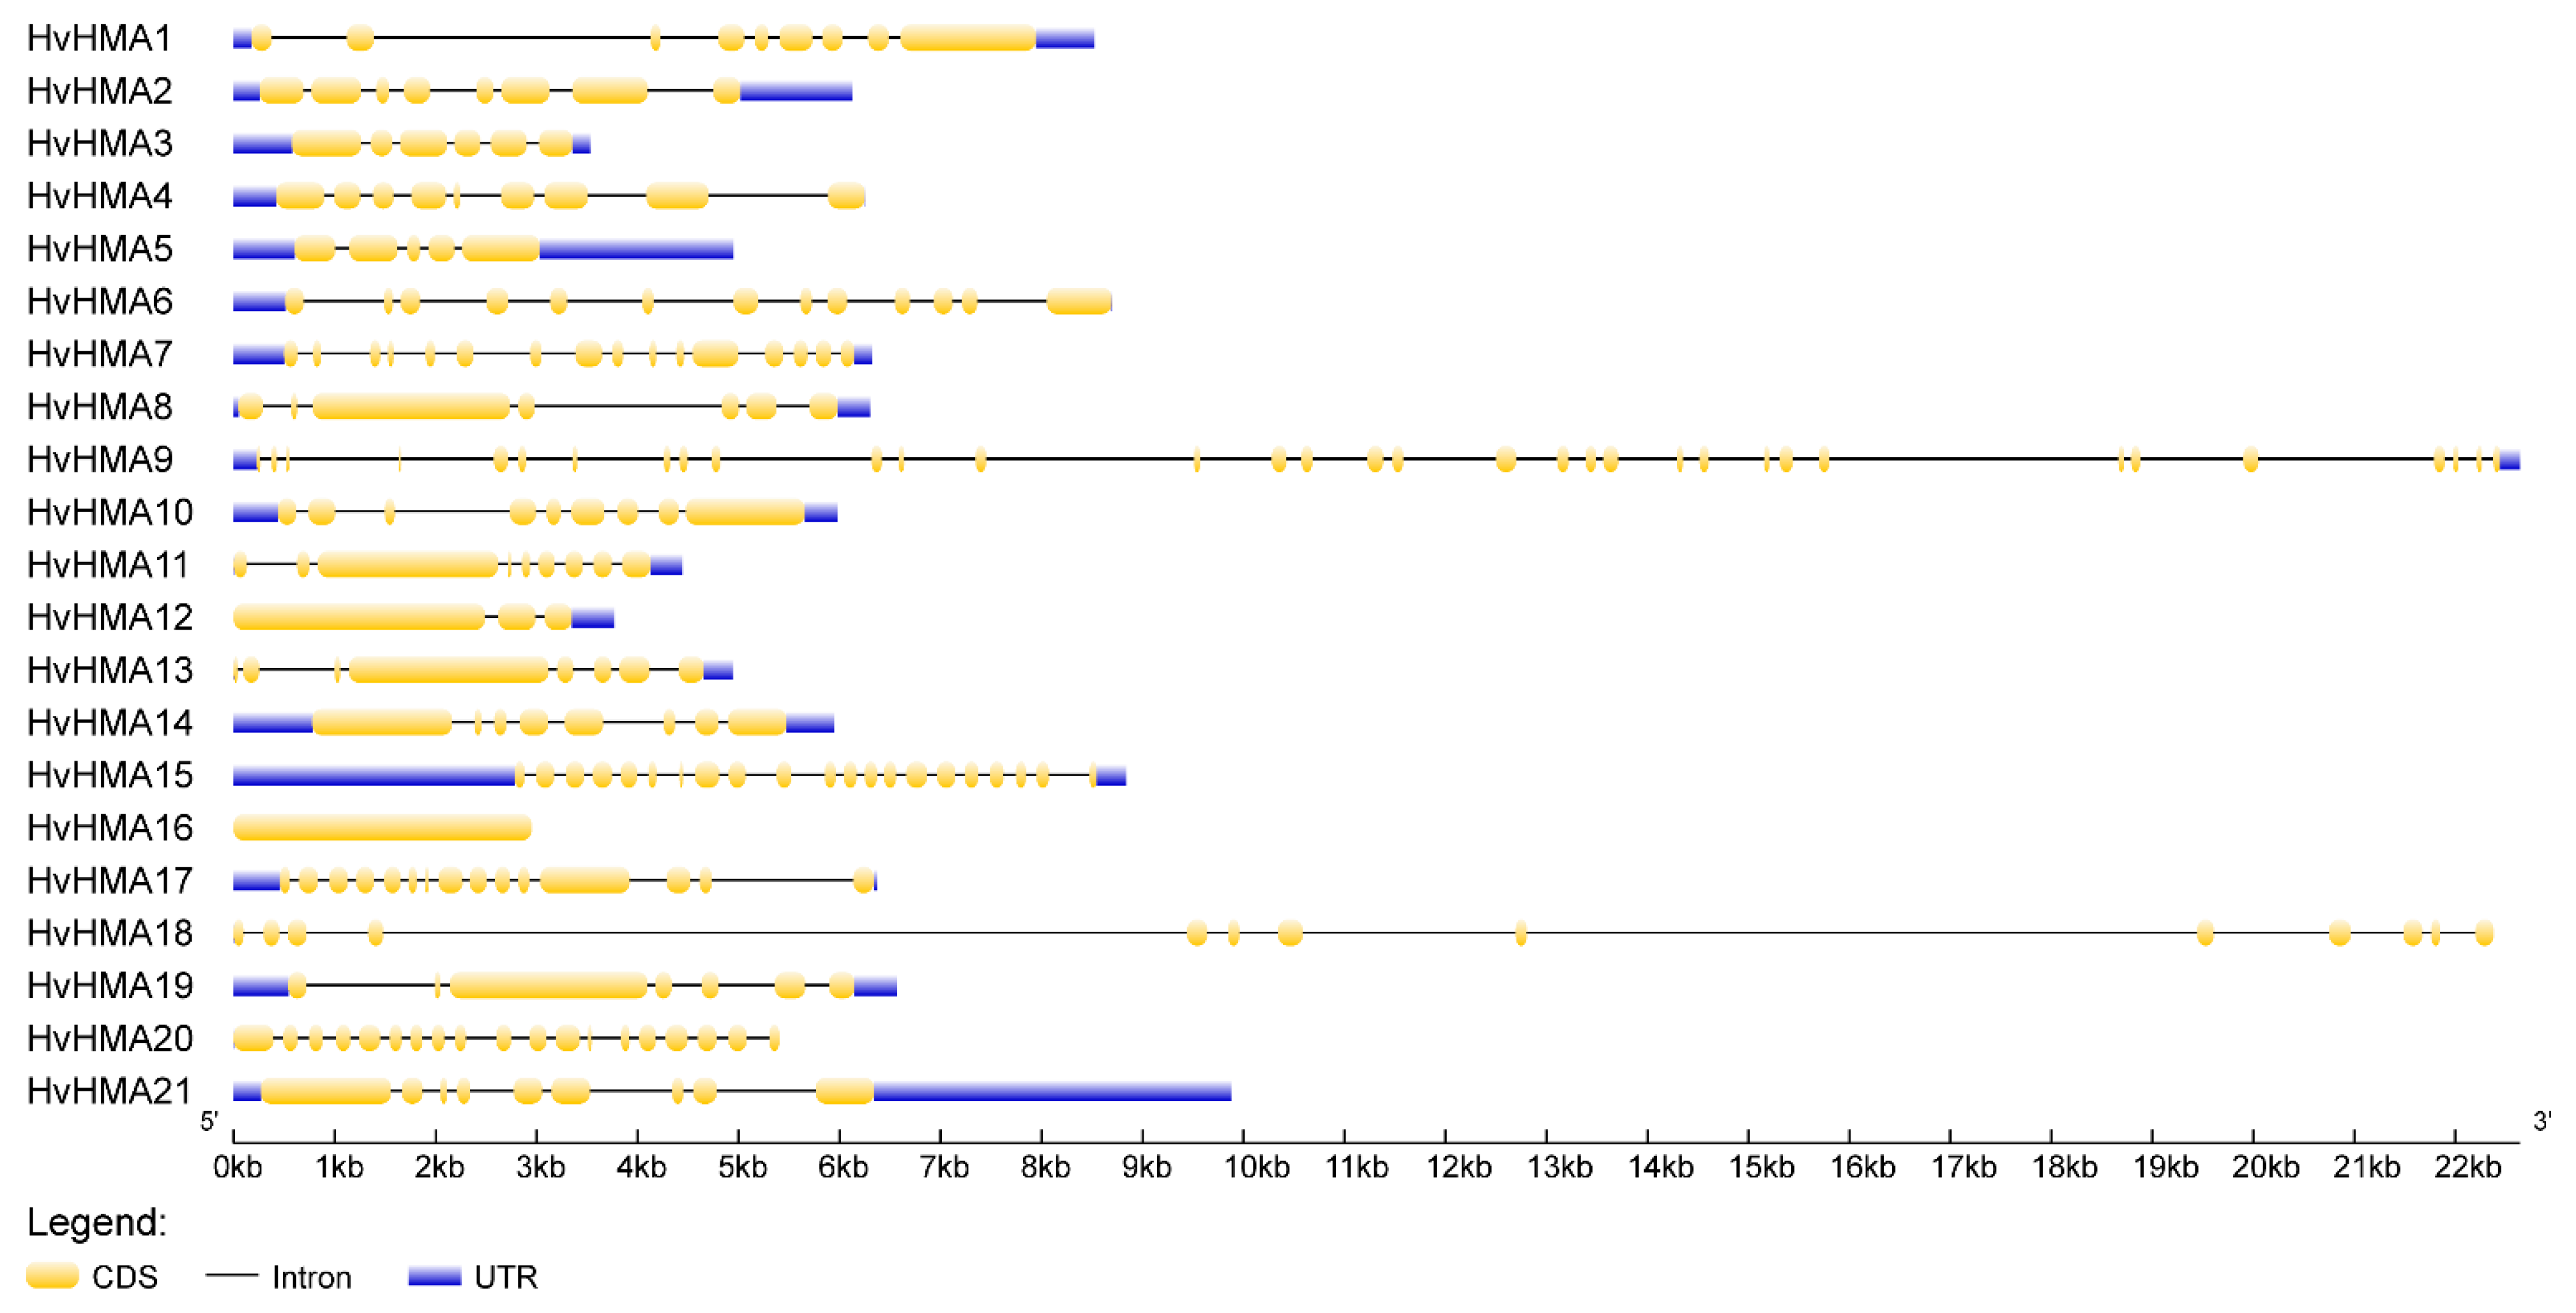
3.5. Intron-Exon Structure of Barley HMA Genes

The introns disrupted the coding sequences of most HvHMA genes. As shown in Figure 4, there were some differences among the HvHMA genes in terms of the number and size of the introns, which might be caused by intron deletion and insertion events. With the exception of HvHMA16 without introns, all HvHMA genes contained 2–33 introns (13 with 2–8 introns, 6 with 12–20 introns, and 1 with 33 introns). Additionally, several non-coding regions were distributed in the 18 HvHMA genes, with the exception of HvHMA16, HvHMA18, and HvHMA20.

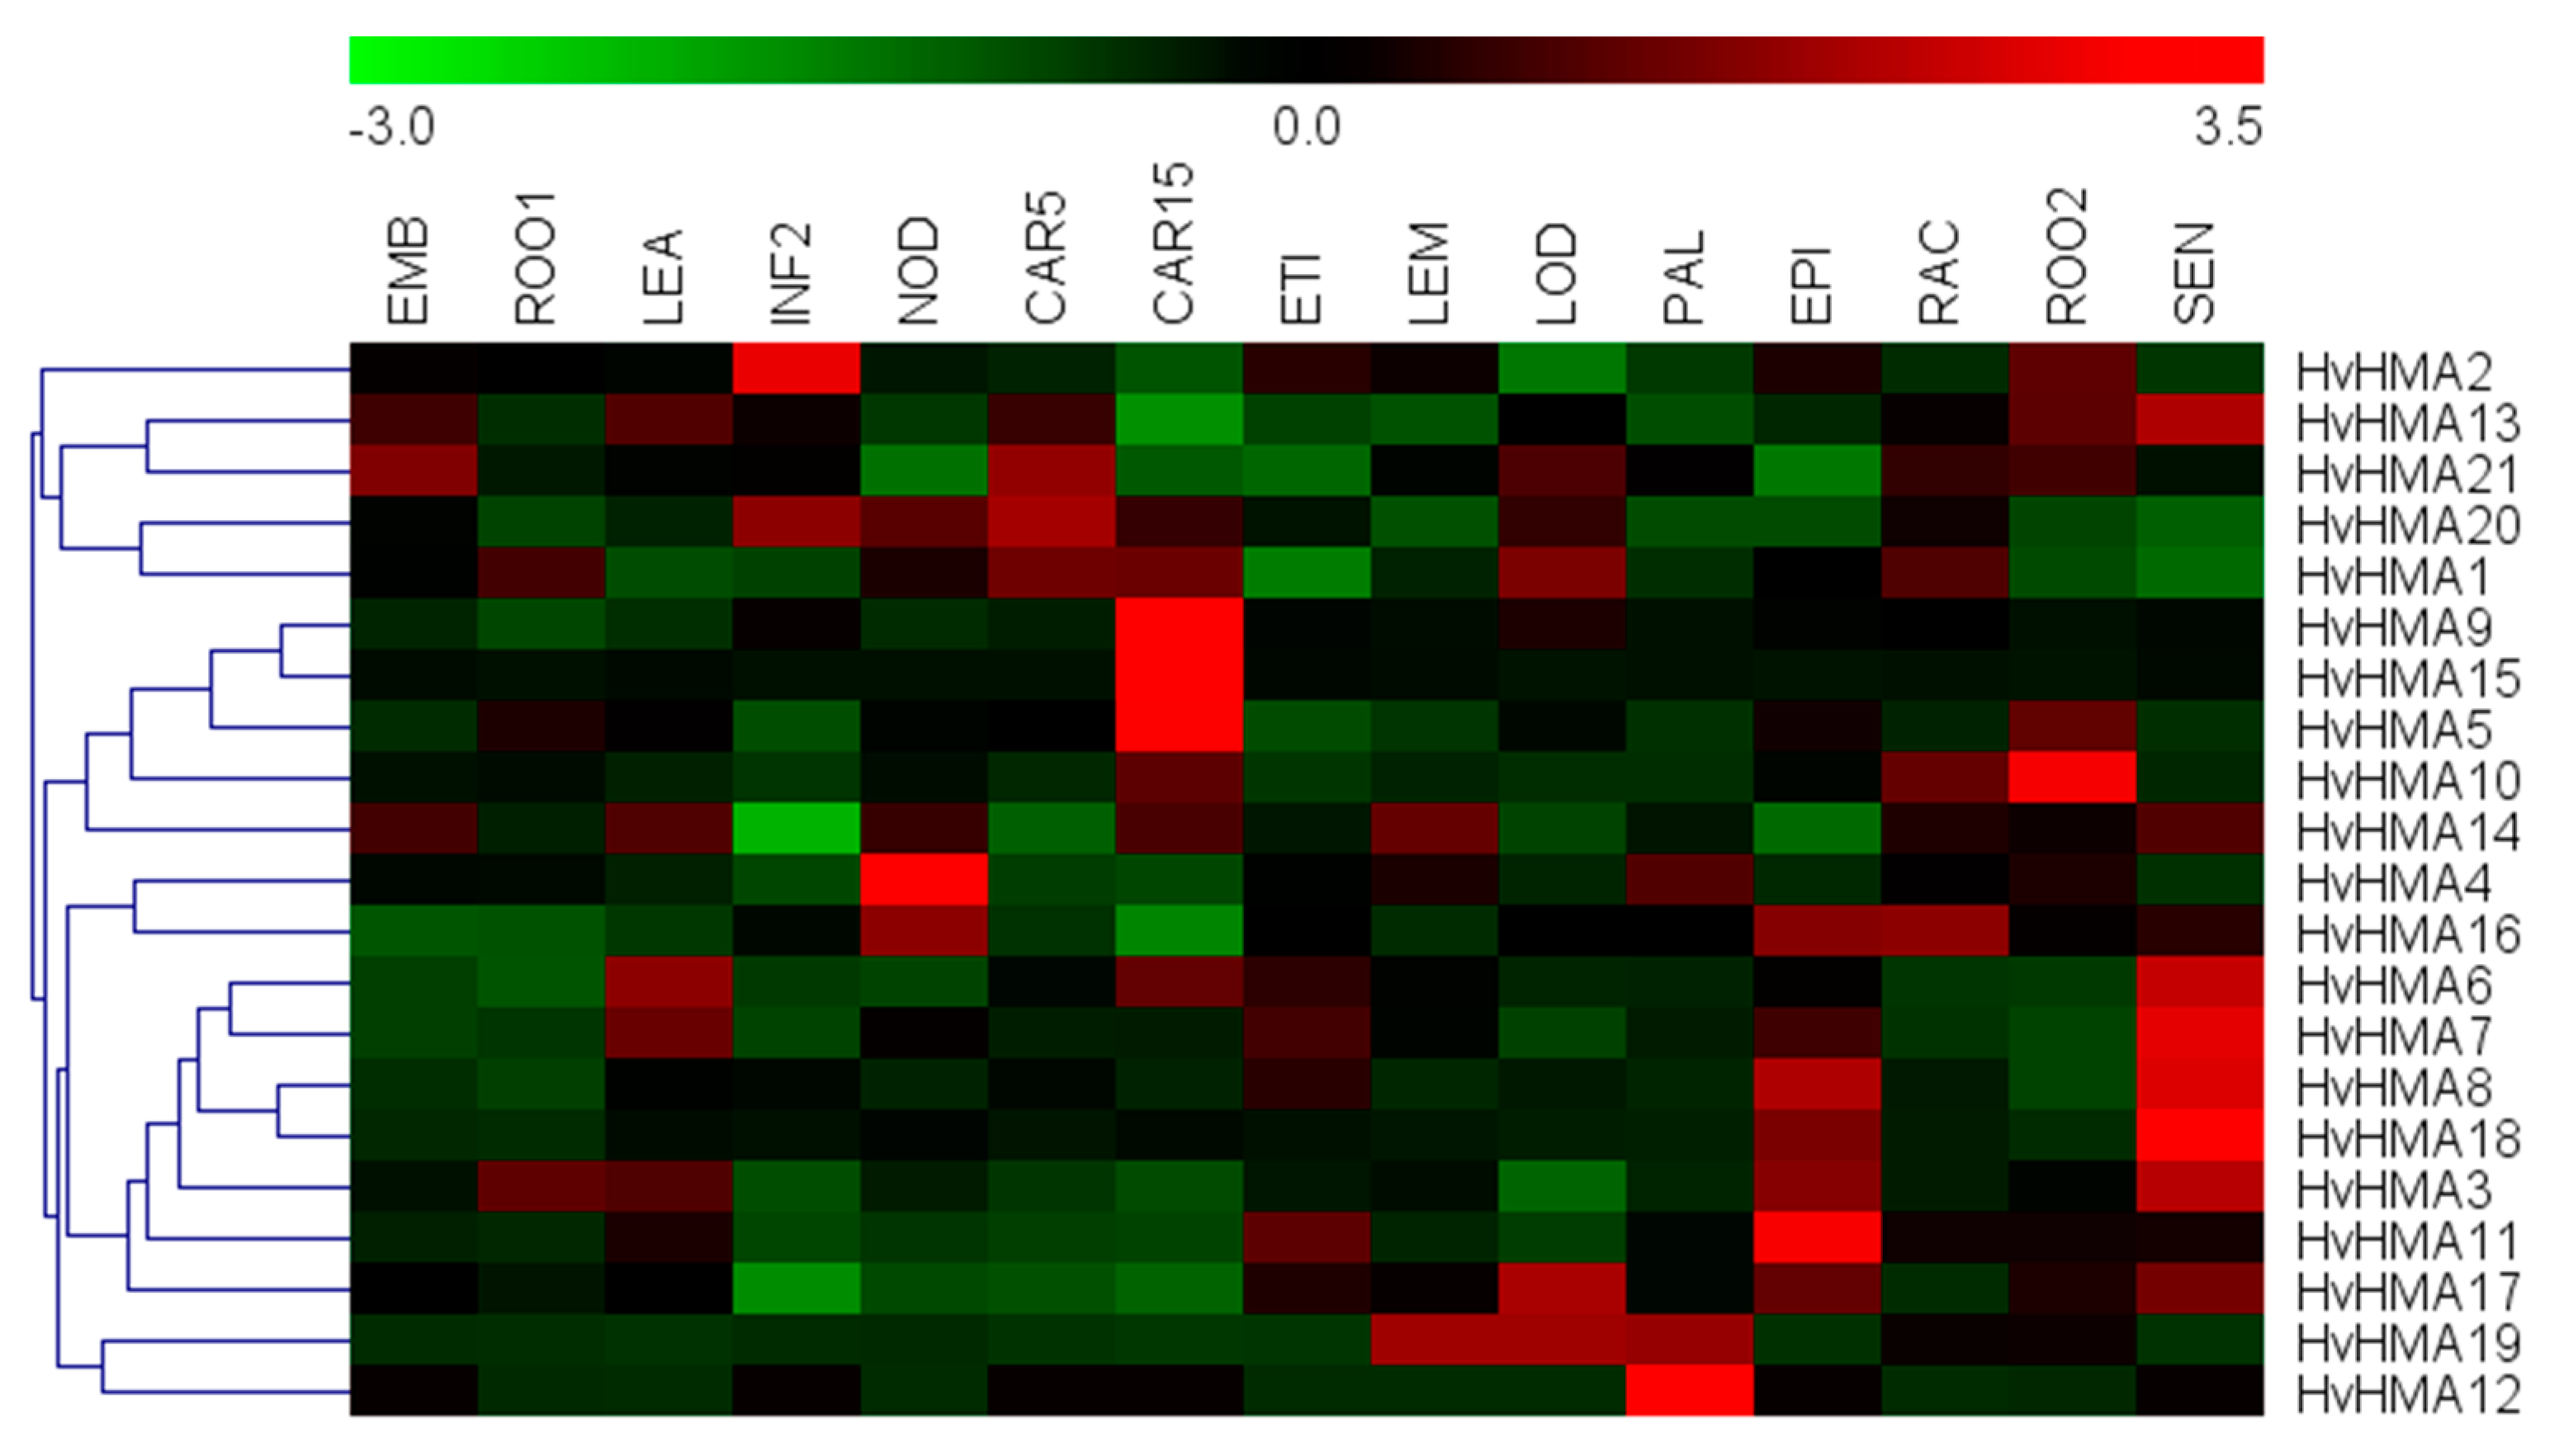
3.6. Expression Pattern Analysis of Barley HMA Genes and Target Gene Screening

The analysis of gene expression patterns contributed to gene function prediction. The expression profiles of the HvHMA genes (Figure 5) revealed that the expression of some genes was tissue-specific. For example, the expression levels of HvHMA5, HvHMA9, and HvHMA15 were high during grain development; the expression levels of HvHMA3, HvHMA6, HvHMA7, HvHMA8, HvHMA13, and HvHMA18 were high in the leaves; HvHMA2, HvHMA12, and HvHMA19 were specifically expressed in the inflorescences; and HvHMA4, HvHMA10, and HvHMA11 were specifically expressed in the tillers, roots, and epidermal strips, respectively. These results indicated that these genes might play specific roles in the relevant tissues. Moreover, the clustering results of the expression data unclearly correspond to the groupings based on phylogenetic analysis, implying that the expression pattern similarity incompletely depended on the sequence similarity. Based on a comprehensive consideration of the FPKM values at the 10 cm shoot stage and phylogenetic analysis, a total of five HvHMA genes were screened for expression analysis under Cd stress.

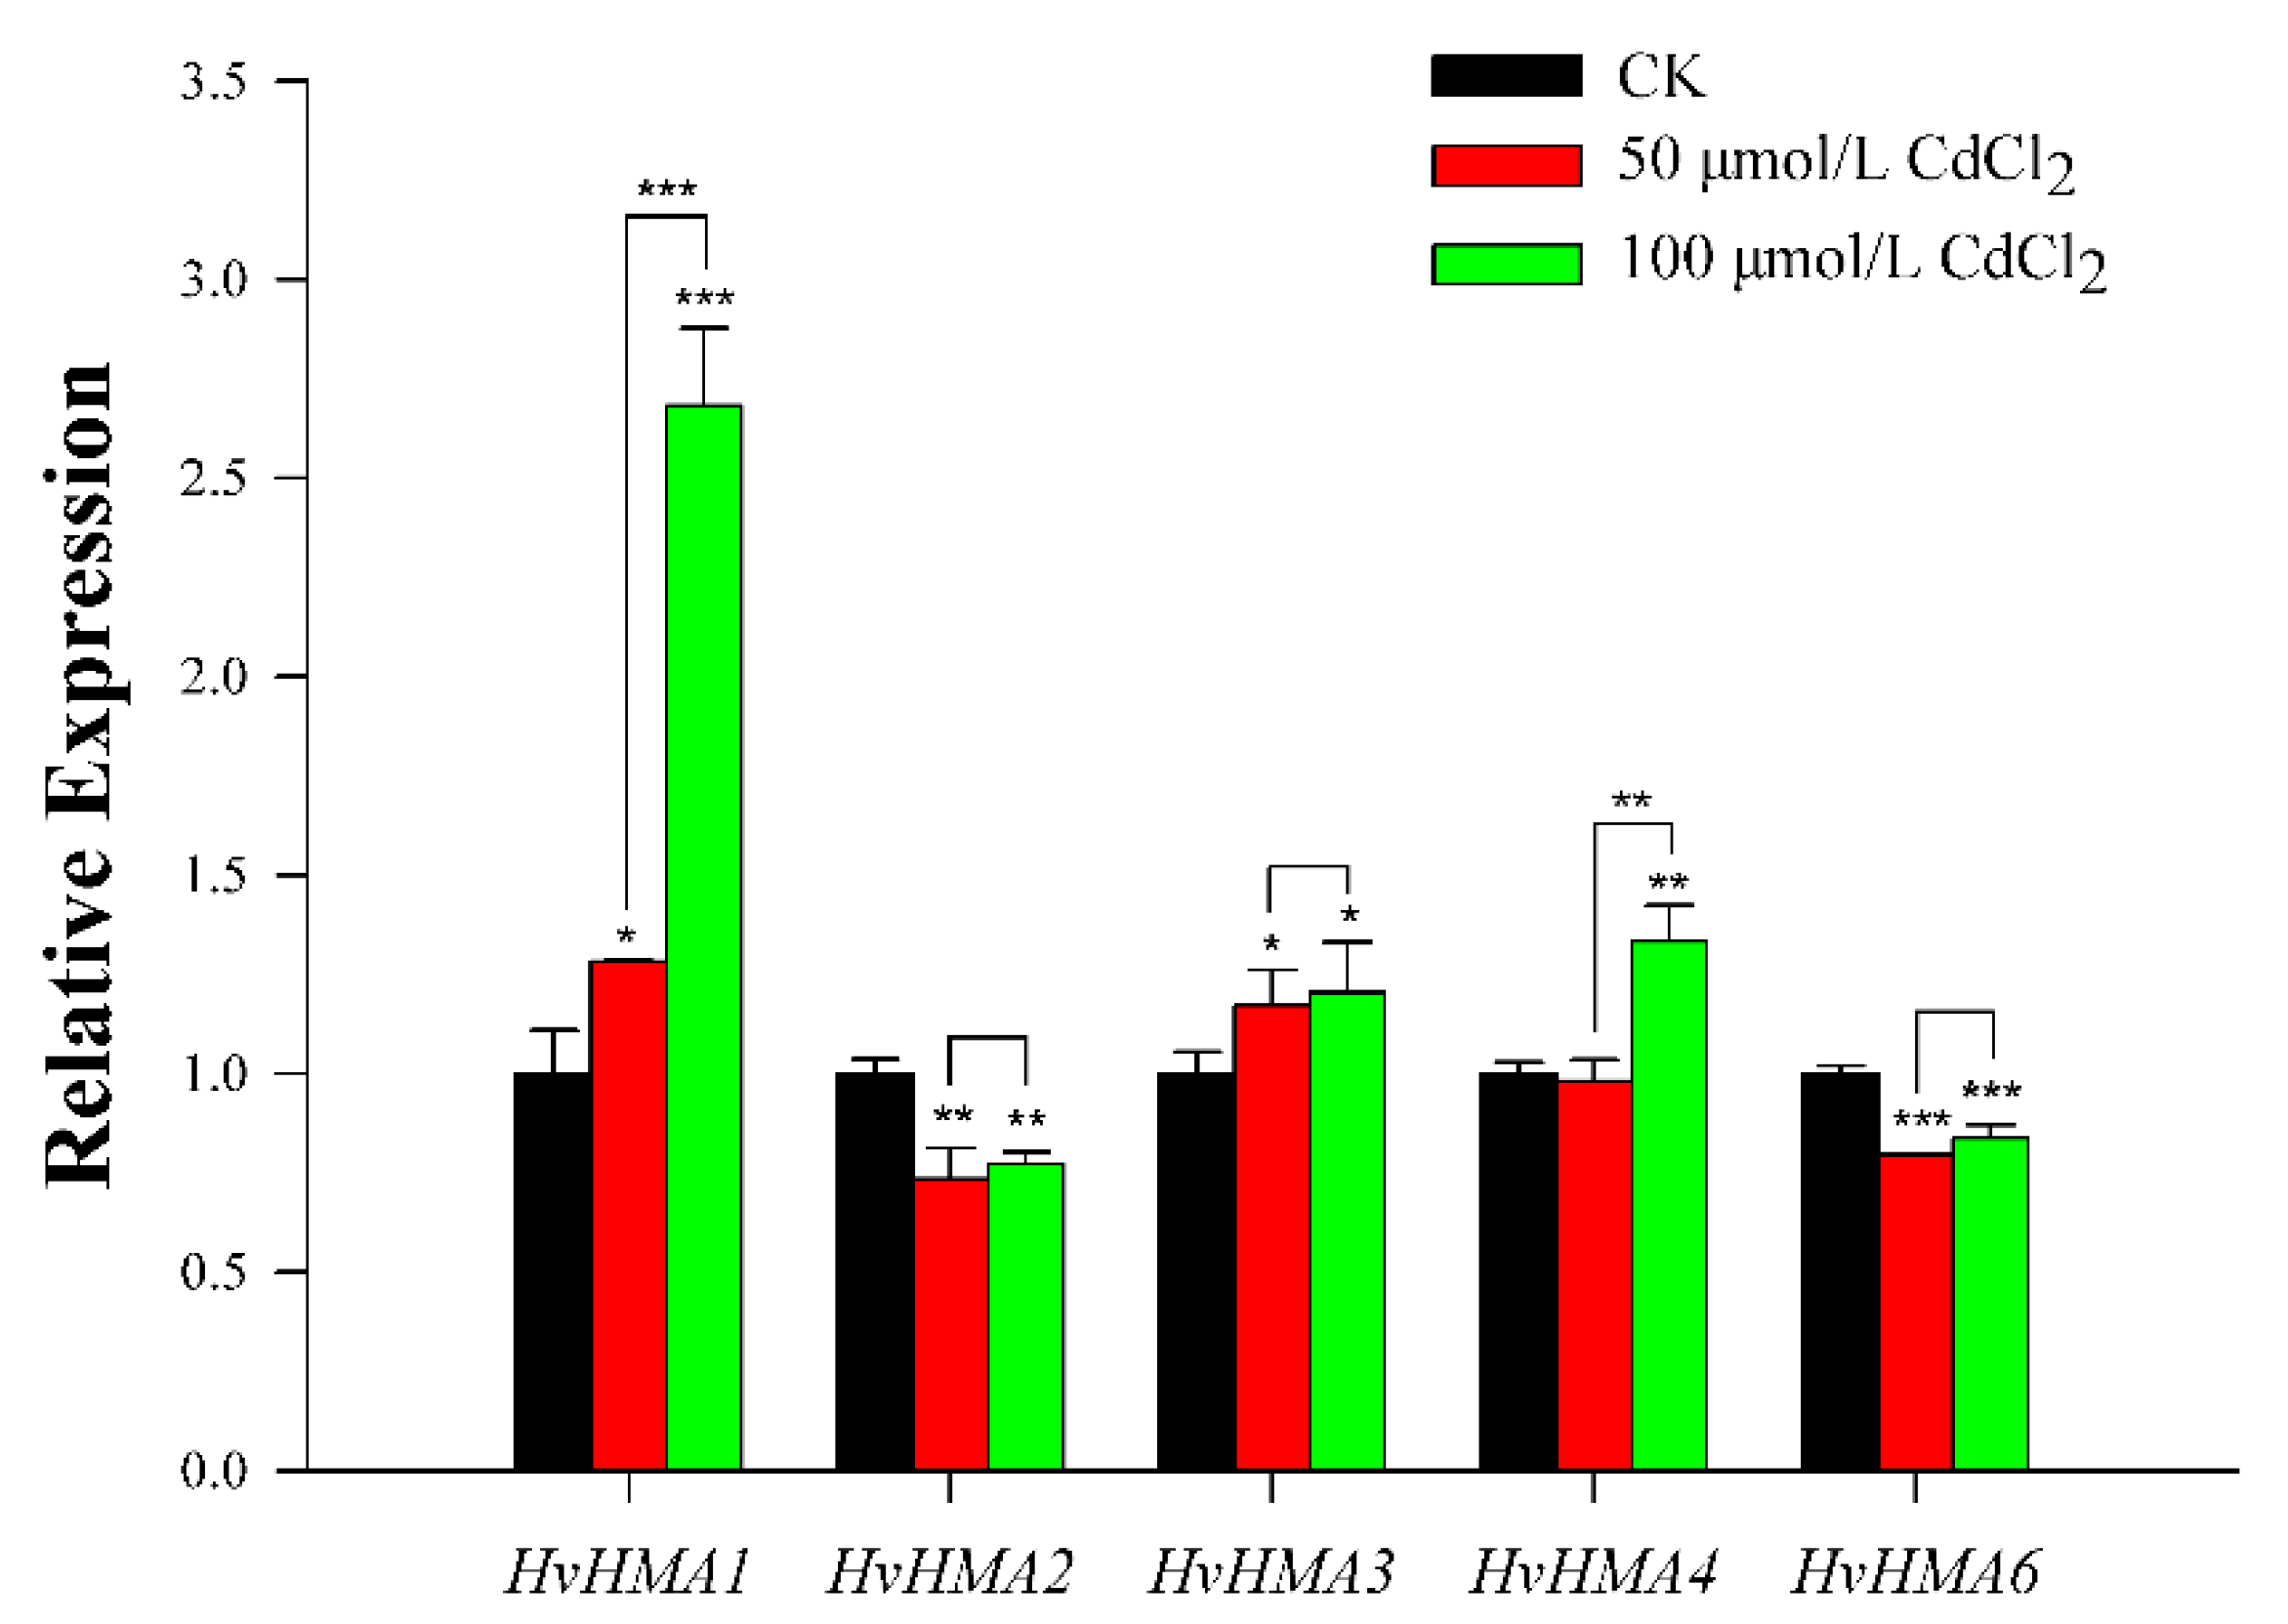
3.7. Expression Analysis of Barley HMA Genes in Response to Cd Treatment

HMA proteins participate in the distribution of non-essential heavy metal ions including Cd2+, which greatly affect the plant response to heavy metal stress. To analyze the expression of HvHMA genes under Cd stress, five members (Table 1) were carefully selected from 21 HvHMA genes, and qRT-PCR experiments were further performed at the seedling stage. The results (Figure 6) revealed that three genes (HvHMA1, HvHMA3, and HvHMA4) were upregulated and two genes (HvHMA2 and HvHMA6) were downregulated. Compared with the control, the expression levels of all five genes were significantly different under the 100 μmol/L CdCl2 treatment, whereas four genes, except for HvHMA4, were significantly different under the 50 μmol/L CdCl2 treatment. With the increase of Cd concentration, the expression of HvHMA1 and HvHMA4 was significantly higher under the high-concentration stress than under the low-concentration stress. Moreover, the expression changes of HvHMA2, HvHMA3, and HvHMA6 were similar after the two Cd treatments: the expression of HvHMA2, HvHMA3, and HvHMA6 was slightly higher under the high-concentration stress than under the low-concentration stress.

4. Discussion

The HMA family, which plays a significant role in heavy metal transport, exists widely in plants. In this study, 21 HMA genes were identified in barley. According to phylogenetic analysis, the 21 HvHMA genes could be divided into five groups (A–E). Compared to groups B and C, members belonging to groups A, D, and E possessed higher homology to the proteins of A. thaliana and rice. Except for the E1-E2 ATPase and Hydrolase domains, members of groups B and C contained the Cation_ATPase_N domains. In addition, members of group B contained the Cation_ATPase_C domains. The Cation_ATPase_N domains and the Cation_ATPase_C domains, which are metal-binding domains, participate in metal ion transport in plants. As indicated by the conserved motif analysis, motifs 4–6 and motifs 8–9 were only distributed in group C. Therefore, it is speculated that the domains as well as motifs unique to groups B and C resulted in the separation of groups B and C from the other groups in the phylogenetic tree. Furthermore, the characteristics of groups B and C illustrated the differences in evolution between barley and other species.
The subcellular localization results revealed that most of the HvHMA members were predicted as plasma membrane proteins, with the exception of HvHMA9, HvHMA14, and HvHMA19, which were all located in the endoplasmic reticulum and were placed in the same group (group B). These results suggested that there were certain corresponding relationships between the phylogenetic groupings based on sequence similarity and subcellular localization. Therefore, homologous genes may be similar in gene function and signal transduction process.
According to the presence or absence of introns, eukaryotic genes can be divided into intron-containing and intronless genes. Most eukaryotic genes belong to the former, but some belong to the latter. Previous studies identified that there are 5846 (21.7%) intronless genes in A. thaliana and 11,109 (19.9%) in rice [37]. Among the 21 HvHMA genes, 20 members with 2–33 introns are intron-containing genes, whereas HvHMA16 is an intronless gene. Some plausible explanations may account for the origin of intronless genes. It has been suggested that intronless genes evolved owing to a loss of introns [38]. Another probability is that intronless genes formed as a result of reverse transcription [39]. During the process of retroposition, mRNAs are reverse-transcribed into cDNAs and inserted into new genomic positions that lack introns [40]. Therefore, it can be inferred that intron loss or retrotransposition events impacted on the intron-exon structures of HvHMA genes, leading to the presence of an intronless gene (HvHMA16) in the barley HMA gene family. By comprehensively analyzing the results of the evolutionary tree and the expression values at the 10 cm shoot stage, five genes were screened that might be related to stress responses. Among them, the expressions of HvHMA1, HvHMA3, and HvHMA4 were significantly upregulated under Cd stress. HvHMA1 was highly homologous to OsHMA2, which participates in the root-to-shoot translocation of Cd [41,42,43]. Compared to the wild-type (WT), the Cd concentration in the grains of OsHMA2-overexpressing rice was decreased by approximately half [44]. HvHMA3 was homologous to OsHMA3, which sequesters Cd into the vacuoles of root cells in rice, thereby controlling the rate of Cd translocation from the roots to shoots [45]. Additionally, HvHMA4 was homologous to OsHMA9, whose expression was induced by a high concentration of Cd [46]. The above results indicated that the changes in expression after Cd treatment were in line with theoretical expectations and that the phylogenetic analysis results were credible.
Cd stress negatively effects plant growth and development. The qRT-PCR results suggested that Cd stress can promote or inhibit the expression of HvHMA genes, which indicated that different HvHMAs exhibit diverse mechanisms to protect barley from stress damage. The expression of HvHMA1 gradually increased with the growth of Cd concentration. Mills [47] found that the corresponding HvHMA gene conferred Cd sensitivity to wild-type yeast due to transport activity. It was speculated that HvHMA1 changed the transport activity of Cd in response to Cd stress in barley. Lei [48] found that HvHMA3 played a crucial role in grain Cd accumulation. In this study, HvHMA3 were significantly upregulated after Cd treatment. Therefore, it was speculated that HvHMA3 might be involved in Cd distribution in stress condition. Following Cd stress, the expression levels of HvHMA2 and HvHMA6 decreased significantly, indicating that Cd stress negatively regulated the expression of the two genes. According to this, it is inferred that the expression regulation pathways related to HvHMA2 and HvHMA6 may be similar. Among experimental groups, HvHMA1 and HvHMA4 were significantly upregulated with increasing Cd concentration, which indicated that the two genes were sensitive to the change of Cd stress. However, the molecular mechanisms of these HvHMA genes in response to Cd stress need further exploration.

5. Conclusions

The barley HMA gene family was explored herein using bioinformatics analysis. The results revealed the characteristics of the barley HMA gene family in terms of physicochemical properties, phylogenetic relationships, domain distribution, chromosomal location, motif composition, intron-exon structure, as well as tissue expression. Moreover, five HvHMA genes were selected for expression analysis which indicated that the five genes responded differently to Cd stress. HvHMA1, HvHMA3, and HvHMA4 were strongly activated by Cd stress, whereas HvHMA2 and HvHMA6 were significantly restrained. This study preliminarily confirms that HvHMA1, HvHMA3, and HvHMA4 play vital roles in Cd tolerance, providing a theoretical basis for further research on the functions of related genes and the improvement of barley varieties.

Author Contributions

D.X., X.Z. (Xiaoqin Zhang), and Y.F. manage this project; C.Z., Q.Y., T.Y., X.Z. (Xian Zhang) and Y.W. performed the experiments; C.Z., D.X. and Y.F. wrote the manuscript. All authors have read and agreed to the published version of the manuscript.

Funding

This research was supported by the New Talent College Student Plan in Zhejiang Province (2020R427033; 2020R427034), the National Undergraduate Training Programs for Innovation and Entrepreneurship (202010346043).

Institutional Review Board Statement

Not applicable.

Informed Consent Statement

Not applicable.

Data Availability Statement

Not applicable.

Acknowledgments

We thank LetPub (www.letpub.com; accessed on 11 August 2021) for its linguistic assistance during the preparation of this manuscript.

Conflicts of Interest

The authors declare no conflict of interest.

References

  1. DalCorso, G.; Farinati, S.; Furini, A. Regulatory networks of cadmium stress in plants. Plant. Signal. Behav. 2010, 5, 663–667. [Google Scholar] [CrossRef]
  2. Sanità, D.T.L.; Gabbrielli, R. Response to cadmium in higher plants. Environ. Exp. Bot 1999, 41, 105–130. [Google Scholar] [CrossRef]
  3. Pedas, P.; Ytting, C.K.; Fuglsang, A.T.; Jahn, T.P.; Schjoerring, J.K.; Husted, S. Manganese efficiency in barley: Identification and characterization of the metal ion transporter HvIRT1. Plant. Physiol. 2008, 148, 455–466. [Google Scholar] [CrossRef] [PubMed] [Green Version]
  4. Sasaki, A.; Yamaji, N.; Yokosho, K.; Ma, J.F. Nramp5 is a major transporter responsible for manganese and cadmium uptake in rice. Plant. Cell 2012, 24, 2155–2167. [Google Scholar] [CrossRef] [Green Version]
  5. Hall, J.L. Cellular mechanisms for heavy metal detoxification and tolerance. J. Exp. Bot. 2002, 53, 1–11. [Google Scholar] [CrossRef]
  6. Argüello, J.M.; Eren, E.; González-Guerrero, M. The structure and function of heavy metal transport P1B-ATPases. BioMetals 2007, 20, 233–248. [Google Scholar] [CrossRef] [PubMed]
  7. Feng, S.S.; Tan, J.J.; Zhang, Y.X.; Liang, S.; Xiang, S.Q.; Wang, H.; Chai, T.Y. Isolation and characterization of a novel cadmium-regulated Yellow Stripe-Like transporter (SnYSL3) in Solanum nigrum. Plant. Cell Rep. 2017, 36, 281–296. [Google Scholar] [CrossRef] [PubMed]
  8. Mani, A.; Sankaranarayanan, K. In Silico Analysis of Natural Resistance-Associated Macrophage Protein (NRAMP) Family of Transporters in Rice. Protein J. 2018, 37, 237–247. [Google Scholar] [CrossRef] [PubMed]
  9. Mills, R.F.; Francini, A.; Ferreira da Rocha, P.S.; Baccarini, P.J.; Aylett, M.; Krijger, G.C.; Williams, L.E. The plant P1B-type ATPase AtHMA4 transports Zn and Cd and plays a role in detoxification of transition metals supplied at elevated levels. FEBS Lett. 2005, 579, 783–791. [Google Scholar] [CrossRef] [Green Version]
  10. Smith, A.T.; Smith, K.P.; Rosenzweig, A.C. Diversity of the metal-transporting P1B-type ATPases. J. Biol. Inorg. Chem 2014, 19, 947–960. [Google Scholar] [CrossRef] [Green Version]
  11. Li, D.D.; Xu, X.M.; Hu, X.Q.; Liu, Q.G.; Wang, Z.C.; Zhang, H.Z.; Wang, H.; Wei, M.; Wang, H.Z.; Liu, H.M.; et al. Genome-Wide Analysis and Heavy Metal-Induced Expression Profiling of the HMA Gene Family in Populus trichocarpa. Front. Plant. Sci. 2015, 6, 1149. [Google Scholar] [CrossRef]
  12. Williams, L.E.; Mills, R.F. P(1B)-ATPases--an ancient family of transition metal pumps with diverse functions in plants. Trends Plant. Sci. 2005, 10, 491–502. [Google Scholar] [CrossRef]
  13. Zhiguo, E.; Li, T.T.; Chen, C.; Wang, L. Genome-wide survey and expression analysis of P1B-ATPases in rice, Maize and Sorghum. Rice Sci. 2018, 25, 208–217. [Google Scholar] [CrossRef]
  14. Fang, X.L.; Wang, L.; Deng, X.J.; Wang, P.; Ma, Q.B.; Nian, H.; Wang, Y.X.; Yang, C.Y. Genome-wide characterization of soybean P1B-ATPases gene family provides functional implications in cadmium responses. BMC Genom. 2016, 17, 376. [Google Scholar] [CrossRef] [Green Version]
  15. Wong, C.K.E.; Cobbett, C.S. HMA P-type ATPases are the major mechanism for root-to-shoot Cd translocation in Arabidopsis thaliana. New Phytol. 2009, 181, 71–78. [Google Scholar] [CrossRef] [PubMed]
  16. Ueno, D.; Milner, M.J.; Yamaji, N.; Yokosho, K.; Koyama, E.; Clemencia Zambrano, M.; Kaskie, M.; Ebbs, S.; Kochian, L.V.; Ma, J.F. Elevated expression of TcHMA3 plays a key role in the extreme Cd tolerance in a Cd-hyperaccumulating ecotype of Thlaspi caerulescens. Plant. J. 2011, 66, 852–862. [Google Scholar] [CrossRef]
  17. Miyadate, H.; Adachi, S.; Hiraizumi, A.; Tezuka, K.; Nakazawa, N.; Kawamoto, T.; Katou, K.; Kodama, I.; Sakurai, K.; Takahashi, H.; et al. OsHMA3, a P1B-type of ATPase affects root-to-shoot cadmium translocation in rice by mediating efflux into vacuoles. New Phytol. 2011, 189, 190–199. [Google Scholar] [CrossRef] [PubMed]
  18. Sun, L.S.; Guo, M.; Si, E.J.; Yao, L.R.; Wang, J.C.; Li, B.C.; Yang, K.; Meng, Y.X.; Ma, X.L.; Wang, H.J. Response of barley to toxin stress of barley stripe bacteria. J. Wheat Crop. 2021, 3, 1–7. [Google Scholar]
  19. Tong, T.; Fang, Y.X.; Zhang, Z.L.; Zheng, J.J.; Lu, X.L.; Zhang, X.Q.; Xue, D.W. Genome-wide identification, phylogenetic and expression analysis of SBP-box gene family in barley (Hordeum vulgare L.). Plant. Growth Regul. Int. J. Plant. Growth Dev. 2020, 90, 1–13. [Google Scholar] [CrossRef]
  20. Zheng, J.J.; Zhang, Z.L.; Tong, T.; Fang, Y.X.; Zhang, X.; Niu, C.Y.; Li, J.; Wu, Y.H.; Xue, D.W.; Zhang, X.Q. Genome-Wide Identification of WRKY Gene Family and Expression Analysis under Abiotic Stress in Barley. Agronomy 2021, 11, 521. [Google Scholar] [CrossRef]
  21. Zhang, Z.L.; Tong, T.; Fang, Y.X.; Zheng, J.J.; Zhang, X.; Niu, C.Y.; Li, J.; Zhang, X.Q.; Xue, D.W. Genome-Wide Identification of Barley ABC Genes and Their Expression in Response to Abiotic Stress Treatment. Plants 2020, 9, 1281. [Google Scholar] [CrossRef]
  22. Zhang, L.T.; Wang, S.Y.; Chen, Y.Y.; Dong, M.Y.; Fang, Y.X.; Zhang, X.; Tong, T.; Zhang, Z.L.; Zheng, J.J.; Xue, D.W.; et al. Genome-wide identification of the F-box gene family and expression analysis under drought and salt stress in barley. Phyton-Int. J. Exp. Bot. 2020, 89, 229–251. [Google Scholar]
  23. Zhang, X.; Zhang, L.T.; Chen, Y.Y.; Wang, S.Y.; Fang, Y.X.; Zhang, X.Q.; Wu, Y.H.; Xue, D.W. Genome-wide identification of the SOD gene family and expression analysis under drought and salt stress in barley. Plant. Growth Regul. 2021, 94, 49–60. [Google Scholar] [CrossRef]
  24. Mikkelsen, M.D.; Pedas, P.; Schiller, M.; Vincze, E.; Mills, R.F.; Borg, S.; Møller, A.; Schjoerring, J.K.; Williams, L.E.; Baekgaard, L.; et al. Barley HvHMA1 is a heavy metal pump involved in mobilizing organellar Zn and Cu and plays a role in metal loading into grains. PLoS ONE 2012, 7, e49027. [Google Scholar] [CrossRef]
  25. Kintlová, M.; Vrána, J.; Hobza, R.; Blavet, N.; Hudzieczek, V. Transcriptome Response to Cadmium Exposure in Barley (Hordeum vulgare L.). Front. Plant. Sci. 2021, 12, 629089. [Google Scholar] [CrossRef]
  26. Zhang, X.Q.; Tong, T.; Tian, B.; Fang, Y.X.; Pan, J.J.; Zheng, J.J.; Xue, D.W. Physiological, Biochemical and Molecular Responses of Barley Seedlings to Aluminum Stress. Phyton-Int. J. Exp. Bot. 2019, 88, 253–260. [Google Scholar] [CrossRef]
  27. Wheeler, T.J.; Eddy, S.R. nhmmer: DNA homology search with profile HMMs. Bioinformatics 2013, 29, 2487–2489. [Google Scholar] [CrossRef] [PubMed] [Green Version]
  28. Huang, Y.; Niu, B.; Gao, Y.; Fu, L.; Li, W. CD-HIT Suite: A web server for clustering and comparing biological sequences. Bioinformatics 2010, 26, 680–682. [Google Scholar] [CrossRef] [PubMed]
  29. Letunic, I.; Doerks, T.; Bork, P. SMART 7: Recent updates to the protein domain annotation resource. Nucleic Acids Res. 2012, 40, D302–D305. [Google Scholar] [CrossRef]
  30. Horton, P.; Park, K.J.; Obayashi, T.; Fujita, N.; Harada, H.; Adams-Collier, C.J.; Nakai, K. WoLF PSORT: Protein localization predictor. Nucleic Acids Res. 2007, 35, W585–W587. [Google Scholar] [CrossRef] [PubMed] [Green Version]
  31. Bailey, T.L.; Boden, M.; Buske, F.A.; Frith, M.; Grant, C.E.; Clementi, L.; Ren, J.; Li, W.W.; Noble, W.S. MEME SUITE: Tools for motif discovery and searching. Nucleic Acids Res. 2009, 37, W202–W208. [Google Scholar] [CrossRef]
  32. Hu, B.; Jin, J.; Guo, A.Y.; Zhang, H.; Luo, J.; Gao, G. GSDS 2.0: An upgraded gene feature visualization server. Bioinformatics 2015, 31, 1296–1297. [Google Scholar] [CrossRef] [Green Version]
  33. Kumar, S.; Stecher, G.; Tamura, K. MEGA7: Molecular Evolutionary Genetics Analysis Version 7.0 for Bigger Datasets. Mol. Biol. Evol 2016, 33, 1870–1874. [Google Scholar] [CrossRef] [PubMed] [Green Version]
  34. Letunic, I.; Bork, P. Interactive Tree Of Life (iTOL) v4: Recent updates and new developments. Nucleic Acids Res. 2019, 47, 256–259. [Google Scholar] [CrossRef] [Green Version]
  35. Imran, M.; Shafiq, S.; Farooq, M.A.; Naeem, M.K.; Widemann, E.; Bakhsh, A.; Jensen, K.B.; Wang, R.R. Comparative Genome-wide Analysis and Expression Profiling of Histone Acetyltransferase (HAT) Gene Family in Response to Hormonal Applications, Metal and Abiotic Stresses in Cotton. Int. J. Mol. Sci. 2019, 20, 5311. [Google Scholar] [CrossRef] [PubMed] [Green Version]
  36. Livak, K.J.; Schmittgen, T.D. Analysis of relative gene expression data using real-time quantitative PCR and the 2−ΔΔCt Method. Methods (San Diego. Calif.) 2001, 25, 402–408. [Google Scholar] [CrossRef]
  37. Jain, M.; Khurana, P.; Tyagi, A.K.; Khurana, J.P. Genome-wide analysis of intronless genes in rice and Arabidopsis. Funct. Integr. Genom. 2008, 8, 69–78. [Google Scholar] [CrossRef]
  38. Catania, F.; Lynch, M. Where do introns come from? PLoS Biol. 2008, 6, e283. [Google Scholar] [CrossRef] [Green Version]
  39. Zhu, Z.; Zhang, Y.; Long, M. Extensive structural renovation of retrogenes in the evolution of the Populus genome. Plant. Physiol. 2009, 151, 1943–1951. [Google Scholar] [CrossRef] [PubMed] [Green Version]
  40. Long, M.; Betrán, E.; Thornton, K.; Wang, W. The origin of new genes: Glimpses from the young and old. Nat. Rev. Genet. 2003, 4, 865–875. [Google Scholar] [CrossRef]
  41. Takahashi, R.; Bashir, K.; Ishimaru, Y.; Nishizawa, N.K.; Nakanishi, H. The role of heavy-metal ATPases, HMAs, in zinc and cadmium transport in rice. Plant. Signal. Behav. 2012, 7, 1605–1607. [Google Scholar] [CrossRef]
  42. Nocito, F.F.; Lancilli, C.; Dendena, B.; Lucchini, G.; Sacchi, G.A. Cadmium retention in rice roots is influenced by cadmium availability, chelation and translocation. Plant. Cell Environ. 2011, 34, 994–1008. [Google Scholar] [CrossRef]
  43. Satoh-Nagasawa, N.; Mori, M.; Nakazawa, N.; Kawamoto, T.; Nagato, Y.; Sakurai, K.; Takahashi, H.; Watanabe, A.; Akagi, H. Mutations in rice (Oryza sativa) heavy metal ATPase 2 (OsHMA2) restrict the translocation of zinc and cadmium. Plant. Cell Physiol. 2012, 53, 213–224. [Google Scholar] [CrossRef]
  44. Takahashi, R.; Ishimaru, Y.; Shimo, H.; Ogo, Y.; Senoura, T.; Nishizawa, N.K.; Nakanishi, H. The OsHMA2 transporter is involved in root-to-shoot translocation of Zn and Cd in rice. Plant. Cell Environ. 2012, 35, 1948–1957. [Google Scholar] [CrossRef] [PubMed]
  45. Ueno, D.; Yamaji, N.; Kono, I.; Huang, C.F.; Ando, T.; Yano, M.; Ma, J.F. Gene limiting cadmium accumulation in rice. Proc. Natl. Acad. Sci. USA 2010, 107, 16500–16505. [Google Scholar] [CrossRef] [PubMed] [Green Version]
  46. Lee, S.; Kim, Y.Y.; Lee, Y.; An, G. Rice P1B-type heavy-metal ATPase, OsHMA9, is a metal efflux protein. Plant. Physiol. 2007, 145, 831–842. [Google Scholar] [CrossRef] [PubMed] [Green Version]
  47. Mills, R.F.; Peaston, K.A.; Runions, J.; Williams, L.E. HvHMA2, a P(1B)-ATPase from barley, is highly conserved among cereals and functions in Zn and Cd transport. PLoS ONE 2012, 7, e42640. [Google Scholar] [CrossRef] [Green Version]
  48. Lei, G.J.; Fujii, K.M.; Wu, D.Z.; Hisano, H.S.D.; Deng, F.L.; Yamaji, N.; Sato, K.; Zhao, F.J.; Ma, J.F. Breeding for low cadmium barley by introgression of a Sukkula-like transposable element. Nat. Food 2020, 1, 489–499. [Google Scholar] [CrossRef]
Figure 1. The phylogenetic tree was constructed using the HMA protein sequences of Hordeum vulgare (Hv), Oryza sativa (Os), and Arabidopsis thaliana (At) in MEGA v7.0. All HMA members were classified into five groups (A–E). The HMA proteins of different species are differentiated by different colors. The black letters represent HvHMAs, the green letters represent OsHMAs, and the red letters represent AtHMAs. Different-colored rectangles represent different structural domains. The three green rectangles from light to dark represent Cation_ATPase, E1–E2 ATPase, and Hydrolase_3, respectively; the yellow rectangle represents Hydrolase; the pink rectangle represents HMA; the red rectangle represents Cation_ATPase_C; and the two purple rectangles from light to dark represent Cation_ATPase_N and CaATP_NAI, respectively.
Plants 10 01849 g001
Figure 2. Distribution of HvHMA genes on barley chromosomes. The location information of the HvHMA genes was obtained from the EnsemblPlants database.
Plants 10 01849 g002
Figure 3. Motif distribution of the HvHMA family in barley. Different conservative motifs are represented by boxes of 10 different colors (color figure online).
Plants 10 01849 g003
Figure 4. Intron-exon structures of HvHMA genes in barley. The exons and introns are indicated by yellow boxes and black lines, respectively (color figure online).
Plants 10 01849 g004
Figure 5. Expression profiles of HvHMA genes in different tissues and development stages. Data were obtained from a publicly available database. Columns represent HvHMA members, while rows show different developmental stages and tissues. The expression level of HvHMAs is shown by the intensity of the color, where red represents high expression and green represents low expression. EMB, 4-day embryos; ROO1, roots from seedlings (10 cm shoot stage); LEA, shoots from seedlings (10 cm shoot stage); INF2, developing inflorescences; NOD, developing tillers, 3rd internode (5 DAP); CAR5, developing grain (5 DAP); CAR15, developing grain (15 DAP); ETI, etiolated seeding, dark conditions (10 DAP); LEM, inflorescences, lemma (42 DAP); LOD, inflorescences, lodicule (42 DAP); PAL, dissected inflorescences (42 DAP); EPI, epidermal strips (28 DAP); RAC, inflorescences, rachis (35 DAP); ROO2, roots (28 DAP); and SEN, senescing leaves (56 DAP) (color figure online).
Plants 10 01849 g005
Figure 6. Relative expression analysis of five HvHMA genes under Cd stress in barley seedling leaves. Different treatments are represented by three different colors, and columns in black represent CK, columns in red represent 50 μmol/L CdCl2, and columns in green represent 100 μmol/L CdCl2. ANOVA was used to test significance. * indicates p < 0.05, ** indicates p < 0.01, and *** indicates p < 0.001. Error bars represent the standard deviation.
Plants 10 01849 g006
Table 1. Primer sequences designed for qRT-PCR analysis.
Gene NameGene IDForward Primer Sequence (5′-3′)Reverse Primer Sequence (5′-3′)
HvHMA1HORVU7Hr1G097240.1TGGCGAAGAAATGCTGTGCTAACCGCCTGTTGATACATTCTC
HvHMA2HORVU6Hr1G033380.2TGGAGGTGTCATTTCAGAAGTGGCAACACCATCAACTGGGACCTT
HvHMA3HORVU5Hr1G094430.8ACATCGCCGTGAGGACAAGTGCGTCTTGGACTTGCTCTGC
HvHMA4HORVU7Hr1G108890.1TCAGCCTAAGTCACAGAAGACATTGCCTGGACGATTTCATCCTTGC
HvHMA6HORVU7Hr1G100160.2GCTAAGGCATCTATCGGTTCCATGCAGAACACTTTACTGCCTCT
HvActinHORVU1Hr1G002840TGGATCGGAGGGTCCATCCTGCACTTCCTGTGGACGATCGCTG
Table 2. Physicochemical properties and subcellular localization of HMA proteins in barley.
Gene NameProtein NumberORF (aa)MW (Da)PISubcellular LocalizationHydrophilicity Index
HvHMA1A0A287XH511009108464.816.68Plasma membrane−0.090
HvHMA2A0A287TV87987106112.965.58Plasma membrane0.171
HvHMA3A0A287SBM876580511.645.80Plasma membrane0.422
HvHMA4A0A287XS001023102819.645.27Plasma membrane0.268
HvHMA5A0A287J24567273112.296.19Plasma membrane0.277
HvHMA6A0A287XKH587192584.787.59Plasma membrane0.106
HvHMA7M0X9Y276180246.055.36Plasma membrane0.223
HvHMA8A0A287NAD11050113188.475.00Plasma membrane0.193
HvHMA9A0A287N6A11000109664.925.72Endoplasmic reticulum0.171
HvHMA10M0WLW4946100370.697.04Plasma membrane−0.016
HvHMA11A0A287FY78981107543.646.42Plasma membrane0.083
HvHMA12A0A287E4C31039114071.386.95Plasma membrane−0.042
HvHMA13A0A287QI471033111820.686.07Plasma membrane0.183
HvHMA14A0A287EJS41049113618.245.49Endoplasmic reticulum0.140
HvHMA15M0WME5962105942.796.15Plasma membrane0.094
HvHMA16A0A287DYP4983107457.126.10Plasma membrane0.063
HvHMA17A0A287JG071010106141.117.82Plasma membrane0.074
HvHMA18A0A287RKR169073747.506.73Plasma membrane0.219
HvHMA19M0WL521020110187.746.21Endoplasmic reticulum0.220
HvHMA20A0A287Q5Y4994109774.707.45Plasma membrane0.142
HvHMA21A0A287P7851083118116.935.49Plasma membrane0.034
Publisher’s Note: MDPI stays neutral with regard to jurisdictional claims in published maps and institutional affiliations.

