Article

Coupling Relationship of Leaf Economic and Hydraulic Traits of Alhagisparsifolia Shap. in a Hyper-Arid Desert Ecosystem

1
State Key Laboratory of Desert and Oasis Ecology, Xinjiang Institute of Ecology and Geography, Chinese Academy of Sciences, Urumqi 830011, China
2
College of Resource and Environment Sciences, Xinjiang University, Urumqi 830046, China
3
University of Chinese Academy of Sciences, Beijing 100049, China
4
Xinjiang Key Laboratory of Desert Plant Roots Ecology and Vegetation Restoration, Xinjiang Institute of Ecology and Geography, Chinese Academy of Sciences, Urumqi 830011, China
5
Cele National Station of Observation and Research for Desert-Grassland Ecosystems, Cele 848300, China
6
Institute of Plant Physiology, National Council for Scientific and Technical Research, National University of La Plata, La Plata 1900, Argentina
7
Laboratory of Plant Physiology, Department of Botany, Federal University of Pernambuco, Recife 50670-901, Brazil
*
Authors to whom correspondence should be addressed.
Plants 2021, 10(9), 1867; https://doi.org/10.3390/plants10091867 (registering DOI)
Submission received: 11 August 2021 / Revised: 5 September 2021 / Accepted: 6 September 2021 / Published: 9 September 2021

Abstract

:
In this study, Alhagi sparsifolia Shap. was used to test the hypothesis that leaf economic and hydraulic traits are coupled in plants in a hyper-arid region. Five economic traits and six hydraulic traits were examined to explore the relationship. Results showed that the stomatal density (SD) on both surfaces was coupled with maximum stomatal conductance to water vapor (gwmax) and leaf tissue density (TD). SD on adaxial surface (SDaba) was significantly positively related to vein density (VD) but negatively related to leaf thickness (LT) and stomatal length on adaxial surface (SLada). Nitrogen concentration based on mass (Nmass) was significantly negatively correlated with leaf mass per area (LMA), LT, and VD, whereas nitrogen concentration based on area (Narea) was significantly positively related to LMA and TD. Mean annual precipitation (MAP) contributed the most to the changes in LT and stomatal length (SL). Soil salt contributed the most to TD, SD, and gwmax. Soli nutrients influenced the most of LMA and VD. Mean annual temperature contributed the most to Nmass and Narea. In conclusion, the economics of leaves coupled with their hydraulic traits provides an economical and efficient strategy to adapt to the harsh environment in hyper-arid regions.

1. Introduction

Leaf functional traits are highly profiled in ecology because of their closely related to plants’ growth and adaptation to environmental stress [1,2,3]. The “fast slow” economic spectrum widely exists in plant communities, that is, slow-growing species have a high tissue density, a low resource acquisition rate, and a high construction cost. In resource-poor environments, these slow species often form the dominant species in resource-poor environments [1,2]. Leaf functional traits, such as leaf mass per area (LMA), nitrogen concentration based on mass (Nmass) and area (Narea), leaf tissue density (TD), and leaf thickness (LT), are highly associated with photosynthesis capacity. These traits always vary along a continuous spectrum and can reflect the quick to slow ecological strategies relative to leaf investment and photosynthetic payback, which are collectively referred to ‘economic traits’ [1,2,3,4]. However, using only a single axis of economic traits is insufficient to explain plant survival strategies, especially in arid areas, where water deficit may affect plant survival. Other traits, such as vein density (VD), stomatal density (SD), stomatal length (SL), and maximum stomatal conductance to water vapor (gwmax), reflect water demand and supply balance and are accordingly defined as “leaf hydraulic traits” [3,5]. Both economic and hydraulic traits can indicate the trade-off between plant production and investment. Thus, exploring the correlation between leaf economic and hydraulic traits is crucial to reveal the mechanism of plant water carbon balance and expanding plant traits spectrum [2,4,6,7,8].
Despite years of research, scientists have not yet reached a consensus on whether a coupling relationship exists between economic and hydraulic traits [3,4,9,10,11]. Many studies suggest that economic and hydraulic traits should be coupled because the stomata are the common pathway for CO2 uptake and water loss [9,12,13]. In particular, carbon starvation caused by stomatal closure is an important cause of plant death under prolonged extreme drought conditions [14]. In arid environments, both VD and SD are high. High VD and SD are important adaptive strategies for maintaining an appropriate mesophyll space between terminal veins and stomata to balance carbon absorption and water transpiration [15,16,17]. For example, in 33 perennial shrubs native to the arid valley of southwest China, VD and SD were found to be coupled well with light-saturated photosynthetic rates, thereby enabling these plants to maintain a robust balance between water loss and carbon absorption [18]. In semi-arid regions, the economic traits—LMA, LT, TD, Nmass, Narea, and the hydraulic traits—VD, SD, SL, gwmax were found to be coupled across 47 woody species [4]. By comparing the same traits with plants in humid regions [3], Yin et al. inferred that this coupling relation is caused by low water availability [4], and they further suggested that the correlation between stomatal and leaf vein traits seems to be the key link between economic and hydraulic traits under drought conditions. By contrast, the economic and hydraulic traits in humid environments seem to undergo decoupling. In tropical–subtropical forests with adequate water resources, the economic and hydraulic traits of plants are decoupled to acquire multiple trait combinations to be able to utilize more resources [3,4,19]. Using large data sets, Sack et al. also found that LMA is not associated with VD [10]. Although VD is independent of LMA, it strongly affects hydraulic conductivity, thereby affecting stomatal conductance and photosynthetic rate [17]. When a sufficient water supply is available, most plants are anisohydric, that is, their stomata keep remain open even when water potential is reduced [20,21,22]. In comparison to cases of interannual or seasonal variations, the hydraulic behavior of the same species may change from anisohydry to isohydryby closing their stomata at noon to maintain the minimum water potential [23,24]. Therefore, we speculated that stomatal regulation under dry conditions might affect carbon water coupling.
In hyper-arid ecosystems, high temperature, low precipitation, nutrient limitation, and salinity stress lead to low species diversity [25]. Plants adapt to such a harsh environment through physiological and morphological adaptations, including changes in leaf anatomy, economic traits, and hydraulic traits [26,27,28]. Alhagi sparsifolia Shap. (Fabales: Fabaceae), which widely distributed in hyper-arid regions across the middle and eastern Asia, is one such species. Owing to the heterogeneity of climatic variations, soil water supply, and nutrients availability in the distributional area of A. sparsifolia, this plant is evidently different among sites [29], with corresponding leaf morphological differences [30]. The leaves of A. sparsifolia are amphistomatous, with stomata on both the upper and lower surfaces [31]. Previous studies have shown that compared with hypostomatous leaves with stomata only on the lower surface, amphistomatous leaves can considerably reduce the transport distance of CO2 and H2O in mesophyll tissues and enhance the gas exchange capacity between the mesophyll and atmosphere [32]. Moreover, A. sparsifolia has isobilateral leaves, palisade parenchyma neatly are ranged in the upper and lower epidermis, and the sponge parenchyma only distributes in the center of the mesophyll [31]. Increasing the ratio of palisade parenchyma to sponge parenchyma (PT/ST) is a vital life strategy for plants to cope with dry environments [33,34], and the trade-off between PT and ST may lead to the correlation between leaf economic and hydraulic traits in the plants in semi-arid regions [4]. However, the issue of whether changes in the anatomical structure of isobilateral leaves are related to the economic and hydraulic traits is still unclear.
The roots length of A. sparsifolia can reach at the depth of 12 m or even 30 m [30]. The developed roots can connect with groundwater, and then hydraulic lift occurs [35]: the deep roots absorb water at night and move it to the upper soil profile, where it is stored until it is absorbed the next day [36,37,38]. The aboveground part of A. sparsifolia does not suffer from water deficit during the growing season [7,30], indicating that this species can balance the relationship between material investment in water transportation and water loss in transpiration [39]. However, short-term flood or irrigation in summer can increase the leaf area of A. sparsifolia by 2.76 times [39]. Therefore, we speculated that in different regions, the upper soil water content may also affect the functional traits of A. sparsifolia. As in many hyper-arid regions worldwide, the desert ecosystems in northwest China are being affected by extensive salinization [40]. Salinity reduces the soil water potential as a form of drought, rendering the absorption of water from the soil by plants more difficult [41,42,43,44]. Furthermore, salinity affects soil pH value and then influences the absorption of nutrients by plants [45], thus negatively affecting water supply and photosynthesis. A. sparsifolia is a xero-halophyte with a high tolerance to drought and salt stress [46,47,48]. Thus, its functional traits should be adapted functional traits to drought and salinity. As a member of family Fabaceae, A. sparsifolia can establish a symbiotic relationship with nitrogen-fixing bacteria in the soil, capturing N2 from the atmosphere and making it available to plant root in exchange for carbohydrate exudates [49,50]. This mechanism is an important survival strategy for A. sparsifolia to overcome environments with a low nitrogen supply [49,50]. However, under water and salinity stress conditions, the amount of carbon may be insufficient to invest in root exudates and biological nitrogen fixation (BNF) [50]. Groundwater and soil nitrogen are important nitrogen sources affecting nitrogen absorption [50], nitrogen concentration, and photosynthesis in leaves. Specifically, we hypothesized that a coupling relationship exists between the leaf economic and hydraulic traits of A. sparsifolia in hyper-arid regions, and this relationship is closely related to mesophyll structure. Moreover, we postulated that the leaf economic and hydraulic traits of A. Sparsifolia change as an essential strategy to respond to different stress conditions involving climatic variations, soil water supply, nutrients availability, and salinity in hyper-arid ecosystems.

2. Materials and Methods
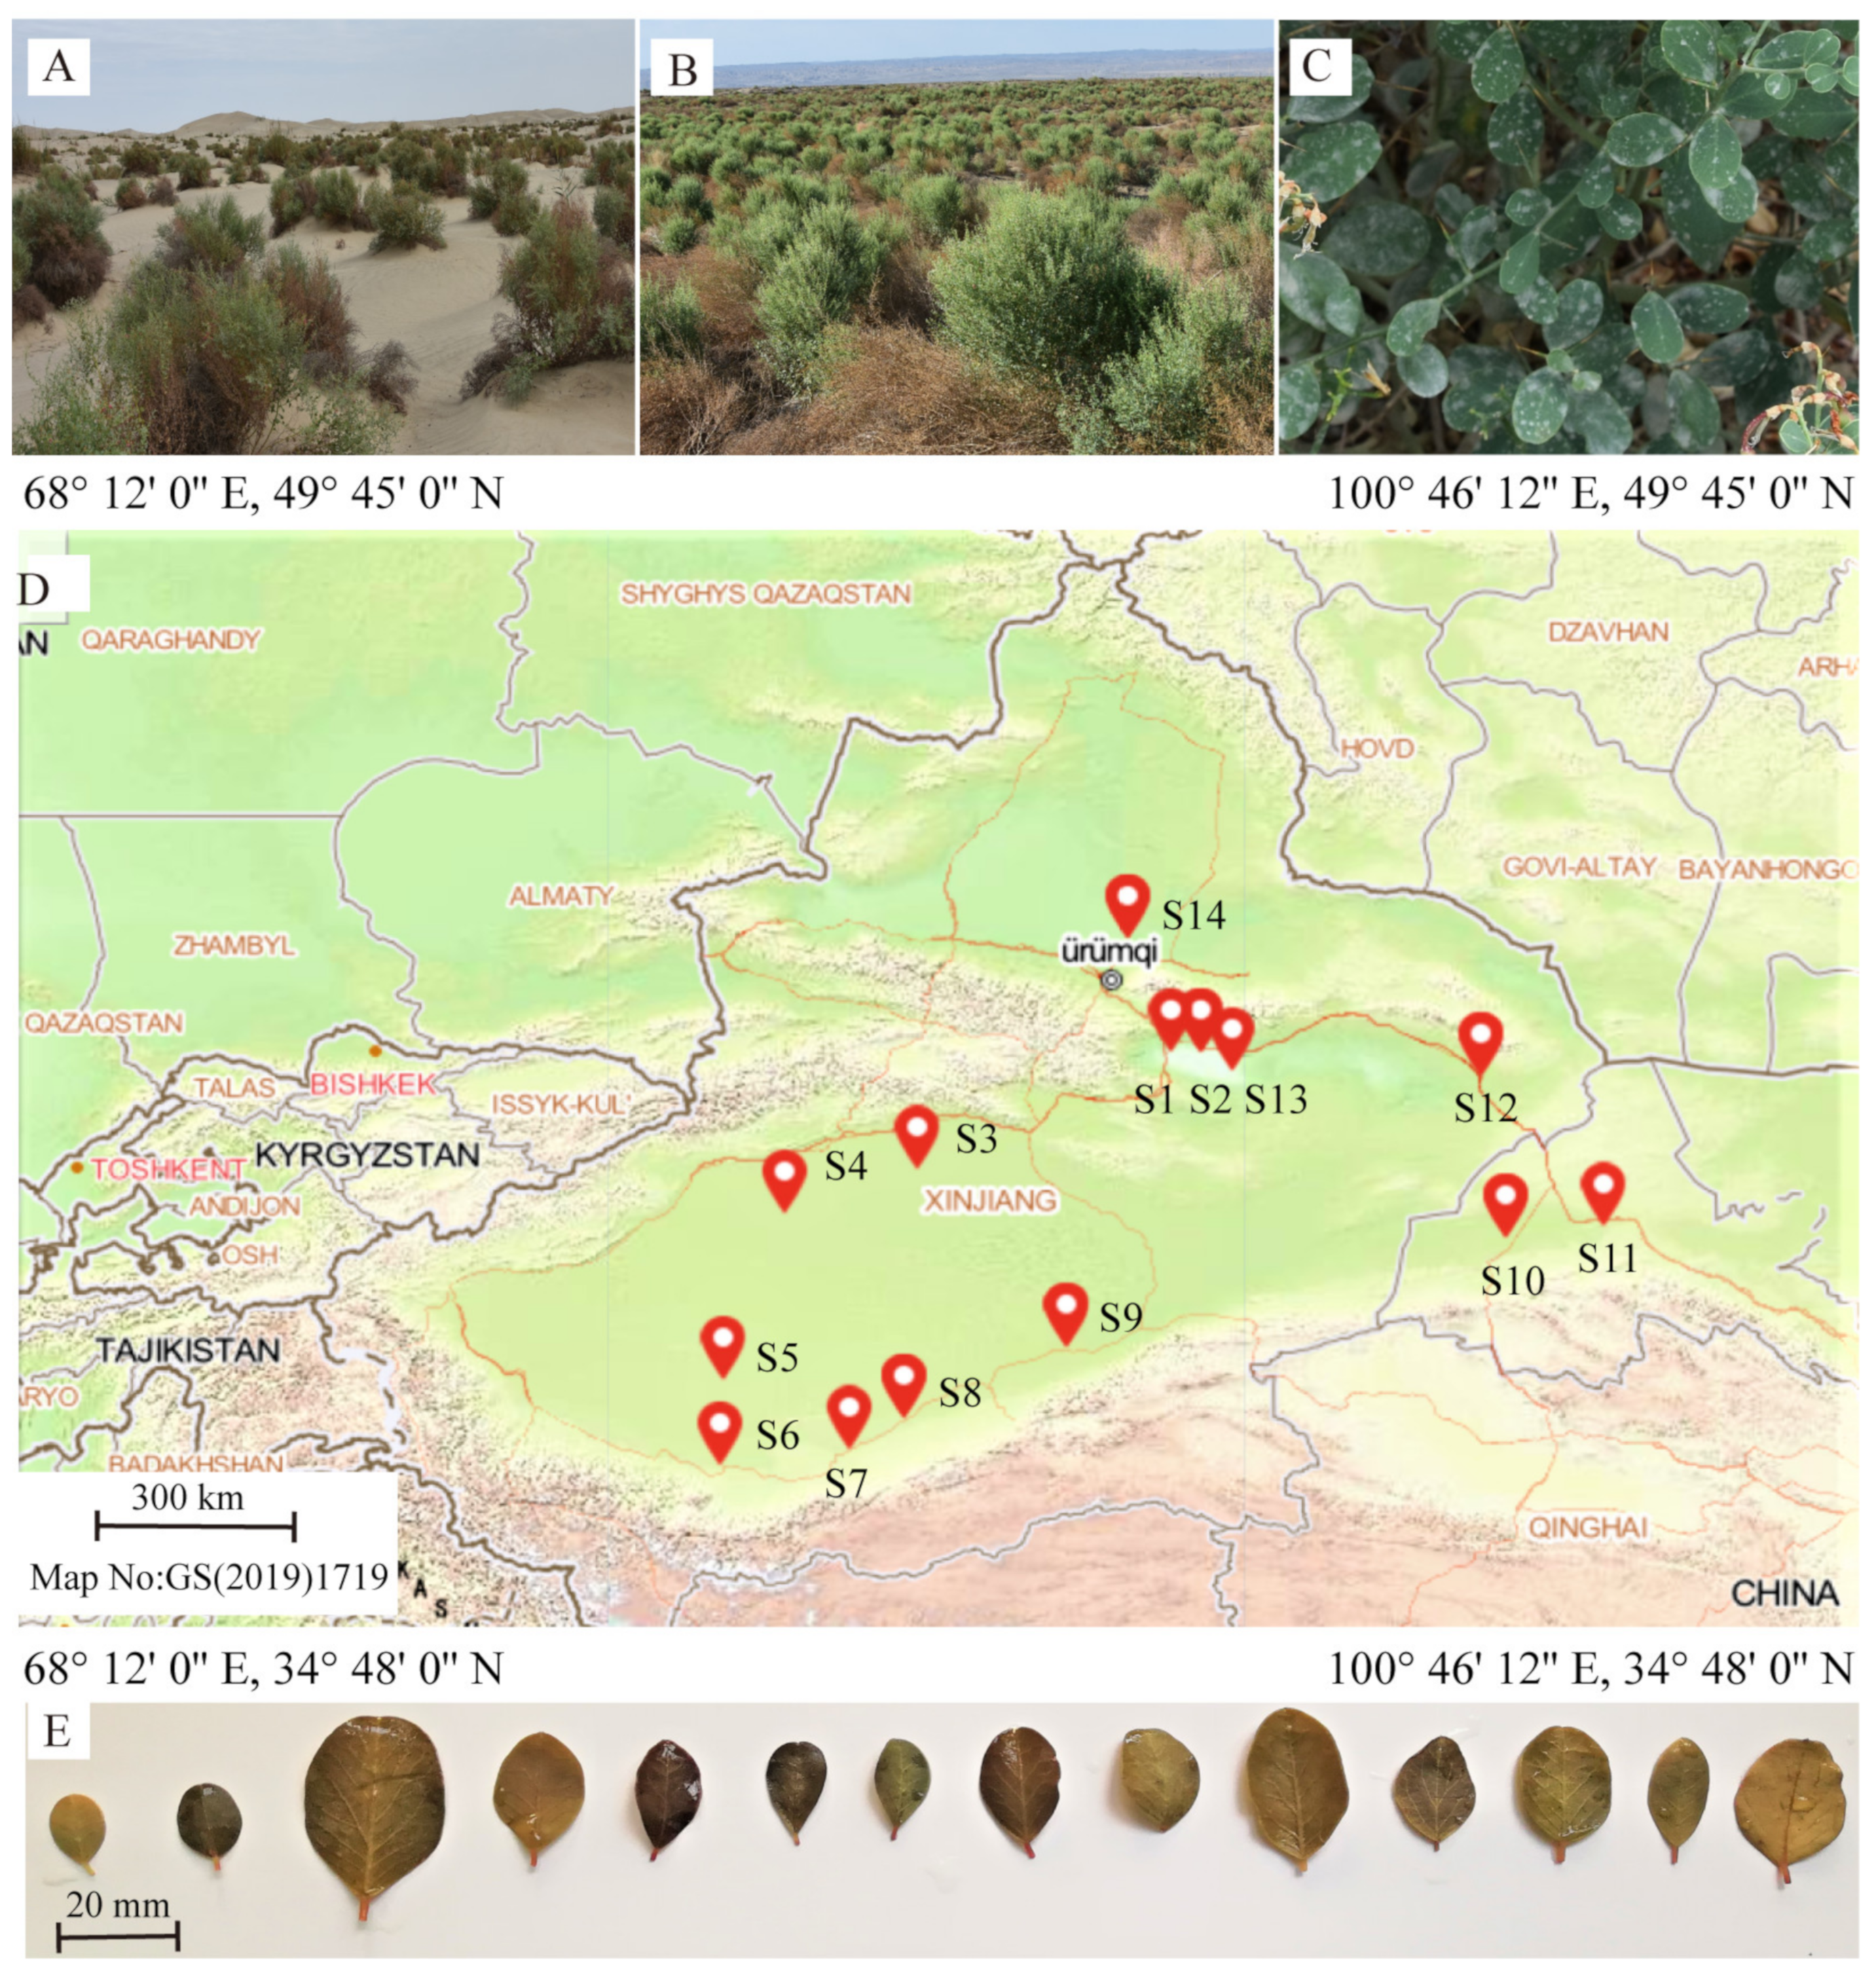
2.1. Sampling Sites

A. sparsifolia is a widely distributed plant found in the hyper-arid regions of northwest China. This study was conducted from July 2018 to August 2018. To expand the heterogeneity of environmental conditions, we selected 14 sampling sites along a longitude ranging from 72°41′24″ E to 99°41′24″ E, and latitude ranging from 35°34′11″ N to 48°7′48″ N (Figure 1). Three 10 m × 10 m plots were randomly set at each sampling site. We obtained precipitation and temperature data from the “WorldClim version 2.1” climate data for 1970–2000 (the spatial resolution was 30 s) [51] by using the R 4.2.0 software. The mean annual precipitation (MAP) of the study location ranged from 16mm to 166 mm.

2.2. Measurement of Traits

2.2.1. Economic Traits

In each plot, we randomly chose 30 leaves from at least 10 A. sparsifolia individuals to measure leaf mass per area (LMA) and leaf thickness (LT). From at least 20 different individuals, we collected approximately 10 g mixture of fully expanded leaves from each plot to determine nitrogen concentration per mass (Nmass). We pressed leaves of plants sampled from each plot with a glass. Using a ruler as a scale, we took images of the leaves, and measured the area of each blade by using the Image J software (NIH Image, Bethesda, MD, USA). To calculate LMA, we used the sum value of 30 leaves per plot as the total leaf area. All leaves collected from each plot were dried at 80 °C for 48 h and then weighed to determine dry leaf biomass [49]. LMA was calculated as dry leaf biomass divided by total leaf area [4]. We used the same leaves to calculate LT by using a digital caliper at an intermediate position between the leaf margin and the midrib for each leaf [52]. We then used the average value of each plot as LT. Leaf tissue density was calculated by dividing LMA with LT [3,4]. We measured the nitrogen concentration (Nmass) of the leaves via the Kjeldahl method (FOSS Kjeltec 8400, FOSS, Hoganas, Sweden), whereby nitrogen concentration per area (Narea) was calculated as the product of Nmass and LMA [3].

2.2.2. Hydraulic Traits

We collected another set of 30 leaves from at least 10 individuals per plot and immediately placed them in FAA fixing solution for the subsequent determination of hydraulic traits. Specifically, we removed three leaves from the FAA solution and then transferred them into a 15% NaOH solution to degrade their mesophyll cells. Afterward, we bleached the leaves in 10% H2O2 solution. We stained the leaves with 1% safranine O, and then photographed three fields of veins at 100×magnification under an optical microscope (Olympus DSC-600, Olympus, Tokyo, Japan) while avoiding the mid-central vein. Total vein length was calculated as the full vein length per unit leaf area [9]. The average value of each plot was used for further analysis.
We analyzed the stomatal density (SD) and stomatal length (SL) ofthe leaves via scanning electron microscope (SEM) (Zeiss Supra55 VP, Carl Zeiss, Oberkochen, Germany) after dehydrating the sampled leaves in graded ethanol series (70%, 80%, 85%, 90%, 95%, and 100% twice, with each series lasting for 15 min). Subsequently, ethanol was replaced with 2-Methyl-2-propanol, and then the leaves were desiccated in a freeze dryer (Christ-ALPHA 2-4 LSCplus, Martin Christ, Osterode am Harz, Germany). The leaves were stuck to the sample holders, placed in the ion sputtering instrument (Hitachi E-1045, Hitachi, Tokyo, Japan), and sprayed with platinum for 2 min. We removed three leaves from each plot and took 10 photographs of these leaves at 200× magnification to calculate SD and SL, using the derivations:
  • SDada, stomata number per area on the adaxial surface of a leaf;
  • SDaba, stomata number per area on the abaxial surface of a leaf;
  • SLada, the length of the guard cell on the adaxial surface of a leaf;
  • SLaba: the length of the guard cell on the abaxial surface of a leaf.
gwmax was calculated follows:
g w max = d α L D / ( ν ( 0.5 + 0.627 α ) ) ,
where d is the diffusivity of water in the air, L denotes SL, and D represents SD. Given that the stomata exist on both leaf surfaces, SD was calculated here as the sum of SDada and SDaba, whereas SL was calculated as the mean of SLada and SLaba. Furthermore, ν represents the molar volume of air, and α represents a fraction of stomatal size to the mean maximum stomatal pore area; a mid-range value of 0.12 for α was used in accordance with previous studies [3,4,53].

2.2.3. Mesophyll Structure

Three leaves from each plot were removed from the FAA solution and then dehydrated with ethanol series (70%, 80%, 85%, 90%, 95%, 100% twice, each series lasting for 15 min). Subsequently, ethanol was replaced with acetone and paraffin. The leaves were then embedded in paraffin for their sectioning; the transverse sections were cut into 10–20 μm slices witha rotary microtome (Leica RM2235, Leica Biosystems, Nussloch, Germany) and then mounted on glass slides. The slices were stained with safranin O and counterstained by fast green. Afterward, which micrographs were taken under an optical microscope (Olympus DSC-600, Olympus, Tokyo, Japan). For each section, five measurements of palisade parenchyma thickness in the upper layer (UPT) and the lower layer (LPT), as well as spongy parenchyma thickness (ST) were measured using Image J software (NIH Image, Bethesda, MD, USA). PT was calculated by calculating the sum of UPT and LPT, and then we calculated the ratio of PT/ST. The average values of the three leaves in each plot were taken as the value of this plot.

2.2.4. Soil Properties

In each plot, we collected three soil samples were collected with a 1 m soil profile at depths of 0–20, 20–40, 40–60, 60–80, and 80–100 cm. We dried approximately100 g of the soil samples in an oven to determine the soil water content (SWC). Subsequently, we air-dried, grounded, and passed through a 100-mesh sieve about 500 g soil samples to evaluate soil alkali-hydrolysable nitrogen (SAN) and soil available phosphorus (SAP), soil salt content (SS), and soil pH value (pH). We ground the soil to a fine powder by using a ball mill (MM400, Retsch, Haan, Germany) to determine soil organic carbon (SOC) [54]. We measured SS via the oven drying method after water was extracted with a 1:5ratios of soil: deionized water [54]. We evaluated SAN via the alkali solution diffusion method as described by Bao [54]. SAP was extracted with 0.5 mol/L NaHCO3 solution and evaluated by using the molybdate/ascorbic acid blue method [54]. Soil samples were digested in the K2Cr2O7 H2SO4 solution for 5 min and measured via the titration method [54] to assess SOC. Soil pH was measured with a pH meter (SevenEasy pH, Mettler-Toledo, Schwerzenbach, Switzerland) after water extracting using a soil: deionized water ratio of 1:2.5 [54]. The mean values of SWC, SS, SAN, SAP, SOC, and pH within 1 m was used for further analysis.

2.3. Statistical Analysis

We calculated the means, standard errors (SE), and coefficient of variation (CV) of each trait using all of the values for all plots. After the data were standardized, the “vegan” package in R 4.0.2 (R Development Core Team) was used to analyze the multivariate association of the whole set of economic and hydraulic characteristics through principal component analysis (PCA). From these results, the loading scores for each functional trait along the first four axes of the PCA were obtained and displayed by the “vegan” package in R 4.0.2. Canonical correlation analysis (CAA) was carried out [55] with SPSSAU (22.0) online application software [56] to verify the coupling relationship between the groups of economic and hydraulic traits. The “corrplot” package in R 4.0.2 was applied to perform Pearson correlation on the entire dataset for the pairwise analysis of the relationship between plant functional traits. The “vegan” package in R 4.0.2 was used to conduct linear regression on the whole data set to express the relationship of functional traits with MAP, SWC, and mesophyll structure. Here, log10 transformation was applied onthe data to increase their linear relationship. We used the generalized linear model of the “glm” package in R 4.0.2 to select the environmental variables (MAP, MAT, SWC, SS, SAN, SAP, SOC, and pH) that affected each functional trait. All of the data log10 transformed to increase their normality. The model with a lower AIC value was selected for importance analysis. We utilized the “relaimpo” package in R 4.0.2 to perform important relative analysis and selected the “lmg” metric to calculate the contributions of the relevant factors to each trait.

3. Results

3.1. Variation in Leaf Functional Traits

Among all the traits, SLada and SLaba and VD showed minor variation across sampling sites; the CV values of SLada, SLaba, and VD were11.97%, 10.12%, and 12.46%, respectively. The other traits had high CV values that reached nearly 20% (Table 1). Mean and SE values for traits measured for each sampling site showed in the Table S1.

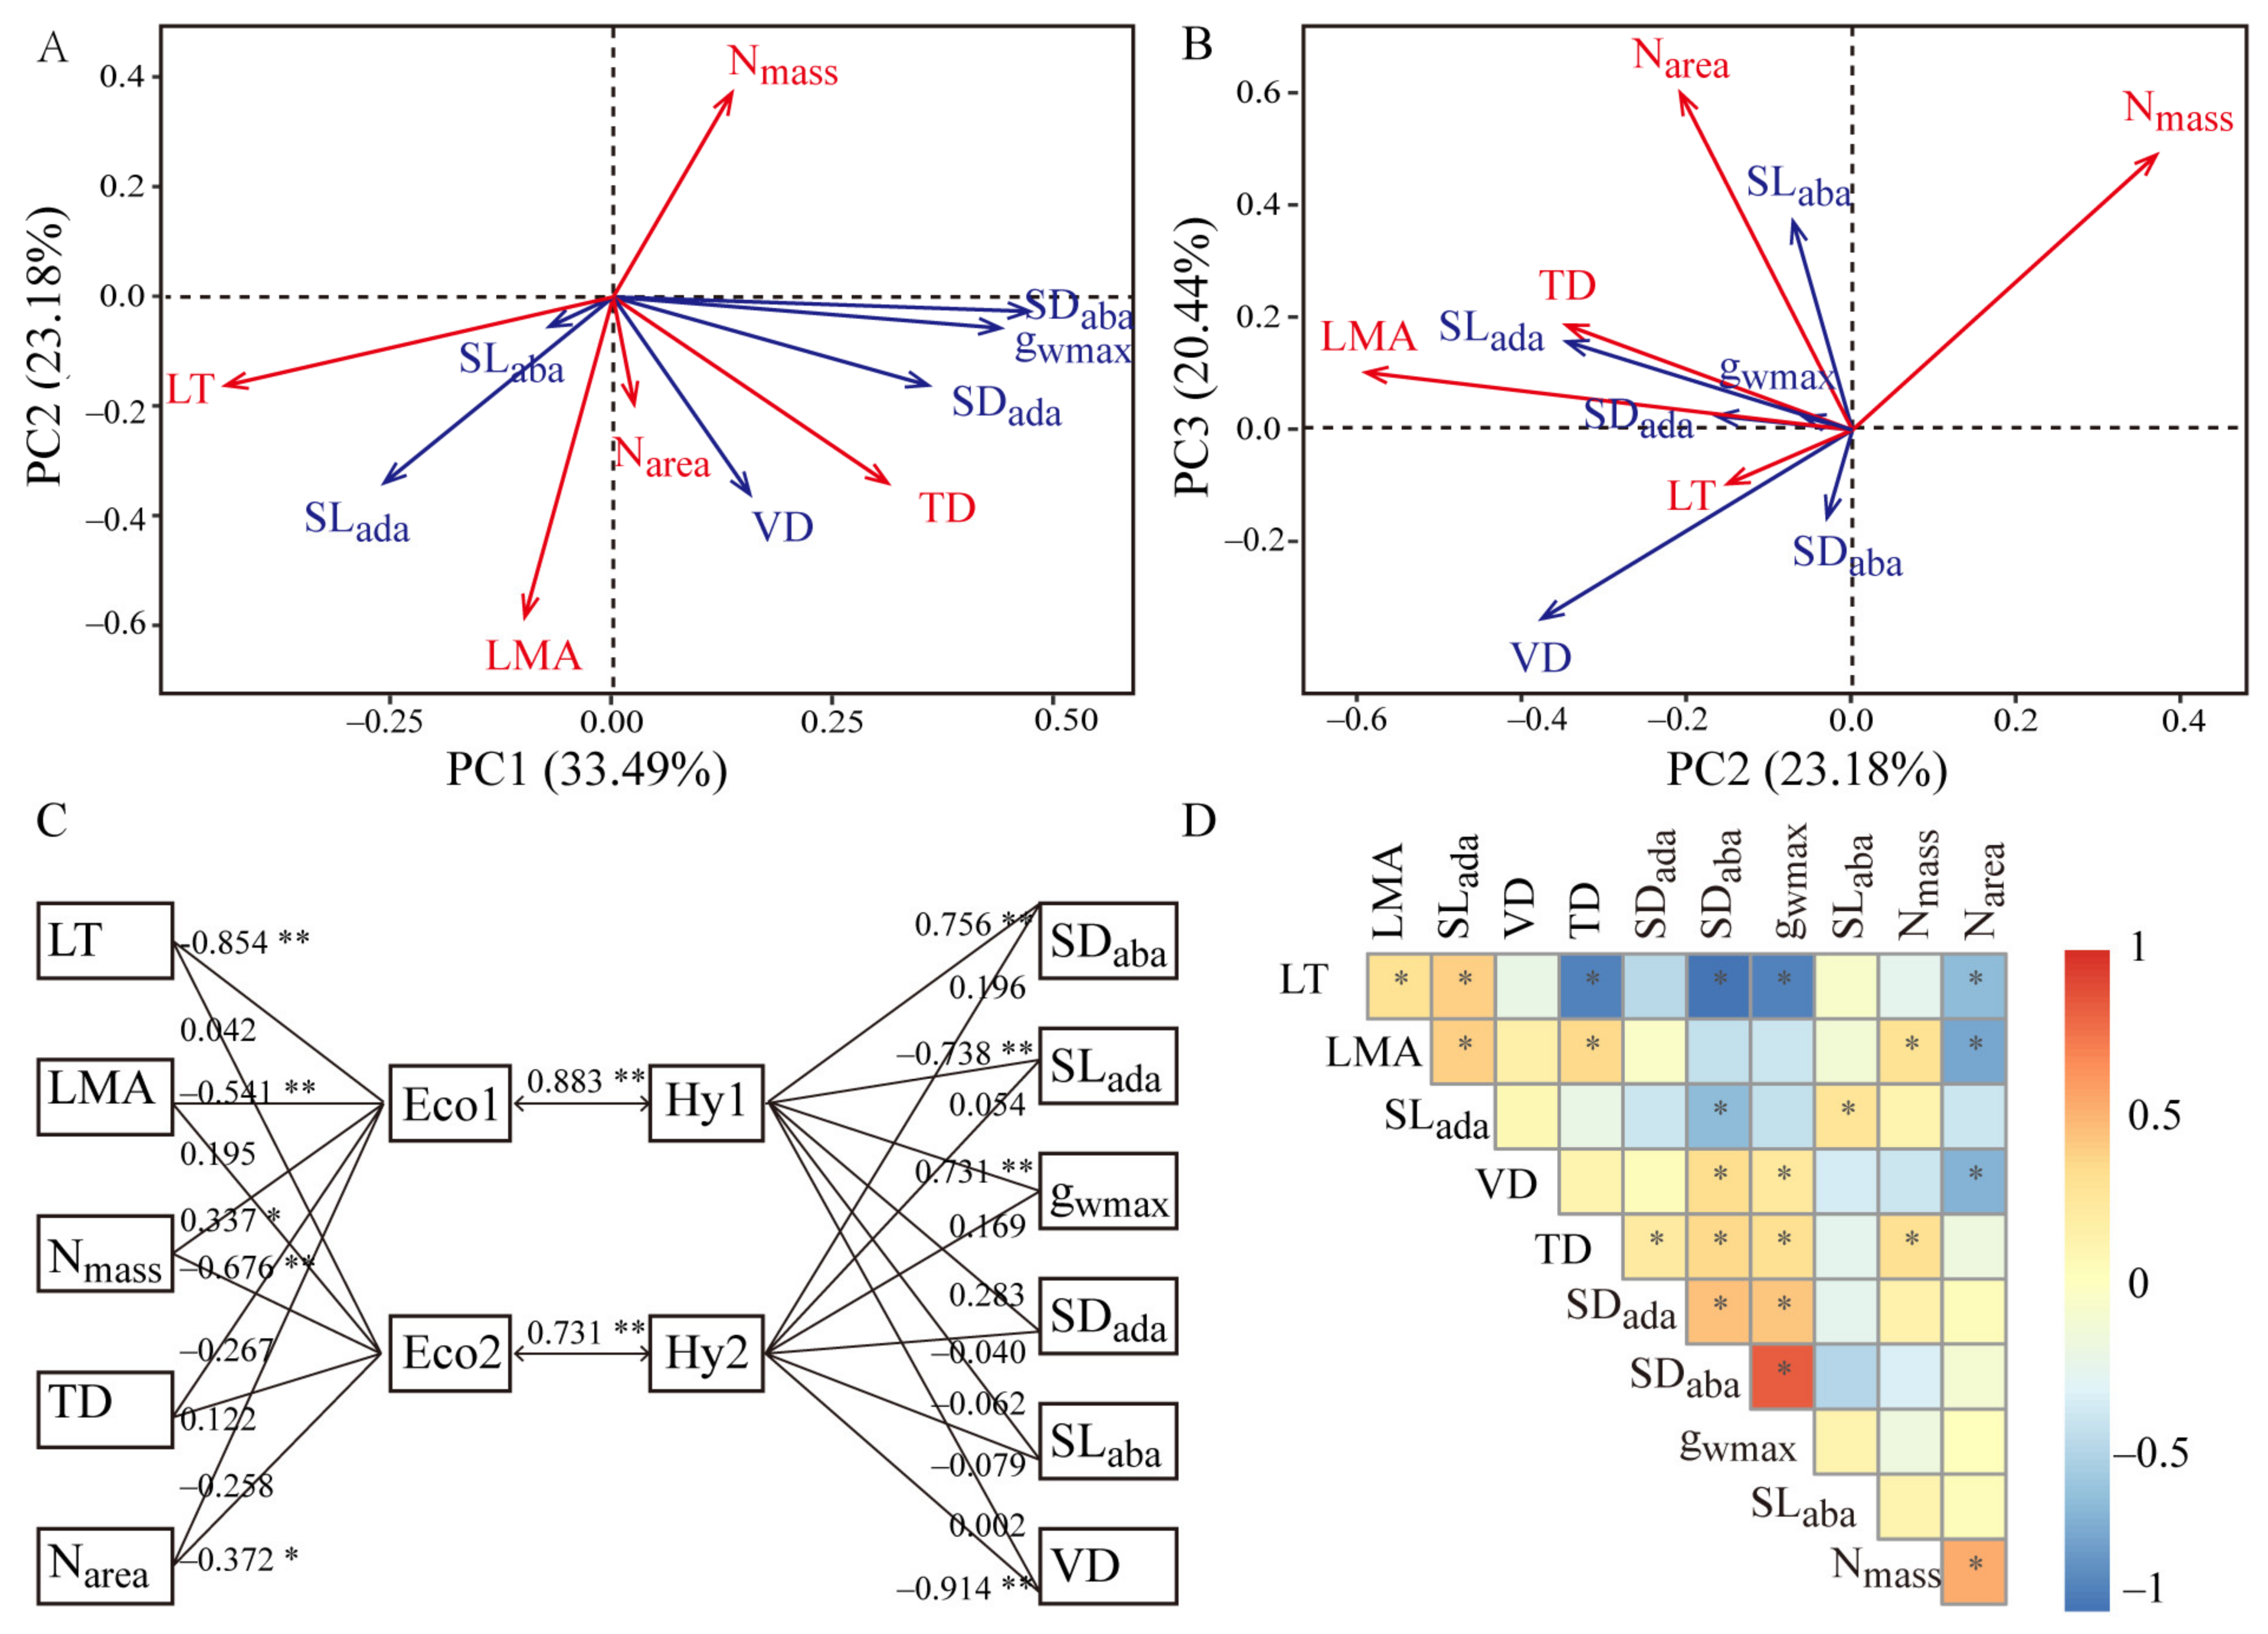
3.2. Relationships among Leaf Economic Traits, Hydraulic Traits, and Mesophyll Structure

PCA revealed that the economic and hydraulic traits of A. sparsifolia were not orthogonal but rather coupled along PC axes. The first PC axis (PC1) accounted for 33.25% of the total variation. Notably, SDada, SDaba, gwmax, TD, LT, and VD provided the highest contributions to PC1. However, LT contributed inversely to variation vis-à-vis other leaf traits. The second PC axis (PC2) accounted for 20.37% of the total variation; LMA, TD, Nmass, VD, and SLada had the highest contributions to PC2, with Nmass contributing in the opposite direction as the other traits (Figure 2A, Table S2). PC3 explained 18.22% of the total variation, with Narea, Nmass, SLaba, and VD presenting the highest contributions (Figure 2B).
As shown in Figure 2C, LT, LMA, Nmass, SDaba, SLada, gwmax contributed significantly to the first pair of canonical variance extracted by CAA (Eco1 and Hy1). By contrast, Nmass, Narea, and VD had the highest contributions to the second pair of canonical variance (Eco2 and Hy2). The correlation coefficients of the first two pairs of canonical variance were 0.883 and 0.731, illustrated that the group of economic traits had a significant positive correlation with hydraulic traits.
SDada and SDaba showed a significantly positive relationship with gwmax and TD. SDaba but not SDada showed a significant positive correlation with VD and a significantly negative relationship with LT and SLada. Nmass demonstrated a significantly negative relationship with LMA, LT, and VD, whereas Narea exhibited a significantly positive relationship with LMA and TD (Figure 2D).
As can be seen from Table 2, UPT was significantly positively related to LMA, LT, and SLada, and negatively correlated with TD, gwmax and SDaba. LPT had no relationship with SL and SD. ST was negatively correlated with TD, SD, and gwmax, and PT/ST was positively correlated to VD and SD.

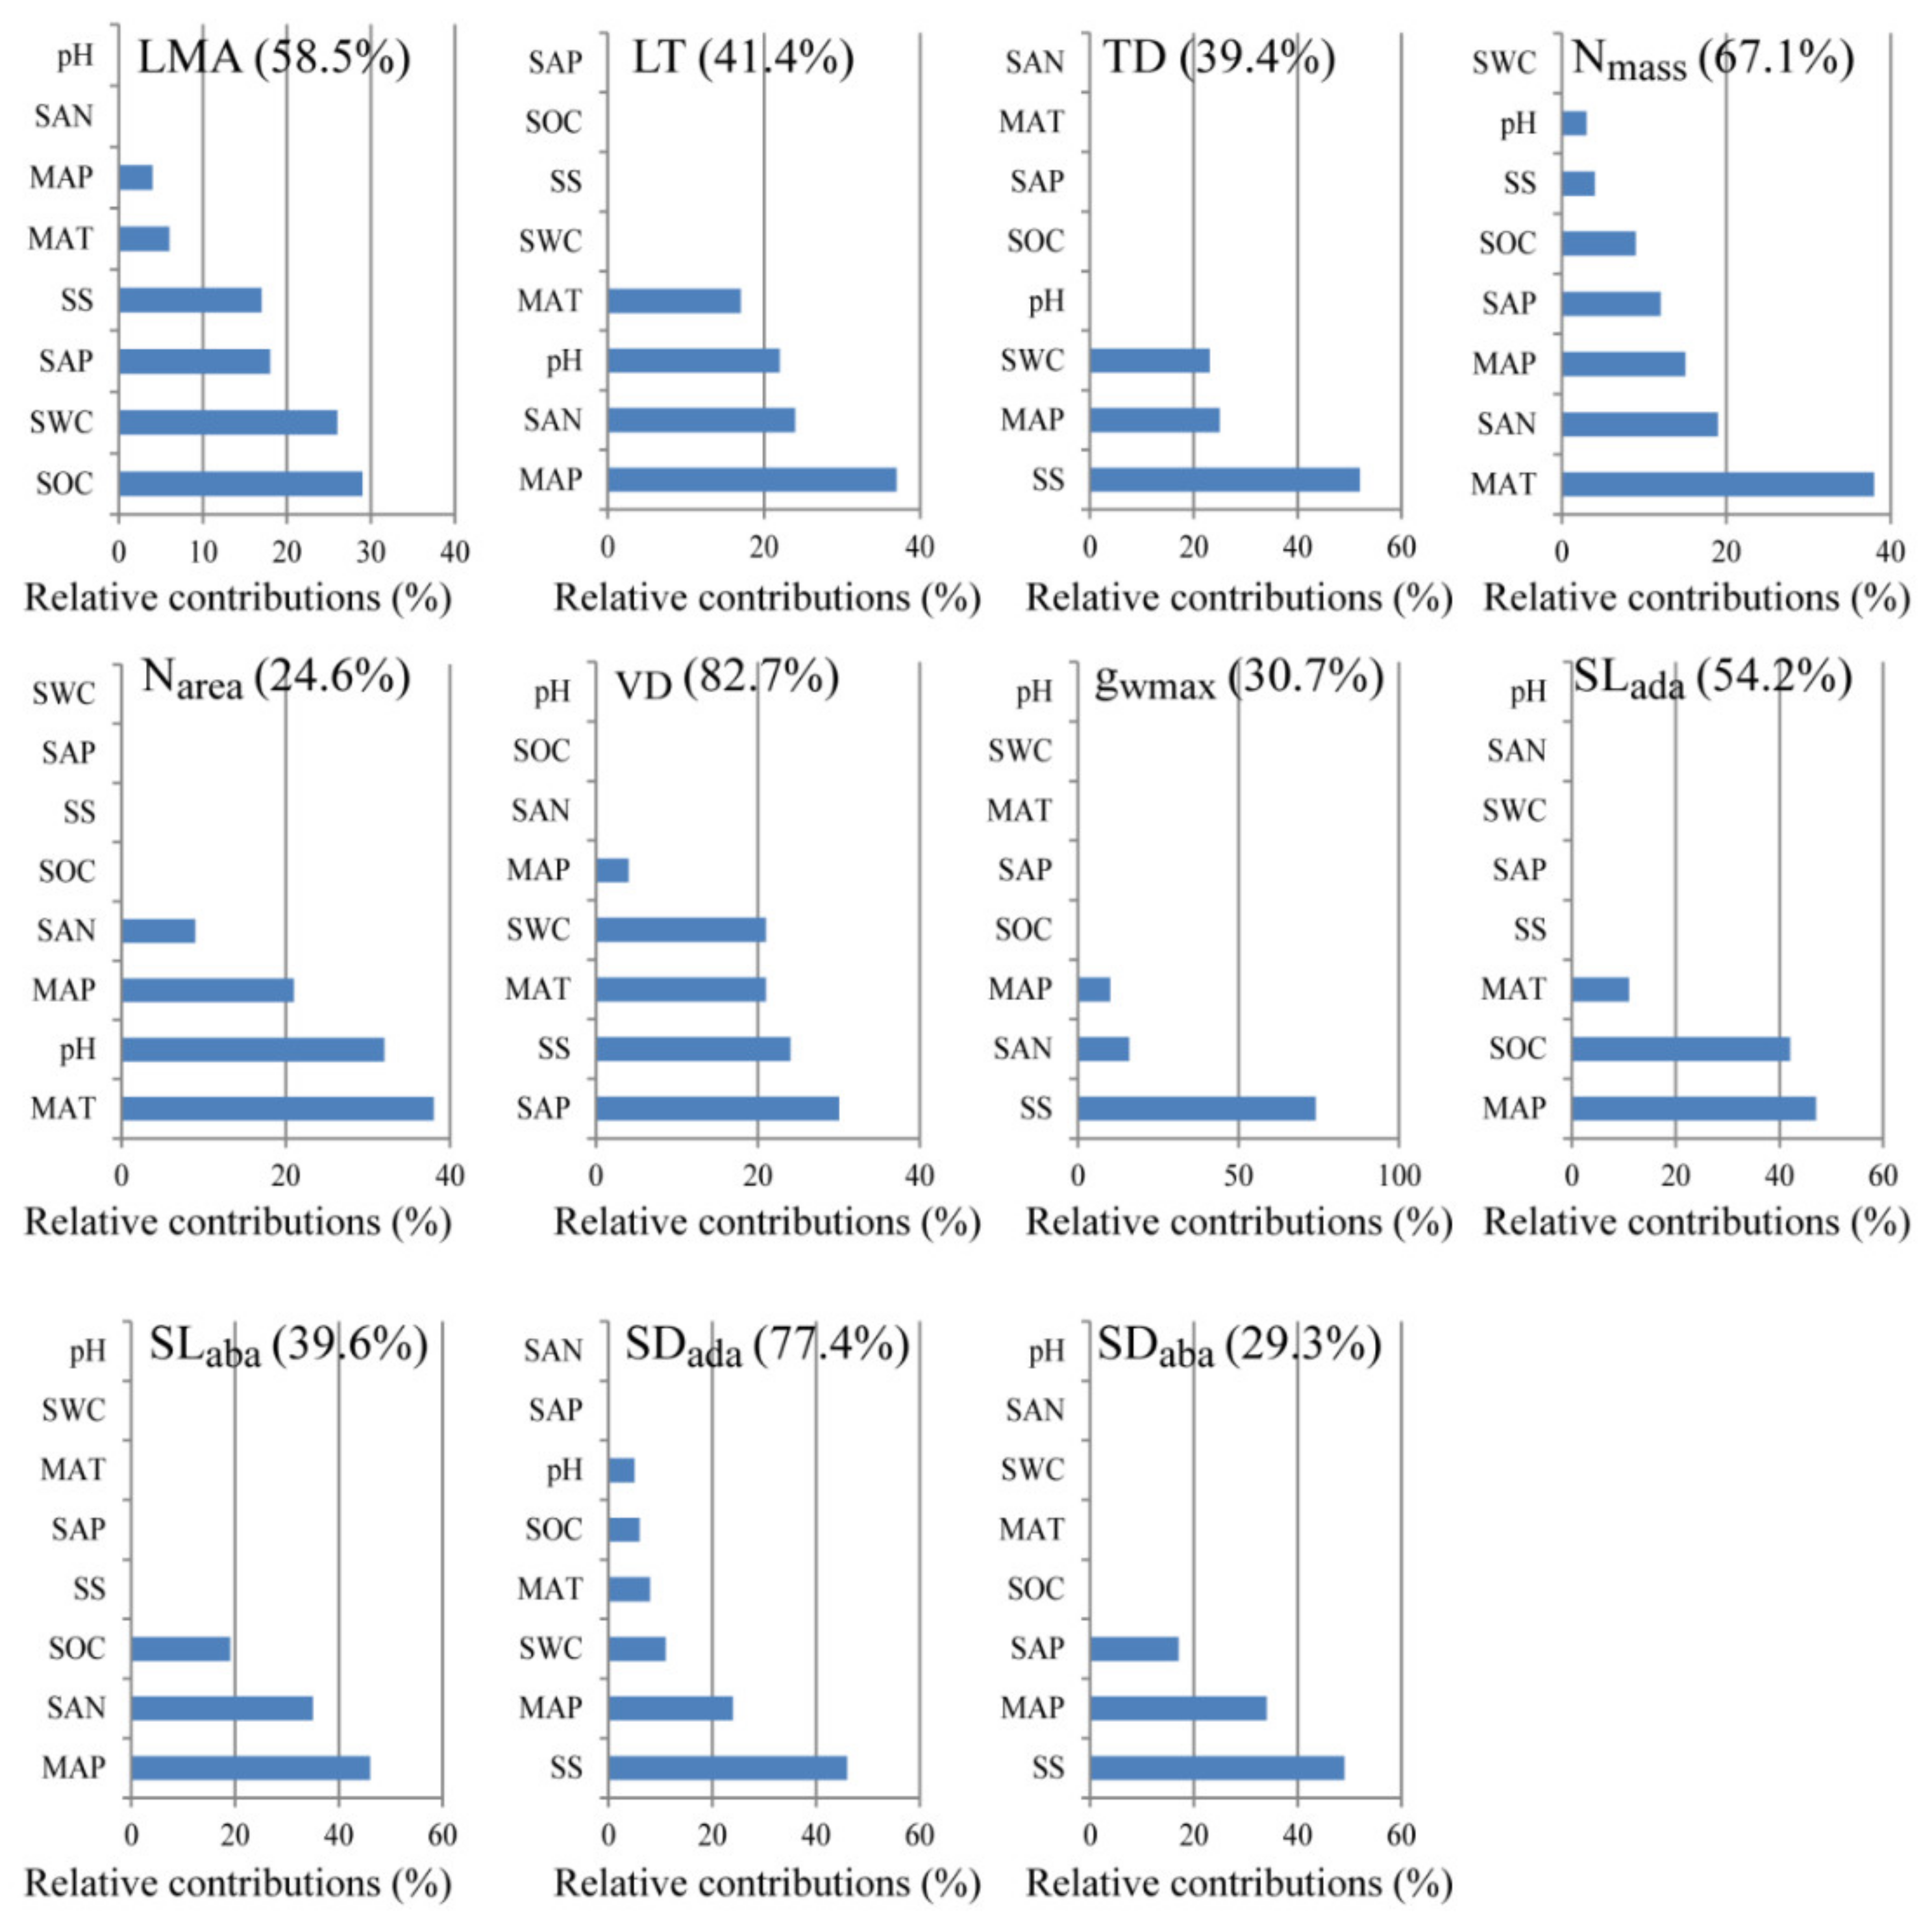
3.3. Contributions of the Environmental Variables on Leaf Functional Traits

Among all the functional traits investigated in this work, only SLada and SLaba was positively correlated with MAP (Figure 3). LMA, TD, and VD were negatively correlated with SWC (Figure 4). Nevertheless, SWC rather than MAP, was the most important driver ofthe changed in the PT/ST of A. sparsifolia (Figure 5). Relatively important analysis (Figure 6) revealed that MAP and soil nutrients contributed significantly to the changes in LT and SL. SS provided high contributions to SD and gwmax. SWC, SOC, SAP, and SS contributed greatly to LMA, TD, and VD. Mean annual temperature (MAT) along with pH and MAP, had high contributions to Nmass and Narea.

4. Discussion

Plants can exhibit variation in their functional traits and their combinations as a mechanism for adaptation to different environmental conditions [57,58]. In this study, the CV of most functional traits was approximately 20% (Table 1). This result suggested that under the influence of different environmental variables, the functional traits of A. sparsifolia could exhibit high variation.

4.1. Coupling Relationship between Leaf Economic and Hydraulic Traits Based on the Mesophyll Structure

In terrestrial plants, the maintenance of the balance between CO2 uptake and H2O transpiration is the major biophysical constraint of carbon gain and survival [4,12,59]. Franks and Farquhar [60] found that compared with C4 plants, most C3 plants need to maintain higher stomatal conductance to provide sufficient CO2 for photosynthesis. At the same time, C3 plants need to tolerate high atmospheric vapor pressure (VPD), and may be threatened by increased transpiration water loss. A. sparsifolia is an isohydric plant [61] that can maintain a constantly midday leaf water potential by reducing stomatal conductance as to limit transpiration. The maximum stomatal conductance forCO2 and H2O depends on SD and SL [53]. Under dry conditions, small and dense stomata are advantageous because tiny pores are more flexible than large ones. However, the increase in SD requires considerably more material investment than the increase in SL [53]. Therefore, the trade-off between SD and SL is an important economic strategy for plants. In this study, stomata were found to be located on the upper and lower surfaces of the leaves of A. sparsifoila. SD on both sides of the blade was significantly positively correlated with gwmax (Figure 7). By contrast, SL lacked a relationship with gwmax, indicating that gwmax was mainly determined by SD. The significant coupling always exists between SD and VD [15], enables plants to maintain a constantly water potential when stomata are opened. The main characteristic of deep-rooted desert plants is that their roots are connected to groundwater and form developed hydraulic channels for water transport to the aboveground parts for plant growth. Therefore, overcoming hydraulic resistance and ensuring leaf water supply are essential for the survival of plants in hyper-arid regions.
Leaf resistance to water transport accounts for 30% of the whole plant, and the higher resistance that occurs in the leaf comes from the outside-xylem pathway [62]. High TD and LMA can enhance water stress tolerance, but can also increases the water and gas diffusion resistance of the blade, and reduce overall diffusion efficiency [10,63,64]. SD and VD can be increased to shorten water and gas transportation distances in mesophyll tissue to reduce this resistance [6,32]. In this work, VD, SDada, and SDaba were found to be significantly correlated with the ratio of PT/ST (Table 2). Under drought conditions, PT/ST is increased and photosynthesis per unit leaf area improves [4]. At the same time, PT/ST is known to be negatively correlated with hydraulic resistance [34]. The positive correlation of PT/ST with VD and SD indicated that A. sparsifolia exhibits special adaptation to reduce hydraulic resistance and enhance the conduction of CO2 and H2O in the mesophyll.
The relationship of stomatal traits on both sides of the leaves with other traits is not always consistent. The adaxial stomata of amphistomatous leaves provide a unique advantage to thick leaves (high LT and LMA) by shortening the CO2 transport pathway between the atmosphere and chloroplasts [65,66]. However, it also increases the risk of water loss on the adaxial surface. As a result, thick leaves need to invest a high amount of carbon to enable veins to balance water loss onthe adaxial surface [32]. However, in A. sparsifolia, SDaba but not SDada showed a significant relationship with VD, LT, and SLada (Figure 7). As an isobilateral leaf, the upper and lower leaf structures of A. sparsifolia are almost symmetrical, thus the hydraulic paths on the two sides of leaves are isolated [67]. Thestomataltraits on the two sides of the leaves can be changed inconsistently [68,69] to adapt to different humidity conditions on the upper and lower leaf surfaces [70]. When natural conditions become dry and hot, isobilateral leaves preferentially close stomata on the surface that is exposed to higher irradiation (and thus reduce evaporative demand) [67,71]. Therefore, under conditions when water around the leaf is sufficient and radiation is weak, such as the conditions encountered during the morning, stomata on both sides of the leaves are completely open, providing additional CO2 to palisade tissues on both sides of the leaves and achieving high photosynthetic efficiency. With the increase of radiation intensity, stomata on the upper surface may be preferentially closed. Meanwhile the stomata on the lower surface remain open, and CO2 and H2O exchange continues. In this situation, the functional relationship between the lower stomata and other economic and hydraulic traits becomes closer. Therefore, the independent control of adaxial and abaxial stomata can increase the flexibly of the control of CO2 and H2Oeconomics in the mesophyll.
The LMA is a central variable of the leaf economic spectrum that captures the trade-off among leaf photosynthetic function, longevity, and structural investment [1,2,72]. In general, leaves with high LMA leaves have high LT and low Nmass; these kinds of leaves invest a high amount of matter into structural construction and thus have low photosynthetic efficiency but improved tolerance to low fertility and drought [1,12,73]. Photosynthesis depends on an adequate of nitrogen and water. Vascular plants increase their investment in VD to enhance their water transport capacity in response to dryness, however, vein construction is considered uneconomic because it consumes large amounts of carbon [74,75]. Nitrogen directly affects vegetative growth and determines photosynthetic capacity becauseit is mostly present in photosynthetic enzymes [76].The Nmass of A. sparsifolia at all the sampling sites in this study fell in the range of 10.51–23.31 mg g−1, which included the average value of desert plants in Xinjiang [77] and other desert plants such as Reaumuria soongorica [78]. The leaves of A. sparsifolia were isobilateral with developed palisade tissue. Its nitrogen concentration per unit leaf area was significantly positively correlated with LMA and TD, indicating that even if the “slow return” strategy was adopted to conserve water and nutrients, nitrogen concentration per unit leaf area remained at levels sufficient for matter production.

4.2. Contributions of Environmental Variables on the Leaf Functional Traits of A. sparsifolia

The multidimensional variation pattern of plant functional traits is the product of plant adaptation to various environmental variables and thus reflects the net outcome of environmental filtering [79]. On the global or large spatial scale, climate is the main ecological factor that determines the distribution characteristics of plant species [80]. In this regard, A. sparsifolia survive only in arid areas wherein the MAP is less than 200 mm (In this work, MAP ranged from 16 mm to 166 mm across all sampling sites) (Figure 1). The limiting of MAP and nutrients provided the greatest contributions to the changes in LT and SL of A. sparsifolia (Figure 3, Figure 6). Compared with plants in humid and semi-arid areas [3,4], A. sparsifolia demonstrated significantly decreased SL and significantly increased SD. The significant correlation between SL and MAP (Figure 3) showed that climatic conditions had an important influence on stomatal morphology. As mentioned above, the variation in SL is more economical than in SD. Therefore, the SL of A. sparsifolia responded preferentially to the change in MAP. SAN and SOC in the soil are derived from the decomposition of litter by soil microorganisms; precipitation increase SAN and SOC by increasing microorganism activity [81]. Therefore, we inferred that with the increase in MAP, soil nutrients availability gradually increased. This increase then affected leaf traits.
In hyper-arid regions, salinization is a fundamental cause of plant water deficit [41,42,43,44]. The roots of A. sparsifolia can be connected to groundwater through developed roots and the damage inflicted by soil salinization can then be avoided. However, groundwater in the Taklimakan Desert is very salty [49]. SEM observation revealed that a large number of salt crystals blocked stomata (Figure S1), illustrating that A. sparsifolia can remove salt through its stomata. Salt ions are considered to be an essential osmotic regulator [82] that can control stomata opening and closure by regulating the osmotic potential of guard cells [83]. However, the activity of blocked pores is significantly weakened. We inferred that the number of stomata on the leaf surface might be forcibly increased for gas exchange. However, this conjecture needs further verification.
Nutrient limitation, especially nitrogen restriction, has a great effect on the leaf area of the whole plant. Reductions in leaf area may increase the irradiance of lower leaves and increase the total plant LMA [84,85]. Given that A. sparsifolia can compensate for the lack of SAN through BNF [49], the lack of SOC may become an important factor that affects plant leaf growth and LMA. Water deficiency increases the thickness of the cell wall, the content of collenchyma, and the density of veins, thus increasing mesophyll tissue density [86]. Physiological drought caused by salt stress is similar to that caused by water stress [41,42,43,84]. Water stress has an important effect on TD, VD, and LMA (Figure 4). Given that salt also can increase the size or number of mesophyll cells [87,88], it has an important impact on TD, VD, and LMA.
Temperature is the key driving force ofthe formation of soil microbial communities because it affects the carbon utilization, structure, and functions of fungi [89] and plays an essential role in the decomposition and transformation of soil nutrients [90]. The BNF is also affected by temperature, water, and salt conditions [50,52]. Consequently, temperature affects nitrogen concentration in the leaves of A. sparsifolia. In addition, pH might influence Narea through water absorption given that high soil pH associated with low water absorption by plant roots [91], likely because pH affects aquaporin function [92]. At the same time, when water shortage occurs, plants increase nitrogen distribution in their leaves, improve cell osmotic pressure, reduce water consumption by reducing stomatal conductance, and strengthen water protection in vivo [91,93,94]. Therefore, in A. sparsifolia, the change in leaf traits is the comprehensive response to different water, salt, and nutrients conditions in hyper-arid areas.

5. Conclusions

We confirmed the coupling relationship between leaf economic and hydraulic traits in a species that is widely distributed in hyper-arid regions. The economic traits, hydraulic traits, and mesophyll tissue structure of A. sparsifolia tended to ensure the coordination of water and nutrient conservation with CO2 and H2O diffusion in mesophyll tissue to balance matter production and investment. Leaf functional traits were affected by different environmental variables. However, this study had an important shortcoming: that is, A. sparsifolia can survive only in arid areas. Future studies need to select several species that can survive over a broad range of precipitation gradients to confirm further effect of precipitation on the relationship between economic and hydraulic traits.

Supplementary Materials

The following are available online at https://www.mdpi.com/article/10.3390/plants10091867/s1, Table S1: Mean and SE values for traits measured for each sampling site, Table S2: Loading scores of 11 traits in the PCA, Figure S1: The SEM pictures of stomata with salt crystals. (A) Picture of the leaf 28 surface. (B) The picture of the leaf section. The red circle marked the salt crystals 29 discharged from the stomata.

Author Contributions

H.Y. and F.Z. developed the idea; H.Y., F.Z., G.L. and A.T. designed the sampling protocol; H.Y., P.W., Z.Z. and S.M. collected the data; H.Y., B.Z., A.T. and Z.Z. performed the analysis and wrote the first draft of the manuscript; F.Z., C.G., M.S., G.L. and A.T. reviewed/contributed and helped in improving the quality of the manuscript. All authors read and contributed feedback to the manuscript. All authors have read and agreed to the published version of the manuscript.

Funding

This work was supported by the Joint Funds of the National Natural Science Foundation of China and the Government of Xinjiang Uygur Autonomous Region of China (U1903102); the National Natural Science Foundation of China (41977050); the Natural Science Foundation of Xinjiang Uygur Autonomous Region (2021D01D02); the Western Young Scholar Program-B of the Chinese Academy of Sciences (2018-XBQNXZ-B-018); the President’s International Fellowship Initiative-Postdoctoral Researchers, Chinese Academy of Sciences (2020PB0002); the National Natural Science Foundation of China (41877012); and the team project of the Chinese Academy of Sciences (2018-YDYLTD-002).

Institutional Review Board Statement

Not applicable.

Informed Consent Statement

Not applicable.

Data Availability Statement

All data reported here is available from the authors upon request.

Acknowledgments

The authors thank Shimin Li and Pinglin Guo in this research group for their help with collecting the field samples; Liqiong Xie in Xinjiang University for pointing out some logical mistakes in the paper; and the Xinjiang Regional Center of Resources and Environmental Science Instrument and Service Center of Public Technology Xinjiang Institute of Ecology and Geography CAS for their help in the experiment.

Conflicts of Interest

The authors declare no conflict of interest. The funders had no role in the design of the study; in the collection, analyses, or interpretation of data; in the writing of the manuscript, or in the decision to publish the results.

References

  1. Wright, I.J.; Reich, P.B.; Westoby, M.; Ackerly, D.D.; Baruch, Z.; Bongers, F.; Cavender-Bares, J.; Chapin, T.; Cornelissen, J.H.C.; Diemer, M.; et al. The worldwide leaf economics spectrum. Nature 2004, 428, 821–827. [Google Scholar] [CrossRef]
  2. Reich, P.B. The world-wide ‘fast-slow’ plant economics spectrum: A traits manifesto. J. Ecol. 2014, 102, 275–301. [Google Scholar] [CrossRef]
  3. Li, L.; McCormack, M.L.; Ma, C.; Kong, D.; Zhang, Q.; Chen, X.; Zeng, H.; Niinemets, U.; Guo, D. Leaf economics and hydraulic traits are decoupled in five species-rich tropical-subtropical forests. Ecol. Lett. 2015, 18, 899–906. [Google Scholar] [CrossRef] [PubMed]
  4. Yin, Q.; Wang, L.; Lei, M.; Dang, H.; Quan, J.; Tian, T.; Chai, Y.; Yue, M. The relationships between leaf economics and hydraulic traits of woody plants depend on water availability. Sci. Total Environ. 2018, 621, 245–252. [Google Scholar] [CrossRef] [PubMed]
  5. Sack, L.; Cowan, P.D.; Jaikumar, N.; Holbrook, N.M. The ‘hydrology’ of leaves: Co-ordination of structure and function in temperate woody species. Plant Cell Environ. 2003, 26, 1343–1356. [Google Scholar] [CrossRef] [Green Version]
  6. de Boer, H.J.; Drake, P.L.; Wendt, E.; Price, C.A.; Schulze, E.D.; Turner, N.C.; Nicolle, D.; Veneklaas, E.J. Apparent Overinvestment in Leaf Venation Relaxes Leaf Morphological Constraints on Photosynthesis in Arid Habitats. Plant Physiol. 2016, 172, 2286–2299. [Google Scholar] [CrossRef] [PubMed]
  7. Xiong, D.; Flexas, J. Leaf economics spectrum in rice: Leaf anatomical, biochemical, and physiological trait trade-offs. J. Exp. Bot. 2018, 69, 5599–5609. [Google Scholar]
  8. Pathare, V.S.; Koteyeva, N.; Cousins, A.B. Increased adaxial stomatal density is associated with greater mesophyll surface area exposed to intercellular air spaces and mesophyll conductance in diverse C4 grasses. New Phytol. 2020, 225, 169–182. [Google Scholar] [CrossRef] [PubMed] [Green Version]
  9. Blonder, B.; Violle, C.; Bentley, L.P.; Enquist, B.J. Venation networks and the origin of the leaf economics spectrum. EcolLett 2011, 14, 91–100. [Google Scholar] [CrossRef]
  10. Sack, L.; Scoffoni, C.; John, G.P.; Poorter, H.; Mason, C.M.; Mendez-Alonzo, R.; Donovan, L.A. Leaf mass per area is independent of vein length per area: Avoiding pitfalls when modelling phenotypic integration (reply to Blonder et al. 2014). J. Exp. Bot. 2014, 65, 5115–5123. [Google Scholar] [CrossRef] [PubMed] [Green Version]
  11. He, N.P.; Li, Y.; Liu, C.C.; Xu, L.; Li, M.X.; Zhang, J.H.; He, J.S.; Tang, Z.Y.; Han, X.G.; Ye, Q.; et al. Plant Trait Networks: Improved Resolution of the Dimensionality of Adaptation. Trends Ecol. Evol. 2020, 35, 908–918. [Google Scholar] [CrossRef]
  12. Simonin, K.A.; Limm, E.B.; Dawson, T.E. Hydraulic conductance of leaves correlates with leaf lifespan: Implications for lifetime carbon gain. New Phytol. 2012, 193, 939–947. [Google Scholar] [CrossRef]
  13. Blonder, B.; Violle, C.; Enquist, B.J. Assessing the causes and scales of the leaf economics spectrum using venation networks in Populus tremuloides. J. Ecol. 2013, 101, 981–989. [Google Scholar] [CrossRef]
  14. McDowell, N.; Pockman, W.T.; Allen, C.D.; Breshears, D.D.; Cobb, N.; Kolb, T.; Plaut, J.; Sperry, J.; West, A.; Williams, D.G.; et al. Mechanisms of plant survival and mortality during drought: Why do some plants survive while others succumb to drought? New Phytol. 2008, 178, 719–739. [Google Scholar] [CrossRef] [PubMed]
  15. Xu, Z.; Zhou, G. Responses of leaf stomatal density to water status and its relationship with photosynthesis in a grass. J. Exp. Bot. 2008, 59, 3317–3325. [Google Scholar] [CrossRef] [PubMed] [Green Version]
  16. Zhang, S.B.; Guan, Z.J.; Sun, M.; Zhang, J.J.; Cao, K.F.; Hu, H. Evolutionary association of stomatal traits with leaf vein density in Paphiopedilum, Orchidaceae. PLoS ONE 2012, 7, e40080. [Google Scholar] [CrossRef] [PubMed] [Green Version]
  17. Sack, L.; Scoffoni, C. Leaf venation: Structure, function, development, evolution, ecology and applications in the past, present and future. New Phytol. 2013, 198, 983–1000. [Google Scholar] [CrossRef] [PubMed]
  18. Li, F.L.; McCulloh, K.A.; Sun, S.J.; Bao, W. Linking leaf hydraulic properties, photosynthetic rates, and leaf lifespan in xerophytic species: A test of global hypotheses. Am. J. Bot. 2018, 105, 1858–1868. [Google Scholar] [CrossRef]
  19. Liu, C.C.; Li, Y.; Xu, L.; Chen, Z.; He, N.P. Variation in leaf morphological, stomatal, and anatomical traits and their relationships in temperate and subtropical forests. Sci. Rep. 2019, 9, 5803. [Google Scholar] [CrossRef] [Green Version]
  20. Martínez-Vilalta, J.; García-Forner, N. Water potential regulation, stomatalbehaviour and hydraulic transport under drought: Deconstructing the iso/anisohydric concept. Plant Cell Environ. 2016, 40, 962–976. [Google Scholar] [CrossRef] [Green Version]
  21. Hochberg, U.; Rockwell, F.E.; Holbrook, N.M.; Cochard, H. Iso/anisohydry: A plant-environment interaction rather than a simple hydraulic trait. Trends Plant Sci. 2018, 23, 112–120. [Google Scholar] [CrossRef] [PubMed]
  22. Álvarez-Maldini, C.; Acevedo, M.; Pinto, M. Hydroscapes: A Useful Metric for Distinguishing Iso-/Anisohydric Behavior in Almond Cultivars. Plants 2021, 10, 1249. [Google Scholar] [CrossRef]
  23. Guo, J.S.; Hultine, K.R.; Koch, G.W.; Kropp, H.; Ogle, K. Temporal shifts in iso/anisohydry revealed from daily observations of plant water potential in a dominant desert shrub. New Phytol. 2020, 225, 713–726. [Google Scholar] [CrossRef] [PubMed]
  24. Wu, G.; Guan, K.; Li, Y.; Novick, K.A.; Feng, X.; McDowell, N.G.; Konings, A.G.; Thompson, S.E.; Kimball, J.S.; De Kauwe, M.G.; et al. Interannual variability of ecosystem iso/anisohydry is regulated by environmental dryness. New Phytol. 2020, 229, 2562–2575. [Google Scholar] [CrossRef] [PubMed]
  25. Harrison, S.; Spasojevic, M.J.; Li, D. Climate and plant community diversity in space and time. Proc. Natl. Acad. Sci. USA 2020, 117, 4464–4470. [Google Scholar] [CrossRef]
  26. Wang, L.; Zhao, G.; Li, M.; Zhang, M.; Zhang, L.; Zhang, X.; An, L.; Xu, S. C:N:P stoichiometry and leaf traits of halophytes in an arid saline environment, northwest China. PLoS ONE 2015, 10, e0119935. [Google Scholar] [CrossRef] [Green Version]
  27. Zhang, K.; Su, Y.; Yang, R. Variation of soil organic carbon, nitrogen, and phosphorus stoichiometry and biogeographic factors across the desert ecosystem of Hexi Corridor, northwestern China. J. Soil Sediment. 2018, 19, 49–57. [Google Scholar] [CrossRef]
  28. Perri, S.; Katul, G.G.; Molini, A. Xylem-phloem hydraulic coupling explains multiple osmo regulatory responses to salt stress. New Phytol. 2019, 224, 644–662. [Google Scholar] [CrossRef]
  29. Jin, Q.H. Population chatacter of Alhagisparsifolia and plant community succession. Acta Phytoecol. Sin. 1995, 19, 255–260. (In Chinese) [Google Scholar]
  30. Li, X.Y.; Zhang, X.M.; Zeng, F.J.; Foetzki, A.; Thomas, F.M.; Li, X.M.; Runge, M.; He, X.Y. Water relations on Alhagisparsifolia in the southern fringe of Taklamakan Desert. Acta Bot. Sin. 2002, 44, 1219–1224. (In Chinese) [Google Scholar]
  31. Yang, G.; Li, Y. A study on the ecological type of Alhagi from their Anatomy. Arid Zone Res. 1992, 4, 21–25. (In Chinese) [Google Scholar]
  32. Drake, P.L.; de Boer, H.J.; Schymanski, S.J.; Veneklaas, E.J. Two sides to every leaf: Water and CO2 transport in hypostomatous and amphistomatous leaves. New Phytol. 2019, 222, 1179–1187. [Google Scholar] [CrossRef] [PubMed] [Green Version]
  33. Zhao, C.X.; Huang, Z.S. A preliminary study of xeromorphism of some important xerophytes growing in Tungeli Desert. J. Integr. Plant Biol. 1981, 23, 278–283. (In Chinese) [Google Scholar]
  34. Sack, L.; Frole, K. Leaf structural diversity is related to hydraulic capacity in tropical rain forest trees. Ecology 2006, 87, 483–491. [Google Scholar] [CrossRef]
  35. Wang, H. An Empirical Analysis on Hydraulic Lift of A. sparsifolia and T. ramosissima at the Southern Fringe of the Taklimakan Desert. Master’s Thesis, Chinese Academy of Sciences, Beijing, China, 2014. [Google Scholar]
  36. Caldwell, M.M.; Richards, J.H. Hydraulic lift: Water efflux from upper roots improves effectiveness of water uptake by deep roots. Oecologia 1989, 79, 1–5. [Google Scholar] [CrossRef]
  37. Caldwell, M.; Dawson, T.; Richards, J. Hydraulic lift: Consequences of water efflux from the roots of plants. Oecologia 1998, 113, 151–161. [Google Scholar] [CrossRef] [PubMed]
  38. Domec, J.C.; Warren, J.M.; Meinzer, F.C.; Brooks, J.R.; Coulombe, R. Native root xylem embolism and stomatal closure in stands of Douglas-fir and ponderosa pine: Mitigation by hydraulic redistribution. Oecologia 2004, 141, 7–16. [Google Scholar] [CrossRef]
  39. Zhang, L.; Mai, M.; An, N.; Xia, Y. Effects of summer irrigation on morphological characteristics, community ecological structure and natural regeneration of A. sparsifolia. Arid Zone Res. 1995, 12, 34–40. (In Chinese) [Google Scholar]
  40. Wang, J.; Ding, J.; Yu, D.; Teng, D.; He, B.; Chen, X.; Ge, X.; Zhang, Z.; Wang, Y.; Yang, X.; et al. Machine learning-based detection of soil salinity in an arid desert region, Northwest China: A comparison between Landsat-8 OLI and Sentinel-2 MSI. Sci. Total Environ. 2020, 707, 136092. [Google Scholar] [CrossRef]
  41. Munns, R. Comparative physiology of salt and water stress. Plant Cell Environ. 2002, 25, 239–250. [Google Scholar] [CrossRef]
  42. Parida, A.K.; Das, A.B. Salt tolerance and salinity effects on plants: A review. Ecotoxicol. Environ. Saf. 2005, 60, 324–349. [Google Scholar] [CrossRef] [PubMed]
  43. Perri, S.; Entekhabi, D.; Molini, A. Plant osmoregulation as an emergent water-saving adaptation. Water Resour. Res. 2018, 54, 2781–2798. [Google Scholar] [CrossRef]
  44. Perri, S.; Suweis, S.; Holmes, A.; Marpu, P.R.; Entekhabi, D.; Molini, A. River basin salinization as a form of aridity. Proc. Natl. Acad. Sci. USA 2020, 117, 17635–17642. [Google Scholar] [CrossRef] [PubMed]
  45. Shao, H.; Chu, L.; Lu, H.; Qi, W.; Chen, X.; Liu, J.; Kuang, S.; Tang, B.; Wong, V. Towards sustainable agriculture for the salt-affected soil. Land Degrad. Dev. 2019, 30, 574–579. [Google Scholar] [CrossRef]
  46. Zhao, K.; Song, J.; Feng, G.; Zhao, M.; Liu, J. Species, types, distribution, and economic potential of halophytes in China. Plant Soil. 2010, 342, 495–509. [Google Scholar] [CrossRef]
  47. Luo, H.; Zeng, F.; Zhang, B.; Liu, B.; Zhao, S.; Gao, H. Ion distribution, absorption and translocation characteristics of Alhagisparsifolia in adaptation to saline habitat. Chin. J. App. Ecol. 2016, 27, 3514–3520. (In Chinese) [Google Scholar]
  48. Zhao, S.; Zeng, F.; Zhang, B.; Liu, B.; Gao, H.; Luo, H. Effect of salt stress on leaf traits of Alhagisparsifolia. Pratacult. Sci. 2016, 33, 1770–1778. (In Chinese) [Google Scholar]
  49. Arndt, S.K.; Kahmen, A.; Arampatsis, C.; Popp, M.; Adams, M. Nitrogen fixation and metabolism by groundwater-dependent perennial plants in a hyperarid desert. Oecologia 2004, 141, 385–394. [Google Scholar] [CrossRef]
  50. Li, M.M.; Petrie, M.D.; Tariq, A.; Zeng, F. Response of nodulation, nitrogen fixation to salt stress in a desert legume Alhagi sparsifolia. Environ. Exp. Bot. 2021, 183, 104348. [Google Scholar] [CrossRef]
  51. Fick, S.E.; Hijmans, R.J. WorldClim 2: New 1-km spatial resolution climate surfaces for global land areas. Int. J. Climatol. 2017, 37, 4302–4315. [Google Scholar] [CrossRef]
  52. Gomes, A.L.; Revermann, R.; Meller, P.; Goncalves, F.M.P.; Aidar, M.P.M.; Lages, F.; Finckh, M. Functional traits and symbiotic associations of geoxyles and trees explain the dominance of detarioid legumes in miombo ecosystems. New Phytol. 2021, 230, 510–520. [Google Scholar] [CrossRef] [PubMed]
  53. Franks, P.J.; Drake, P.L.; Beerling, D.J. Plasticity in maximum stomatal conductance constrained by negative correlation between stomatal size and density: An analysis using Eucalyptus globulus. Plant Cell Environ. 2009, 32, 1737–1748. [Google Scholar] [CrossRef]
  54. Bao, S.D. Agro-Chemical Analysis of Soil; China Agricultural Press: Beijing, China, 2000. [Google Scholar]
  55. Malacarne, R.L. Canonical Correlation Analysis. Math. J. 2014. [Google Scholar] [CrossRef] [Green Version]
  56. The SPSSAU Project. SPSSAU (Version 20.0). 2020. Available online: https://www.spssau.com (accessed on 15 July 2020).
  57. Heilmeier, H. Functional traits explaining plant responses to past and future climate changes. Flora 2019, 254, 1–11. [Google Scholar] [CrossRef]
  58. Michelaki, C.; Fyllas, N.M.; Galanidis, A.; Aloupi, M.; Evangelou, E.; Arianoutsou, M.; Dimitrakopoulos, P.G. An integrated phenotypic trait-network in thermo-Mediterranean vegetation describing alternative, coexisting resource-use strategies. Sci. Total Environ. 2019, 672, 583–592. [Google Scholar] [CrossRef]
  59. Hetherington, A.M.; Woodward, F.I. The role of stomata in sensing and driving environmental change. Nature 2003, 424, 901–908. [Google Scholar] [CrossRef]
  60. Franks, P.J.; Farquhar, G.D. A relationship between humidity response, growth form and photosynthetic operating point in C-3 plants. Plant Cell Environ. 1999, 22, 1337–1349. [Google Scholar] [CrossRef]
  61. Deng, X.; Li, X.; Zhang, X.; Ye, W. A study of the gas exchange characteristics of four desert plants. Acta Phytoecol. Sin. 2002, 26, 605–612. (In Chinese) [Google Scholar]
  62. Buckley, T.N. The contributions of apoplastic, symplastic and gas phase pathways for water transport outside the bundle sheath in leaves. Plant Cell Environ. 2015, 38, 7–22. [Google Scholar] [CrossRef] [PubMed]
  63. Flexas, J.; Barbour, M.M.; Brendel, O.; Cabrera, H.M.; Carriqui, M.; Diaz-Espejo, A.; Douthe, C.; Dreyerc, E.; Ferrio, J.P.; Gago, J.; et al. Mesophyll diffusion conductance to CO2: An unappreciated central player in photosynthesis. Plant Sci. 2012, 193–194, 70–84. [Google Scholar] [CrossRef]
  64. Ren, T.; Weraduwage, S.M.; Sharkey, T.D. Prospects for enhancing leaf photosynthetic capacity by manipulating mesophyll cell morphology. J Exp. Bot. 2019, 70, 1153–1165. [Google Scholar] [CrossRef]
  65. Parkhurst, D.F. Adaptive significance of stomatal occurrence on one or both surfaces of leaves. J. Ecol. 1978, 66, 367–383. [Google Scholar] [CrossRef]
  66. Parkhurst, D.F.; Mott, K.A. Intercellular diffusion limits to CO2 uptake in leaves. Plant Physiol. 1990, 94, 1024–1032. [Google Scholar] [CrossRef] [Green Version]
  67. Richardson, F.; Brodribb, T.J.; Jordan, G.J. Amphistomatic leaf surfaces independently regulate gas exchange in response to variations in evaporative demand. Tree Physiol. 2017, 37, 869–878. [Google Scholar] [CrossRef] [Green Version]
  68. Mott, K.A. Leaf hydraulic conductivity and stomatal responses to humidity in amphistomatous leaves. Plant Cell Environ. 2007, 30, 1444–1449. [Google Scholar] [CrossRef]
  69. Mott, K.A.; Peak, D. Effects of the mesophyll on stomatal responses in amphistomatous leaves. Plant Cell Environ. 2018, 41, 2835–2843. [Google Scholar] [CrossRef]
  70. Mott, K.A.; O’Leary, J.W. Stomatal Behavior and CO2 Exchange Characteristics in Amphistomatous Leaves. Plant Physiol. 1984, 74, 47–51. [Google Scholar] [CrossRef] [Green Version]
  71. Jumrani, K.; Bhatia, V.S.; Pandey, G.P. Impact of elevated temperatures on specific leaf weight, stomatal density, photosynthesis and chlorophyll fluorescence in soybean. Photosynth. Res. 2017, 131, 333–350. [Google Scholar] [CrossRef]
  72. Serbin, S.P.; Wu, J.; Ely, K.S.; Kruger, E.L.; Townsend, P.A.; Meng, R.; Wolfe, B.T.; Chlus, A.; Wang, Z.H.; Rogers, A. From the Arctic to the tropics: Multibiome prediction of leaf mass per area using leaf reflectance. New Phytol. 2019, 224, 1557–1568. [Google Scholar] [CrossRef]
  73. Niinemets, U.; Diaz-Espejo, A.; Flexas, J.; Galmes, J.; Warren, C.R. Role of mesophyll diffusion conductance in constraining potential photosynthetic productivity in the field. J. Exp. Bot. 2009, 60, 2249–2270. [Google Scholar] [CrossRef] [PubMed] [Green Version]
  74. Lambers, H.; Poorter, H. Inherent variation in growth-rate between higher plants-a search for physiological cause and ecological consequences. Adv. Ecol. Res. 1992, 23, 187–261. [Google Scholar]
  75. Brodribb, T.J.; Feild, T.S.; Sack, L. Viewing leaf structure and evolution from a hydraulic perspective. Funct. Plant Biol. 2010, 37, 488–498. [Google Scholar] [CrossRef]
  76. Waite, M.; Sack, L. How does moss photosynthesis relate to leaf and canopy structure? Trait relationships for 10 Hawaiian species of contrasting light habitats. New Phytol. 2010, 185, 156–172. [Google Scholar] [CrossRef] [PubMed]
  77. Luo, Y.; Peng, Q.; Li, K.; Gong, Y.; Liu, Y.; Han, W. Patterns of nitrogen and phosphorus stoichiometry among leaf, stem and root of desert plants and responses to climate and soil factors in Xinjiang, China. Catena 2021, 199, 105100. [Google Scholar] [CrossRef]
  78. He, M.; Zhang, K.; Tan, H.; Hu, R.; Su, J.; Wang, J.; Huang, L.; Zhang, Y.; Li, X. Nutrient levels within leaves, stems, and roots of the xeric species Reaumuria soongorica in relation to geographical, climatic, and soil conditions. Ecol. Evol. 2015, 5, 1494–1503. [Google Scholar] [CrossRef]
  79. Laughlin, D.C. Applying trait-based models to achieve functional targets for theory-driven ecological restoration. Ecol. Lett. 2014, 17, 771–784. [Google Scholar] [CrossRef] [Green Version]
  80. Ferrarini, A.; Dai, J.H.; Bai, Y.; Alatalo, J.M. Redefining the climate niche of plant species: A novel approach for realistic predictions of species distribution under climate change. Sci. Total Environ. 2019, 671, 1086–1093. [Google Scholar] [CrossRef]
  81. Guo, Y.; Jiang, M.; Liu, Q.; Xie, Z.; Tang, Z. Climate and vegetation together control the vertical distribution of soil carbon, nitrogen and phosphorus in shrublands in China. Plant Soil. 2020, 456, 15–26. [Google Scholar] [CrossRef]
  82. Felle, H.H.; Hanstein, S.; Steinmeyer, R.; Hedrich, R. Dynamics of ionic activities in the apoplast of the sub-stomatal cavity of intact Viciafaba leaves during stomatal closure evoked by ABA and darkness. Plant J. 2000, 24, 297–304. [Google Scholar] [CrossRef]
  83. Nunes, T.D.G.; Zhang, D.; Raissig, M.T. Form, development and function of grass stomata. Plant J. 2020, 101, 780–799. [Google Scholar] [CrossRef]
  84. Poorter, H.; Niinemets, Ü.; Poorter, L.; Wright, I.J.; Villar, R. Causes and consequences of variation in leaf mass per area (LMA): A meta-analysis. New Phytol. 2009, 182, 565–588. [Google Scholar] [CrossRef] [PubMed]
  85. Khan, A.; Sun, J.; Zarif, N.; Khan, K.; Jamil, M.A.; Yang, L.; Clothier, B.; Rewald, B. Effects of Increased N Deposition on Leaf Functional Traits of Four Contrasting Tree Species in Northeast China. Plants 2020, 9, 1231. [Google Scholar] [CrossRef]
  86. Shields, L.M. Leaf xeromorphy as related to physiological and structural influences. Bot. Rev. 1950, 16, 399–447. [Google Scholar] [CrossRef]
  87. Longstreth, D.J.; Nobel, P.S. Salinity effects on leaf anatomy. Consequences for photosynthesis. Plant Physiol. 1979, 63, 700–703. [Google Scholar] [CrossRef] [PubMed] [Green Version]
  88. Kozlowski, T.T. Responses of woody plants to flooding and salinity. Tree Physiol. 1997, 1, 1–29. [Google Scholar] [CrossRef]
  89. Keiser, A.D.; Smith, M.; Bell, S.; Hofmockel, K.S. Peatland microbial community response to altered climate tempered by nutrient availability. Soil Boil Biochem. 2019, 137, 107561. [Google Scholar] [CrossRef]
  90. Zhang, S.; Zhang, Y.; Xiong, K.; Yu, Y.; Min, X. Changes of leaf functional traits in karst rocky desertification ecological environment and the driving factors. Glob. Ecol. Conserv. 2020, 24, e01381. [Google Scholar] [CrossRef]
  91. Kamaluddin, M.; Zwiazek, J.J. Effects of root medium pH on water transport in paper birch (Betula papyrifera) seedlings in relation to root temperature and abscisic acid treatments. Tree Physiol. 2004, 24, 1173–1180. [Google Scholar] [CrossRef] [Green Version]
  92. Siemens, J.A.; Zwiazek, J.J. Hebeloma crustuliniforme modifies root hydraulic responses of trembling aspen (Populus tremuloides) seedlings to changes in external pH. Plant Soil. 2011, 345, 247–256. [Google Scholar] [CrossRef]
  93. Seligmana, N.G.; Sinclair, T.R. Global environment change and simulated forage quality of wheat II. Water and nitrogen stress. Field Crop Res. 1995, 40, 29–37. [Google Scholar] [CrossRef]
  94. Wright, I.J.; Reich, P.B.; Westoby, M. Strategy shifts in leaf physiology, structure and nutrient content between species of high- and low-rainfall and high- and low-nutrient habitats. Funct. Ecol. 2001, 15, 423–434. [Google Scholar] [CrossRef] [Green Version]
Figure 1. Geographic location of the sampling sites and growing conditions of Alhagi sparsifolia. (A,B) Photographs of A. sparsifolia populations showing the typical growth conditions at two sampling sites, S9 and S13. (C) The leaves of A. sparsifolia. (D) The geographic location of sampling sites, marked as S1–S14. (E) The leaf photos are arranged left to right by sampling site, from S1 through S14.
Plants 10 01867 g001
Figure 2. The relationship between economic and hydraulic traits. (A,B) Principal component analysis (PCA) showing the leaf economics traits (red lines) and leaf hydraulic traits (blue lines) coupled along the different axis. The parenthesized numbers on each axis are the percentage of total variation explained by that given axis component. (C) Canonical correlation analysis to test the coupling relationship between the groups of economic and hydraulic traits. The numbers beside each trait show the correlation coefficient of each trait to canonical variance. Eco1 and Eco2 are the first two canonical variances in the economic traits group, whereas Hy1 and Hy2 are the first two canonical variances in the hydraulic traits group. The numbers between Eco1 and Hy1, Eco2 and Hy2 are their correlation coefficient. * marked as p < 0.05, ** marked as p < 0.01. (D) Relationship between pairwise plant functional traits. * marked as p < 0.05. The abbreviations of leaf economic and hydraulic traits are shown in Table 1.
Plants 10 01867 g002
Figure 3. Relationship of log10 MAP with functional traits. Linear correlations are indicated as blue lines (having a p-value < 0.05). Shaded bands around each line represent the 95% confidence interval for the linear regression. MAP: mean annual precipitation. The abbreviations of leaf economic and hydraulic traits are shown in Table 1.
Plants 10 01867 g003
Figure 4. Relationship of log10 SWC with leaf functional traits. Linear correlations are indicated as blue lines (having a p-value <0.05). Shaded bands around each line represent the 95% confidence interval for the linear regression, SWC: soil water content. The abbreviations of leaf economic and hydraulic traits are shown in Table 1.
Plants 10 01867 g004
Figure 5. Antomical structure of A. sparsifolia and the relationship of PT/ST with MAP and SWC. (A) the transverse leaf sections of A. sparsifolia. (B) the relationships between PT/ST and MAP. (C) the relationships between PT/ST and SWC. Linear correlations are indicated as blue lines (having a p-value < 0.05). Shaded bands around each line represent the 95% confidence interval for the linear regression. PT, thickness of palisade parenchyma; ST, thickness of spongy parenchyma; PT/ST, ratio of thickness of palisade parenchyma to spongy parenchyma; MAP, mean annual precipitation; SWC, soil water content.
Plants 10 01867 g005
Figure 6. Relative contributions of environmental variables on each leaf functional trait. The numbers in brackets indicate the contribution of all environmental variables to this trait. MAP, mean annual precipitation; MAT, mean annual temperature; pH, soil pH value; SAN, soil alkali-hydrolyzable nitrogen; SAP, soil available phosphorus; SOC, soil organic carbon, SS, soil total salt content; SWC, soil water content. The abbreviations of leaf economic and hydraulic traits are shown in Table 1.
Plants 10 01867 g006
Figure 7. Network diagram of the correlations among leaf hydraulic and economic traits of A. sparsifolia. Red lines and black dotted lines indicate positive and negative correlations, respectively. The abbreviations of leaf economic and hydraulic traits are shown in Table 1.
Plants 10 01867 g007
Table 1. Values and abbreviations of the economic and hydraulic traits of Alhagi sparsifolia.
Traits NameAbbreUnitMean ± SECV (%)
Economic traitsLeaf dry mass per areaLMAg m−2116.4 ± 3.117.16
Leaf thicknessLTmm0.39 ± 0.0119.35
Leaf tissue densityTDg cm−30.31 ± 0.0123.83
Leaf nitrogen concentration per massNmassmg g−114.60 ± 0.5223.13
Leaf nitrogen concentration per areaNareag m−21.67 ± 0.0520.23
Hydraulic traitsVein densityVDmm mm−211.49 ± 0.2212.46
Maximum stomatal conductance to water vaporgwmaxmol m−2 s−10.92 ± 0.0320.37
Stomatal length on the adaxial surface of the leafSLadaμm16.46 ± 0.3011.97
Stomatal length on the abaxial surface of the leafSLabaμm16.08 ± 0.2510.12
Stomatal density on the adaxial surface of the leafSDadamm−1248.4 ± 10.8628.34
Stomatal density on the abaxial surface of the leafSDabamm−1300.2 ± 9.3020.05
Notes: Abbre, abbreviations; SE, standard error; CV, coefficient of variation, this calculated as standard deviation/mean.
Table 2. Pearson correlation coefficients of mesophyll structure with leaf economic and hydraulic traits.
LMALTTDNmassNareaVDgwmaxSLadaSLabaSDadaSDaba
UPT0.370.86−0.51−0.280.03−0.05−0.470.510.24−0.12−0.60
LPT0.310.70−0.40−0.55−0.300.07−0.370.13−0.18−0.03−0.27
PT0.390.76−0.42−0.47−0.140.09−0.380.21−0.07-0.05−0.34
ST0.230.63−0.40−0.21−0.01−0.24−0.510.240.17−0.36−0.61
PT/ST0.06−0.070.09−0.13−0.090.310.24−0.09−0.220.330.36
Notes: Significant correlations are indicated in bold. UPT, thickness of palisade parenchyma in the upper layer; LPT, thickness of palisade parenchyma in the lower layer; PT, thickness of palisade parenchyma; ST, thickness of spongy parenchyma; PT/ST, ratio of thickness of palisade parenchyma to spongy parenchyma. The abbreviations of leaf economic and hydraulic traits are shown in Table 1.
Publisher’s Note: MDPI stays neutral with regard to jurisdictional claims in published maps and institutional affiliations.

