
High-Temperature and Drought Stress Effects on Growth, Yield and Nutritional Quality with Transpiration Response to Vapor Pressure Deficit in Lentil


 , , ,
, , , 
 and
and
Abstract
:
1. Introduction
2. Results
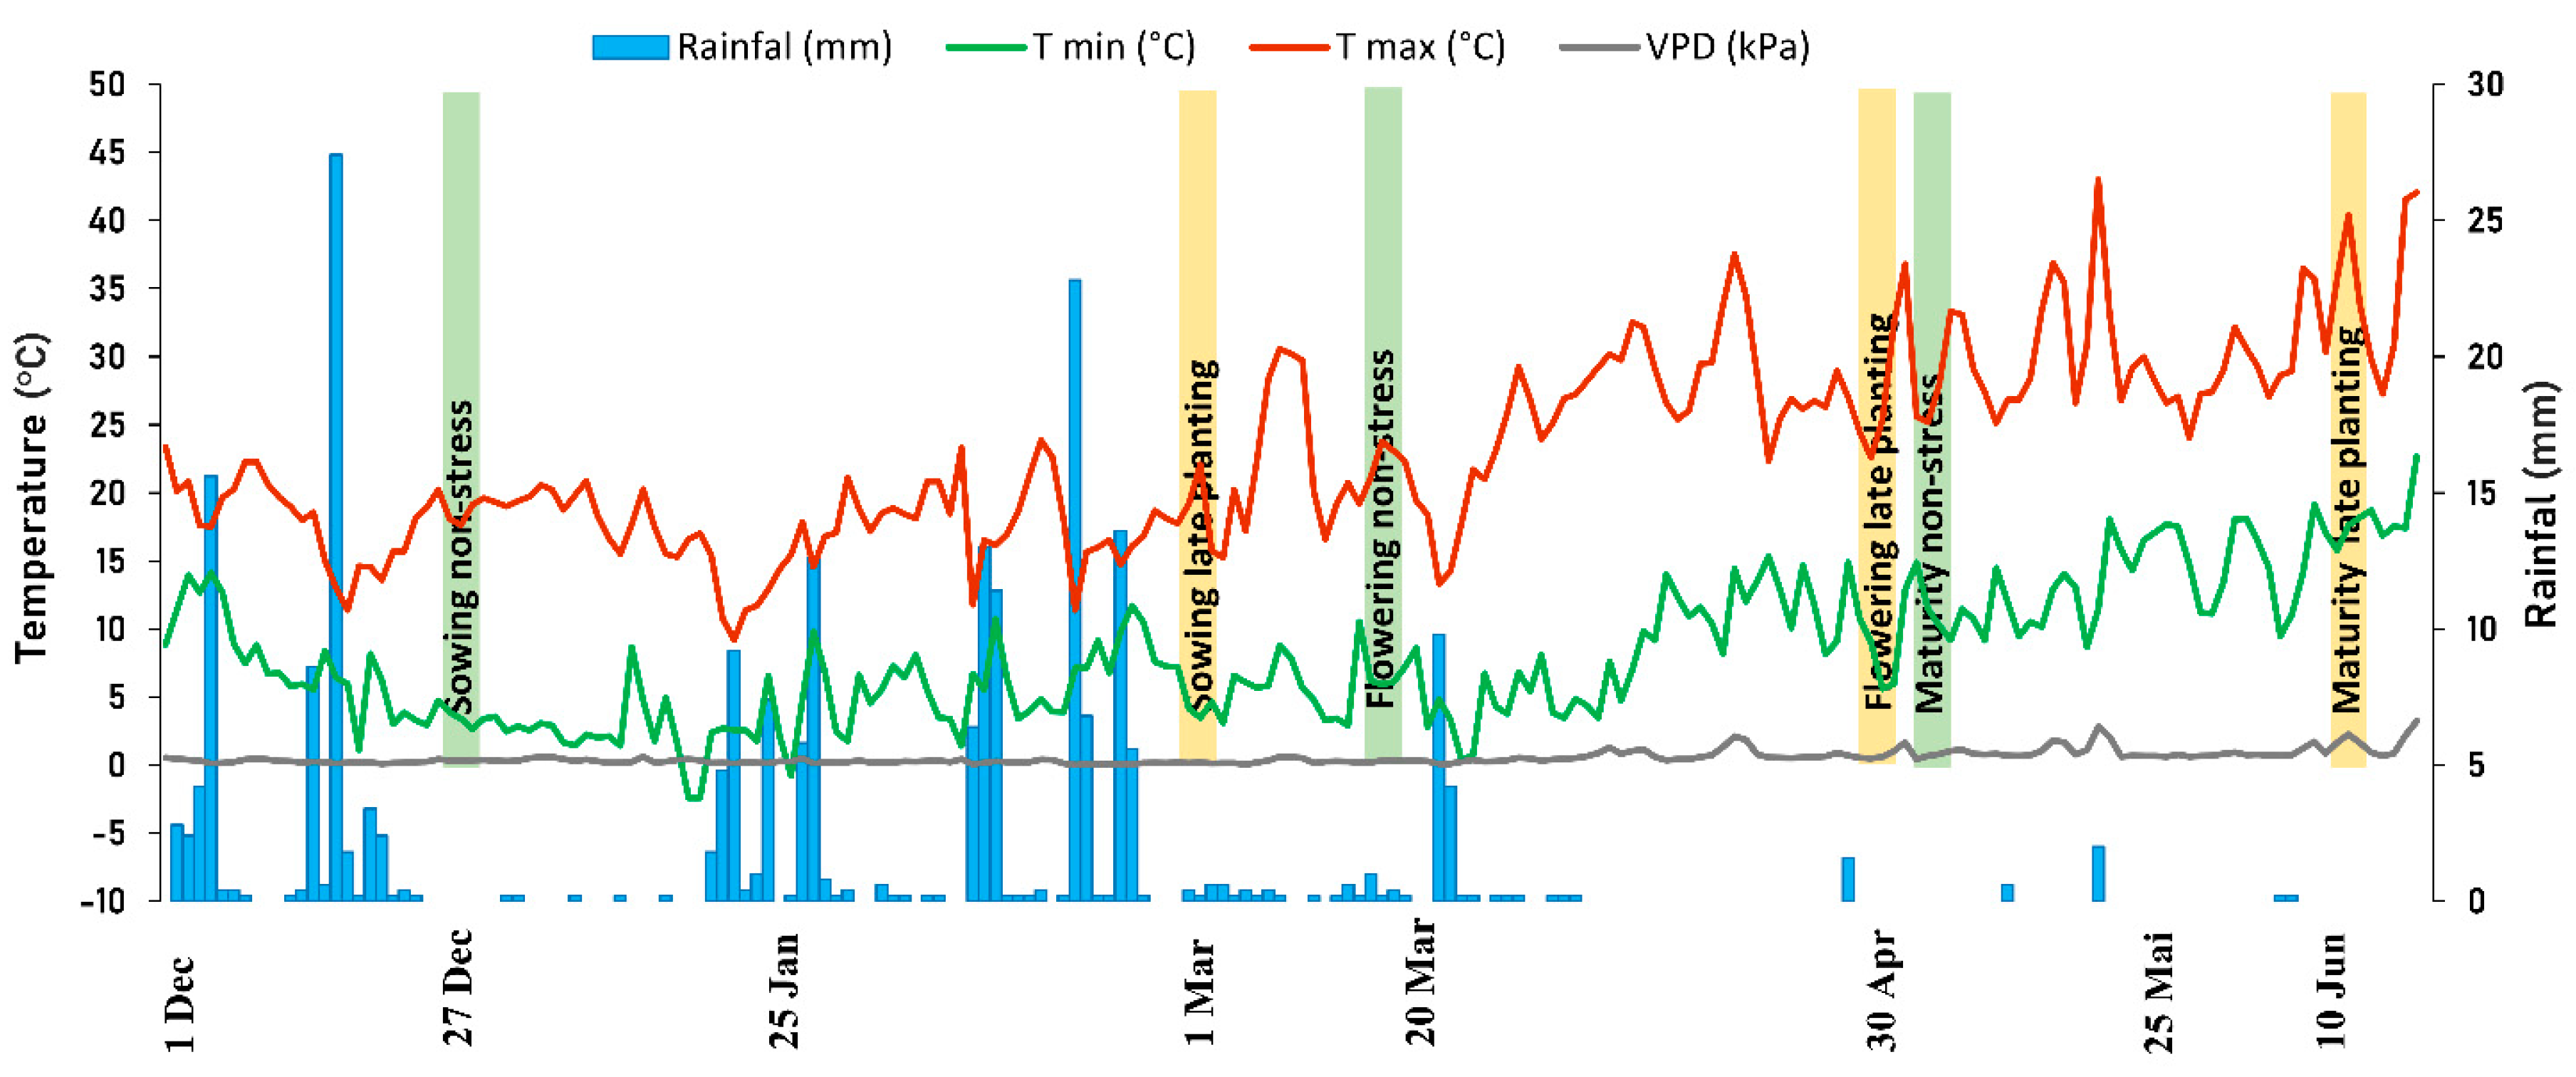
2.1. Weather Data
2.2. Combined Analysis of Variance
2.3. Temperature and Combined Heat-Drought Impact on Plant Phenology
2.4. Influence of High-Temperature and Combined Temperature-Drought Stress on Fe, Zn and Protein Contents
2.5. Correlation Coefficient between Measured Traits
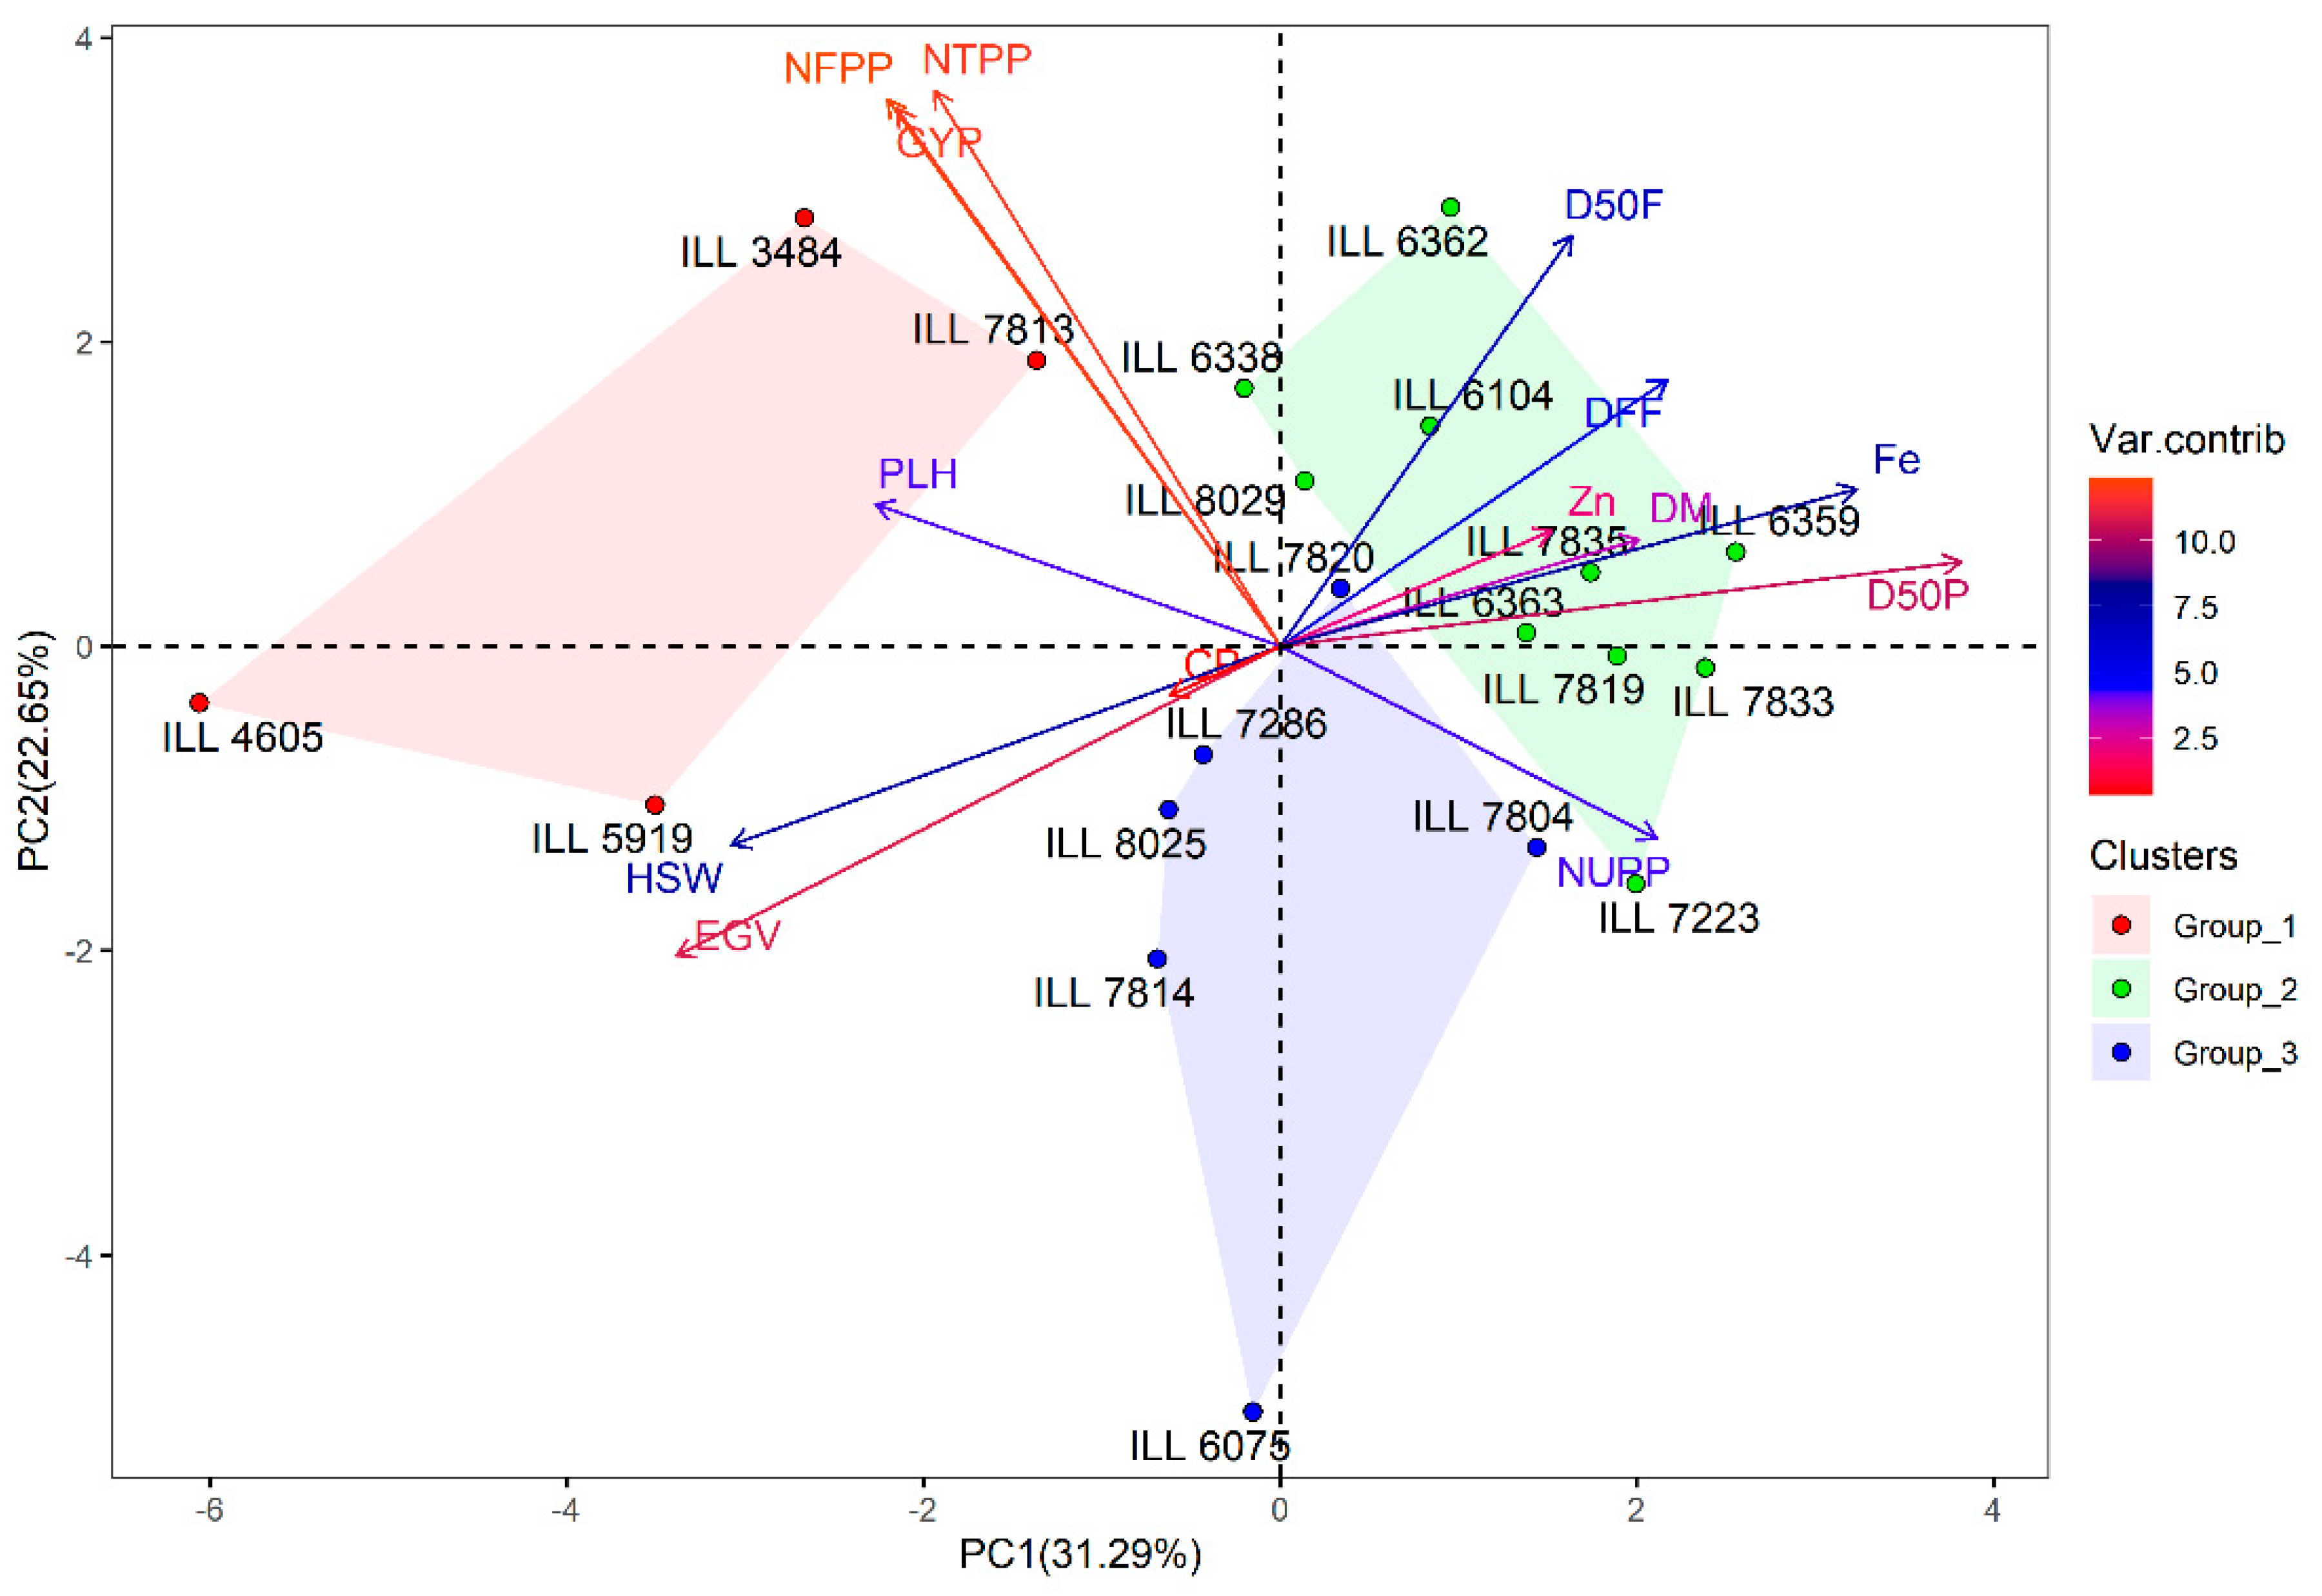
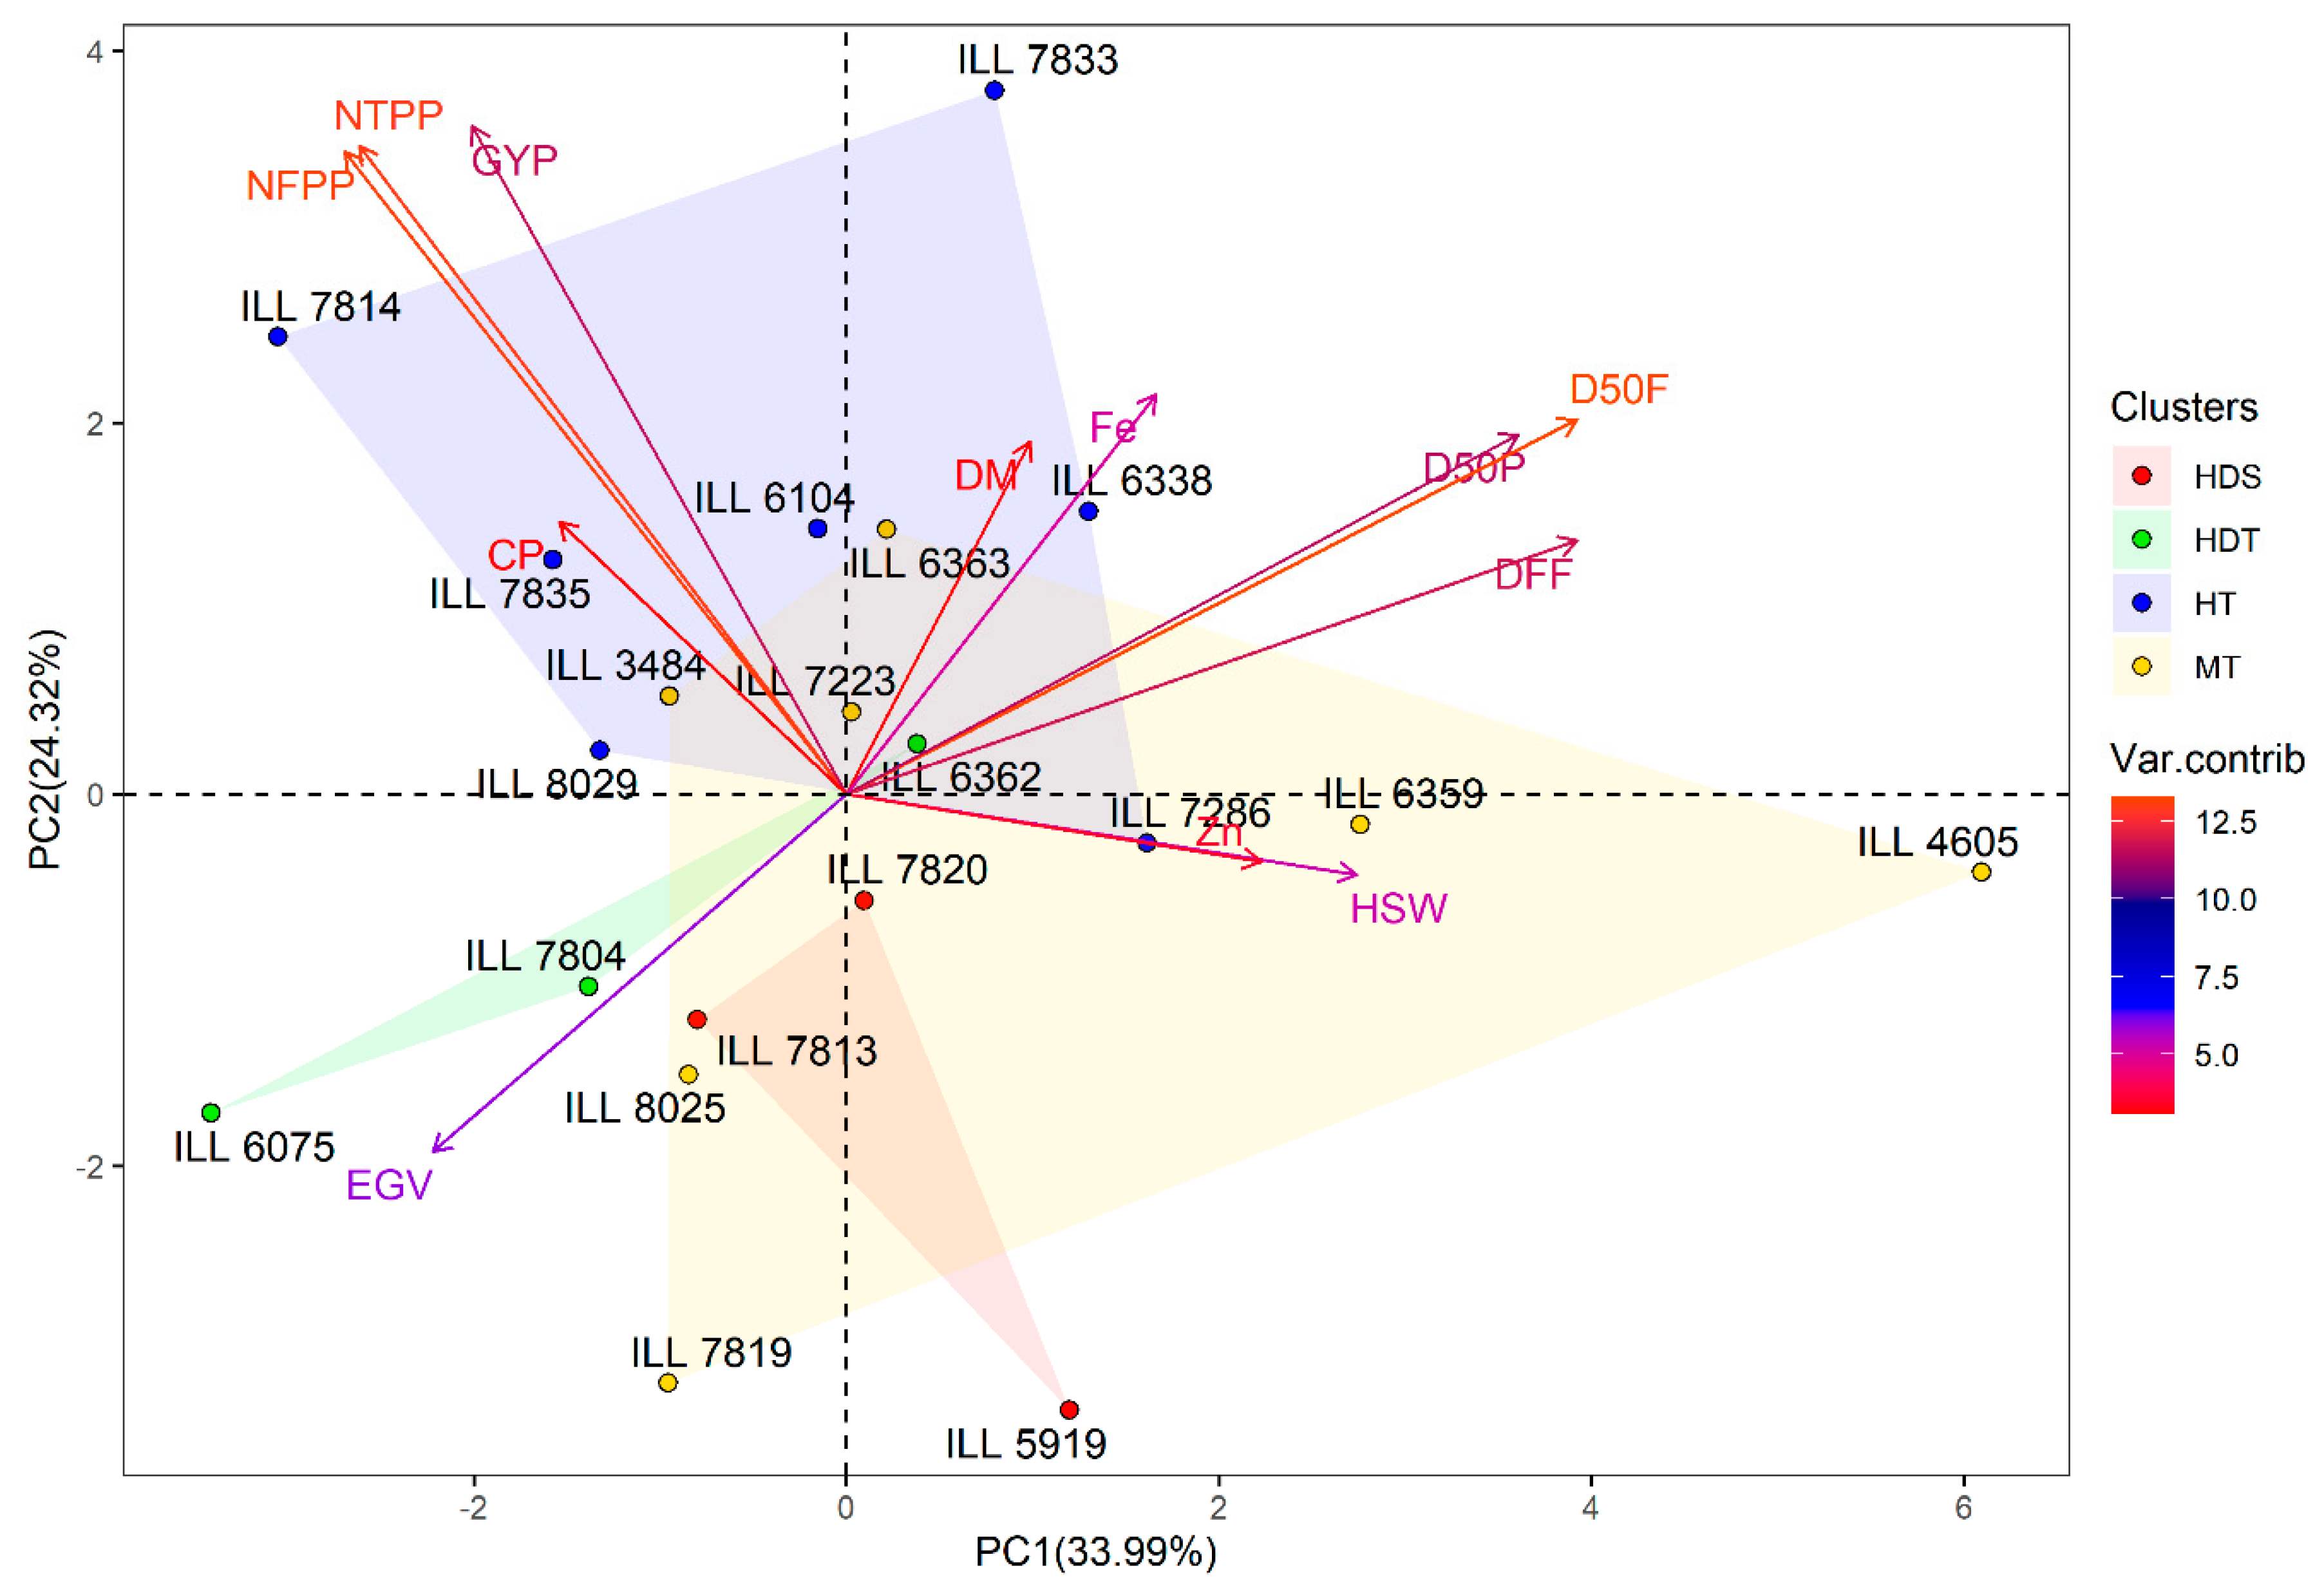
2.6. Principal Component Analysis for Stress and Normal Conditions
2.7. Canopy Temperature Variation under Normal and Stress Conditions
2.8. Transpiration Response to VPD under Controlled Environments
3. Discussion
3.1. Phenology, Yield and Nutritional Quality under High-Temperature and Drought Stress
3.2. Transpiration Response to High VPD under Controlled Conditions
4. Materials and Methods
4.1. Plant Material
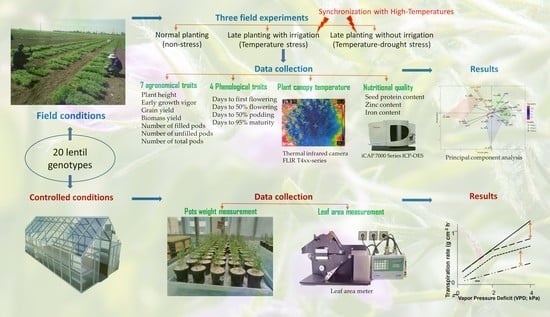
4.2. Field Experiment
4.3. Data Collection
4.4. Crude Protein Content
4.5. Iron and Zinc Determination
4.6. Plant Growth Conditions in the Greenhouse
4.7. Statistical Analysis
4.7.1. Field Data Analysis
4.7.2. Vapor Pressure Deficit Analysis
5. Conclusions
Supplementary Materials
Author Contributions
Funding
Institutional Review Board Statement
Informed Consent Statement
Data Availability Statement
Acknowledgments
Conflicts of Interest
References
- Sarker, A.; Kumar, S. Lentils in production and food systems in West Asia and Africa. Grain Legum. 2011, 57, 56–58. [Google Scholar]
- Erskine, W.; Sarker, A.; Kumar, S. Crops that feed the world Investing in lentil improvement toward a food secure world 3. Food Secur. 2011, 3, 127–139. [Google Scholar] [CrossRef]
- Kumar, S.; Rajendran, K.; Kumar, J.; Hamwieh, A.; Baum, M. Current knowledge in lentil genomics and its application for crop improvement. Front. Plant Sci. 2015, 6, 78. [Google Scholar] [CrossRef] [Green Version]
- Reda, A. Lentil (Lens Culinaris Medikus) Current Status and Future Prospect of Production in Ethiopia. Adv. Plants Agric. Res. 2015, 2, 00040. [Google Scholar] [CrossRef] [Green Version]
- Bouis, H.; Low, J.; McEwan, M.; Tanumihardjo, S. Biofortification: Evidence and Lessons Learned Linking Agriculture and Nutrition; FAO: Rome, Italy; WHO: Geneva, Switzerland, 2013. [Google Scholar]
- Jha, A.B.; Warkentin, T.D. Biofortification of Pulse Crops: Status and Future Perspectives. Plants 2020, 9, 73. [Google Scholar] [CrossRef] [Green Version]
- Cakmak, I.; Pfeiffer, W.H.; McClafferty, B. REVIEW: Biofortification of Durum Wheat with Zinc and Iron. Cereal Chem. J. 2010, 87, 10–20. [Google Scholar] [CrossRef] [Green Version]
- Depar, N.; Rajpar, I.; Memon, M.Y.; Imtiaz, M. Mineral nutrient densities in some domestic and exotic rice genotypes. Pak. J. Agric. Agric. Eng. Vet. Sci. 2011, 27, 134–142. [Google Scholar]
- Kumar, J.; Gupta, D.S.; Kumar, S.; Gupta, S.; Singh, N.P. Current Knowledge on Genetic Biofortification in Lentil. J. Agric. Food Chem. 2016, 64, 6383–6396. [Google Scholar] [CrossRef] [PubMed]
- Rehman, A.; Farooq, M.; Ozturk, L.; Asif, M.; Siddique, K.H.M. Zinc nutrition in wheat-based cropping systems. Plant Soil 2017, 422, 283–315. [Google Scholar] [CrossRef]
- Rehman, A.; Farooq, M.; Ullah, A.; Nadeem, F.; Im, S.Y.; Park, S.K.; Lee, D.-J. Agronomic Biofortification of Zinc in Pakistan: Status, Benefits, and Constraints. Front. Sustain. Food Syst. 2020, 4, 591722. [Google Scholar] [CrossRef]
- Saltzman, A.; Birol, E.; Bouis, H.; Boy, E.; De Moura, F.F.; Islam, Y.; Pfeiffer, W.H. Biofortification: Progress toward a more nourishing future. Glob. Food Secur. 2013, 2, 9–17. [Google Scholar] [CrossRef]
- Bouis, H.E.; Saltzman, A. Improving nutrition through biofortification: A review of evidence from HarvestPlus, 2003 through 2016. Glob. Food Secur. 2017, 12, 49–58. [Google Scholar] [CrossRef] [PubMed]
- Choukri, H.; Hejjaoui, K.; El-Baouchi, A.; El Haddad, N.; Smouni, A.; Maalouf, F.; Thavarajah, D.; Kumar, S. Heat and Drought Stress Impact on Phenology, Grain Yield, and Nutritional Quality of Lentil (Lens culinaris Medikus). Front. Nutr. 2020, 7, 596307. [Google Scholar] [CrossRef] [PubMed]
- Ullah, A.; Al-Sadi, A.; Al-Subhi, A.M.; Farooq, M. Characterization of chickpea genotypes of Pakistani origin for genetic diversity and zinc grain biofortification. J. Sci. Food Agric. 2020, 100, 4139–4149. [Google Scholar] [CrossRef]
- Singh, D.; Rajawat, M.V.S.; Kaushik, R.; Prasanna, R.; Saxena, A.K. Beneficial role of endophytes in biofortification of Zn in wheat genotypes varying in nutrient use efficiency grown in soils sufficient and deficient in Zn. Plant Soil 2017, 416, 107–116. [Google Scholar] [CrossRef]
- Shah, F.-U.; Sharif, M.K.; Bashir, S.; Ahsan, F. Role of healthy extruded snacks to mitigate malnutrition. Food Rev. Int. 2018, 35, 299–323. [Google Scholar] [CrossRef]
- Steiner, G.; Geissler, B.; Schernhammer, E.S. Hunger and Obesity as Symptoms of Non-Sustainable Food Systems and Malnutrition. Appl. Sci. 2019, 9, 1062. [Google Scholar] [CrossRef] [Green Version]
- Johnson, N.; Johnson, C.R.; Thavarajah, P.; Kumar, S.; Thavarajah, D. The roles and potential of lentil prebiotic carbohydrates in human and plant health. Plants People Planet 2020, 2, 310–319. [Google Scholar] [CrossRef] [Green Version]
- El Haddad, N.; Sanchez-Garcia, M.; Visioni, A.; Jilal, A.; El Amil, R.; Sall, A.T.; Lagesse, W.; Kumar, S.; Bassi, F.M. Crop Wild Relatives Crosses: Multi-Location Assessment in Durum Wheat, Barley, and Lentil. Agronomy 2021, 11, 2283. [Google Scholar] [CrossRef]
- Awasthi, R.; Gaur, P.; Turner, N.; Vadez, V.; Siddique, K.; Nayyar, H. Effects of individual and combined heat and drought stress during seed filling on the oxidative metabolism and yield of chickpea (Cicer arietinum) genotypes differing in heat and drought tolerance. Crop. Pasture Sci. 2017, 68, 823–841. [Google Scholar] [CrossRef]
- Sultana, R.; Choudhary, A.K.; Pal, A.K.; Saxena, K.B.; Prasad, B.D.; Singh, R. Abiotic Stresses in Major Pulses: Current Status and Strategies. In Approaches to Plant Stress and their Management; Springer: New Delhi, India, 2014; pp. 173–190. [Google Scholar] [CrossRef]
- Maqbool, A.; Abrar, M.; Bakhsh, A.; Çalışkan, S.; Khan, H.Z.; Aslam, M.; Aksoy, E. Biofortification Under Climate Change: The Fight Between Quality and Quantity. In Environment, Climate, Plant and Vegetation Growth; Springer: Cham, Switzerland, 2020; pp. 173–227. [Google Scholar] [CrossRef]
- Johansson, E.; Branlard, G.; Cuniberti, M.; Flagella, Z.; Hüsken, A.; Nurit, E.; Peña, R.J.; Sissons, M.; Vazquez, D. Genotypic and Environmental Effects on Wheat Technological and Nutritional Quality. In Wheat Quality for Improving Processing and Human Health; Igrejas, G., Ikeda, T.M., Guzmán, C., Eds.; Springer International Publishing: Cham, Germeny, 2020; pp. 171–204. ISBN 978-3-030-34163-3. [Google Scholar] [CrossRef]
- Sehgal, A.; Sita, K.; Kumar, J.; Kumar, S.; Singh, S.; Siddique, K.H.M.; Nayyar, H. Effects of Drought, Heat and Their Interaction on the Growth, Yield and Photosynthetic Function of Lentil (Lens culinaris Medikus) Genotypes Varying in Heat and Drought Sensitivity. Front. Plant Sci. 2017, 8, 1776. [Google Scholar] [CrossRef] [Green Version]
- Kumari, V.; Roy, A.; Vijayan, R.; Banerjee, P.; Verma, V.; Nalia, A.; Pramanik, M.; Mukherjee, B.; Ghosh, A.; Reja, H.; et al. Drought and Heat Stress in Cool-Season Food Legumes in Sub-Tropical Regions: Consequences, Adaptation, and Mitigation Strategies. Plants 2021, 10, 1038. [Google Scholar] [CrossRef]
- Sita, K.; Sehgal, A.; Kumar, J.; Kumar, S.; Singh, S.; Siddique, K.; Nayyar, H. Identification of High-Temperature Tolerant Lentil (Lens culinaris Medik.) Genotypes through Leaf and Pollen Traits. Front. Plant Sci. 2017, 8, 744. [Google Scholar] [CrossRef] [Green Version]
- Zahra, N.; Wahid, A.; Hafeez, M.B.; Ullah, A.; Siddique, K.H.; Farooq, M. Grain development in wheat under combined heat and drought stress: Plant responses and management. Environ. Exp. Bot. 2021, 188, 104517. [Google Scholar] [CrossRef]
- Fábián, A.; Sáfrán, E.; Szabó-Eitel, G.; Barnabás, B.; Jäger, K. Stigma Functionality and Fertility Are Reduced by Heat and Drought Co-stress in Wheat. Front. Plant Sci. 2019, 10, 244. [Google Scholar] [CrossRef]
- Raza, A.; Razzaq, A.; Mehmood, S.S.; Zou, X.; Zhang, X.; Lv, Y.; Xu, J. Impact of Climate Change on Crops Adaptation and Strategies to Tackle Its Outcome: A Review. Plants 2019, 8, 34. [Google Scholar] [CrossRef] [Green Version]
- Sita, K.; Sehgal, A.; Bhandari, K.; Kumar, J.; Kumar, S.; Singh, S.; Siddique, K.; Nayyar, H. Impact of heat stress during seed filling on seed quality and seed yield in lentil (Lens culinaris Medikus) genotypes. J. Sci. Food Agric. 2018, 98, 5134–5141. [Google Scholar] [CrossRef] [PubMed]
- Bhandari, K.; Siddique, K.; Turner, N.; Kaur, J.; Singh, S.; Agrawal, S.K.; Nayyar, H. Heat Stress at Reproductive Stage Disrupts Leaf Carbohydrate Metabolism, Impairs Reproductive Function, and Severely Reduces Seed Yield in Lentil. J. Crop. Improv. 2016, 30, 118–151. [Google Scholar] [CrossRef]
- Ahmed, B.; Mitu, A.; Sultana, M.; Tasnim, N.; Talukder, A. Yield and Physiological Indices of Lentil Genotypes against Drought Stress. Bangladesh Agron. J. 2021, 23, 97–102. [Google Scholar] [CrossRef]
- Salehi, M.; Haghnazari, A.; Shekari, F.; Faramarzi, A. The Study of Seed Yield and Seed Yield Components of Lentil (Lens culinaris Medik) under Normal and Drought Stress Conditions. Pak. J. Biol. Sci. 2008, 11, 758–762. [Google Scholar] [CrossRef] [PubMed]
- El Haddad, N.; Rajendran, K.; Smouni, A.; Es-Safi, N.E.; Benbrahim, N.; Mentag, R.; Nayyar, H.; Maalouf, F.; Kumar, S. Screening the FIGS Set of Lentil (Lens culinaris Medikus) Germplasm for Tolerance to Terminal Heat and Combined Drought-Heat Stress. Agronomy 2020, 10, 1036. [Google Scholar] [CrossRef]
- Sehgal, A.; Sita, K.; Bhandari, K.; Kumar, S.; Kumar, J.; Prasad, P.V.; Siddique, K.; Nayyar, H. Influence of drought and heat stress, applied independently or in combination during seed development, on qualitative and quantitative aspects of seeds of lentil (Lens culinaris Medikus) genotypes, differing in drought sensitivity. Plant Cell Environ. 2018, 42, 198–211. [Google Scholar] [CrossRef] [Green Version]
- Ghanem, M.E.; Kibbou, F.E.-Z.; Guiguitant, J.; Sinclair, T.R. Opportunities to improve the seasonal dynamics of water use in lentil (Lens culinaris Medik.) to enhance yield increase in water-limited environments. Chem. Biol. Technol. Agric. 2017, 4. [Google Scholar] [CrossRef]
- Devi, M.J.; Reddy, V.R. Transpiration Response of Cotton to Vapor Pressure Deficit and Its Relationship With Stomatal Traits. Front. Plant Sci. 2018, 9, 1572. [Google Scholar] [CrossRef] [Green Version]
- Grossiord, C.; Buckley, T.N.; Cernusak, L.A.; Novick, K.A.; Poulter, B.; Siegwolf, R.T.W.; Sperry, J.S.; McDowell, N.G. Plant responses to rising vapor pressure deficit. New Phytol. 2020, 226, 1550–1566. [Google Scholar] [CrossRef] [Green Version]
- Kulkarni, M.; Soolanayakanahally, R.; Ogawa, S.; Uga, Y.; Selvaraj, M.G.; Kagale, S. Drought Response in Wheat: Key Genes and Regulatory Mechanisms Controlling Root System Architecture and Transpiration Efficiency. Front. Chem. 2017, 5, 106. [Google Scholar] [CrossRef] [PubMed] [Green Version]
- Li, Y.; Li, H.; Li, Y.; Zhang, S. Improving water-use efficiency by decreasing stomatal conductance and transpiration rate to maintain higher ear photosynthetic rate in drought-resistant wheat. Crop. J. 2017, 5, 231–239. [Google Scholar] [CrossRef]
- Sinclair, T.R.; Devi, J.; Shekoofa, A.; Choudhary, S.; Sadok, W.; Vadez, V.; Riar, M.; Rufty, T. Limited-transpiration response to high vapor pressure deficit in crop species. Plant Sci. 2017, 260, 109–118. [Google Scholar] [CrossRef]
- Ghanem, M.E.; Sinclair, T.R. Limited-transpiration rate under high atmospheric vapour pressure deficit: A trait for developing genotypes for water-deficit conditions. CAB Rev. 2019, 14, 1–11. [Google Scholar] [CrossRef]
- Medina, S.; Vicente, R.; Nieto-Taladriz, M.T.; Aparicio, N.; Chairi, F.; Diaz, O.V.; Araus, J.L. The Plant-Transpiration Response to Vapor Pressure Deficit (VPD) in Durum Wheat Is Associated With Differential Yield Performance and Specific Expression of Genes Involved in Primary Metabolism and Water Transport. Front. Plant Sci. 2019, 9, 1994. [Google Scholar] [CrossRef] [PubMed] [Green Version]
- Shekoofa, A.; Sinclair, T.R.; Messina, C.D.; Cooper, M. Variation among Maize Hybrids in Response to High Vapor Pressure Deficit at High Temperatures. Crop. Sci. 2016, 56, 392–396. [Google Scholar] [CrossRef]
- Shrestha, R.K.; Lei, P.; Shi, D.; Hashimi, M.H.; Wang, S.; Xie, D.; Ni, J.; Ni, C. Response of maize (Zea mays L.) towards vapor pressure deficit. Environ. Exp. Bot. 2020, 181, 104293. [Google Scholar] [CrossRef]
- Karthika, G.; Kholova, J.; Alimagham, S.; Ganesan, M.; Chadalavada, K.; Kumari, R.; Vadez, V. Measurement of transpiration restriction under high vapor pressure deficit for sorghum mapping population parents. Plant Physiol. Rep. 2019, 24, 74–85. [Google Scholar] [CrossRef] [Green Version]
- Gholipoor, M.; Sinclair, T.R.; Prasad, P.V.V. Genotypic variation within sorghum for transpiration response to drying soil. Plant Soil 2012, 357, 35–40. [Google Scholar] [CrossRef]
- Gilbert, M.; Holbrook, N.; Zwieniecki, M.; Sadok, W.; Sinclair, T. Field confirmation of genetic variation in soybean transpiration response to vapor pressure deficit and photosynthetic compensation. Field Crop. Res. 2011, 124, 85–92. [Google Scholar] [CrossRef]
- Sadok, W.; Sinclair, T.R. Genetic variability of transpiration response to vapor pressure deficit among soybean (Glycine max [L.] Merr.) genotypes selected from a recombinant inbred line population. Field Crop. Res. 2009, 113, 156–160. [Google Scholar] [CrossRef]
- Shekoofa, A.; Rosas-Anderson, P.; Sinclair, T.R.; Balota, M.; Isleib, T.G. Measurement of Limited-Transpiration Trait under High Vapor Pressure Deficit for Peanut in Chambers and in Field. Agron. J. 2015, 107, 1019–1024. [Google Scholar] [CrossRef]
- Pradhan, D.; Shekoofa, A.; Sinclair, T.R. Temperature effect on peanut (Arachis hypogaea L.) transpiration response to vapor pressure deficit and its recovery. J. Crop. Improv. 2018, 33, 177–186. [Google Scholar] [CrossRef]
- Manandhar, A.; Sinclair, T.R.; Rufty, T.W.; Ghanem, M.E. Leaf Expansion and Transpiration Response to Soil Drying and Recovery among Cowpea Genotypes. Crop. Sci. 2017, 57, 2109–2116. [Google Scholar] [CrossRef]
- Belko, N.; Diop, N.; Cisse, N.; Ehlers, J.; Vadez, V.; Zaman-Allah, M.; Zombré, G. Restriction of transpiration rate under high vapour pressure deficit and non-limiting water conditions is important for terminal drought tolerance in cowpea. Plant Biol. 2012, 15, 304–316. [Google Scholar] [CrossRef]
- Sivasakthi, K.; Tharanya, M.; Kholová, J.; Muriuki, R.W.; Thirunalasundari, T.; Vadez, V. Chickpea Genotypes Contrasting for Vigor and Canopy Conductance Also Differ in Their Dependence on Different Water Transport Pathways. Front. Plant Sci. 2017, 8, 1663. [Google Scholar] [CrossRef] [Green Version]
- Zaman-Allah, M.; Jenkinson, D.M.; Vadez, V. Chickpea genotypes contrasting for seed yield under terminal drought stress in the field differ for traits related to the control of water use. Funct. Plant Biol. 2011, 38, 270–281. [Google Scholar] [CrossRef] [Green Version]
- Guiguitant, J.; Marrou, H.; Vadez, V.; Gupta, P.; Kumar, S.; Soltani, A.; Sinclair, T.R.; Ghanem, M.E. Relevance of limited-transpiration trait for lentil (Lens culinaris Medik.) in South Asia. Field Crop. Res. 2017, 209, 96–107. [Google Scholar] [CrossRef]
- Drake, P.L.; Froend, R.H.; Franks, P.J. Smaller, faster stomata: Scaling of stomatal size, rate of response, and stomatal conductance. J. Exp. Bot. 2013, 64, 495–505. [Google Scholar] [CrossRef] [PubMed] [Green Version]
- Ghanem, M.E.; Marrou, H.; Soltani, A.; Kumar, S.; Sinclair, T.R. Lentil Variation in Phenology and Yield Evaluated with a Model. Agron. J. 2015, 107, 1967–1977. [Google Scholar] [CrossRef]
- Messina, C.D.; Sinclair, T.R.; Hammer, G.L.; Curan, D.; Thompson, J.; Oler, Z.; Gho, C.; Cooper, M. Limited-Transpiration Trait May Increase Maize Drought Tolerance in the US Corn Belt. Agron. J. 2015, 107, 1978–1986. [Google Scholar] [CrossRef] [Green Version]
- Devasirvatham, V.; Tan, D.K.Y. Impact of High Temperature and Drought Stresses on Chickpea Production. Agronomy 2018, 8, 145. [Google Scholar] [CrossRef] [Green Version]
- Jumrani, K.; Bhatia, V.S. Impact of combined stress of high temperature and water deficit on growth and seed yield of soybean. Physiol. Mol. Biol. Plants 2017, 24, 37–50. [Google Scholar] [CrossRef]
- Hamidou, F.; Halilou, O.; Vadez, V. Assessment of Groundnut under Combined Heat and Drought Stress. J. Agron. Crop. Sci. 2012, 199, 1–11. [Google Scholar] [CrossRef] [Green Version]
- Mahrookashani, A.; Siebert, S.; Hüging, H.; Ewert, F. Independent and combined effects of high temperature and drought stress around anthesis on wheat. J. Agron. Crop. Sci. 2017, 203, 453–463. [Google Scholar] [CrossRef]
- Ruan, Y.-L.; Jin, Y.; Yang, Y.-J.; Li, G.-J.; Boyer, J.S. Sugar Input, Metabolism, and Signaling Mediated by Invertase: Roles in Development, Yield Potential, and Response to Drought and Heat. Mol. Plant 2010, 3, 942–955. [Google Scholar] [CrossRef]
- Jiang, Y.; Davis, A.R.; Vujanovic, V.; Bueckert, R.A. Reproductive development response to high daytime temperature in field pea. J. Agron. Crop. Sci. 2018, 205, 324–333. [Google Scholar] [CrossRef]
- Pacini, E.; Dolferus, R. The Trials and Tribulations of the Plant Male Gametophyte—Understanding Reproductive Stage Stress Tolerance. In Abiotic and Biotic Stress in Plants-Recent Advances and Future Perspectives; IntechOpen: London, UK, 2016. [Google Scholar]
- Cohen, I.; Zandalinas, S.I.; Huck, C.; Fritschi, F.B.; Mittler, R. Meta-analysis of drought and heat stress combination impact on crop yield and yield components. Physiol. Plant. 2020, 171, 66–76. [Google Scholar] [CrossRef]
- Nicolas, M.E.; Gleadow, R.; Dalling, M.J. Effect of Post-anthesis Drought on Cell Division and Starch Accumulation in Developing Wheat Grains. Ann. Bot. 1985, 55, 433–444. [Google Scholar] [CrossRef]
- Balla, K.; Rakszegi, M.; Li, Z.; Békés, F.; Bencze, S.; Veisz, O. Quality of winter wheat in relation to heat and drought shock after anthesis. Czech J. Food Sci. 2011, 29, 117–128. [Google Scholar] [CrossRef] [Green Version]
- Thitisaksakul, M.; Jiménez, R.C.; Arias, M.C.; Beckles, D. Effects of environmental factors on cereal starch biosynthesis and composition. J. Cereal Sci. 2012, 56, 67–80. [Google Scholar] [CrossRef]
- Liu, X.; Wang, X.; Wang, X.; Gao, J.; Luo, N.; Meng, Q.; Wang, P. Dissecting the critical stage in the response of maize kernel set to individual and combined drought and heat stress around flowering. Environ. Exp. Bot. 2020, 179, 104213. [Google Scholar] [CrossRef]
- Lu, H.; Hu, Y.; Wang, C.; Liu, W.; Ma, G.; Han, Q.; Ma, D. Effects of High Temperature and Drought Stress on the Expression of Gene Encoding Enzymes and the Activity of Key Enzymes Involved in Starch Biosynthesis in Wheat Grains. Front. Plant Sci. 2019, 10, 1414. [Google Scholar] [CrossRef] [PubMed]
- Ning, P.; Yang, L.; Li, C.; Fritschi, F.B. Post-silking carbon partitioning under nitrogen deficiency revealed sink limitation of grain yield in maize. J. Exp. Bot. 2018, 69, 1707–1719. [Google Scholar] [CrossRef] [Green Version]
- Kumar, A.; Turner, N.C. Growth and sucrose synthase activity of developing chickpea (Cicer arietinum L.) seeds under field conditions. Aust. J. Crop Sci. 2009, 3, 20–27. [Google Scholar]
- Awasthi, R.; Kaushal, N.; Vadez, V.; Turner, N.; Berger, J.; Siddique, K.; Nayyar, H. Individual and combined effects of transient drought and heat stress on carbon assimilation and seed filling in chickpea. Funct. Plant Biol. 2014, 41, 1148–1167. [Google Scholar] [CrossRef] [PubMed] [Green Version]
- Zahedi, M.; McDonald, G.; Jenner, C.F. Nitrogen supply to the grain modifies the effects of temperature on starch and protein accumulation during grain filling in wheat. Aust. J. Agric. Res. 2004, 55, 551–564. [Google Scholar] [CrossRef]
- Triboi, A.-M.; Martre, P.; Triboï-Blondel, A. Environmentally-induced changes in protein composition in developing grains of wheat are related to changes in total protein content. J. Exp. Bot. 2003, 54, 1731–1742. [Google Scholar] [CrossRef] [PubMed]
- Liu, Y.; Wu, Q.; Ge, G.; Han, G.; Jia, Y. Influence of drought stress on afalfa yields and nutritional composition. BMC Plant Biol. 2018, 18, 13. [Google Scholar] [CrossRef] [PubMed] [Green Version]
- Heckathorn, S.A.; Giri, A.; Mishra, S.; Bista, D. Heat Stress and Roots. In Climate Change and Plant Abiotic Stress Tolerance; Wiley Online Library: Hoboken, NJ, USA, 2013; pp. 109–136. [Google Scholar]
- Huang, L.; Baumgartl, T.; Mulligan, D. Is rhizosphere remediation sufficient for sustainable revegetation of mine tailings? Ann. Bot. 2012, 110, 223–238. [Google Scholar] [CrossRef] [Green Version]
- Bista, D.R.; Heckathorn, S.A.; Jayawardena, D.M.; Mishra, S.; Boldt, J.K. Effects of Drought on Nutrient Uptake and the Levels of Nutrient-Uptake Proteins in Roots of Drought-Sensitive and -Tolerant Grasses. Plants 2018, 7, 28. [Google Scholar] [CrossRef] [Green Version]
- Hummel, M.; Hallahan, B.F.; Brychkova, G.; Ramirez-Villegas, J.; Guwela, V.; Chataika, B.; Curley, E.; McKeown, P.C.; Morrison, L.; Talsma, E.F.; et al. Reduction in nutritional quality and growing area suitability of common bean under climate change induced drought stress in Africa. Sci. Rep. 2018, 8, 16187. [Google Scholar] [CrossRef]
- Ghanbari, A.A.; Shakiba, M.R.; Toorchi, M.; Choukan, R. Nitrogen changes in the leaves and accumulation of some minerals in the seeds of red, white and chitti beans (’Phaseolus vulgaris’) under water deficit conditions. Aust. J. Crop Sci. 2013, 7, 706–712. [Google Scholar] [CrossRef]
- Impa, S.; Perumal, R.; Bean, S.; Sunoj, V.J.; Jagadish, S.K. Water deficit and heat stress induced alterations in grain physico-chemical characteristics and micronutrient composition in field grown grain sorghum. J. Cereal Sci. 2019, 86, 124–131. [Google Scholar] [CrossRef]
- Khazaei, H.; Podder, R.; Caron, C.T.; Kundu, S.S.; Diapari, M.; Vandenberg, A.; Bett, K.E. Marker–Trait Association Analysis of Iron and Zinc Concentration in Lentil (Lens culinaris Medik.) Seeds. Plant Genome 2017, 10, 1–8. [Google Scholar] [CrossRef] [Green Version]
- Tan, G.Z.H.; Das Bhowmik, S.S.; Hoang, T.; Karbaschi, M.R.; Long, H.; Cheng, A.; Bonneau, J.P.; Beasley, J.T.; Johnson, A.A.T.; Williams, B.; et al. Investigation of Baseline Iron Levels in Australian Chickpea and Evaluation of a Transgenic Biofortification Approach. Front. Plant Sci. 2018, 9, 788. [Google Scholar] [CrossRef]
- Samineni, S.; Mahendrakar, M.D.; Shankar, N.; Hotti, A.; Chand, U.; Rathore, A.; Gaur, P.M. Impact of heat and drought stresses on grain nutrient content in chickpea: Genome-wide marker-trait associations for protein, Fe and Zn. Environ. Exp. Bot. 2021, 194, 104688. [Google Scholar] [CrossRef]
- Ma, Y.; Zeng, X.-M.; Zhang, Y.; Wang, N.; Zheng, Y.; Wang, G.; Chen, C. Impact of the Choice of Land Surface Scheme on a Simulated Heatwave Event: The Case of Sichuan-Chongqing Area, China. Adv. Meteorol. 2017, 2017, 1–17. [Google Scholar] [CrossRef]
- Sehgal, A.; Sita, K.; Siddique, K.; Kumar, R.; Bhogireddy, S.; Varshney, R.K.; HanumanthaRao, B.; Nair, R.M.; Prasad, P.V.V.; Nayyar, H. Drought or/and Heat-Stress Effects on Seed Filling in Food Crops: Impacts on Functional Biochemistry, Seed Yields, and Nutritional Quality. Front. Plant Sci. 2018, 9, 1705. [Google Scholar] [CrossRef] [Green Version]
- Anjum, S.A.; Xie, X.; Wang, L.; Saleem, M.F.; Man, C.; Lei, W. Morphological, physiological and biochemical responses of plants to drought stress. Afr. J. Agric. Res. 2011, 6, 2026–2032. [Google Scholar]
- Shekoofa, A.; Balota, M.; Sinclair, T. Limited-transpiration trait evaluated in growth chamber and field for sorghum genotypes. Environ. Exp. Bot. 2014, 99, 175–179. [Google Scholar] [CrossRef]
- Sunita, C.; Sinclair, T.R.; Messina, C.D.; Cooper, M. Hydraulic Conductance of Maize Hybrids Differing in Transpiration Response to Vapor Pressure Deficit. Crop. Sci. 2014, 54, 1147–1152. [Google Scholar] [CrossRef]
- Schoppach, R.; Sadok, W. Differential sensitivities of transpiration to evaporative demand and soil water deficit among wheat elite cultivars indicate different strategies for drought tolerance. Environ. Exp. Bot. 2012, 84, 1–10. [Google Scholar] [CrossRef]
- Sinclair, T.R.; Pradhan, D.; Shekoofa, A. Inheritance of limited-transpiration trait in peanut: An update. J. Crop. Improv. 2018, 32, 281–286. [Google Scholar] [CrossRef]
- Sinclair, T.R. Theoretical Analysis of Soil and Plant Traits Influencing Daily Plant Water Flux on Drying Soils. Agron. J. 2005, 97, 1148–1152. [Google Scholar] [CrossRef]
- Vadez, V.; Kholová, J.; Yadav, R.S.; Hash, C.T. Small temporal differences in water uptake among varieties of pearl millet (Pennisetum glaucum (L.) R. Br.) are critical for grain yield under terminal drought. Plant Soil 2013, 371, 447–462. [Google Scholar] [CrossRef] [Green Version]
- Sinclair, T.R.; Zwieniecki, M.A.; Holbrook, N.M. Low leaf hydraulic conductance associated with drought tolerance in soybean. Physiol. Plant. 2007, 132, 446–451. [Google Scholar] [CrossRef] [PubMed]
- Fan, D.-Y.; Dang, Q.-L.; Xu, C.-Y.; Jiang, C.-D.; Zhang, W.-F.; Xu, X.-W.; Yang, X.-F.; Zhang, S.-R. Stomatal Sensitivity to Vapor Pressure Deficit and the Loss of Hydraulic Conductivity Are Coordinated in Populus euphratica, a Desert Phreatophyte Species. Front. Plant Sci. 2020, 11, 1248. [Google Scholar] [CrossRef] [PubMed]
- Kar, S.; Tanaka, R.; Korbu, L.B.; Kholová, J.; Iwata, H.; Durbha, S.S.; Adinarayana, J.; Vadez, V. Automated discretization of ‘transpiration restriction to increasing VPD’features from outdoors high-throughput phenotyping data. Plant Methods 2020, 16, 140. [Google Scholar] [CrossRef]
- Seversike, T.M.; Sermons, S.M.; Sinclair, T.R.; Carter, T.E., Jr.; Rufty, T.W. Temperature interactions with transpiration response to vapor pressure deficit among cultivated and wild soybean genotypes. Physiol. Plant. 2013, 148, 62–73. [Google Scholar] [CrossRef] [PubMed]
- Chenu, K.; Van Oosterom, E.J.; McLean, G.; Deifel, K.S.; Fletcher, A.; Geetika, G.; Tirfessa, A.; Mace, E.S.; Jordan, D.; Sulman, R.; et al. Integrating modelling and phenotyping approaches to identify and screen complex traits: Transpiration efficiency in cereals. J. Exp. Bot. 2018, 69, 3181–3194. [Google Scholar] [CrossRef] [PubMed]
- Kumar, S.; Rajendran, K. Lentil Ontology-Crop Ontology Curation Tool. Crop Ontology 547 for Agricultural Data. CGIAR Centers. Available online: https://cropontology.org/term/CO_339:ROOT (accessed on 20 December 2021).
- Baethgen, W.E.; Alley, M.M. A manual colorimetric procedure for measuring ammonium nitrogen in soil and plant Kjeldahl digests. Commun. Soil Sci. Plant Anal. 1989, 20, 961–969. [Google Scholar] [CrossRef]
- Gupta, D.S.; Thavarajah, D.; McGee, R.J.; Coyne, C.J.; Kumar, S.; Thavarajah, P.; Program, I.B. Genetic diversity among cultivated and wild lentils for iron, zinc, copper, calcium and magnesium concentrations. Aust. J. Crop. Sci. 2016, 10, 1381–1387. [Google Scholar] [CrossRef]
- Kassambara, A.; Mundt, F. Factoextra: Extract and Visualize the Results of Multivariate Data Analyses. 2020. Available online: https://cran.r-project.org/package=factoextra (accessed on 17 May 2020).
- Husson, F.; Josse, J.; Lê, S.; Mazet, J. FactoMineR: Multivariate Exploratory Data Analysis and Data Mining. 2019. Available online: https://cran.r-project.org/package=FactoMineR (accessed on 1 May 2020).
- Galili, T. dendextend: An R package for visualizing, adjusting and comparing trees of hierarchical clustering. Bioinformatics 2015, 31, 3718–3720. [Google Scholar] [CrossRef] [Green Version]


| Trait | Normal | Temperature Stress | Temperature-Drought Stress | ||||||
|---|---|---|---|---|---|---|---|---|---|
| Min | Max | Mean ± SE | Min | Max | Mean ± SE | Min | Max | Mean ± SE | |
| PLH | 24.75 | 34.21 | 28.28 a ± 3.39 | 19.75 | 27.25 | 22.86 b ± 0.30 | 14.33 | 25.03 | 19.74 c ± 0.37 |
| EGV | 17.00 | 30.00 | 23.12 a ± 0.56 | 13.00 | 21.00 | 17.07 b ± 0.30 | 12.00 | 21.00 | 17.82 c ± 0.35 |
| DFF | 82.00 | 89.00 | 84.95 a ± 0.22 | 60.00 | 66.00 | 61.55 b ± 0.19 | 590.00 | 64.00 | 61.15 b ± 0.23 |
| D50F | 86.00 | 100.00 | 93.08 a ± 0.45 | 65.00 | 74.00 | 68.53 b ± 0.31 | 630.00 | 74.00 | 68.32 b ± 0.39 |
| D50P | 98.00 | 106.00 | 101.78 a ± 0.36 | 71.00 | 80.00 | 76.20 b ± 0.44 | 700.00 | 80.00 | 74.77 c ± 0.41 |
| DM | 124.00 | 131.00 | 127.20 a ± 0.32 | 101.00 | 105.00 | 103.53 b ± 0.17 | 100.00 | 105.00 | 101.70 c ± 0.17 |
| NFPP | 40.83 | 234.25 | 111.45 a ± 7.43 | 12.75 | 129.40 | 57.75 b ± 4.66 | 12.00 | 119.50 | 52.07 b ± 4.14 |
| NUPP | 3.50 | 25.25 | 11.34 a ± 0.88 | 1.33 | 20.00 | 6.15 b ± 0.51 | 2.00 | 24.50 | 7.89 b ± 0.79 |
| NTPP | 56.00 | 240.00 | 122.79 a ± 7.23 | 15.75 | 134.00 | 63.90 b ± 4.71 | 14.00 | 130.00 | 59.96 b ± 4.17 |
| GYP | 1.59 | 8.86 | 4.13 a ± 0.28 | 0.43 | 4.56 | 2.35 b ± 0.17 | 0.66 | 4.32 | 2.12 b ± 0.14 |
| HSW | 1.93 | 4.97 | 2.64 a ± 0.09 | 1.59 | 5.23 | 2.42 b ± 0.11 | 1.42 | 5.51 | 2.15 c ± 0.13 |
| CP | 23.40 | 31.90 | 28.91 a ± 0.35 | 22.00 | 27.00 | 24.36 b ± 0.20 | 11.00 | 14.90 | 13.34 c ± 0.16 |
| Zn | 33.10 | 64.40 | 47.86 a ± 1.52 | 27.40 | 59.10 | 41.12 b ± 1.41 | 30.40 | 50.90 | 39.28 c ± 0.80 |
| Fe | 62.30 | 99.30 | 78.19 a ± 1.44 | 51.30 | 81.60 | 66.71 b ± 1.42 | 52.40 | 73.50 | 62.86 c ± 0.81 |
| Traits | Normal | Temperature Stress | Temperature-Drought Stress | ||||||
|---|---|---|---|---|---|---|---|---|---|
| PC1 | PC2 | PC3 | PC1 | PC2 | PC3 | PC1 | PC2 | PC3 | |
| PLH | −0.52 * | 0.21 ns | −0.07 ns | −0.31 ns | −0.02 ns | 0.01 ns | −0.27 ns | −0.13 ns | 0.19 ns |
| EGV | −0.78 ** | −0.47 * | 0.05 ns | −0.49 * | −0.42 ns | 0.38 ns | −0.64 ** | −0.05 ns | 0.14 ns |
| DFF | 0.50 * | 0.40 ns | −0.50 * | 0.86 ** | 0.30 ns | 0.02 ns | 0.64 ** | −0.44 ns | 0.18 ns |
| D50F | 0.38 ns | 0.62 ** | −0.58 ** | 0.86 ** | 0.44 ns | 0.01 ns | 0.74 ** | −0.44 * | 0.44 ns |
| D50P | 0.88 ** | 0.13 ns | 0.06 ns | 0.79 ** | 0.42 ns | −0.21 ns | 0.77 ** | −0.33 ns | 0.30 ns |
| DM | 0.46 * | 0.16 ns | 0.45 * | 0.22 ns | 0.41 ns | −0.70 ** | 0.89 ** | −0.11 ns | 0.19 ns |
| NFPP | −0.50 * | 0.83 ** | 0.14 ns | −0.59 ** | 0.76 ** | 0.23 ns | 0.55 * | 0.81 ** | 0.16 ns |
| NTPP | −0.44 * | 0.84 ** | 0.13 ns | −0.57 ** | 0.76 ** | 0.23 ns | 0.59 ** | 0.78 ** | 0.09 ns |
| NUPP | 0.48 * | −0.29 ** | −0.08 ns | 0.05 ns | 0.20 ns | 0.04 ns | 0.22 ns | −0.20 ns | −0.13 ns |
| GYP | −0.49 * | 0.81 ** | 0.11 ns | −0.44 ns | 0.79 ** | 0.33 ns | 0.49 * | 0.76 ** | 0.19 ns |
| HSW | −0.71 ** | −0.30 ns | 0.42 ns | 0.60 ** | −0.09 ns | 0.42 ns | 0.13 ns | −0.50 * | 0.35 ns |
| CP | −0.14 ns | −0.07 ns | −0.65 ** | −0.34 ns | 0.32 ns | −0.60 ** | 0.52 * | −0.30 ns | −0.39 ns |
| Zn | 0.35 ns | 0.18 ns | 0.77 ** | 0.49 * | −0.08 ns | 0.61 ** | −0.61 ** | 0.14 ns | 0.35 ns |
| Fe | 0.74 * | 0.24 ns | 0.51 ** | 0.36 ns | 0.47 * | 0.44 ns | −0.64 ** | 0.05 ns | 0.55 * |
| Eigenvalue | 4.38 | 3.17 | 2.31 | 4.08 | 2.92 | 1.98 | 4.83 | 2.70 | 1.73 |
| Variance explained (%) | 31.29 | 22.65 | 16.49 | 34.00 | 24.32 | 16.52 | 34.51 | 19.30 | 12.42 |
| Total variance (%) | 31.29 | 53.29 | 70.43 | 34.00 | 58.32 | 74.85 | 34.51 | 53.81 | 66.23 |
| Cluster | Experiment | GYP | HSW | CP | Zn | Fe |
|---|---|---|---|---|---|---|
| Cluster I | Normal | 5.55 | 3.27 | 29.78 | 44.12 | 69.50 |
| High-temperature | 1.65 | 4.95 | 22.52 | 56.63 | 73.85 | |
| Temperature-drought | 1.84 | 2.00 | 12.92 | 41.26 | 65.02 | |
| Cluster II | Normal | 4.06 | 2.44 | 27.94 | 54.13 | 85.15 |
| High-temperature | 3.30 | 2.17 | 24.66 | 42.49 | 69.73 | |
| Temperature-drought | 1.28 | 3.56 | 14.25 | 33.85 | 58.65 | |
| Cluster III | Normal | 3.30 | 2.54 | 29.94 | 39.94 | 72.39 |
| High-temperature | 1.97 | 2.35 | 24.37 | 39.30 | 64.77 | |
| Temperature-drought | 2.97 | 1.96 | 13.87 | 37.12 | 59.99 |
| Genotype | Breakpoint | Left Slope | Right Slope | R2 | |||
|---|---|---|---|---|---|---|---|
| BP ± SE | CI (95%) | S1 | CI (95%) | S2 | CI (95%) | ||
| ILL 3484 | 3.27 ± 0.95 | 3.01 to 4.50 | 44.48 | 32.68 to 59.19 | 24.95 | 3.45 to 39.94 | 0.87 |
| ILL 6075 | 3.15 ± 1.14 | 2.73 to 4.51 | 28.91 | 21.74 to 45.84 | 17.37 | 0.25 to 28.46 | 0.82 |
| ILL 6104 | 3.00 ± 0.25 | 3.00 to 3.45 | 36.40 | 25.72 to 47.06 | 12.26 | −2.57 to 26.43 | 0.83 |
| ILL 6338 | 3.37 ± 0.61 | 3.00 to 3.45 | 43.73 | 31.41 to 60.63 | 15.42 | −9.64 to 38.61 | 0.81 |
| ILL 6362 | 3.01 ± 0.99 | 2.76 to 3.46 | 44.71 | 34.40 to 71.39 | 28.14 | 2.88 to 41.59 | 0.87 |
| ILL 7814 | 3.36 ± 0.56 | 2.79 to 4.17 | 34.42 | 25.90 to 77.81 | 5.59 | −26.00 to 28.45 | 0.85 |
| ILL 7833 | 2.81 ± 0.47 | 1.67 to 3.57 | 18.14 | 9.59 to 38.87 | −1.63 | −13.49 to 8.32 | 0.60 |
| ILL 7835 | 2.76 ± 0.43 | 2.23 to 3.30 | 37.32 | 23.76 to 50.88 | 10.79 | −3.32 to 24.91 | 0.79 |
| ILL 8029 | 3.51 ± 0.54 | 3.07 to 4.01 | 22.69 | 14.10 to 31.29 | 13.10 | −10.92 to 37.13 | 0.70 |
| Genotype | Slope ± SE | Slope CI (95%) | X-Intercept | X-Intercept CI (95%) | R2 |
|---|---|---|---|---|---|
| ILL 5919 | 27.23 ± 2.59 | 21.96 to 32.50 | −0.58 | −1.34 to −0.06 | 0.77 |
| ILL 4605 | 16.53 ± 1.51 | 13.46 to 19.61 | −0.39 | −1.13 to 0.13 | 0.79 |
| ILL 6359 | 31.18 ± 2.82 | 25.44 to 36.92 | −0.13 | −0.82 to 0.36 | 0.79 |
| ILL 6363 | 27.07 ± 2.72 | 21.55 to 32.58 | −0.75 | −1.65 to −0.15 | 0.74 |
| ILL 7223 | 25.95 ± 1.01 | 23.88 to 28.02 | 0.06 | −0.20 to 0.28 | 0.95 |
| ILL 7286 | 22.04 ± 2.98 | 15.94 to 28.13 | −1.32 | −2.84 to −0.44 | 0.66 |
| ILL 7804 | 30.32 ± 2.17 | 25.93 to 34.71 | 0.12 | −0.35 to 0.49 | 0.82 |
| ILL 7813 | 29.08 ± 3.67 | 21.54 to 36.62 | −0.15 | −1.19 to 0.48 | 0.70 |
| ILL 7819 | 24.22 ± 2.27 | 19.62 to 28.83 | −0.20 | −0.92 to 0.30 | 0.76 |
| ILL 7820 | 23.01 ± 2.61 | 17.60 to 28.43 | −0.61 | −1.62 to 0.03 | 0.78 |
| ILL 8025 | 36.48 ± 2.78 | 30.81 to 42.16 | 0.22 | −0.27 to 0.59 | 0.85 |
Publisher’s Note: MDPI stays neutral with regard to jurisdictional claims in published maps and institutional affiliations. |
© 2021 by the authors. Licensee MDPI, Basel, Switzerland. This article is an open access article distributed under the terms and conditions of the Creative Commons Attribution (CC BY) license (https://creativecommons.org/licenses/by/4.0/).
Share and Cite
El Haddad, N.; Choukri, H.; Ghanem, M.E.; Smouni, A.; Mentag, R.; Rajendran, K.; Hejjaoui, K.; Maalouf, F.; Kumar, S. High-Temperature and Drought Stress Effects on Growth, Yield and Nutritional Quality with Transpiration Response to Vapor Pressure Deficit in Lentil. Plants 2022, 11, 95. https://doi.org/10.3390/plants11010095
El Haddad N, Choukri H, Ghanem ME, Smouni A, Mentag R, Rajendran K, Hejjaoui K, Maalouf F, Kumar S. High-Temperature and Drought Stress Effects on Growth, Yield and Nutritional Quality with Transpiration Response to Vapor Pressure Deficit in Lentil. Plants. 2022; 11(1):95. https://doi.org/10.3390/plants11010095
Chicago/Turabian StyleEl Haddad, Noureddine, Hasnae Choukri, Michel Edmond Ghanem, Abdelaziz Smouni, Rachid Mentag, Karthika Rajendran, Kamal Hejjaoui, Fouad Maalouf, and Shiv Kumar. 2022. "High-Temperature and Drought Stress Effects on Growth, Yield and Nutritional Quality with Transpiration Response to Vapor Pressure Deficit in Lentil" Plants 11, no. 1: 95. https://doi.org/10.3390/plants11010095
APA StyleEl Haddad, N., Choukri, H., Ghanem, M. E., Smouni, A., Mentag, R., Rajendran, K., Hejjaoui, K., Maalouf, F., & Kumar, S. (2022). High-Temperature and Drought Stress Effects on Growth, Yield and Nutritional Quality with Transpiration Response to Vapor Pressure Deficit in Lentil. Plants, 11(1), 95. https://doi.org/10.3390/plants11010095