Author Contributions
Conceptualization, J.C.W., P.R.K., P.R.T., J.P.M. and S.J.P.; methodology and statistics, J.C.W., P.R.K., P.R.T., J.P.M., P.C.H.M. and S.J.P.; results review and validation, J.C.W., P.R.K., P.R.T., J.P.M., P.C.H.M. and S.J.P.; writing—original draft preparation, J.C.W.; writing—review and editing, P.R.K., P.R.T., J.P.M., P.C.H.M. and S.J.P.; supervision, P.R.K., P.R.T., J.P.M. and S.J.P. All authors have read and agreed to the published version of the manuscript.
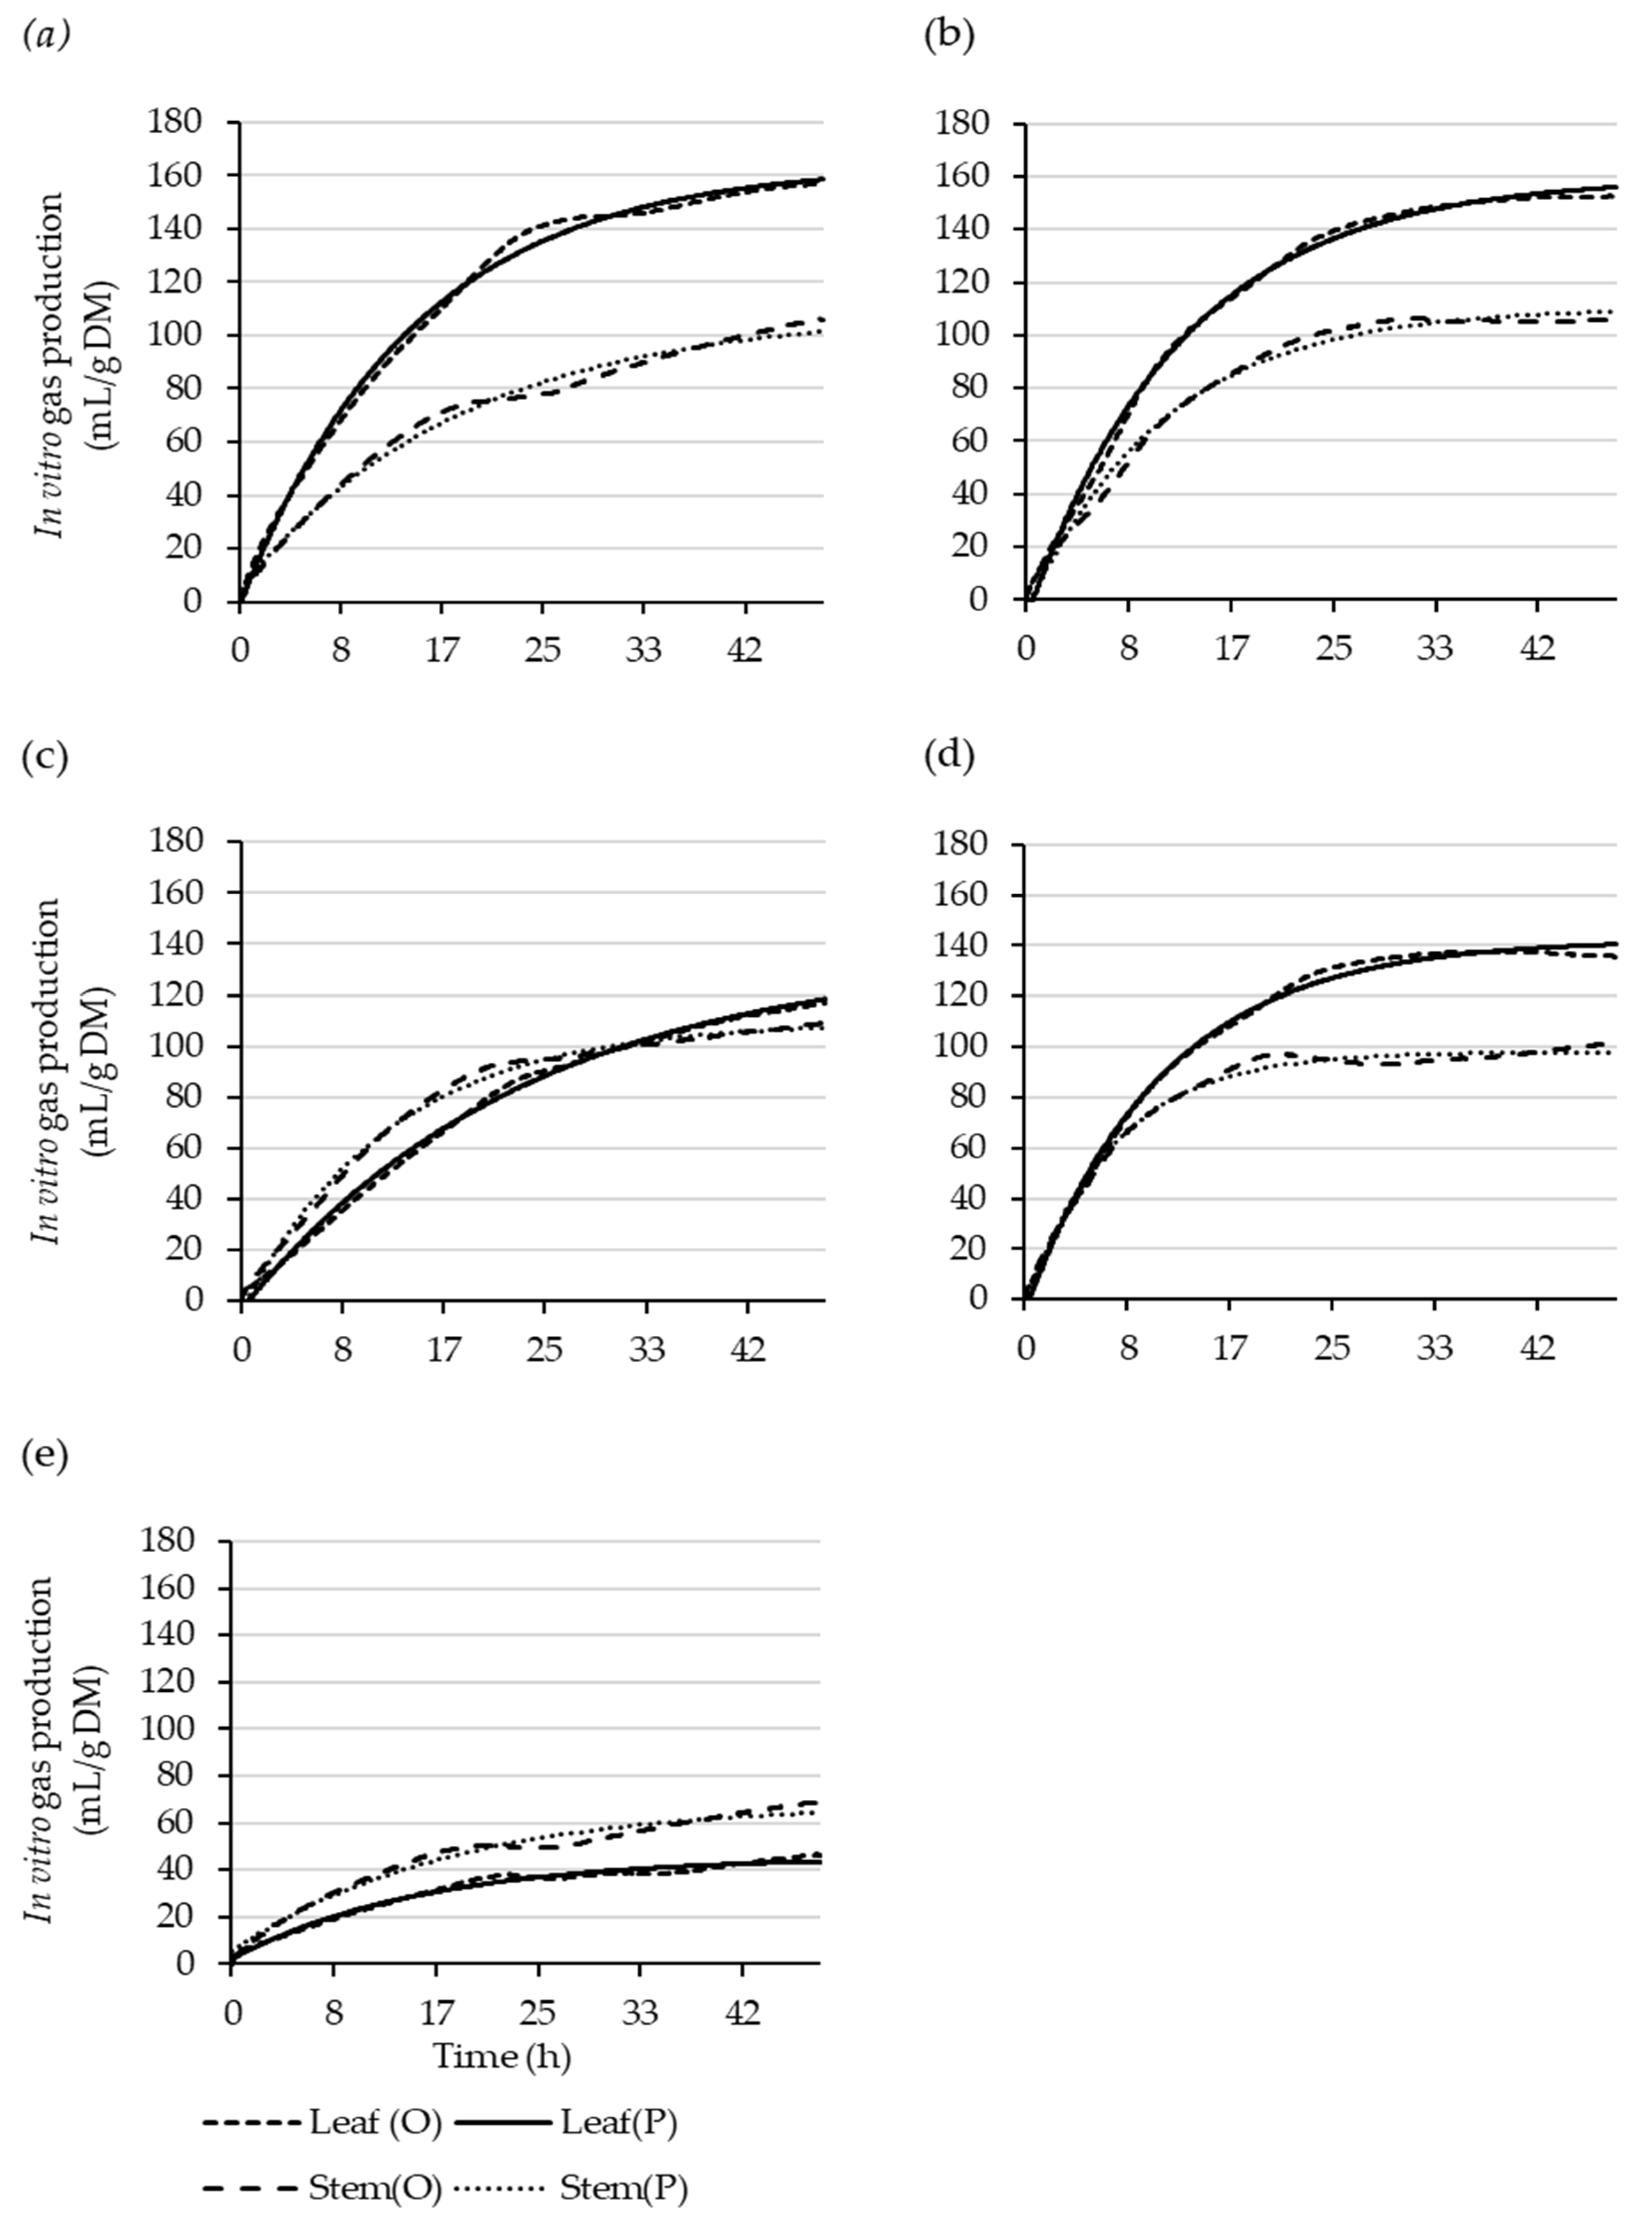
Figure 1.
Observed (O) and single-pool-model-predicted (P) leaf and stem cumulative gas-production curves over 48 h for Coprosma robusta (a), Griselinia littoralis (b), Hoheria populnea (c), Pittosporum crassifolium (d), and Salix schwerinii (e).
Figure 1.
Observed (O) and single-pool-model-predicted (P) leaf and stem cumulative gas-production curves over 48 h for Coprosma robusta (a), Griselinia littoralis (b), Hoheria populnea (c), Pittosporum crassifolium (d), and Salix schwerinii (e).
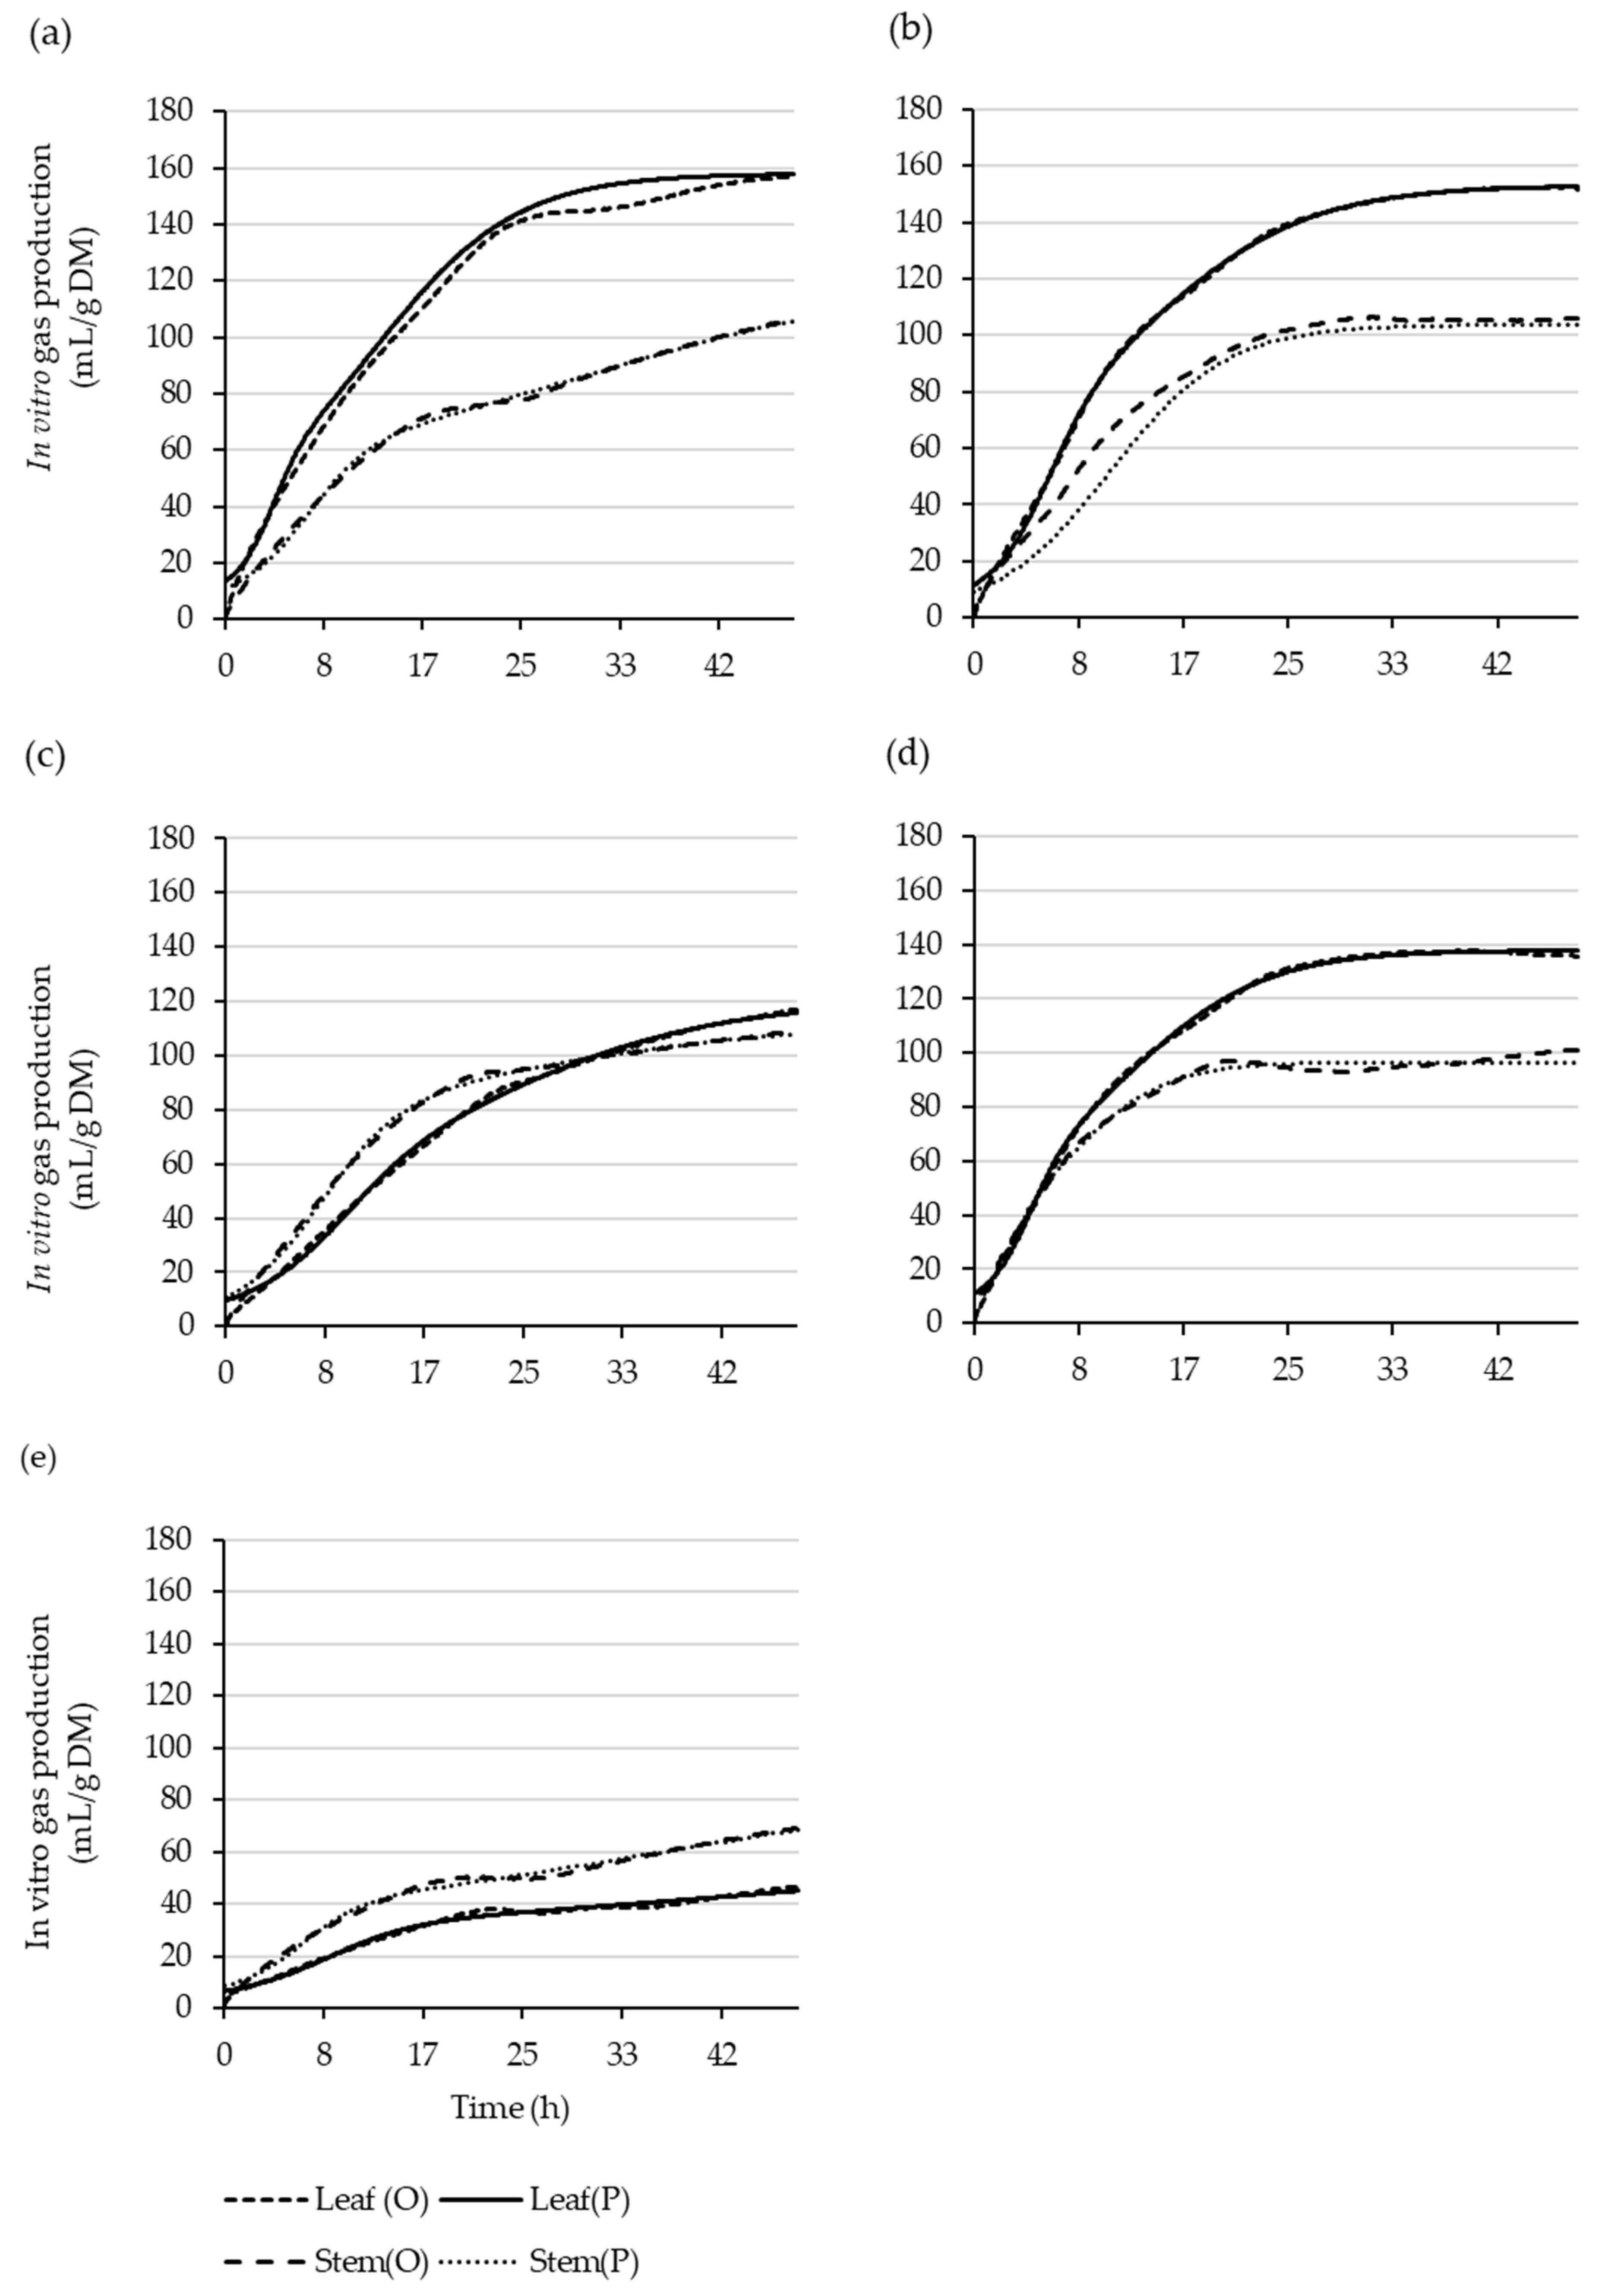
Figure 2.
Observed (O) and the dual-pool-model-predicted (P) leaf and stem cumulative gas-production curves over 48 h for Coprosma robusta (a), Griselinia littoralis (b), Hoheria populnea (c), Pittosporum crassifolium (d), and Salix schwerinii (e).
Figure 2.
Observed (O) and the dual-pool-model-predicted (P) leaf and stem cumulative gas-production curves over 48 h for Coprosma robusta (a), Griselinia littoralis (b), Hoheria populnea (c), Pittosporum crassifolium (d), and Salix schwerinii (e).
Table 1.
Summarized long-term climatic conditions for Palmerston North district (Source [
29,
30]).
Table 1.
Summarized long-term climatic conditions for Palmerston North district (Source [
29,
30]).
| Climate Parameters | Season |
|---|
| Summer | Autumn | Winter | Spring |
|---|
| Temperature | Mean (°C) | 17.4 | 13.8 | 9.0 | 12.4 |
| Rainfall | Total (mm) | 222.0 | 189.0 | 246.0 | 43.7 |
| | Percentage of total rainfall (%) | 25.0 | 21.0 | 27.0 | 26.0 |
| Wind | Mean speed (km/h) | 15.8 | 14.0 | 13.9 | 16.8 |
| Solar radiation | Mean daily (MJ/m2/d) | 21.1 | 11.0 | 6.7 | 15.9 |
Table 2.
Native (Coprosma robusta, Griselinia littoralis, Hoheria populnea, and Pittosporum crassifolium) and exotic (Salix schwerinii) shrub species leaf (n = 20) and stem (n = 20) dry matter (DM, %) as a percentage of the fresh weight, and ash (Ash, %), crude protein (CP, %), neutral detergent fibre (NDF, %), acid detergent fibre (ADF, %) and lignin (Lignin, %) as percentages of the DM and metabolizable energy (ME, MJ/kg DM).
| Shrub Species | DM | Ash | CP | NDF | ADF | Lignin |
|---|
| Leaf |
| Coprosma robusta | 39.3 b | 7.0 bc | 7.9 b | 37.4 | 22.4 ab | 9.6 ab |
| Griselinia littoralis | 31.5 c | 7.3 b | 6.2 b | 32.1 | 22.3 ab | 12.0 a |
| Hoheria populnea | 31.1 c | 11.6 a | 14.0 a | 37.6 | 20.2 b | 7.5 b |
| Pittosporum crassifolium | 43.0 a | 6.5 c | 6.2 b | 36.4 | 20.7 b | 9.3 ab |
| Salix schwerinii | 43.1 a | 4.9 d | 15.1 a | 36.3 | 24.6 a | 8.8 b |
| Pooled SE | 0.57 | 0.17 | 0.41 | 1.31 | 0.63 | 0.62 |
| Stem |
| Coprosma robusta | 35.8 b | 6.4 bc | 4.7 b | 46.6 c | 36.7 b | 9.1 b |
| Griselinia littoralis | 32.1 b | 5.6 c | 4.2 b | 48.6 bc | 38.6 ab | 10.2 ab |
| Hoheria populnea | 36.0 b | 9.0 a | 8.3 a | 53.5 a | 41.5 a | 9.2 b |
| Pittosporum crassifolium | 47.4 a | 6.7 b | 4.2 b | 52.0 ab | 41.0 ab | 8.8 b |
| Salix schwerinii | 48.5 a | 3.7 d | 7.0 a | 48.9 bc | 38.4 ab | 11.6 a |
| Pooled SE | 1.05 | 0.23 | 0.37 | 0.95 | 1.07 | 0.38 |
Table 3.
Native (Coprosma robusta, Griselinia littoralis, Hoheria populnea, and Pittosporum crassifolium) and exotic (Salix schwerinii) shrub species leaf (n = 20) and stem (n = 20) in vitro dry-matter digestibility (IVDMD, % DM), in vitro digestible organic content in dry matter (IVDOMD, % DM), in vitro organic-matter digestibility (IVOMD, % DM) and metabolizable energy (ME, MJ/kg DM).
| Shrub Species | IVDMD | IVOMD | IVDOMD | ME |
|---|
| Leaf |
| Coprosma robusta | 78.8 a | 82.3 a | 75.0 a | 12.0 a |
| Griselinia littoralis | 78.6 a | 82.0 a | 74.6 a | 11.9 a |
| Hoheria populnea | 77.4 a | 80.1 b | 71.2 b | 11.4 b |
| Pittosporum crassifolium | 78.4 a | 81.8 ab | 74.7 a | 12.0 a |
| Salix schwerinii | 73.7 b | 76.5 c | 70.4 b | 11.3 b |
| SE | 0.32 | 0.40 | 0.42 | 0.07 |
| Stem |
| Coprosma robusta | 67.8 | 69.9 a | 63.7 a | 10.2 a |
| Griselinia littoralis | 66.3 | 68.4 ab | 62.5 ab | 10.0 ab |
| Hoheria populnea | 65.2 | 66.5 a,b | 60.0 b | 9.6 b |
| Pittosporum crassifolium | 64.2 | 65.9 b | 60.0 b | 9.6 b |
| Salix schwerinii | 66.9 | 69.4 ab | 63.9 a | 10.2 a |
| SE | 0.87 | 0.91 | 0.82 | 0.13 |
Table 4.
Total gas production in milliliters per gram of dry matter (mL/g DM) from the in vitro fermentation of leaf (n = 20) and stem (n = 20) material from native (Coprosma robusta, Griselinia littoralis, Hoheria populnea, and Pittosporum crassifolium) and exotic (Salix schwerinii) shrub species.
Table 4.
Total gas production in milliliters per gram of dry matter (mL/g DM) from the in vitro fermentation of leaf (n = 20) and stem (n = 20) material from native (Coprosma robusta, Griselinia littoralis, Hoheria populnea, and Pittosporum crassifolium) and exotic (Salix schwerinii) shrub species.
| Species | Leaf | Stem | SE |
|---|
| Coprosma robusta | 157.0 a | 105.9 a,† | 6.92 |
| Griselinia littoralis | 151.7 ab | 105.9 a,† | 5.01 |
| Hoheria populnea | 116.6 b | 108.6 a | 7.01 |
| Pittosporum crassifolium | 135.3 ab | 100.8 a,† | 8.80 |
| Salix schwerinii | 46.1 c | 68.6 b | 6.58 |
| SE | 8.42 | 5.12 | |
Table 5.
Native (Coprosma robusta, Griselinia littoralis, Hoheria populnea, and Pittosporum crassifolium) and exotic (Salix schwerinii) shrub species leaf in vitro fermentation kinetic parameters derived using singlepool model, where: a, gas production from the immediately soluble fraction (mL/g DM); b, gas production from the slowly degradable fraction (mL/g DM); c, rate of gas production (%/h); Vors, total gas production (mL/g DM); V24, total gas production after 24 h (mL/g DM); and t0.5, half-life of total gas production (h).
| Species | Parameters | a | b | c | Vors | V24 | T0.5 | MAPE | RMSE | Adj R2 |
|---|
| Coprosma robusta | Value | −1.0 | 165.3 | 0.070 | 164.3 | 133.1 | 10.2 | −0.59 | 11.48 | 0.932 |
| SE | 0.99 | 0.93 | 0.001 |
| Lower 95% CI limit | −3 | 163.5 | 0.067 |
| Upper 95% CI limit | 0.9 | 167.1 | 0.072 |
| Griselinia littoralis | Value | −6.9 | 166.6 | 0.079 | 159.7 | 134.5 | 9.9 | 2.18 | 5.69 | 0.983 |
| SE | 0.51 | 0.47 | 0.001 |
| Lower 95% CI limit | −7.9 | 165.7 | 0.078 |
| Upper 95% CI limit | −5.9 | 167.5 | 0.08 |
| Hoheria populnea | Value | −3.5 | 139.7 | 0.043 | 136.2 | 85.9 | 17.5 | −1.65 | 11.86 | 0.892 |
| SE | 0.91 | 1.44 | 0.001 |
| Lower 95% CI limit | −5.3 | 136.8 | 0.040 |
| Upper 95% CI limit | −1.7 | 142.5 | 0.045 |
| Pittosporum crassifolium | Value | −4.4 | 146.7 | 0.091 | 142.3 | 125.9 | 8.3 | 2.56 | 16.17 | 0.840 |
| SE | 1.53 | 1.41 | 0.002 |
| Lower 95% CI limit | −7.4 | 143.9 | 0.087 |
| Upper 95% CI limit | −1.4 | 149.5 | 0.096 |
| Salix schwerinii | Value | 2.4 | 43.2 | 0.064 | 45.6 | 36.3 | 9.2 | −21.54 | 13.25 | 0.414 |
| SE | 1.12 | 1.08 | 0.005 |
| Lower 95% CI limit | 0.2 | 41.1 | 0.054 |
| Upper 95% CI limit | 4.6 | 45.3 | 0.073 |
Table 6.
Native (Coprosma robusta, Griselinia littoralis, Hoheria populnea, and Pittosporum crassifolium) and exotic (Salix schwerinii) shrub species stem in vitro fermentation kinetic parameters derived using single-pool model, where: a, gas production from the immediately soluble fraction (mL/g DM); b, gas production from the slowly degradable fraction (mL/g DM); c, rate of gas production (%/h); Vors, total gas production (mL/g DM); V24, total gas production after 24 h (mL/g DM); and t0.5, half-life of total gas production (h).
| Species | Parameters | a | b | c | Vors | V24 | T0.5 | MAPE | RMSE | Adj R2 |
|---|
| Coprosma robusta | Value | 4.9 | 104 | 0.055 | 108.9 | 81.2 | 11.0 | −2.46 | 7.22 | 0.931 |
| SE | 0.59 | 0.63 | 0.001 |
| Lower 95% CI limit | 3.7 | 102.7 | 0.053 |
| Upper 95% CI limit | 6.0 | 105.2 | 0.057 |
| Griselinia littoralis | Value | −4.5 | 115 | 0.09 | 110.5 | 97.3 | 8.6 | −0.07 | 10.94 | 0.876 |
| SE | 1.03 | 0.95 | 0.002 |
| Lower 95% CI limit | −6.5 | 113.1 | 0.087 |
| Upper 95% CI limit | −2.5 | 116.8 | 0.094 |
| Hoheria populnea | Value | −4.1 | 113.7 | 0.082 | 109.6 | 93.7 | 9.4 | −0.18 | 11.01 | 0.875 |
| SE | 1.0 | 0.92 | 0.002 |
| Lower 95% CI limit | −6.1 | 111.9 | 0.079 |
| Upper 95% CI limit | −2.1 | 115.5 | 0.085 |
| Pittosporum crassifolium | Value | −2.0 | 100.1 | 0.14 | 98.1 | 94.7 | 5.2 | 0.16 | 6.78 | 0.920 |
| SE | 0.75 | 0.73 | 0.002 |
| Lower 95% CI limit | −3.5 | 98.7 | 0.137 |
| Upper 95% CI limit | −0.5 | 101.5 | 0.144 |
| Salix schwerinii | Value | 5.6 | 62.9 | 0.057 | 68.5 | 52.4 | 9.3 | 3.14 | 4.25 | 0.935 |
| SE | 0.35 | 0.36 | 0.001 |
| Lower 95% CI limit | 4.9 | 62.2 | 0.055 |
| Upper 95% CI limit | 6.3 | 63.6 | 0.059 |
Table 7.
Native (Coprosma robusta, Griselinia littoralis, Hoheria populnea, and Pittosporum crassifolium) and exotic (Salix schwerinii) shrub species leaf in vitro fermentation kinetic parameters derived using dual-pool model, where: L, lag time (h); , fast-pool total gas production (mL/g DM); , slow pool (mL/g DM); , fast-pool rate of gas production (%/h); , slow rate (%/h); VSch, total gas production (mL/g DM); , total gas production for the fast pool after 24 h (mL/g DM); slow pool after 24 h (mL/g DM); , fast-pool total-gas-production half-life (h); and slow-pool half-life (h).
| Species | Parameters | | | L | | | VSch | | | | | MAPE | RMSE | Adj R2 |
|---|
| Coprosma robusta | Value | 120.3 | 0.043 | 1.36 | 33.02 | 0.191 | 153.3 | 104.3 | 12.3 | 33.0 | 5.4 | −8.29 | 11.32 | 0.934 |
| SE | 1.86 | 0.001 | 0.18 | 1.94 | 0.019 |
| Lower CI | 116.7 | 0.042 | 1.01 | 29.2 | 0.154 |
| Upper 95% CI limit | 124.0 | 0.044 | 1.71 | 36.8 | 0.228 |
| Griselinia littoralis | Value | 92.2 | 0.040 | 1.84 | 60.8 | 0.123 | 153.0 | 75.8 | 13.6 | 60.8 | 6.9 | −3.66 | 5.31 | 0.985 |
| SE | 1.43 | 0.001 | 0.07 | 1.54 | 0.004 |
| Lower 95% CI limit | 89.4 | 0.039 | 1.69 | 57.8 | 0.116 |
| Upper 95% CI limit | 95.0 | 0.041 | 1.98 | 63.8 | 0.130 |
| Hoheria populnea | Value | 70.5 | 0.025 | 2.67 | 50.2 | 0.069 | 120.7 | 38.2 | 21.0 | 49.2 | 10.3 | −8.76 | 11.83 | 0.892 |
| SE | 3.82 | 0.002 | 0.27 | 5.05 | 0.005 |
| Lower 95% CI limit | 63.0 | 0.022 | 2.15 | 40.3 | 0.059 |
| Upper 95% CI limit | 78.0 | 0.029 | 3.2 | 60.1 | 0.080 |
| Pittosporum crassifolium | Value | 91.2 | 0.046 | 1.41 | 46.7 | 0.167 | 137.9 | 81.9 | 11.7 | 46.7 | 5.7 | −5.53 | 16.08 | 0.842 |
| SE | 3.43 | 0.002 | 0.23 | 3.6 | 0.019 |
| Lower 95% CI limit | 84.4 | 0.043 | 0.96 | 39.7 | 0.130 |
| Upper 95% CI limit | 97.9 | 0.049 | 1.86 | 53.8 | 0.204 |
| Salix schwerinii | Value | 27.6 | 0.066 | 1.01 | 34.6 | 0.011 | 62.2 | 27.1 | 8.7 | 9.2 | 46.3 | −22.42 | 13.21 | 0.417 |
| SE | 3.62 | 0.013 | 2.2 | 26.37 | 0.005 |
| Lower 95% CI limit | 20.5 | 0.042 | −3.31 | −17.1 | 0.000 |
| Upper 95% CI limit | 34.7 | 0.091 | 5.34 | 86.4 | 0.021 |
Table 8.
Native (Coprosma robusta, Griselinia littoralis, Hoheria populnea, and Pittosporum crassifolium) and exotic (Salix schwerinii) shrub species leaf in vitro fermentation kinetic parameters derived using dual pool model, where, L, lag time (h); , fast-pool total gas production (mL/g DM); , slow pool (mL/g DM); , fast-pool rate of gas production (%/h); , slow rate (%/h); VSch, total gas production (mL/g DM); , total gas production for the fast pool after 24 h (mL/g DM); , slow pool after 24 h (mL/g DM); , fast-pool total-gas-production half-life (h); and slow pool half-life (h).
| Species | Parameters | | | L | | | VSch | | | | | MAPE | RMSE | Adj R2 |
|---|
| Coprosma robusta | Value | 71.9 | 0.017 | 1.71 | 50.8 | 0.095 | 122.8 | 27.7 | 28.9 | 50.8 | 7.7 | −4.87 | 6.83 | 0.938 |
| SE | 3.16 | 0.001 | 0.17 | 0.67 | 0.003 |
| Lower 95% CI limit | 65.8 | 0.016 | 1.38 | 49.5 | 0.089 |
| Upper 95% CI limit | 78.1 | 0.019 | 2.04 | 52.2 | 0.101 |
| Griselinia littoralis | Value | 76.0 | 0.049 | 1.06 | 30.2 | 0.129 | 106.2 | 81.3 | 10.6 | 16.7 | 10.7 | 4.91 | 11.14 | 0.872 |
| SE | 4.48 | 0.002 | 0.24 | 4.62 | 0.017 |
| Lower 95% CI limit | 67.2 | 0.045 | 0.59 | 21.1 | 0.095 |
| Upper 95% CI limit | 84.8 | 0.053 | 1.53 | 39.2 | 0.162 |
| Hoheria populnea | Value | 33.9 | 0.021 | 1.03 | 78.1 | 0.073 | 112.0 | 16.5 | 23.0 | 77.4 | 8.4 | −6.15 | 10.93 | 0.876 |
| SE | 2.16 | 0.003 | 0.21 | 2.77 | 0.003 |
| Lower 95% CI limit | 29.7 | 0.016 | 0.62 | 72.7 | 0.066 |
| Upper 95% CI limit | 38.2 | 0.027 | 1.44 | 83.5 | 0.079 |
| Pittosporum crassifolium | Value | 65.5 | 0.068 | 0.60 | 31.2 | 0.219 | 96.7 | 64.6 | 8.1 | 31.2 | 4.4 | −2.11 | 6.70 | 0.922 |
| SE | 2.06 | 0.002 | 0.13 | 2.11 | 0.019 |
| Lower 95% CI limit | 61.4 | 0.065 | 0.35 | 27.1 | 0.181 |
| Upper 95% CI limit | 69.5 | 0.071 | 0.84 | 35.3 | 0.257 |
| Salix schwerinii | Value | 56.2 | 0.014 | 1.42 | 32.6 | 0.097 | 88.8 | 32.5 | 7.8 | 18.0 | 36.5 | −4.09 | 3.71 | 0.950 |
| SE | 4.10 | 0.001 | 0.22 | 0.44 | 0.003 |
| Lower 95% CI limit | 48.2 | 0.012 | 0.99 | 31.7 | 0.092 |
| Upper 95% CI limit | 64.2 | 0.015 | 1.86 | 33.4 | 0.103 |
Table 9.
The pH, total volatile fatty acids (VFA) in millimoles (tVFA, mM), percentage of respective VFA (scetate, propionate, isobutyrate, butyrate, isovalerate, valerate, %), ratio of acetate to propionate (A:P), and microbial biomass in milligrams per gram of dry matter (MBM, mg/g DM) for leaves and stems for native (Coprosma robusta, Griselinia litoralis, Hoheria populnea, and Pittosporum crassifolium) and an exotic (Salix schwerinii) shrub species with potential use as fodder sources in New Zealand.
| Shrub Species | pH | Acetate | Propionate | Isobutyrate | Butyrate | Isovalerate | Valerate | Total VFA | A:P | MBM |
|---|
| Leaves |
| Coprosma robusta | 6.57 b | 63.1 a | 22.2 c | 0.15 b | 13.8 a | 0.11 b | 0.69 | 27.5 a | 2.9 a | 101.3 b |
| Griselinia litoralis | 6.57 b | 61.2 ab | 23.8 c | 0.00 c | 15.1 a | 0.00 b | 0.63 | 27.6 a | 2.6 a | 80.2 b |
| Hoheria populnea | 6.62 ab | 62.7 a | 25.0 bc | 0.38 a | 10.4 b | 0.58 a | 0.89 | 24.5 a | 2.5 a | 106.4 b |
| Pittosporum crassifolium | 6.57 b | 57.6 b | 27.6 b | 0.33 a | 13.1 a | 0.52 a | 0.92 | 28.8 a | 2.1 b | 112.5 b |
| Salix schwerinii | 6.70 a | 58.1 b | 33.9 a | 0.00 c | 7.9 c | 0.11 b | 0.75 | 7.3 b | 1.7 b | 260.2 a |
| Pooled SE | 0.027 | 0.98 | 0.73 | 0.033 | 0.57 | 0.062 | 0.070 | 0.99 | 0.09 | 9.88 |
| Stem |
| Coprosma robusta | 6.66 | 60.4 ab | 25.0 | 0.00 b | 14.2 a | 0.00 | 0.74 ab | 17.4 a | 2.5 | 82.5 b |
| Griselinia litoralis | 6.67 | 54.7 b | 27.7 | 0.04 b | 17.6 a | 0.09 | 0.82 a | 19.0 a | 2.0 | 62.6 b |
| Hoheria populnea | 6.66 | 55.8 b | 27.9 | 0.29 a | 15.1 a | 0.38 | 1.03 a | 19.9 a | 2.0 | 70.1 b |
| Pittosporum crassifolium | 6.67 | 53.3 b | 31.9 | 0.09 ab | 13.9 a | 0.32 | 0.84 a | 16.0 a | 1.8 | 90.0 b |
| Salix schwerinii | 6.71 | 68.6 a | 25.9 | 0.00 b | 7.7 b | 0.00 | 0.29 b | 9.6 b | 2.7 | 144.4 a |
| Pooled SE | 0.013 | 2.04 | 2.08 | 0.054 | 1.39 | 0.091 | 0.115 | 1.28 | 0.22 | 7.22 |
Table 10.
Native shrubs (Coprosma robusta, Griselinia litoralis, Hoheria populnea, and Pittosporum crassifolium) and an exotic (Salix schwerinii) shrub species carbon dioxide (CO2) and methane (CH4) gas production in milliliters per gram of dry matter (mL/g DM) and greenhouse carbon-dioxide equivalent (CO2 Eq) in grams per gram of dry matter (g/g DM) from the leaves and stems.
| Shrub Species | CO2 | CH4 | CO2 Eq |
|---|
| Leaves |
| Coprosma robusta | 76.5 ab | 46.0 a | 0.77 a |
| Griselinia litoralis | 76.3 ab | 43.9 a | 0.77 a |
| Hoheria populnea | 64.2 b | 37.8 a | 0.66 a |
| Pittosporum crassifolium | 77.7 a | 41.3 a | 0.74 a |
| Salix schwerinii | 17.2 c | 8.6 b | 0.15 b |
| Pooled SE | 3.01 | 2.07 | 0.039 |
| Edible stem |
| Coprosma robusta | 47.6 a | 26.7 ab | 0.45 a |
| Griselinia litoralis | 53.7 a | 27.1 a | 0.47 a |
| Hoheria populnea | 54.7 a | 28.0 a | 0.49 a |
| Pittosporum crassifolium | 42.1 a | 20.9 ab | 0.36 ab |
| Salix schwerinii | 23.5 b | 14.9 b | 0.25 b |
| Pooled SE | 3.54 | 2.76 | 0.031 |


 ,
, 
