Article

Heat Stress Tolerance: A Prerequisite for the Selection of Drought- and Low Phosphorus-Tolerant Common Beans for Equatorial Tropical Regions Such as Ghana

1
Council for Scientific and Industrial Research, Crops Research Institute, Kumasi P.O. Box 3785, Ghana
2
Alliance of Bioversity International and International Center for Tropical Agriculture (CIAT), Cotonou 08 B.P. 0932, Benin
3
Department of Crop and Soil Sciences, Faculty of Agriculture, Kwame Nkrumah University of Science and Technology (KNUST), Kumasi P.O. Box 152, Ghana
*
Author to whom correspondence should be addressed.
Plants 2022, 11(18), 2352; https://doi.org/10.3390/plants11182352
Submission received: 17 July 2022 / Revised: 25 August 2022 / Accepted: 25 August 2022 / Published: 9 September 2022
(This article belongs to the Section Plant Response to Abiotic Stress and Climate Change)

Abstract

:
Forty common bean accessions of multiple genetic background trait attribution regarding drought tolerance were selected based on mean yield performance from an earlier field test evaluation conducted using augmented RCBD. The various bean genotypes were further evaluated with phosphorus and water treatment interactions at two different levels for each factor. The experiment was conducted in a 2 × 2 × 40 factorial using RCBD with three replications under screen-house conditions at the CSIR-Crops Research Institute, Kumasi-Ghana. The objective was to select drought- and low phosphorus-tolerant common bean genotypes; which are suitable for tropical climatic conditions. The results showed that common bean with drought and heat trait tolerance survived, developed flowers and podded with seeds to physiological maturity, whilst genotypes with no heat trait tolerance had impaired reproductive structural development and growth disruption; thus, flowers could not develop into pods with seeds. This reproductive developmental anomaly was due to prevailing average daytime and nighttime high temperatures of 35.45 °C and 29.95 °C, respectively, recorded during the growth period, which reduced pollen fertility. Among the 478 experimental bean plants (two plants were missing) analyzed, 141 (29.5%) did not flower, 168 (35.18%) had their pods dropped whilst 99 (20.7%) podded with seeds to achieve physiological maturity. The podded-seed bean genotypes were of the SEF-line pedigrees, which were shown to be heat and drought-tolerant. Meanwhile, bean accessions with SMC, SMN and SMR code prefixes did not pod into seed despite possessing drought-tolerant traits. The effects of interactions between phosphorus and water treatments on the root characteristics of drought-tolerant common bean were as follows: root length, root surface area, average root diameter and root volume growth extensions doubled dimensionally under optimum conditions (P2W2) compared to stressed conditions (P1W1). The results from the present study identified four SEF-bean genotypes, namely, SEF15, SEF 47, SEF 60 and SEF 62, as superior yield performers, even under low soil phosphorus and in extreme high temperature conditions. Therefore, breeding for the selection of drought- and low-P-tolerant common bean for tropical agro-ecological environments must also consider concomitant heat stress tolerance.

1. Introduction

Common bean is nutrient-dense food for human consumption. It is a valuable source of essential amino acids such as lysine, vitamins such as niacin and thiamin, and minerals such as iron, calcium, zinc, phosphorus and magnesium [1,2]. Biotic and abiotic stress factors limit the development and production of common bean. Among abiotic stress factors, drought and low soil availability of phosphorus are critical constraints in bean production in tropical regions [2,3]. Drought stress occurs in plants because of a water deficit in the soil, which disrupts plant growth and development processes, thus affecting yield. The effect of drought on beans depends on their growth stage. Drought at flowering may cause flower drop and low pod set, while podding, it results in partial filling or shriveled seed formation. In either case, both quality and yield are reduced.
In screening and selecting common bean lines for drought tolerance, it is important to strategically impose terminal drought at the reproductive growth stage, i.e., when plants are known to be sensitive to moisture stress [4,5].
In attempting to identify drought-tolerant bean for cultivation in the tropics, one underlying factor to consider is the heat tolerance level of the genotype. The common bean plant is sensitive to temperature, especially during reproduction phase. Its sensitivity to nighttime temperatures an even greater determining factor, as viable seeds are produced only when night temperatures are cool [6,7]. Heat stress causes a significant reduction in yield and quality. It has been reported that daytime temperatures above 30 °C and nighttime temperatures above 20 °C lead to a reduction in grain yield [7,8,9,10]. The major effects of high temperature include inhibition of pollen-fertility, flower drop and pod abortion [7,11,12]. The development of drought- and heat-tolerant bean varieties would also increase resilience to the food insecurity which will result from future global climate change. Global warming will have a negative impact on food production, especially in developing, tropical countries such as Ghana, where daily temperatures in the northern parts (the “food basket” of the country) could reach 40 °C during peak periods [13,14].
The co-occurrence of abiotic stresses such as drought, heat stress and low-P in soil has shown to be far more devastating for common bean production than the damage resulting from these phenomena separately. Drought and heat stress together could result in a 60% reduction in common bean production worldwide [15,16,17]. Breeding programs to improve the selection of common bean lines which are resilient to these three forms of abiotic stress could enhance yield and increase the land area which is suitable for cultivation. Bean genotypes tolerant to drought, low-P and heat stress have been identified [10,18] and developed from interspecific crosses of common bean (Phaseolus vulgaris) with other Phaseolus species (P. acutifolius, P. coccineus and P. dumosus). Suarez (2020) used 92 bean genotypes, similar to the breeding lines used in this study, among which were: 23 “SEF” prefixed lines, developed from interspecific lines of Phaseolus vulgaris, P. acutifolius and P. coccineus; 7 “SMC”-prefixed breeding lines from interspecific lines of Phaseolus vulgaris. P. acutifolius and P. dumosus; and 8 “SMR” and 2 “SMN” prefixed advanced bio-fortified lines. The BFS lines are drought-tolerant and known to have enhanced adaptation to low soil fertility. The “SEF” and “SER” lines were developed to adapt to drought and heat tolerance. The SMC, SMR and SMN lines are tolerant to drought with high mineral (Fe) contents in seed [10]. The objective of this study was to identify common bean genotypes for tropical climatic conditions that are drought- and low-P-tolerant.

2. Results

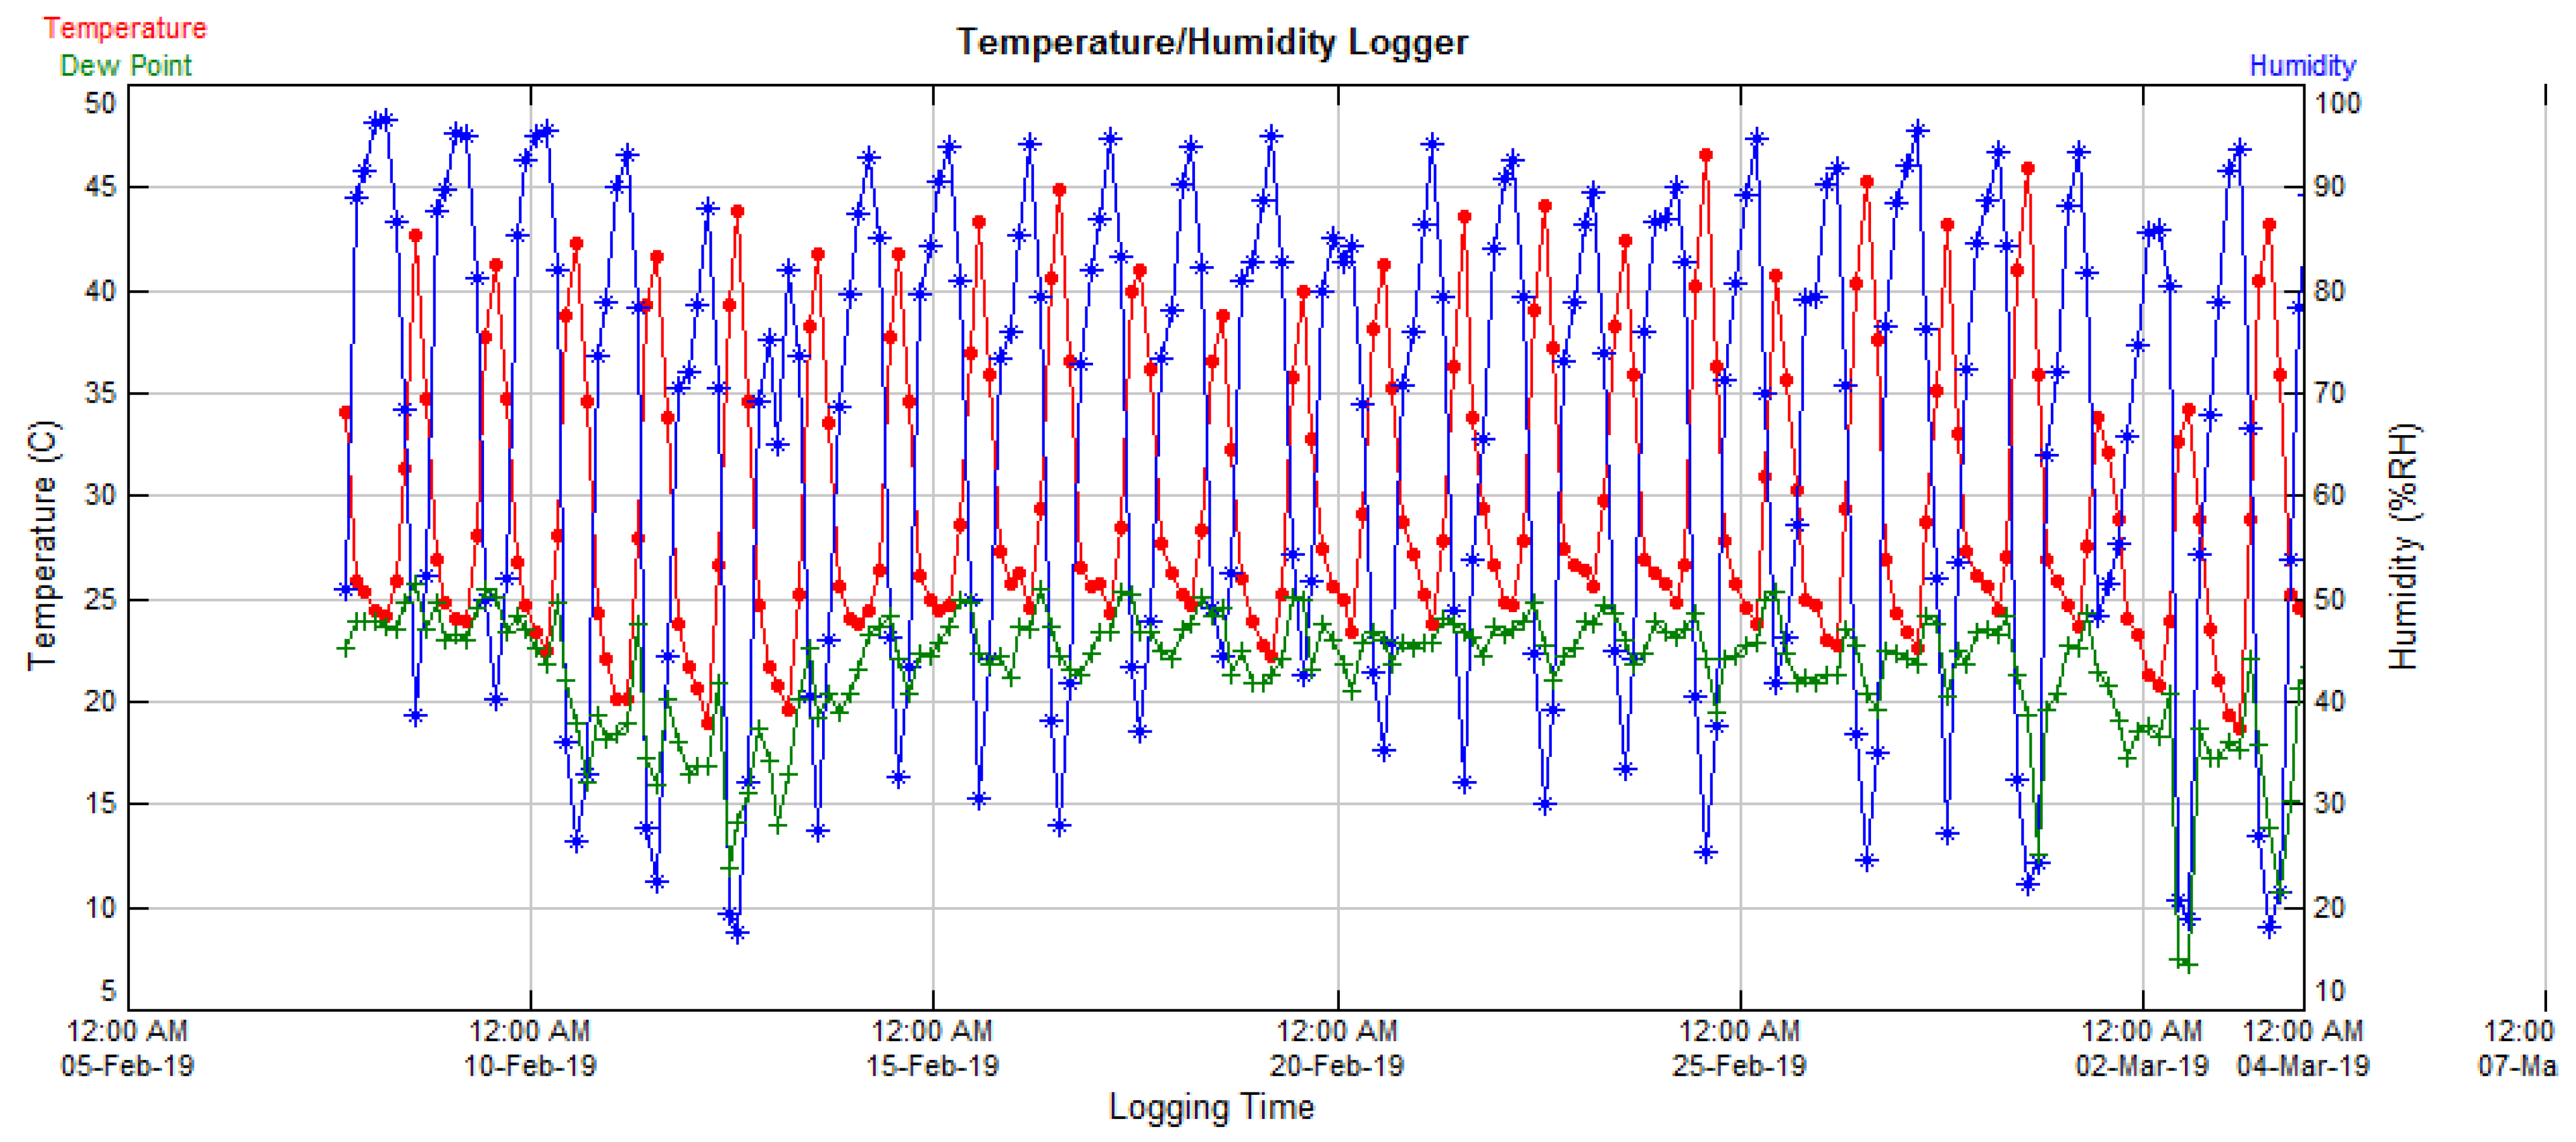
2.1. Ambient Temperature and Humidity Conditions at the Screen-House

The maximum and minimum temperatures in the screen-house used in this study were 46.72 and 18.78 °C respectively. The maximum and minimum relative humidity were 97.9 and 17.75% (Table 1). N (Table 1) is the duration of the bean growth period, determined using a temperature/humidity data logger set at three-hour interval readings. Thus, the N = 391 multiplied by three gives an indication of the estimated number of hours (1173 h) required to achieve physiological maturity (49 days).
The average daytime and nighttime temperatures recorded in the screen-house during the growth period of common bean were 35.45 °C and 24.95 °C, respectively (Table 2), and again, the average daytime and nighttime relative humidity conditions were 50.78% and 84.84%, respectively (Table 3).
A summary of the prevailing temperature and humidity conditions for the entire growth period at the screen-house is provided in Table 1.
The temperature readings were negatively correlated with relative humidity with a correlation coefficient value of −0.94 at a high level of significance (p = 0.001) (Table 4).

2.2. Assessment of Reproductive Growth on Drought-Tolerant Common Bean Accessions in a Phosphorus–Water Factorial Treatment under Terminal Drought, Screen-House Conditions

Observations of the growth of various bean genotype accessions revealed differential response in terms of reproductive development; this was probably due to the prevailing high temperature conditions recorded in the screen-house. Among the 478 experimental bean plant-accessions, 141 could not flower (29.5%), 70 initiated flower buds but underwent flower-abortion (16.64%), 168 initiated pods but later dropped them (35.18%), and 99 achieved physiological maturity with seeds (20.72%), as shown in Table 5.
The number of common bean genotypes that could not flower was 141, which constituted 29.5% of the total experimental plants. Upon disaggregating phosphorus and water treatment interactions, it was found that non-flowering (no flower) common beans under optimal conditions that is, multiple non-stressed (P2W2) constituted 10.46% of the total, moisture stressed and low-P that is multiple stressed (P1W1) represented 4.18%. Low-P and well-watered (P1W2) treatment interaction comprised 3.56% whilst optimum-P and moisture stressed (P2W1) made up 11.3%. The percentage disaggregations of other character-trait observations concerning the four moisture–phosphorus treatment interactions are presented in Table 5.
As per the experimental design employed, each bean genotype had four-treatment combinations of water and phosphorus (P1W1, P1W2, P2W1 and P2W2) per replication. Therefore, for the three replications in the design (RCBD), the maximum number for the ‘frequency of occurrence’ parameter for a genotype was 12 (i.e., 2.51% of the maximum).
The majority of the SMC, SMN and SMR- prefixed bean accessions did not bear flowers (not even flower buds). For example, out of the 12 maximum frequency occurrences of experimental bean plants, seven, eight and nine plants of genotypes SMN 157, SMN 158 and SMN 159, respectively, did not flower (Table 6). Similarly, 10 and 11 of bean genotypes SMR 113 and SMR 118 did not flower. Finally, 9 out of the 12 experimental ‘Ennepa’ variety plants (non-drought check variety) failed to flower.
The SMC, SMN and SMR bean accessions again experienced high flower abortion rates. For genotypes BFS 35 and BFS 39, four and five plants, respectively, aborted their flowers. Similarly, three of the ‘Ennepa’ (non-drought check variety) plants aborted their flowers (Table 7).
Pod abortion predominantly seen in BFS and SEF prefixed-bean genotypes. All 12 BFS 67 genotype plants and 11 out of the 12 SEF 53 plants aborted their pods. Nine experimental plants each for the BFS 60 and SEF 73 genotypes aborted their pods (Table 8).
The SEF-bean accessions were most able to pod under the stress conditions applied in the screen-house. For instance, a total of 9, 12, 10 (SEF 47), 10 (SEF 60) and 11 plants of bean lines SEF 10, SEF 15, SEF 47, SEF 60 and SEF 62, respectively, achieved pods with seeds (Table 9).

2.3. Assessment of the Root Characteristics of Drought-Tolerant Common Bean Accessions in a Phosphorus–Water Factorial Treatment under Screen-House Conditions of Terminal Drought

The root lengths of various bean genotypes ranged from 5.5 and 10.9 m at low-P and moisture stress (P1W1) and optimum-P and well-watered (P2W2), respectively (Table 10).
The effects of phosphorus level and moisture factorial treatment on root characteristics (i.e., total root length, surface area, dimeter and volume) were measured using WinRhizo on drought-tolerant common beans under screen-house conditions (Table 10, Table 11, Table 12 and Table 13).
The mean root surface areas ranged from 410 to 907 cm2 for low-P/moisture stress and optimum-P/well-watered treatments, respectively (Table 11). The average root diameters for stress and non-stress conditions ranged from 0.82 to 1.64 mm, respectively (Table 12). The mean root volume also followed a similar trend for stress and non-stress conditions (Table 13).
The response of seed-podded bean genotypes to phosphorus–water treatment combinations regarding root growth characteristics were as follows: genotypes AWASH 1, SEF28, SEF 55 and SMC 159 had mean root lengths of 10.359 cm, 10.929 cm, 10.203 cm, and 10.307 cm, respectively. The combined mean length of all bean genotypes was 7986 cm (Table 14). Bean genotypes with high podding frequency were SEF 15, SEF 47, SEF 60 and SEF 62, which had total root lengths of 5518 cm, 4833 cm, 3013 cm, 6468 cm, respectively. These values were lower than combined mean value of 7986 cm.

2.4. Soil Moisture Content during Terminal Drought

At day-1 of terminal drought (i.e., one day after soil water saturation/satiation), the soil moisture content was 0.24 and 0.25 m3/m3 for P1W1 and P2W1 moisture stress treatments, respectively (Table 15). At day-5 of terminal drought, the soil moisture content of potted soil began to yield negative values, i.e., −0.01 m3/m3 for both moisture stress treatments (P1W1 and P2W1). At day-14, both moisture stress treatments read −0.09 m3/m3.

3. Discussion

Drought stress during the reproductive stage is a major problem for common bean production because it affects the flowering and pod filling processes, thereby reducing yields [19,20]. Prior to our experiments, it was not known how prevailing ambient temperature and humidity conditions in a screen-house would selectively affect the reproductive phase of bean genotypes and the development of pods with seeds. High temperature as an abiotic stressor was among the factors considered; however, this became necessary over the course of this study. Despite the fact that the experiments were conducted in a confined, sheltered screen-house, the timing of the simulation of terminal drought stress was critical; it had to coincide with the dry season, as this is the most suitable period for the assessment and selection of promising drought-tolerant lines for local adaptation. In addition, adequate phenotypic and genotyping assessments facilitated the screening and selection of suitable drought-tolerant bean lines [4].
Among the 478 experimental plant units (there were two missing plants), only 20.7% were able to pod to maturity with seeds. It became apparent that the genotypes classified as drought- and heat-tolerant (based on available genetic background information) were able to pod with seeds. It is worth mentioning that neither optimal phosphorus and well-watered treatment interactions nor low phosphorus and moisture-stress treatment interactions translated into higher rates of pod formation and seed development. The common bean plant seems to have a sensitive physiological balance between the vegetative and reproductive phases, especially under drought, heat and low-P environmental conditions. As such, any of these abiotic factors could disrupt its growth and development.
High temperature is concomitant to drought stress under tropical climatic conditions [21]. It is therefore critical that it is not overlooked when selecting drought-tolerant common bean varieties for tropical environments. It was revealing that the bean genotypes with drought- and heat-tolerance attributes were able to pod with seeds, whilst those without such traits, despite being tolerant to drought, could not pod into seed under prevailing screen-house conditions.
Day and night temperatures play a crucial role in pod and seed development in the common bean [6]. The average daytime temperature of 35.45 °C and average nighttime temperature of 24.95 °C recorded during the study in the screen-house were above the ideal temperature conditions for the growth of common bean. The ambient temperature conditions in screen-house even reached a maximum of 46.72 °C. It has been established that average daytime temperatures above 30 °C and average nighttime temperatures above 20 °C reduce number of florets, increase the rate of flower abortion and subsequently reduce yield by 60% in common beans [10,22]. In our study, high temperatures truncated the growth of flower buds in some bean accessions while others had their flowers aborted and pods dropped, thereby reducing grain production [7,12].
In screening for heat-tolerant common beans under greenhouse conditions, Rainey and Griffiths (2005) [6] recommended a daytime temperature of 30 °C and nighttime temperature of 27 °C, for optimum yield. The bean accessions showed differential responses in the reproductive growth phases under high-temperature, screen-house conditions; i.e., accessions could seemingly be categorized, at their reproductive development stage, into four groups: not flowered (i.e., no flower bud), flower abortion, pod abortion and podded seed. The underlying mechanism for this was the presence of heat-tolerance traits in the genetic backgrounds of some of the studied bean accessions. Even though all the studied bean accessions possessed drought-tolerance attributes, only the genotypes with heat tolerance attributes as an additional trait achieved pod to maturity with seeds. As per the design and factorial arrangement with levels of treatment in the screen-house, the expected frequency for a given bean genotype was 12 (2.5%). None of the experimental plants with accession codes SMN and SMR matured to bear pod with seeds, even though they are drought tolerant. Therefore, in screening and selecting drought-tolerant common bean lineages for equatorial, tropical environments, heat stress tolerance is a pre-requisite.
If excessively warm temperatures can prevent the reproductive structures of common bean plants from developing into seeds, then it stands to reason that the effects of climate change will have serious consequences on food security. It has been predicted that global temperatures will rise by 2.0 °C by 2050 as result of climate change [23,24]. Therefore, the creation of climate-resilient crop genotypes requires urgent attention, especially in developing countries in sub-Saharan Africa.
Our results identified four SEF-bean lines, namely, SEF 15, SEF 47, SEF 60 and SEF 62 as superior in terms of heat tolerance, as depicted in their high ‘frequency occurrence’ of podded seed formation under low-P and drought conditions. Beebe et al. [25] reported similar results, i.e., five SEF bean lines (SEF 14, SEF 15, SEF 16, SEF 43 and SEF 60) stood out as superior in terms of their heat tolerance and grain yield. In the present study, four SEF genotypes (SEF 15, SEF 47, SEF 60 and SEF 62) were consistent in terms of superior yield under both low-P and drought stress (P1W1) and optimum-P and well-watered (P2W2) conditions. With respect to the Ennepa (non-drought) variety, growth was truncated at the flower-abortion stage (see Table 10 and Table 11). Common bean accessions with codes SMC, SMN and SMR, despite being drought-tolerant, were not able to cope with the heat stress they experienced in the screen-house. This resulted in low pollen growth viability and, thus, affected grain yield. The SEF-bean lines were drought-tolerant and better adapted to heat stress, providing superior grain yields. These results are in line with those of Suarez et al. [10].
The effects of treatment interactions of phosphorus and water combinations mainly manifested in the root growth characteristics of the studied bean genotypes. The root length, surface area, diameter and volume almost doubled in non-stress (P2W2) samples. For instance, a root length of 5453 cm was observed under stressed condition (P1W1) while one of 10,882 cm was measured under non-stressed condition (P2W2). Similarly, a root surface area of 410 cm2 was observed under stressed condition (P1W1) compared to 907 cm2 under non-stress condition (P2W2). The same trend was observed for root diameter and volume (see Table 10, Table 11, Table 12 and Table 13). Phosphorus treatment is known to drive root growth in common bean. The synergistic effect of phosphorus and water on growth among drought-tolerant common beans was more evident in the root characteristics than in the yield. The root diameters in drought-tolerant genotypes appeared to have an inverse relationship with the ‘frequency of occurrence of pods’ parameter for a podded genotype. For instance, bean genotypes with superior grain yields (that is, higher ‘frequency of occurrence of pods’) had smaller root diameters (<1.0 mm), while genotypes with bigger root diameters (>1.0) had low grain yields (lower ‘frequency of occurrence of pods’) (Table 9 and Table 14). The measurements of root length, surface area, average diameter and volume were consistent and with R-square index values (index of strength) ranging from 0.73–0.76. The results of the root analysis based on WinRhizo data revealed a CV range of 39–47%; this might have been due to the extremes of factorial treatment combinations, i.e., stressed (P1W1) versus non-stressed (P2W2) due to phosphorus and water application. Results obtained using WinRhizo are known to be comparable to manual measurements [26,27].
In terms of the root growth characteristics, there appeared to be a ‘redundant-effect’ of phosphorus application on drought-tolerant common bean, as both drought- and low-P-tolerance common beans had the tendency to produce extensive root systems. This is in line with findings by other authors [28,29]. For example, the mean root length of podded bean genotypes ranged from 5453 cm for P1W1 to 10,882 cm for P2W2, and mean root surface areas ranged from 410 cm2 for P1W1 to 907 cm2 for P2W2 (Table 10, Table 11, Table 12 and Table 13). Even under the stressed-treatment condition (P1W1), appreciably high root growth measurements were recorded. The results from this study therefore showed that drought- and low-P-tolerant common beans were able to adapt in terms of their root growth characteristics. Similar results and observations have been reported, with common bean plants showing enhanced root-to-shoot ratios for increased yield in P-deficient soils [30,31]. Root depth in common bean is important component in determining overall drought tolerance. The application of phosphorus to drought-tolerant common beans further increased root growth.
When moisture content readings were positive, the soil aggregates contained surface moisture; however, if the moisture content was negative, it implied that the aggregates were dry [32]. The negative soil moisture values recorded (−0.01 to −0.09 m3/m3) in the potted soil from day 5 to 14 of pod development indicated that the bean genotypes had endured and survived ten days of soil surface dryness. The effect of soil compaction was negligible, as there was no significant difference in mean bulk densities among potted soils (data not shown); this, otherwise, could have influenced the rate of water movement and root growth extension within the soil medium.
The results of our examination of phosphorus–water factorial treatment interactions revealed that phosphorus application manifested more during the agronomic vegetative stage, whilst well-watered treatment was vital for the development of yield components such as pods. The response to phosphorus–water treatment combinations regarding the phenology (that is, days to flowering, days to 50% flowering and days of maturity) of the bean lines was influenced by genetic constitution rather than the treatments themselves [33]. This ‘constitutive trait’, as proposed by Chaves et al. [33], manifested in the bean genotypes with genetic backgrounds of drought and heat tolerance. Meanwhile, drought- and heat-sensitive genotypes did not pod into seed, even under optimal phosphorus–water conditions. The genotypic differences among drought-tolerant bean accessions were attributed to the differential responses of reproductive structures as a result of the ambient temperature conditions in the screen-house.

4. Materials and Methods

4.1. Screen-House Factorial Experiment of 40 Selected Common Bean Lines with Phosphorus and Water as Treatment Factors

The screen-house was a galvanized metal frame structure in which each side was covered with size-50 Aphid-proof mesh net to reduce external influence and to ensure a confined environment. The roof metal frame comprised a dome-shaped arch covered with transparent rain-off shelter made of poly sheet. The screen-house had a dimensional space of 15.0 m floor length, 10.0 m arc-length, 8.0 m floor width and arch heights of 4.5 m at the middle lane and 1.7 m at the outer lane (edges). The structure was located at the CSIR-Crops Research Institute, Fumesua-Kumasi, Ghana. The experiment was laid out as a 2 × 2 × 40 factorial in a randomized complete block design (RCBD) with three replications. There were three treatment factors namely: common bean genotype, phosphorus and water. The phosphorus and water treatment factors were assessed at two levels each, i.e., low/optimum phosphorus and low (moisture stress at terminal drought)/well-watered treatments. Overall, there were 160 treatment combinations, i.e., 2 levels of phosphorus application × 2 levels of water application × 40 bean genotypes. Each treatment combination was replicated three times, making a total of 480 experimental plant units. A list of 40 drought-tolerant common bean varieties was used in the experiment (Table 16). Experiments took place in February 2019, which is still within the dry season in Ghana. The dry season is usually characterized by low humidity and dry air with no rain.
Two levels of phosphorous fertilizer were applied: an optimal application of 100 kg P/ha of triple super phosphate (TSP) equivalent (P2), i.e., 0.112 g of TSP/kg soil; and a low-P soil (P1), i.e., unamended soil. The total amount of optimum TSP used per pot was 0.364 g (see Appendix A).
Two levels of water regimes were studied: well-watered (equal volumes of water to be measured) from germination to maturity, followed by low-watered up to the vegetative stage, and finally, terminal drought (withdrawal of water) during the podding stage (i.e., the appearance of a first pod of about 3 cm in length); and well-watered at podding as a control. These factors formed the basis of the factorial experimental treatment interactions (T1, T2, T3, and T4), as illustrated in Table 17.
The effect of interactions among these parameters on crop performance were assessed on bean genotypes by agronomic, phenology and yield components and other root characteristics.

4.2. Soil Sample Collection and Laboratory Analysis

A demarcated land area (20 × 20 m) (known or suspected to be low in soil phosphorus) was cleared of weeds, and soil was collected from a depth of 0.0–20.0 cm and steam sterilized at 121 °C for 30 min before chemical analysis. Then, following a chemical assessing of the P level, a 3.25-kg sterilized soil sample (loamy sand) was placed in each column pot. The column-pots used in this study comprised PVC pipe cut to a length of 24.2 cm with a fixed diameter of 11.3 cm, vertically seated in a perforated-cover at the bottom to allow excess water to drain off.
The results of the laboratory chemical and physical analyses of the soil sample are shown in Table 18 and Table 19, respectively. Soil samples were analyzed chemically using the Bray-1 method to assess the level of available phosphorus, providing a baseline for the amount of triple superphosphate (TSP) to be applied for phosphorus treatment. The available P in the sample was low (5.4 mg/kg soil) justifying its use for the low-P (P-stress) condition experiments. The pH was measured at a soil:water ratio of 1:2.5. The organic carbon content was estimated by the wet oxidation Walkley/Black method, and total nitrogen was estimated by the macro-Kjeldahl method.

4.3. Temperature Data Logger at the Screen-House

A temperature–humidity data logger sensor (Supco®. SL500TH. SN: 05151131CF, Allenwood, NJ, USA) was activated to record and save temperatures and humidity values at three-hour intervals for the growing period of common bean in the screen-house. A representative graph of temperature/humidity/dew is provided in Figure 1.

4.4. Moisture-Pro-Check 10HS Soil Moisture Sensor (Decagon Devices, Inc.)

We used a Moisture-Pro-Check 10HS Soil Moisture Sensor to determine the soil moisture and water contents as m3/m3 (volumetric water content, i.e., 1 m3 water/1 m3 total soil volume). Soil moisture content is defined as the volume of water, Vw, that is removed from volume of soil Vs by drying the soil at 105 °C. A meter probe (sensor) was placed inside the potted soil and readings were recorded. Subsequent measurements were taken from same hole in order to avoid excessive soil disturbance.

4.5. Imposing Terminal Drought

Potted soil (3.25 kg soil sample) was satiated/saturated with 750 mL water in the evening following pod initiation stage. Excess water was drained until the following morning (12 h) under gravity. Soil moisture measurements were taken with a ProCheck-10HS moisture sensor (DECAGON DEVICES) the following morning and on all subsequent mornings up to Day 14. No further water was applied in order to achieve terminal drought conditions. Soil moisture measurements (m3/m3) were taken every morning during the 14-day terminal drought period.

4.6. Root Characteristics Measurement Using WinRHIZO™

WinRHIZO is an image analysis software specifically designed for automatic root measurements via a digitized scanner. Shoot portions were obtained at soil level. Harvested roots then removed from PVC columns (pots) and washed thoroughly in a pan of water to remove soil particles. Labelled, washed-roots were kept in plastic bag in a refrigerator until measurements of root characteristics had been completed. Washed roots were spread out on a scanner (avoiding overlap of secondary roots) for image acquisition. As root growth mass was extensive, as precautionary measure, it was cut into pieces for measurements, after which the sum values were recorded. It was a laborious work to prepare the roots for the WinRhizo measurements; therefore, only bean genotypes that had undergone moisture stress (P1W1 and P2W1) and which were podded with seeds were assessed. Root length, surface area, diameter and volume were recorded. After scanning, the individual root parts were gathered for oven drying.

4.7. Statistical Analyses

Statistical analyses were conducted using SAS (Statistics, version 9.4. SAS Institute, Cary, NC, USA). A general linear model (GLM) was used for data analysis. Analyses of variance (ANOVA) for each measured variable were performed using the generalized linear model (GLM). Pearson’s correlation analyses were conducted on variable traits all at levels of significance at alpha = 0.05.

5. Conclusions

Breeding for the selection of drought- and low-P-tolerant common bean for tropical agro-ecological environments must also consider concomitant heat stress tolerance. The present study revealed how some drought-tolerant common bean accessions are susceptible to high temperature, resulting in growth disruption and termination of reproductive structural development, thereby affecting yield output. The study also showed moderate root growth characteristics among drought- and low-P-tolerant common beans. Global warming is a threat to food security, especially in tropical settings. Therefore, to ensure sustained global food security, urgent research efforts are needed to breed resilient crops with multiple adaptive traits allowing them to thrive under emerging climate change conditions.

Author Contributions

Conceptualization and original draft preparation, D.A.-K.; Resources, J.Y.A.; Resources, L.B.; Project administration, S.Y.; Data curation, Z.A.-K.; Supervision, A.W.K.; Supervision, H.O.T.; Supervision, R.A. All authors have read and agreed to the published version of the manuscript.

Funding

This research received no external funding.

Institutional Review Board Statement

Not applicable.

Informed Consent Statement

Not applicable.

Data Availability Statement

Not applicable.

Acknowledgments

I am grateful to Clare Mukankusi (CIAT-African-hub, Uganda) for allowing me to access information concerning drought-tolerant common bean accessions. I am also thankful to Edward (Ted) Carey (CIP project Coordinator, Ghana) for allowing me to use his field data-taking equipment.

Conflicts of Interest

The authors declare no conflict of interest.

Appendix A. Calculations for the Amount of TSP Used per Kg Sample Soil

I.
TSP = 46% P2O5
Implies;
46 kg P2O5 is contained in every 100 kg TSP
i.e., 46 kg P2O5 = 100 kg TSP
For 100 kg P2O5 = ?
X = 100   kg   P 2 O 5   ×   100   kg   TSP 46   kg   P 2 O 5 = 217 . 40   kg   TSP
II.
Mass of soil per hectare at 15 cm depth
Density = Mass Volume   implies   Mass = Density   ×   Volume = Density   ×   Area   ×   Depth
Assume bulk density of 1.3 g/cm3 in the field.
Implies: Mass = 1.3 g/cm3 × 100,000,000 cm2 × 15 cm
Mass = 1,950,000,000 g
OR:
Mass = 1,950,000 kg/hectare
1,950,000 kg/hectare = 217.40 kg TSP
Therefore: 1 kg soil = x
x = 1   kg   soil   ×   217 . 40   kg   TSP 1 , 950 , 000   kg
x = 0.112 g of TSP/ kg soil
The amount of soil used in potting = 3.25 kg soil
Therefore, amount of TSP used in potted soil:
= 0 . 112   gTSP   ×   3 . 25   kg   soil 1   kg   soil
= 0.364 g TSP

References

  1. Celmeli, T.; Sari, H.; Canci, H.; Sari, D.; Adak, A.; Eker, T.; Toker, C. The nutritional content of common bean (Phaseolus vulgaris L.) landraces in comparison to modern varieties. Agronomy 2018, 8, 166. [Google Scholar] [CrossRef]
  2. Margaret, N.; Tenywa, J.S.; Otabbong, E.; Mubiru, D.N.; Basamba, T.A. Development of common bean (Phaseolus vulgaris L.) production under low soil phosphorus and drought in Sub-Saharan Africa: A review. J. Sustain. Dev. 2014, 7, 128–139. [Google Scholar] [CrossRef]
  3. Miklas, P.N.; Kelly, J.D.; Beebe, S.E.; Blair, M.W. Common bean breeding for resistance against biotic and abiotic stresses: From classical to MAS breeding. Euphytica 2006, 147, 105–131. [Google Scholar] [CrossRef]
  4. Darkwa, K.; Ambachew, D.; Mohammed, H.; Asfaw, A.; Blair, M.W. Evaluation of common bean (Phaseolus vulgaris L.) genotypes for drought stress adaptation in Ethiopia. Crop J. 2016, 4, 367–376. [Google Scholar] [CrossRef]
  5. Rao, I.M.; Beebe, S.E.; Polania, J.; Grajales, M.; Cajiao, C.; Ricaurte, J.; García, R.; Rivera, M. Evidence for genotypic differences among elite lines of common bean in the ability to remobilize photosynthate to increase yield under drought. J. Agric. Sci. 2017, 155, 857–875. [Google Scholar] [CrossRef]
  6. Rainey, K.M.; Griffiths, P.D. Differential response of common bean genotypes to high temperature. J. Am. Soc. Hortic. Sci. 2005, 130, 18–23. [Google Scholar] [CrossRef]
  7. Vargas, Y.; Mayor-Duran, V.M.; Buendia, H.F.; Ruiz-Guzman, H.; Raatz, B. Physiological and genetic characterization of heat stress effects in a common bean RIL population. PLoS ONE 2021, 16, e0249859. [Google Scholar] [CrossRef]
  8. Deva, C.R.; Urban, M.O.; Challinor, A.J.; Falloon, P.; Svitákova, L. Enhanced Leaf Cooling Is a Pathway to Heat Tolerance in Common Bean. Front. Plant Sci. 2020, 11, 19. [Google Scholar] [CrossRef]
  9. Lanna, A.C.; Silva, R.A.; Ferraresi, T.M.; Mendonça, J.A.; Coelho, G.R.C.; Moreira, A.S.; Valdisser, P.A.M.R.; Brondani, C.; Vianello, R.P. Physiological characterization of common bean (Phaseolus vulgaris L.) under abiotic stresses for breeding purposes. Environ. Sci. Pollut. Res. 2018, 25, 31149–31164. [Google Scholar] [CrossRef]
  10. Suárez, J.C.; Polanía, J.A.; Contreras, A.T.; Rodríguez, L.; Machado, L.; Ordoñez, C.; Beebe, S.; Rao, I.M. Adaptation of common bean lines to high temperature conditions: Genotypic differences in phenological and agronomic performance. Euphytica 2020, 216, 28. [Google Scholar] [CrossRef]
  11. López-Hernández, F.; Cortés, A.J. Last-Generation Genome–Environment Associations Reveal the Genetic Basis of Heat Tolerance in Common Bean (Phaseolus vulgaris L.). Front. Genet. 2019, 10, 954. [Google Scholar] [CrossRef]
  12. Soltani, A.; Weraduwage, S.M.; Sharkey, T.D.; Lowry, D.B. Elevated temperatures cause loss of seed set in common bean (Phaseolus vulgaris L.) potentially through the disruption of source-sink relationships. BMC Genom. 2019, 20, 312. [Google Scholar] [CrossRef] [PubMed]
  13. Asamoah, Y.; Ansah-Mensah, K. Temporal Description of Annual Temperature and Rainfall in the Bawku Area of Ghana. Adv. Meteorol. 2020, 2020, 3402178. [Google Scholar] [CrossRef]
  14. Asante, F.A.; Amuakwa-Mensah, F. Climate change and variability in Ghana: Stocktaking. Climate 2015, 3, 78–99. [Google Scholar] [CrossRef]
  15. Ramirez-Vallejo, P.; Kelly, J.D. Traits related to drought resistance in common bean. Euphytica 1998, 99, 127–136. [Google Scholar] [CrossRef]
  16. Julius, P.M.; Susan, N.; Magdalena, N.W.; Jean. Assessment of the effects of water stress on seed yield of common bean genotypes. Afr. J. Agric. Res. 2020, 16, 1069–1077. [Google Scholar] [CrossRef]
  17. Urrea, C.A.; Yonts, C.D.; Lyon, D.J.; Koehler, A.E. Selection for drought tolerance in dry bean derived from the Mesoamerican gene pool in western Nebraska. Crop Sci. 2009, 49, 2005–2010. [Google Scholar] [CrossRef]
  18. Smith, M.R.; Dinglasan, E.; Veneklaas, E.; Polania, J.; Rao, I.M.; Beebe, S.E.; Merchant, A. Effect of Drought and Low P on Yield and Nutritional Content in Common Bean. Front. Plant Sci. 2022, 13, 4325. [Google Scholar] [CrossRef]
  19. Farooq, M.; Gogoi, N.; Barthakur, S.; Baroowa, B.; Bharadwaj, N.; Alghamdi, S.S.; Siddique, K.H.M. Drought Stress in Grain Legumes during Reproduction and Grain Filling. J. Agron. Crop Sci. 2017, 203. [Google Scholar] [CrossRef]
  20. Dipp, C.C.; Marchese, J.A.; Woyann, L.G.; Bosse, M.A.; Roman, M.H.; Gobatto, D.R.; Paludo, F.; Fedrigo, K.; Kovali, K.K.; Finatto, T. Drought stress tolerance in common bean: What about highly cultivated Brazilian genotypes? Euphytica 2017, 213, 102. [Google Scholar] [CrossRef]
  21. Abbam, T.; Johnson, F.A.; Dash, J.; Padmadas, S.S. Spatiotemporal Variations in Rainfall and Temperature in Ghana over the Twentieth Century, 1900–2014. Earth Sp. Sci. 2018, 5, 120–132. [Google Scholar] [CrossRef]
  22. Beebe, S.; Rao, I.M.; Blair, M.W.; Butare, L. Breeding for abiotic stress tolerance in common bean: Present and future challenges. Australas. Plant Breed. SABRAO Conf 2009, 14, 1–12. [Google Scholar]
  23. Karmalkar, A.V.; Bradley, R.S. Consequences of global warming of 1.5 °C and 2 °C for regional temperature and precipitation changes in the contiguous United States. PLoS ONE 2017, 12, e0168697. [Google Scholar] [CrossRef]
  24. Thompson, L.G. Climate change: The evidence and our options. Behav. Anal. 2010, 33, 153–170. [Google Scholar] [CrossRef]
  25. Beebe, S.E.; Rao, I.M.; Blair, M.W.; Acosta-Gallegos, J.A. Phenotyping common beans for adaptation to drought. Front. Physiol. 2013, 4, 35. [Google Scholar] [CrossRef]
  26. Pornaro, C.; Macolino, S.; Menegon, A.; Richardson, M. WinRHIZO technology for measuring morphological traits of bermudagrass stolons. Agron. J. 2017, 109, 3007–3010. [Google Scholar] [CrossRef]
  27. Wang, M.B.; Zhang, Q. Issues in using the WinRHIZO system to determine physical characteristics of plant fine roots. Shengtai Xuebao/Acta Ecol. Sin. 2009, 29, 136–138. [Google Scholar] [CrossRef]
  28. Camilo, S.; Odindo, A.O.; Kondwakwenda, A.; Sibiya, J. Root traits related with drought and phosphorus tolerance in common bean (Phaseolus vulgaris L.). Agronomy 2021, 11, 552. [Google Scholar] [CrossRef]
  29. Polania, J.; Rao, I.M.; Cajiao, C.; Grajales, M.; Rivera, M.; Velasquez, F.; Raatz, B.; Beebe, S.E. Shoot and root traits contribute to drought resistance in recombinant inbred lines of MD 23–24 × SEA 5 of common bean. Front. Plant Sci. 2017, 8, 296. [Google Scholar] [CrossRef]
  30. Hernández, G.; Ramírez, M.; Valdés-López, O.; Tesfaye, M.; Graham, M.A.; Czechowski, T.; Schlerethdrey, M.; Erban, A.; Wan, A.; Cheung, F.; et al. Phosphorus stress in common bean: Root transcript and metabolic responses. Plant Physiol. 2007, 144, 752–767. [Google Scholar] [CrossRef]
  31. Beebe, S.E.; Rao, I.M.; Cajiao, C.; Grajales, M. Selection for drought resistance in common bean also improves yield in phosphorus limited and favorable environments. Crop Sci. 2008, 48, 582–592. [Google Scholar] [CrossRef]
  32. Ontel, I.; Irimescu, A.; Boldeanu, G.; Mihailescu, D.; Angearu, C.V.; Nertan, A.; Craciunescu, V.; Negreanu, S. Assessment of soil moisture anomaly sensitivity to detect drought spatio-temporal variability in romania. Sensors 2021, 21, 8371. [Google Scholar] [CrossRef]
  33. Chaves, M.M.; Maroco, J.P.; Pereira, J.S. Understanding plant responses to drought—From genes to the whole plant. Funct. Plant Biol. 2003, 30, 239–264. [Google Scholar] [CrossRef]
Figure 1. A graph of temperature-humidity-dew conditions from the vegetative growth to the post-flowering period of common bean in a screen-house, obtained using a Supco® data logger sensor.
Plants 11 02352 g001
Table 1. Statistics of temperature and humidity conditions at the screen-house.
ParameterNMeanStdErrStdDevMinMax
Temperature (°C)39130.180.356.8318.7846.72
Rel. Humidity (%)39167.861.1422.5517.7597.9
Dew Point (°C)39122.280.132.487.2325.94
N = 3 h interval temperature data point from the period of emergence through flowering to physiological maturity; Min = minimum; Max = maximum; StdErr = standard error of mean; StdDev = standard deviation of mean.
Table 2. Day and night temperature conditions at the screen-house.
VariableNighttime
Temperature (°C)
Daytime
Temperature (°C)
Avg. Temp24.9535.45
Max. Temp30.7246.72
Min. Temp18.7823.08
Table 3. Day and night relative humidity conditions at the screen-house.
VariableNighttime
% Rel. Humidity
Daytime
% Rel. Humidity
Avg. Rel. Humidity84.8450.78
Max. Rel. Humidity97.990.45
Min. Rel. Humidity53.9517.75
Table 4. Pearson’s correlation coefficients for temperature, relative humidity and dew for N = 391 data points.
Temp (°C)Rel. Humidity (%)Dew Point (°C)
Temp (°C)1
Rel. Humidity (%)−0.935 ***1
Dew Point (°C)0.095 ns0.214 ***1
*** = Significant at 0.001; ns = not significant at 0.05.
Table 5. Flowering and pod formation characteristics of 478 drought-tolerant common bean plants in factorial experiments with phosphorus–water treatments under sheltered-roof screen-house conditions.
Reproductive Character
Status on Bean Genotypes
Phosphorus–Water Factorial TreatmentsFrequency
Occurrence
Percentage
Occurrence
No FlowerP1W1204.18
No FlowerP1W2173.56
No FlowerP2W15411.3
No FlowerP2W25010.46
Total Not Flowered 14129.5
Flower AbortedP1W1153.14
Flower AbortedP1W2163.35
Flower AbortedP2W1153.14
Flower AbortedP2W2245.02
Total Flower Aborted 7014.65
Pod AbortedP1W15912.34
Pod AbortedP1W25411.3
Pod AbortedP2W1316.49
Pod AbortedP2W2245.02
Total Pod Aborted 16835.15
Pod MaturedP1W1265.44
Pod MaturedP1W2336.9
Pod MaturedP2W1204.18
Pod MaturedP2W2204.18
Total Pod Matured 9920.7
SAS General Linear Model (GLM) ANOVA at alpha = 0.05; Treatment Code: P1W1 = low P + low-water; P1W2 = low P + well-watered; P2W1 = optimum P + low water; P2W2 = optimum P + well-watered.
Table 6. Non-flowering frequency of drought-tolerant common bean genotypes during terminal drought.
GenotypeFrequency
Occurrence
Percent
Occurrence
Cumulative FrequencyCumulative Percentage
AWASH171.4671.46
BFS3040.84112.3
BFS3551.05163.35
BFS3910.21173.56
BFS5520.42193.98
BFS5961.26255.24
BFS6010.21265.45
BFS6210.21275.66
ENNEPA (check)91.88367.54
SEF1710.21377.75
SEF6010.21387.96
SEF7320.42408.38
SMC14651.05459.43
SMC15540.844910.27
SMC15771.465611.73
SMC15891.886513.61
SMC15981.677315.28
SMC16040.847716.12
SMC16151.058217.17
SMN5881.679018.84
SMN6381.679820.51
SMR10181.6710622.18
SMR10320.4210822.6
SMR10730.6311123.23
SMR113112.312225.53
SMR118102.0913227.62
SMR12751.0513728.67
SMR12840.8414129.51
Table 7. Flower abortion frequency of drought-tolerant common bean genotypes during terminal drought.
GenotypeFrequency
Occurrence
Percent
Occurrence
Cumulative
Frequency
Cumulative
Percentage
AWASH110.2110.21
BFS3020.4230.63
BFS3540.8471.46
BFS3951.05122.51
BFS5530.63153.14
BFS5910.21163.35
BFS6020.42183.77
BFS6230.63214.39
ENNEPA (check)30.63245.02
SEF1710.21255.23
SEF2820.42275.65
SEF4410.21285.86
SEF5310.21296.07
SEF6210.21306.28
SEF7310.21316.49
SMC14610.21326.69
SMC15530.63357.32
SMC15740.84398.16
SMC15830.63428.79
SMC15930.63459.41
SMC16040.844910.25
SMC16120.425110.67
SMN5840.845511.51
SMN6310.215611.72
SMR10120.425812.13
SMR10320.426012.55
SMR10720.426212.97
SMR11310.216313.18
SMR11820.426513.6
SMR12730.636814.23
SMR12820.427014.64
Table 8. Pod abortion frequency of drought-tolerant common bean accessions during terminal drought.
GenotypeFrequency
Occurrence
Percent
Occurrence
Cumulative FrequencyCumulative Percentage
AWASH120.4220.42
BFS3061.2681.68
BFS3530.63112.31
BFS3961.26173.57
BFS5571.46245.03
BFS5930.63275.66
BFS6091.88367.54
BFS6251.05418.59
BFS67122.515311.1
SEF1030.635611.73
SEF1751.056112.78
SEF2871.466814.24
SEF2971.467515.7
SEF4461.268116.96
SEF4720.428317.38
SEF5271.469018.84
SEF53112.310121.14
SEF5540.8410521.98
SEF6010.2110622.19
SEF6430.6310922.82
SEF7391.8811824.7
SMC14651.0512325.75
SMC15551.0512826.8
SMC15710.2112927.01
SMC16040.8413327.85
SMC16151.0513828.9
SMN6330.6314129.53
SMR10120.4214329.95
SMR10381.6715131.62
SMR10771.4615833.08
SMR12740.8416233.92
SMR12861.2616835.18
Table 9. Seed-podding frequency of drought-tolerant bean genotypes during terminal drought under screen-house conditions.
GenotypeFrequency
Occurrence
Percent
Occurrence
Cumulative FrequencyCumulative Percentage
AWASH120.4220.42
BFS5920.4240.84
BFS6230.6371.47
SEF1091.88163.35
SEF15122.51285.86
SEF1740.84326.7
SEF2820.42347.12
SEF2951.05398.17
SEF4451.05449.22
SEF47102.095411.31
SEF5251.055912.36
SEF5581.676714.03
SEF60102.097716.12
SEF62112.38818.42
SEF6491.889720.3
SMC14610.219820.51
SMC15910.219920.72
Table 10. Effect of phosphorus–water treatments on root-length of common bean.
Treatment LevelsNMean Total Root Length (cm)Mean StdErrMin. LengthMax.
Length
P1W1345453.82692.33488.4117,209.56
P1W1357605.21540.572221.3714,141.84
P2W1328017.05907.61142.6919,636.44
P2W23410,882.05578.545413.1617,714.55
Table 11. Effects phosphorus–water treatments on root surface area (cm2) of common bean.
Treatment LevelsNMean Root Surface Area (cm2)Mean StdErrMin. Surface AreaMax. Surface
Area
P1W134410.5855.2431.461299.13
P1W235600.3744.42147.991238.19
P2W132650.1877.7412.981692.43
P2W234907.1749.73449.361468.25
Table 12. Effects of phosphorus–water treatment on root diameter (mm) of common bean.
Treatment LevelsNMean Root Diameter (mm)Mean StdErrMin. DiameterMax. Diameter
P1W1340.820.10.192.07
P1W2351.190.080.432.5
P2W1321.190.130.212.76
P2W2341.640.10.753.08
Table 13. Effects of phosphorus–water treatments on root volume (cm3) of common bean.
Treatment LevelsNMean Root Volume (cm3)Mean StdErrMin. VolumeMax. Volume
P1W1342.510.360.167.83
P1W2353.810.30.798.64
P2W1324.240.540.0911.62
P2W2346.080.362.910.27
Table 14. Response of root characteristics of seed-podded, drought-tolerant common bean genotypes measured using WinRhizo under phosphorus and moisture treatments during terminal drought.
Common Bean
Genotype
Mean Root Length (cm)Mean Surface Area (cm2)Average Root Diameter (mm)Mean Root
Volume (cm3)
AWASH110,359.04825.641.345.27
BFS599466.82744.261.414.72
BFS627880.31652.211.264.39
SEF109630.07772.491.415.00
SEF155518.09424.080.832.62
SEF178084.45650.051.324.22
SEF2810,929.92879.141.585.68
SEF299923.6803.751.595.23
SEF446749.95550.070.973.61
SEF474833.63382.980.792.44
SEF529654.93825.691.65.66
SEF5510,203.17813.871.435.24
SEF603013.99224.020.471.34
SEF626468.47489.130.922.97
SEF647983.79610.031.113.74
SEF736272.054890.973.08
SMC1465112.894350.973.02
SMC15910,307.57872.811.645.93
CV %39.4642.8243.9247.7
Mean7986.28641.641.214.16
MSE3151.16274.760.531.98
R-square0.760.750.690.73
Coefficient of variation of all root trait measurements, measured using a WinRhizo analyzer. Values ranged from 39–47% with R-square index values also ranging from 0.73–0.76 (Table 14).
Table 15. Means (pooled) of soil moisture content (m3/m3) in potted soil of pod-seeded common bean plants during a 14-day terminal drought stress period under phosphorus–water treatment in a screen-house.
DaysP1W1 Soil Moisture (m3/m3)P2W1 Soil Moisture (m3/m3)
10.250.24
20.170.13
30.10.07
40.020.01
5−0.01−0.01
6−0.03−0.06
7−0.03−0.06
8−0.04−0.07
9−0.06−0.08
10−0.06−0.09
11−0.07−0.09
12−0.07−0.09
13−0.07−0.09
14−0.09−0.09
P1W1 = low phosphorus and moisture stress; P2W1 = optimum phosphorus and moisture stress.
Table 16. List of selected best 40 performing drought-tolerant common bean lines used in screen-house experiment.
1.SMR_11311. SEF_2921. SMC_16031. SEF_62
2. SMC_15812. BFS_3522. SEF_6432. SMC_161
3. SEF_1713. BFS_6023. BFS_5933. SMC_146
4. SMN_6314. SMR_10724. SEF_2834. SEF_47
5. SMN_5815. BFS_3925. SEF_5535. BFS_67
6. BFS_3016. SMC_15526. SEF_1036. ENNEPA (non-drought check)
7. SMC_15917. SMR_10327. SEF_5237. SEF_15
8. SMR_11818. SMR_10128. BFS_6238. SMR_129
9. SMC_15719. AWASH_129. SMR_12839. BFS_55
10. SMR_12720. SEF_6030. SEF_4440. SEF_68
Table 17. Illustration of the factorial experiment.
T1 = P1W1T2 = P1W2T3 = P2W1T4 = P2W2
Key: P1 = Low Phosphorus; P2 = Optimum Phosphorus: W1 = Low-Watered; W2 = Well-Watered. T1–T4 = Respective Treatments.
Table 18. Chemical analysis of soil used in the screen-house experiment.
SamplepHAvailable
P (mg/kg)
% Total NExch. Bases (cmol/kg)Exch. Acidity (cmol/kg)% Org.
Carbon
% Org.
Matter
KCaMgNaAlH
Soil Sample6.555.4450.08240.1351.511.040.0420.5080.3451.0771.857
Table 19. Physical analysis of soil used in the screen-house experiment.
Sample% Sand%Clay% SiltTextural ClassWater Holding Capacity
Soil Sample83.206.4010.40Loamy sand14
Publisher’s Note: MDPI stays neutral with regard to jurisdictional claims in published maps and institutional affiliations.

