Abstract
Eggplant is one of the most economically and nutritionally important vegetables worldwide. The study of the association of phenotypic traits with genetic factors is vital for the rapid and efficient identification and selection of eggplant genetic resources for breeding purposes with desired traits. The eggplant resources (587) collected from different countries, including Korea, were used for establishing the core collection. A total of 288 accessions were selected from 587 Solanum accessions based on 52 single nucleotide polymorphisms (SNPs) markers together with 17 morphological traits. This core collection was further used to analyze the genetic associations of eggplant morphological variations. A large variation was found among the evaluated eggplant accessions for some agro-morphological traits. Stem prickles and leaf prickles showed a significant positive correlation (r = 0.83***), followed by days to flowering and days to maturity (r = 0.64***). A total of 114,981 SNPs were filtered and used for phylogenetic tree analysis, population structure analysis, and genome-wide association study (GWAS). Among the agro-morphological traits, significantly associated SNPs were found for six traits. A total of 377 significantly associated SNPs with six agro-morphological traits were identified. These six traits and the number of SNPs were: days to maturity (51), flower size (121), fruit width (20), harvest fruit color (42), leaf prickles (38), and stem prickles (105). The largest fraction of significant SNPs (11.94%) was obtained on chromosome Ch01, followed by Ch07 and Ch06 with 11.67% and 10.08%, respectively. This study will help to develop markers linked to the most important agro-morphological traits of eggplant genetic resources and support the selection of desirable traits for eggplant breeding programs.
1. Introduction
Eggplant (Solanum melongena L.), a member of the Solanaceae family, is a popular vegetable in Africa, Asia, and Southern Europe [1]. In India and China, eggplant is the third most important solanaceous crop after potatoes and tomatoes [2]. Eggplant is a reliable source of vitamins, minerals, and antioxidants in the human diet. Many of the breeding objectives of vegetable and fruit crops (mainly yield, resistance, or tolerance to biotic and abiotic stresses) are shared by the eggplant. However, there are some specific eggplant breeding traits that include aiming to develop prickleless (stem, leaf, and calyx) eggplant varieties and reduce fruit bitterness [3].
The availability of diverse genetic materials is critical for the development of new crop varieties [4]. Crops with a narrow genetic basis are vulnerable to new diseases and other constraints that reduce production, which can result in significant declines in areas of adaptation [5]. It is becoming increasingly important to develop new eggplant varieties with higher yields and improved agronomic characteristics such as optimal plant architecture and fruit shape, low risk of deterioration during transport, and longer storability. Despite the economic importance of eggplant improvement, its genome has received less attention than that of closely related Solanaceae species: tomato, potato, and pepper [3]. However, eggplant breeders have recently begun using marker-assisted selection.
Linkage mapping has revealed the genetic basis of certain fruit and plant morphological traits in both intra-specific [3] and inter-specific [6,7,8] populations. In a pioneering attempt to apply a genome-wide association (GWA) approach, Ge et al. [9] were able to identify some phenotype-genotype associations for eight fruit-related traits. The identification of quantitative trait loci (QTL) associated with several agronomic traits has been developed in eggplant, as has the improvement of genetic linkage map construction. For anthocyanin pigmentation, fruit morphology (weight, length, diameter, metabolic content, and shape), and prickleless, for example, several QTLs have been identified using an intraspecific F2 population and a 238-loci linkage map [2,3,6,10,11]. However, when compared to other vegetable crops such as tomato and cucumber, the identification and characterization of QTLs and functional genes underlying important agronomic traits in eggplant has lagged significantly, owing in part to the lack of a genetic linkage map with high-density markers. So far, with the help of next-generation sequencing (NGS) technologies, four eggplant reference genomes have been published [12,13,14,15], which would greatly facilitate developing a large number of SNP markers for genetic map construction, resulting in improved efficiency of fine gene mapping.
GWAS is a powerful technique for deciphering the genetic basis of complex phenotypes by exploiting naturally occurring genetic variability [16]. GWAS enables the detection of relationships between molecular markers and desirable traits with better mapping resolution than standard bi-parental populations and has been used to identify markers associated with desired traits in a variety of crops [17,18,19]. GWAS involves an assessment of the population structure of the diversity panel to determine the genetic relatedness of individuals and rule out erroneous associations [16,20] and relies on the use of a sufficiently large number of markers. Recent advancements in next-generation sequencing technology and SNP genotyping have given breeders more tools for characterizing genetic variation at high resolution and selecting desired traits when developing new varieties.
Therefore, the purpose of this study was to characterize the phenotypic features of eggplant germplasm and identify SNP markers associated with the agro-morphological traits. In this study, the GWAS panel included a total of 288 eggplant germplasms from different species and significantly associated SNP markers for some agro-morphological features were identified.
2. Results
2.1. Phenotypic Variation and Correlations of Eggplant Core Collection
The eggplant resources (587) collected from 50 countries, including 80 resources in the Philippines, 44 resources in China, and 16 resources in Korea, were used for establishing the core collection. A total of 288 eggplant resources were selected from 587 Solanum accessions based on 52 SNP markers together with agro-morphological traits. The available phenotype data for 17 traits was included in the selection of a representative core collection because the core sets selected using only genotype data could not represent the diversity of the entire collection, presumably due to limitations in the number of SNP markers used. This core collection was further used for a genome-wide association study.
Phenotypic characterization of 17 qualitative and quantitative agro-morphological traits was performed (Table 1 and Table 2) for 288 germplasms. Of the eggplant collections evaluated, 260 accessions (90.28%) had an intermediate growth habit, 15 (5.21%) had an upright growth habit, and 13 (4.51%) had a prostrate growth habit. Most eggplants lacked anthocyanin pigmentation on the hypocotyl and fully developed stems. Also, the majority of the eggplant accessions had no prickles on the stem, leaf, or calyx. Regarding flower size, 33 (11.46%) accessions had small (2 cm) flowers, 250 (86.81%) had medium (2–3 cm) flowers, and 5 (1.74%) had large flowers. Flower colors were purple (61.11%), light purple (21.18%), white (16.32%), and white and purple (mixed) (1.39%). The predominant immature fruit colors of eggplant germplasm were green and purple with 38.19% and 36.11%, respectively. As for fruit color at maturity, purple (40.28%) and green (22.57%) were the two most common colors among eggplant germplasm. The majority of eggplant germplasms had light brown (tan) and yellow fruit at harvest (47.22% and 37.50%, respectively). Table 2 presents the minimum, maximum, averages, and standard deviations of quantitative agro-morphological data for 288 eggplant core collections. The plant height of eggplants ranged from 13.20 cm to 210 cm. The average plant height, fruit width, fruit length, days to flowering, and days to maturity were 87.76 cm. 5.77 cm, 16.80 cm, 110, and 156 days, respectively (Table 2).

Table 1.
The summary of qualitative agro-morphological traits of 288 eggplant collection.
Table 2.
The summary of quantitative agro-morphological traits of 288 eggplant collection.
The correlation between agro-morphological characteristics is shown in Figure 1. Anthocyanin pigmentation of the hypocotyl and stem showed a positive correlation (r = 0.23 ***). Of 288 eggplant germplasm samples, 58 had pigmented hypocotyls and 230 did not. Similarly, a large number of accessions (202) lacked anthocyanin pigmentation on the stems, whereas the remaining 86 accessions had pigmented stems. There was a significant, strong positive correlation between stem prickles and leaf prickles (r = 0.83***). The majority of eggplant genetic resources did not have prickles on the stems (266 germplasms) or leaves (257 germplasms). A strong positive correlation (r = 0.61***) was found between days to flowering and days to maturity. As shown in Figure 1, the agro-morphological traits were grouped into four main clusters according to the correlation coefficient values. The first cluster (I) comprised five agro-morphological traits; fruit color at harvest, stem prickles, leaf prickles, days to flowering and days to maturity. There was a strong positive correlation among traits within the first cluster. The second cluster included flower color, immature fruit color, flower size, and fruit shape. The correlation within the second (II) cluster was positive and moderate. The third cluster (III) contained hypocotyl anthocyanin, calyx prickles, fruit length and fruit width, whereas the fourth cluster (IV) comprised stem anthocyanin, mature fruit color, growth habit and plant height. There was a moderate to high negative correlation between the traits of clusters I and II. The agro-morphological traits of clusters I and III had a weak positive to weak negative correlation, whereas clusters I and IV had a weak positive to moderate negative correlation. The correlation between clusters II and III traits was moderate positive to weak negative.
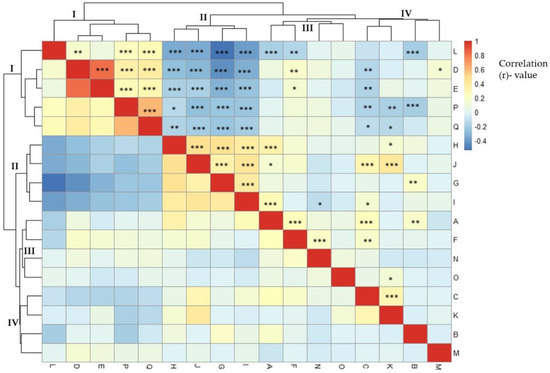
Figure 1.
Pearson’s correlation of phenotypic traits of eggplant accessions in a clustered heatmap. (A: hypocotyl anthocyanin, B: growth habit, C: stem anthocyanin, D: stem prickles, E: leaf prickles, F: calyx prickles, G: flower size, H: flower color, I: fruit shape, J: immature fruit color, K: mature fruit color, L: fruit color at harvest, M: plant height, N: fruit length, O: fruit width, P: days to flowering, and Q: days to maturity). Significant correlation indicated with asterisks (* p < 0.05; ** p < 0.01; *** p < 0.001).
Principal component analysis (PCA) plot was generated using the phenotypic data of 288 eggplant accessions (Figure 2). The first five PCs explained 57.6% of the total variance. PC1 accounted for 22.2% of total phenotypic variation. Stem prickles, immature fruit color, flower size, fruit shape, and flower color were the top five contributors of agro-morphological-related traits to PC1. Meanwhile, PC2, which was primarily associated with calyx prickles, hypocotyl anthocyanin, stem prickles, and flower color, explained 11.2% of the total variance. The positively and negatively correlated agro-morphological traits and the corresponding individual eggplant genetic resources are visualized in Figure 2A,B. The fruit color at harvest (L) was positively correlated and showed a wide distance from other variables (Figure 2A) and most of the germplasm (Figure 3) corresponded with fruit harvest color (code: 363, 155, 467, 349, 341, 504, etc.) had red-colored fruits at the ripening stage.
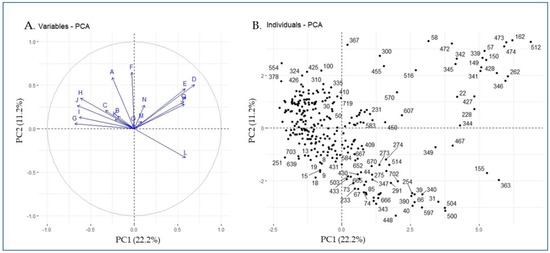
Figure 2.
PCA plot based on the phenotypic data of 288 eggplant accessions (A: variables and B: individuals; each dot represents a single accession). Letters (A–Q) on the PCA plots indicate phenotype traits; A: hypocotyl anthocyanin, B: growth habit, C: stem anthocyanin, D: stem prickles, E: leaf prickles, F: calyx prickles, G: flower size, H: flower color, I: fruit shape, J: immature fruit color, K: mature fruit color, L: fruit color at harvest, M: plant height, N: fruit length, O: fruit width, P: days to flowering, and Q: days to maturity.
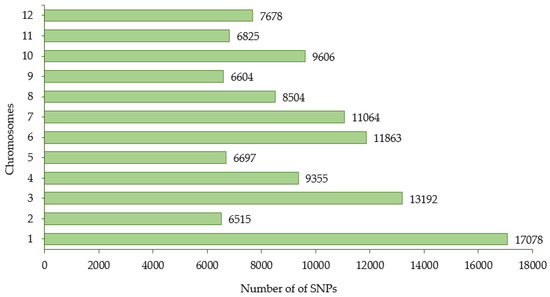
Figure 3.
The distribution of SNPs generated from 288 eggplant genetic resources across 12 chromosomes.
2.2. Genotyping-by-Sequencing and SNP Calling
The GBS library was constructed from 288 eggplant accessions and sequenced using the Illumina Hiseq 2000 platform (Illumina, Madison, WI, USA) and generated approximately 2.2 billion reads with an average mapping depth of 25.41× for a single accession. Table 3 and Table 4 present a summary of these sequencing results. The summary of the reference genome, including chromosome length (bp), number of transcripts, transcript length (bp), and CDS length (bp) for each chromosome is presented in Supplementary Table S1. The genotyping of the eggplant core collection detected 1,859,683 SNPs covering 12 chromosomes. A total of 114,981 SNPs were obtained after filtering the frequency of minor alleles (>5%) and missing data (<30%) (Table 5). The number of SNPs retained on each chromosome is presented in Figure 3.
Table 3.
Summary of sequencing raw data.
Table 4.
Raw and trimmed sequence statistics.
Table 5.
Statistics of SNP filtering process.
2.3. Population Structure and Phylogenetic Tree Analysis
The population structure of the 288 eggplant genetic resources was inferred using STRUCTURE (v. 2.3.4) software (Pritchard et al., 2000). Admixture model-based simulations were carried out by varying K from 1 to 10 with 10 iterations. The estimated likelihood (lnP (D)) was greatest for K = 3 (Supplementary Figure S1), suggesting the presence of three main populations in the eggplant genetic resources panel (Figure 4). The PCA and DAPC of the eggplant population were analyzed and presented in Figure 5A,B. The PCA showed that the first three components comprised approximately 71.6% of the total variation and allowed the population to be categorized into three groups. The first PC comprised 45%, whereas the second and third comprised 24% and 2.6%, respectively. The eggplant genetic resources population was divided into three groups (blue, red, and green) as presented in the PCA and DAPC. Supplementary Table S2 contains information on the Admixture groups. The neighbor-joining (NJ) analysis of the entire population (288 eggplant accessions) is presented in Figure 6. As shown in the phylogenetic tree, many clusters were formed based on 114,981 SNPs.
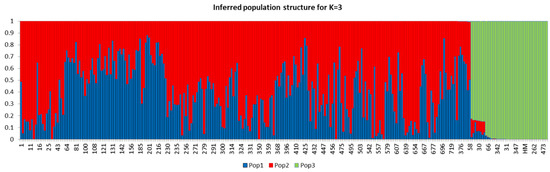
Figure 4.
Population structure of 288 eggplant germplasms based on SNPs markers (5000, randomly selected). At K = 3, the population were estimated to be three (Pop1, Pop2, Pop3) based on STRUCTURE analysis.
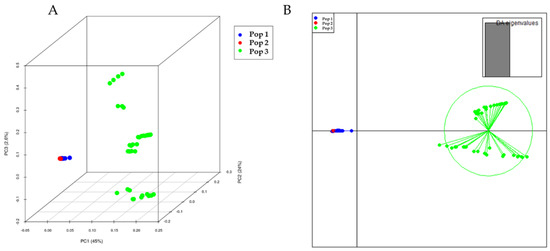
Figure 5.
The 3D PCA (A) and DAPC (B) of 288 eggplant genetic resources based on 114,981 SNPs. Each color represents the population inferred by the structure program. The first three principal components; PC1, PC2, and PC3 accounted for 45%, 24% and 26.6%, respectively.
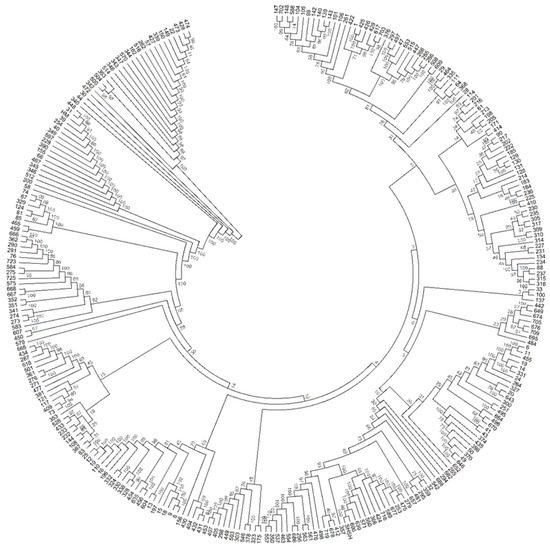
Figure 6.
The evolutionary history was inferred using the Neighbor-Joining method. The optimal tree with the sum of branch length = 5.02 is shown. The evolutionary distances were computed using the Maximum Composite Likelihood method and are in the units of the number of base substitutions per site. Bootstrap percentages test of 1000 replicates are shown next to the branches. The analysis involved 288 nucleotide sequences. All ambiguous positions were removed for each sequence pair. There was a total of 114,981 positions in the final dataset. Evolutionary analyses were conducted in MEGA6. Each number/code outside the branch represents the eggplant accessions.
2.4. Genome-Wide Association Analysis
A genetic association study was conducted to identify SNPs associated with qualitative and quantitative agro-morphological traits. The GWAS results of 17 agro-morphological traits were visualized in Manhattan (Figure 7) and QQ plots (Supplementary Figure S2). Among the 17 agro-morphological traits, significantly associated SNPs were found for six traits (Supplementary Table S3 and Figure 7). The Bonferroni-corrected threshold (-log p > 6.34) was used as a cut-off to identify marker-trait associations. A total of 377 significant SNPs associated with six agro-morphological traits were identified. These six traits (number of SNPs) were: days to maturity (51), flower size (121), fruit width (20), harvest fruit color (42), leaf prickles (38), and stem prickles (105). All SNPs significantly linked to six agro-morphological traits are presented in Supplementary Table S3. Among the significantly associated SNPs, the top 10 SNPs based on the log10 p-value for six agro-morphological traits are presented in Table 6. The largest fraction of significant SNPs (11.94%) was found on Ch01, followed by Ch07 and Ch06 with 11.67% and 10.08%, respectively. The smallest fraction of significant SNP markers (4.24% with 16 SNPs) was found on Ch12 for days to maturity (two), flower size (seven), fruit color at harvest (two), leaf prickle (one), and stem prickle (four). Except for Ch07 and Ch11, SNPs that were significantly associated with leaf prickles were found on all chromosomes.
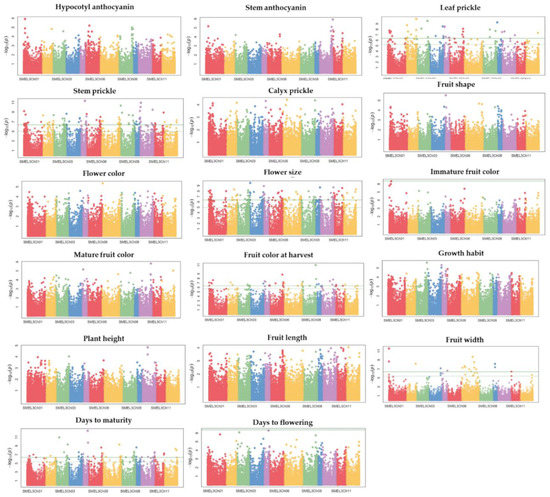
Figure 7.
Manhattan plot depicting the association of 17 agro-morphological traits using 288 eggplant genetic resources. Each dot represents a single SNP, with the X-axis showing genomic location (chromosomes: colored and labeled) and Y-axis showing association level. The horizontal, green line represents the cut-off of the significant association.
Table 6.
Top 10 significantly associated SNPs with leaf prickles, stem prickles, flower size, fruit width, fruit color at harvest and days to maturity.
The number of significant SNPs associated with leaf prickles were seven on Ch02, six on Ch01 and Ch05, four on Ch04 and Ch06, three on Ch03, Ch08, and Ch10, and one on Ch09 and Ch11. Following flower size, the second highest number of significantly associated SNPs were found for stem prickles and located across all 12 chromosomes. The numbers of significantly associated SNPs with stem prickle found on Ch01, Ch08, Ch07, Ch10, and Ch05 were 14, 12, 11, 11, and 10, respectively. A relatively high number of significantly associated SNPs (121) were found for flower size across all 12 chromosomes. Of these SNPs, 15 were on Ch01, 14 on Ch04, 13 on Ch06 and Ch07, 12 on Ch03, and 11 on Ch10 and Ch11. Regarding fruit width, significantly associated SNPs were found only on a few chromosomes: Ch01 (three), Ch02 (one), Ch04 (one), Ch05 (two), Ch07 (nine), Ch09 (three), and Ch11 (one). Among the nine SNPs associated with fruit width located on Ch07, two of them were located in the intergenic region, and the other two were on genes that encode proteins with unknown functions. Among the SNPs associated with harvest color, seven were on Ch06, five on Ch01 and Ch07, and four on Ch03, Ch05, Ch08, and Ch10. Also, two SNPs were located on chromosomes Ch02, Ch09, Ch11, and Ch12. One SNP associated with harvest color was found in a gene that encodes sbt3, a subtilisin-like protease SBT3. Significantly associated SNPs with days to maturity were found on all chromosomes. Eight SNPs were located on Ch08, seven on Ch10, and six on Ch03 and Ch07 each. Relatively few SNPs associated with days to maturity were found on Ch05, Ch11, Ch01, Ch09, Ch12, and Ch02.
3. Discussion
The genetic diversity of plant genetic resources (PGRs), which provide useful alleles linked to plant development and improvement, is critical for the conservation and utilization of germplasm conserved in a gene bank [21,22]. DNA molecular markers provide valuable information for analyzing genetic diversity, genetic relationships, population structure, and core collections in a variety of crop species [23,24,25,26,27,28]. Representative core collections have been selected in various crops using different sampling strategies and clustering methods [29,30,31,32,33,34]. The M strategy was reported to be a useful approach for selecting a core collection with high genetic diversity and a reasonable size [32]. In this study, a representative core collection was established by selecting 288 eggplant resources from 587 Solanum accessions for efficient germplasm management and further studies. The greater the genetic diversity of germplasm, the greater the likelihood of success in breeding desirable traits. Studying and understanding the association of agro-morphological trait variations with genetic variable sites may assist in the selection and transformation of desirable traits to develop new cultivars through breeding programs. Diverse agro-morphological variations (fruit and leaf) of eggplant germplasm were found in previous studies [35,36,37]. Similarly, in this study, eggplant genetic resources collected from different countries possessed diverse agro-morphological characteristics. The correlation between agro-morphological traits was estimated and a strong positive correlation was observed between some agro-morphological traits such as stem prickles and leaf prickles, days to flowering and days to maturity, and immature fruit color and mature fruit color.
SNP markers are regarded as potentially promising breeding tools for use in genetic mapping and marker-assisted selection since they can be scored in parallel experiments at a low cost [38]. SNP markers were utilized in this study to assess population structure metrics, phylogenetic trees, and marker-trait associations. The phylogenetic tree analysis was conducted, and the evolutionary relationships among germplasm were based on the SNPs presented in this study. Population structure and kinship analysis allowed the clustering of eggplant germplasm into three broad groups. The majority of the germplasms used in this study (240 germplasms) belonged to S. melongena. Population 1 (Pop1) and 2 (Pop2) were mainly germplasm belonging to S. melongena, and a few unknown (S. spp.) species were also clustered. As presented in the PCA and DAPC, the first two clusters did not separate from each other entirely. A few germplasms from one to five genotypes belonging to other species were clustered in Group 3 (42 germplasms). The possibility of genetic material hybridization (naturally or via breeders) and migration of genetic resources from place to place could be the reason for creating subpopulations within the same species.
Genome-wide association studies have proved its efficiency in finding genomic regions linked with economically important agronomical features in several crops, including wheat [39,40,41,42], eggplant [36], potato [43], and soybean [44,45]. There are important agro-morphological traits to be improved in eggplant, including the development of prickleless varieties. Although prickly varieties are preferred in some areas due to their perceived improved organoleptic quality, prickles are generally regarded as undesirable since they can puncture the skin of the fruits and are problematic during harvesting and storage [46]. Previous research on raspberry and blackberry prickles has revealed that they are epidermal tissue outgrowths of modified glandular trichomes (GTs); once the outermost cells become lignified, lignification continues inward and downward until the prickles become completely lignified and thus mature [47,48]. A phenotypic assessment of prickles in Solanum viarum Dunal indicated that they may be initiated by GTs or triggered by GT-derived signals [49]. Transcriptome studies in raspberry and S. viarum revealed several transcription factors (TFs) that may be involved in prickle development [49,50]. In this study, three SNPs in three transcription factor genes (Trihelix transcription factor ASIL2, Probable WRKY transcription factor 35, and Probable transcription factor At5g28040) were found to have a significant association with stem prickles. One of the three SNPs was linked to both leaf and stem prickles. This SNP was located on Ch01 (14404622 bp) in a transcription factor gene (Trihelix transcription factor ASIL2). The SNP that was located on Ch05 (2527410 bp) was majorly found in eggplant genetic resources that have prickles on the stem. Several QTLs for prickle have been found in eggplant on chromosomes 2, 6, 7, and 8 [3,8,51,52]. A recent work genetically located a Pl locus on chromosome 6, and produced a 0.5 kb presence/absence variant marker for prickleless eggplant selection [53].
Interestingly, one SNP on Ch01 was found to be strongly linked with fruit color at harvest and was situated in a gene that produces the acetylserotonin O-methyl transferase (ASMT) enzyme. ASMT was also involved in a variety of plant growth and development dynamics. ASMT is the final enzyme in melatonin biosynthesis and may have a rate-limiting role in plant melatonin production. Several studies in recent years have confirmed that tryptophan decarboxylase (TrpDC), tryptamine 5-hydroxylase (T5H), serotonin N-acetyltransferase (SNAT), and acetylserotonin-O-methyltransferase (ASMT) are involved in melatonin synthesis in plants [54,55]. Sun et al. found that an exogenous melatonin treatment promoted ripening and improved tomato fruit quality after harvest [56]. Similarly, exogenous melatonin induced strawberry ASMT expression and accelerated strawberry fruit ripening via the ABA pathway [57]. Melatonin-deficient ASMT rice, on the other hand, showed accelerated senescence in detached flag leaves as well as a significantly lower yield [58].
In a previous study, it was indicated that the width and length of each flower organ affect the entire flower size [59]. Also, another study showed flower disc diameter was positively correlated with disc area in sunflower [60]. Among the total of 121 SNPs associated with flower size, 22 SNPs were found in the intergenic regions and others were in protein-coding genes with known (82 SNPs) and unknown (17 SNPs) functions. In this study, 20 SNPs significantly associated with fruit width were found. In a previous study, seven SNPs were identified on Ch01 (1), Ch02 (2), Ch03 (1), Ch09 (1), and Ch12 (1) that were linked with tomato fruit width (two) [61]. Some of the most significantly associated SNPs with flower size were found in genes encoding pentatricopeptide repeat-containing protein At5g14770, probable histone chaperone ASF1A, Ultraviolet-B receptor UVR8, MACPF domain-containing protein At1g14780, G2/mitotic-specific cyclin-1, two-component response regulator ORR21, and adenosine triphosphatase (ARSA1 ATPase) (Table 6).
The number of days needed until maturity is an important agronomic trait to determine and select early and late mature crops. The early flowering plant had a shortened maturity period as supported by a strong positive correlation of days to flowering and days to maturity (r = 0.64***). In previous studies, several SNP markers associated with days to maturity have been found in different crops, such as Kersting’s groundnut [62]. In this study, a total of 51 SNPs were associated with days to maturity, and one SNP was located in a gene that codes for pentatricopeptide repeat-containing protein (PPR). Mutations in these PPR protein-coding genes lead to the dysfunction of mitochondria and/or chloroplasts, thereby resulting in growth retardation, pollen abortion, and seed development defects in plants [63], indicating the important roles of PPR proteins in plant growth and development [64]. As presented in Table 6, some of the highly significantly associated SNPs with days to maturity were found in genes that encode DNA ligase 4 (LIG4) (Ch03 at 2.5 Mbp), PPL1 PsbP-like protein 1 chloroplastic (Ch03 at 8.8 Mbp), 4-coumarate--CoA ligase-like 5 (4CLL5) (Ch05 at 3.8 Mbp), Actin-7 (Ch05 at 4.0 Mbp), PHYC Phytochrome C (Ch07 at 126.0 Mbp), and PAL5 phenylalanine ammonia-lyase. DNA ligase enzymes perform crucial roles in DNA replication and repair processes by catalyzing the joining of adjacent polynucleotides [65]. Eukaryotes have multiple DNA ligases with unique roles in DNA metabolism, with clear differences in the functions of DNA ligase orthologues in mammals, yeast, and plants. DNA ligase 4 (LIG4) is found in all eukaryotes and facilitates the final step in the DSB repair pathway known as non-homologous end joining (NHEJ) [65]. Waterworth et al. [66] studied the role of DNA ligases in seed germination in terms of vigor and viability after storage under suboptimal conditions, as seen in much of the developing world. The identification of DNA repair mechanisms critical for rapid germination and seed lifespan can help forecast seed lot storage and germination performance, and these DNA repair pathways represent prospects for crop development with improved seed storability and germination performance features [66]. The other three SNPs were also found to be significantly associated with days to maturity and are located on Ch06 (9.7 Mbp) and Ch12 (2.6 Mbp and 9.3 Mbp) in genes that encode proteins with unknown functions (Table 6).
4. Materials and Methods
4.1. Plant Materials and Establishment of Eggplant Core Collection
A total of 587 eggplant resources collected from 50 countries, including 80 resources in the Philippines, 44 resources in China, and 16 resources in Korea, were used to establish a core collection. These germplasms belong to different species. The eggplant seedlings (eight to ten in triplicates) were planted in the National Agrobiodiversity Center (NAC) greenhouse at the Rural Development Administration (RDA), Jeonju, the Republic of Korea in 2021. The eggplants were cultivated according to the RDA-recommended eggplant cultivation method.
To establish a core collection, 52 microsatellite markers (single sequence repeats: SSRs) were used along with 17 morphological traits. Among 587 eggplant resources, a representative 288 resources were selected as a core collection based on the advanced maximization (M) strategy using a modified heuristic algorithm implemented in PowerCore software [67]. This core collection was further used in this study to evaluate genetic-phenotypic associations. Supplementary Table S4 contains information on the 52 SSR primers. Supplementary Table S5 shows the introduction number (IT), species name, and geographic origin of the 288 eggplant core collection used in this study.
4.2. Phenotyping
A total of 17 agro-morphological traits were assessed. This includes hypocotyl anthocyanin, stem anthocyanin staining, growth habit, plant height (cm), stem-prickle, leaf prickle, calyx prickle, flower size, flower color, fruit length (cm), fruit width (cm), fruit shape, immature fruit color, mature fruit color, harvest fruit color, days to flowering, and days to maturity. Except for the quantitative parameters, the scales or scores were used to assess the agro-morphological differences of eggplant genetic resources. The agro-morphological characterization descriptions are presented in Supplementary Table S6.
4.3. DNA Extraction and Genotyping-by-Sequencing (GBS)
DNA was extracted from the samples using a Genomic DNA Prep Kit (Inclone Biotech, Korea) following the manufacturer’s instructions. The GBS libraries were created using the restriction enzyme ApeKI (5′-GCWGC-3′) and a protocol modified from previous research [68]. Oligonucleotides containing the top and bottom strands of each barcode adapter and a common adapter were diluted (separately) with TE (50 μM each) and annealed with a thermocycler. DNA samples (100 ng/L) were added to individual adapter-containing wells. Samples (DNA with adapters) were digested overnight at 75 °C with ApeKI (New England Biolabs, Ipswich, MA, USA). The digested DNA samples, each with a specific barcode adapter, were pooled (5 μL each) and purified using a commercial kit (QIAquick PCR Purification Kit; Qiagen, Valencia, CA, USA) according to the manufacturer’s protocol. Restriction fragments from each library were then amplified in 50 μL volumes containing 2 μL of pooled DNA fragments, HerculaseII Fusion DNA Polymerase (Agilent, CA, USA), and 25 pmol each of the following primers: (A) 5′-AATGATACGGCGACCACCGAGATCTACACTCTTTCCCTACACGACGCTCTTCCGATCT-3′ and (B) 5′-CAAGCAGAAGACGGCATACGAGATCGGTCTCGGCATTCCTGCTGAACCGCTCTTCCGATCT-3′.
Barcode sequences were used to perform demultiplexing. Adapter trimming was done using cutadapt (version 1.8.3) [69], and sequence quality was trimmed using DynamicTrim and LengthSort of the SolexaQA program (v.1.13) [70]. DynamicTrim cuts low-quality bases at both ends of short reads according to the Phred score and refines it with high-quality cleaned reads. LengthSort removes excess base cuts made in DynamicTrim; Phred score of Dynamic-Trim ≥ 20, and LengthSort using short read lengths ≥ 25 bp. BWA (Burrows-Wheeler Aligner, ver.0.6.1-r104) [71] generated cleaned reads passing the preprocessing process and performed mapping to the reference genome of Solanum melongena L. (https://solgenomics.net/ accessed on 19 September 2022). Mapping was a preliminary step to detect raw SNPs (In/Del) between the S. melongena genome (Eggplant genome consortium V4.1) and sequenced samples.
4.4. SNP Calling and Filtering
Clean reads were mapped to the reference genome sequence, and the obtained SAM files were used to discover raw SNPs using SAMtools (0.1.16) [72] and extract consensus sequences. SNP validation was conducted using SEEDERS in-house script [73] before SNP detection; raw SNP detection was performed, and default values were used except for the following options: a minimum mapping quality for SNPs (−Q) of 30, minimum mapping quality for gaps (−q) of 15, minimum read depth (−d) of 3, minimum InDel score for nearby SNP filtering (−G) of 30, SNPs within INT bp around a gap to be filtered (−w) of 15, window size for filtering dense SNPs (−W) of 30, and maximum read depth (−D) of 165.
An integrated SNP matrix was obtained between samples to assess SNPs between the assessed objects. A list of unions was generated by comparing each sample’s raw SNP sites to a standard template, and a non-SNP locus was filled in from the sample’s consensus sequence. The final SNP matrix was formed by filtering out the miscalled SNP sites using SNP comparison among samples. Based on the position, SNPs were classified as homozygous (SNP read depth ≥ 90%), heterozygous (40% ≤ SNP read depth ≤ 60%), etc., (homozygous/heterozygous; could not be separated by type). Based on the location information of the reference genome sequence (Solanum melongena L), the designated SNP positions were defined as “intergenic or genic regions”, and the genic region was further classed as “CDS or intron regions”.
4.5. Population Structure and Phylogenetic Tree Analysis
Population structure analysis was conducted using STRUCTURE software [74,75]. From 114,981 filtered SNPs loci of 288 genetic resources, 5,000 SNP loci at a level usable for analysis were randomly selected (six selected groups). Bayesian model-based approach with 10,000 burns in the period and 10,000 Markov Chain Monte Carlo (MCMC) was proposed. To find an appropriate K (population), K values were set from 1 to 10, and the number of iterations was 10. A web-based STRUCTURE HARVESTER [76] was used to determine the number of populations in the eggplant genetic resources panel. The appropriate K value was determined through the Delta K (ΔK) method [77]. The principal component analysis (PCA) [78] and discriminant analysis of principal components (DAPC) [79] were analyzed using the R program (SNPRelate and adegenet package).
The neighbor-joining method was used to infer the evolutionary history of the eggplant genetic resources using SNPs. The percentage of replicate trees in which the same clusters were formed, as determined by bootstrapping analysis (1000 replicates), is shown next to the branches. The tree is drawn to scale, with branch lengths in the same units as the evolutionary distances used to infer the phylogenetic tree. The evolutionary distances were calculated using the maximum composite likelihood method and are expressed in terms of the number of base substitutions per site. The analysis included 288 eggplant nucleotide sequences with the final dataset containing 114,981 SNPs. MEGA6 [80] was used to perform evolutionary analyses using the neighbor-joining method.
4.6. Genome-Wide Association Analysis and Candidate Genes Mining
Association analysis was performed using 114,981 union SNP datasets using a mixed linear model (MLM) [81] implemented with an R package called the genomic association and prediction integrated tool (GAPIT) [82]. The significant threshold after Bonferroni correction was 4.35 × 10⁻⁷ (0.05/114981). The candidate genes were identified using the BLAST searching tools for each SNP in the eggplant genome database.
4.7. Statistical Analysis
Data summarization and descriptive statistics on agro-morphological data were performed using the Microsoft Excel program. PCA, DAPC, and correlation were all performed using the R program (version 4.2.1). Other software programs used in this study are discussed in the Section 4.
5. Conclusions
Crop breeding schemes require important agro-morphological characteristics. Phenotypic characterization is a time-consuming process and may not be precise enough for selection when a huge germplasm pool is available for breeding. The study of genetic association with morphological variation and the identification of SNPs associated with key agro-morphological and yield-related traits are important for assisting the selection process with rapid and accurate prediction. This study provides a comprehensive result on the association of genetic and agro-morphological traits of eggplants and significantly associated SNP markers for six eggplant agro-morphological traits are presented. A total of 377 significantly associated SNPs were found for stem prickles, leaf prickles, flower size, fruit width, fruit color at harvest, and days to maturity. These SNPs can be used for further research and to identify markers with high efficiency. We recommend further exploring the genes’ functions where SNPs are found for a better understanding of the molecular mechanisms of agro-morphological variation in eggplant germplasm.
Supplementary Materials
The following supporting information can be downloaded at: https://www.mdpi.com/article/10.3390/plants11192627/s1, Figure S1: Delta K values for K ranging from 1 to 10. The best fitting K values (K = 3) was selected; Figure S2: The QQ plots resulting from GWAS analysis for 17 agro-morphological traits 288 eggplant genet; Table S1: Summary of reference genome; Table S2: Population structure result (K = 3); Table S3: Significantly associated SNPs (377) for six agro-morphological traits; Table S4: 52 SSR primers used for selection of core collection; Table S5: The information of 288 eggplant germplasms; Table S6: Agro-morphological traits descriptions.
Author Contributions
Conceptualization, N.R., G.-T.C. and D.Y.H.; methodology, J.L., Y.-J.L. and D.Y.H.; data curation, N.R., B.K., Y.-J.L. and G.-T.C.; data analysis, M.H., B.K., J.L. and N.R.; writing—original draft preparation, M.H. and N.R.; writing—review and editing, M.H., G.-T.C. and N.R. All authors have read and agreed to the published version of the manuscript.
Funding
This work was carried out with support of “Collection, regeneration of import prohibited plant genetic resources and establishment of characterization system, (Project No. PJ 014556022022)” National Institute of Agricultural Sciences, RDA, Republic of Korea.
Data Availability Statement
The datasets generated and analyzed for the current study are available in the supplementary file, and the remaining datasets are accessible upon reasonable request from the corresponding author.
Conflicts of Interest
The authors declare no conflict of interest.
References
- Polignano, G.; Uggenti, P.; Bisignano, V.; Gatta, C.D. Genetic Divergence Analysis in Eggplant (Solanum melongena L.) and Allied Species. Genet. Resour. Crop Evol. 2010, 57, 171–181. [Google Scholar] [CrossRef]
- Barchi, L.; Lanteri, S.; Portis, E.; Acquadro, A.; Valè, G.; Toppino, L.; Rotino, G.L. Identification of SNP and SSR Markers in Eggplant Using RAD Tag Sequencing. BMC Genom. 2011, 12, 304. [Google Scholar] [CrossRef]
- Portis, E.; Barchi, L.; Toppino, L.; Lanteri, S.; Acciarri, N.; Felicioni, N.; Fusari, F.; Barbierato, V.; Cericola, F.; Valè, G.; et al. QTL Mapping in Eggplant Reveals Clusters of Yield-Related Loci and Orthology with the Tomato Genome. PLoS ONE 2014, 9, e89499. [Google Scholar] [CrossRef] [PubMed]
- Glaszmann, J.; Kilian, B.; Upadhyaya, H.; Varshney, R. Accessing Genetic Diversity for Crop Improvement. Curr. Opin. Plant Biol. 2010, 13, 167–173. [Google Scholar] [CrossRef] [PubMed]
- Dyer, G.A.; López-Feldman, A.; Yúnez-Naude, A.; Taylor, J.E. Genetic Erosion in Maize’s Center of Origin. Proc. Natl. Acad. Sci. USA 2014, 111, 14094–14099. [Google Scholar] [CrossRef]
- Doganlar, S.; Frary, A.; Daunay, M.-C.; Lester, R.N.; Tanksley, S.D. Conservation of Gene Function in the Solanaceae as Revealed by Comparative Mapping of Domestication Traits in Eggplant. Genetics 2002, 161, 1713–1726. [Google Scholar] [CrossRef]
- Frary, A.; Doganlar, S.; Daunay, M.C.; Tanksley, S.D. QTL Analysis of Morphological Traits in Eggplant and Implications for Conservation of Gene Function during Evolution of Solanaceous Species. Theor. Appl. Genet. 2003, 107, 359–370. [Google Scholar] [CrossRef]
- Frary, A.; Frary, A.; Daunay, M.-C.; Huvenaars, K.; Mank, R.; Doğanlar, S. QTL Hotspots in Eggplant (Solanum melongena) Detected with a High Resolution Map and CIM Analysis. Euphytica 2014, 197, 211–228. [Google Scholar] [CrossRef]
- Ge, H.; Liu, Y.; Jiang, M.; Zhang, J.; Han, H.; Chen, H. Analysis of Genetic Diversity and Structure of Eggplant Populations (Solanum melongena L.) in China Using Simple Sequence Repeat Markers. Sci. Hortic. 2013, 162, 71–75. [Google Scholar] [CrossRef]
- Barchi, L.; Lanteri, S.; Portis, E.; Stàgel, A.; Valè, G.; Toppino, L.; Rotino, G.L. Segregation Distortion and Linkage Analysis in Eggplant (Solanum melongena L.). Genome 2010, 53, 805–815. [Google Scholar] [CrossRef]
- Toppino, L.; Barchi, L.; Lo Scalzo, R.; Palazzolo, E.; Francese, G.; Fibiani, M.; D’Alessandro, A.; Papa, V.; Laudicina, V.A.; Sabatino, L.; et al. Mapping Quantitative Trait Loci Affecting Biochemical and Morphological Fruit Properties in Eggplant (Solanum melongena L.). Front. Plant Sci. 2016, 7, 256. [Google Scholar] [CrossRef] [PubMed]
- Hirakawa, H.; Shirasawa, K.; Miyatake, K.; Nunome, T.; Negoro, S.; Ohyama, A.; Yamaguchi, H.; Sato, S.; Isobe, S.; Tabata, S.; et al. Draft Genome Sequence of Eggplant (Solanum melongena L.): The Representative Solanum Species Indigenous to the Old World. DNA Res. 2014, 21, 649–660. [Google Scholar] [CrossRef]
- Barchi, L.; Pietrella, M.; Venturini, L.; Minio, A.; Toppino, L.; Acquadro, A.; Andolfo, G.; Aprea, G.; Avanzato, C.; Bassolino, L.; et al. A Chromosome-Anchored Eggplant Genome Sequence Reveals Key Events in Solanaceae Evolution. Sci. Rep. 2019, 9, 11769. [Google Scholar] [CrossRef] [PubMed]
- Wei, Q.; Wang, J.; Wang, W.; Hu, T.; Hu, H.; Bao, C. A High-Quality Chromosome-Level Genome Assembly Reveals Genetics for Important Traits in Eggplant. Hortic. Res. 2020, 7, 153. [Google Scholar] [CrossRef] [PubMed]
- Li, D.; Qian, J.; Li, W.; Yu, N.; Gan, G.; Jiang, Y.; Li, W.; Liang, X.; Chen, R.; Mo, Y.; et al. A High-quality Genome Assembly of the Eggplant Provides Insights into the Molecular Basis of Disease Resistance and Chlorogenic Acid Synthesis. Mol. Ecol. Resour. 2021, 21, 1274–1286. [Google Scholar] [CrossRef] [PubMed]
- Korte, A.; Farlow, A. The Advantages and Limitations of Trait Analysis with GWAS: A Review. Plant Methods 2013, 9, 29. [Google Scholar] [CrossRef]
- Liu, N.; Xue, Y.; Guo, Z.; Li, W.; Tang, J. Genome-Wide Association Study Identifies Candidate Genes for Starch Content Regulation in Maize Kernels. Front. Plant Sci. 2016, 7, 1046. [Google Scholar] [CrossRef]
- Cui, C.; Mei, H.; Liu, Y.; Zhang, H.; Zheng, Y. Genetic Diversity, Population Structure, and Linkage Disequilibrium of an Association-Mapping Panel Revealed by Genome-Wide SNP Markers in Sesame. Front. Plant Sci. 2017, 8, 1189. [Google Scholar] [CrossRef]
- Xu, Y.; Li, P.; Yang, Z.; Xu, C. Genetic Mapping of Quantitative Trait Loci in Crops. Crop J. 2017, 5, 175–184. [Google Scholar] [CrossRef]
- Sul, J.H.; Bilow, M.; Yang, W.-Y.; Kostem, E.; Furlotte, N.; He, D.; Eskin, E. Accounting for Population Structure in Gene-by-Environment Interactions in Genome-Wide Association Studies Using Mixed Models. PLoS Genet. 2016, 12, e1005849. [Google Scholar] [CrossRef]
- D’hoop, B.B.; Paulo, M.J.; Kowitwanich, K.; Sengers, M.; Visser, R.G.F.; van Eck, H.J.; van Eeuwijk, F.A. Population Structure and Linkage Disequilibrium Unravelled in Tetraploid Potato. Theor. Appl. Genet. 2010, 121, 1151–1170. [Google Scholar] [CrossRef]
- Odong, T.L.; van Heerwaarden, J.; Jansen, J.; van Hintum, T.J.L.; van Eeuwijk, F.A. Determination of Genetic Structure of Germplasm Collections: Are Traditional Hierarchical Clustering Methods Appropriate for Molecular Marker Data? Theor. Appl. Genet. 2011, 123, 195–205. [Google Scholar] [CrossRef] [PubMed]
- Agrama, H.A.; Yan, W.; Lee, F.; Fjellstrom, R.; Chen, M.-H.; Jia, M.; McClung, A. Genetic Assessment of a Mini-Core Subset Developed from the USDA Rice Genebank. Crop Sci. 2009, 49, 1336–1346. [Google Scholar] [CrossRef]
- Belaj, A.; del Dominguez-García, M.C.; Atienza, S.G.; Martín Urdíroz, N.; De la Rosa, R.; Satovic, Z.; Martín, A.; Kilian, A.; Trujillo, I.; Valpuesta, V.; et al. Developing a Core Collection of Olive (Olea europaea L.) Based on Molecular Markers (DArTs, SSRs, SNPs) and Agronomic Traits. Tree Genet. Genomes 2012, 8, 365–378. [Google Scholar] [CrossRef]
- Oliveira, E.J.; Ferreira, C.F.; Santos, V.S.; Oliveira, G.A.F. Development of a Cassava Core Collection Based on Single Nucleotide Polymorphism Markers. Genet. Mol. Res. 2014, 13, 6472–6485. [Google Scholar] [CrossRef]
- Sa, K.J.; Kim, D.M.; Oh, J.S.; Park, H.; Hyun, D.Y.; Lee, S.; Rhee, J.H.; Lee, J.K. Construction of a Core Collection of Native Perilla Germplasm Collected from South Korea Based on SSR Markers and Morphological Characteristics. Sci. Rep. 2021, 11, 23891. [Google Scholar] [CrossRef] [PubMed]
- Wada, T.; Noguchi, Y.; Isobe, S.; Kunihisa, M.; Sueyoshi, T.; Shimomura, K. Development of a Core Collection of Strawberry Cultivars Based on SSR and CAPS Marker Polymorphisms. Hortic. J. 2017, 86, 365–378. [Google Scholar] [CrossRef]
- Zhang, C.; Chen, X.; Zhang, Y.; Yuan, Z.; Liu, Z.; Wang, Y.; Lin, Q. A Method for Constructing Core Collection of Malus Sieversii Using Molecular Markers. Sci. Agric. Sin. 2009, 42, 597–604. [Google Scholar]
- Franco, J.; Crossa, J.; Taba, S.; Shands, H. A Sampling Strategy for Conserving Genetic Diversity When Forming Core Subsets. Crop Sci. 2005, 45, 1035–1044. [Google Scholar] [CrossRef]
- Franco, J.; Crossa, J.; Warburton, M.L.; Taba, S. Sampling Strategies for Conserving Maize Diversity When Forming Core Subsets Using Genetic Markers. Crop Sci. 2006, 46, 854–864. [Google Scholar] [CrossRef]
- Hu, J.; Zhu, J.; Xu, H.M. Methods of Constructing Core Collections by Stepwise Clustering with Three Sampling Strategies Based on the Genotypic Values of Crops. Theor. Appl. Genet. 2000, 101, 264–268. [Google Scholar] [CrossRef]
- Marita, J.M.; Rodriguez, J.M.; Nienhuis, J. Development of an Algorithm Identifying Maximally Diverse Core Collections. Genet. Resour. Crop Evol. 2000, 47, 515–526. [Google Scholar] [CrossRef]
- Wang, J.C.; Hu, J.; Xu, H.M.; Zhang, S. A Strategy on Constructing Core Collections by Least Distance Stepwise Sampling. Theor. Appl. Genet. 2007, 115, 1–8. [Google Scholar] [CrossRef]
- Lee, H.-Y.; Ro, N.-Y.; Jeong, H.-J.; Kwon, J.-K.; Jo, J.; Ha, Y.; Jung, A.; Han, J.-W.; Venkatesh, J.; Kang, B.-C. Genetic Diversity and Population Structure Analysis to Construct a Core Collection from a Large Capsicum Germplasm. BMC Genet. 2016, 17, 142. [Google Scholar] [CrossRef] [PubMed]
- Cericola, F.; Portis, E.; Toppino, L.; Barchi, L.; Acciarri, N.; Ciriaci, T.; Sala, T.; Rotino, G.L.; Lanteri, S. The Population Structure and Diversity of Eggplant from Asia and the Mediterranean Basin. PLoS ONE 2013, 8, e73702. [Google Scholar] [CrossRef] [PubMed]
- Portis, E.; Cericola, F.; Barchi, L.; Toppino, L.; Acciarri, N.; Pulcini, L.; Sala, T.; Lanteri, S.; Rotino, G.L. Association Mapping for Fruit, Plant and Leaf Morphology Traits in Eggplant. PLoS ONE 2015, 10, e0135200. [Google Scholar] [CrossRef] [PubMed]
- Rani Datta, D.; Rafii Yusop, M.; Misran, A.; Jusoh, M.; Oladosu, Y.; Arolu, F.; Haque, A.; Sulaiman, M.N. Genetic Diversity in Eggplant (Solanum melongena L.) Germplasm from Three Secondary Geographical Origins of Diversity Using SSR Markers. Biocell 2021, 45, 1393–1401. [Google Scholar] [CrossRef]
- Bertioli, D.J.; Ozias-Akins, P.; Chu, Y.; Dantas, K.M.; Santos, S.P.; Gouvea, E.; Guimarães, P.M.; Leal-Bertioli, S.C.M.; Knapp, S.J.; Moretzsohn, M.C. The Use of SNP Markers for Linkage Mapping in Diploid and Tetraploid Peanuts. G3 Genes Genomes Genet. 2014, 4, 89–96. [Google Scholar] [CrossRef]
- Breseghello, F.; Sorrells, M.E. Association Mapping of Kernel Size and Milling Quality in Wheat (Triticum aestivum L.) Cultivars. Genetics 2006, 172, 1165–1177. [Google Scholar] [CrossRef] [PubMed]
- Dodig, D.; Zoric, M.; Kobiljski, B.; Savic, J.; Kandic, V.; Quarrie, S.; Barnes, J. Genetic and Association Mapping Study of Wheat Agronomic Traits Under Contrasting Water Regimes. IJMS 2012, 13, 6167–6188. [Google Scholar] [CrossRef]
- Edae, E.A.; Byrne, P.F.; Haley, S.D.; Lopes, M.S.; Reynolds, M.P. Genome-Wide Association Mapping of Yield and Yield Components of Spring Wheat under Contrasting Moisture Regimes. Theor. Appl. Genet. 2014, 127, 791–807. [Google Scholar] [CrossRef] [PubMed]
- Laidò, G.; Marone, D.; Russo, M.A.; Colecchia, S.A.; Mastrangelo, A.M.; De Vita, P.; Papa, R. Linkage Disequilibrium and Genome-Wide Association Mapping in Tetraploid Wheat (Triticum Turgidum L.). PLoS ONE 2014, 9, e95211. [Google Scholar] [CrossRef]
- Klaassen, M.T.; Willemsen, J.H.; Vos, P.G.; Visser, R.G.F.; van Eck, H.J.; Maliepaard, C.; Trindade, L.M. Genome-Wide Association Analysis in Tetraploid Potato Reveals Four QTLs for Protein Content. Mol. Breeding. 2019, 39, 151. [Google Scholar] [CrossRef]
- Ravelombola, W.; Qin, J.; Shi, A.; Song, Q.; Yuan, J.; Wang, F.; Chen, P.; Yan, L.; Feng, Y.; Zhao, T.; et al. Genome-Wide Association Study and Genomic Selection for Yield and Related Traits in Soybean. PLoS ONE 2021, 16, e0255761. [Google Scholar] [CrossRef] [PubMed]
- Yoosefzadeh-Najafabadi, M.; Torabi, S.; Tulpan, D.; Rajcan, I.; Eskandari, M. Genome-Wide Association Studies of Soybean Yield-Related Hyperspectral Reflectance Bands Using Machine Learning-Mediated Data Integration Methods. Front. Plant Sci. 2021, 12, 777028. [Google Scholar] [CrossRef]
- Daunay, M.C.; Lester, R.N.; Ano, G. Cultivated eggplants. In Tropical Plant Breeding; Charpier, A., Jacquot, M., Hamon, S., Nicolas, D., Eds.; Oxford University Press: Oxford, UK, 2001; pp. 200–225. [Google Scholar]
- Kellogg, A.A.; Branaman, T.J.; Jones, N.M.; Little, C.Z.; Swanson, J.-D. Morphological Studies of Developing Rubus Prickles Suggest That They Are Modified Glandular Trichomes. Botany 2011, 89, 217–226. [Google Scholar] [CrossRef]
- Khadgi, A.; Weber, C.A. Morphological Characterization of Prickled and Prickle-Free Rubus Using Scanning Electron Microscopy. Horts 2020, 55, 676–683. [Google Scholar] [CrossRef]
- Pandey, S.; Goel, R.; Bhardwaj, A.; Asif, M.H.; Sawant, S.V.; Misra, P. Transcriptome Analysis Provides Insight into Prickle Development and Its Link to Defense and Secondary Metabolism in Solanum viarum Dunal. Sci. Rep. 2018, 8, 17092. [Google Scholar] [CrossRef]
- Khadgi, A.; Weber, C.A. RNA-Seq Analysis of Prickled and Prickle-Free Epidermis Provides Insight into the Genetics of Prickle Development in Red Raspberry (Rubus ideaus L.). Agronomy 2020, 10, 1904. [Google Scholar] [CrossRef]
- Mangino, G.; Plazas, M.; Vilanova, S.; Prohens, J.; Gramazio, P. Performance of a Set of Eggplant (Solanum melongena) Lines With Introgressions From Its Wild Relative S. Incanum Under Open Field and Screenhouse Conditions and Detection of QTLs. Agronomy 2020, 10, 467. [Google Scholar] [CrossRef]
- Qian, Z.; Zhang, B.; Chen, H.; Lu, L.; Duan, M.; Zhou, J.; Cui, Y.; Li, D. Identification of Quantitative Trait Loci Controlling the Development of Prickles in Eggplant by Genome Re-Sequencing Analysis. Front. Plant Sci. 2021, 12, 731079. [Google Scholar] [CrossRef]
- Miyatake, K.; Saito, T.; Nunome, T.; Yamaguchi, H.; Negoro, S.; Ohyama, A.; Wu, J.; Katayose, Y.; Fukuoka, H. Fine Mapping of a Major Locus Representing the Lack of Prickles in Eggplant Revealed the Availability of a 0.5-Kb Insertion/Deletion for Marker-Assisted Selection. Breed. Sci. 2020, 70, 438–448. [Google Scholar] [CrossRef]
- Hardeland, R. Melatonin in Plants and Other Phototrophs: Advances and Gaps Concerning the Diversity of Functions. J. Exp. Bot. 2015, 66, 627–646. [Google Scholar] [CrossRef]
- Zhang, N.; Sun, Q.; Zhang, H.; Cao, Y.; Weeda, S.; Ren, S.; Guo, Y.-D. Roles of Melatonin in Abiotic Stress Resistance in Plants. J. Exp. Bot. 2015, 66, 647–656. [Google Scholar] [CrossRef]
- Sun, Q.; Zhang, N.; Wang, J.; Zhang, H.; Li, D.; Shi, J.; Li, R.; Weeda, S.; Zhao, B.; Ren, S.; et al. Melatonin Promotes Ripening and Improves Quality of Tomato Fruit during Postharvest Life. J. Exp. Bot. 2015, 66, 657–668. [Google Scholar] [CrossRef]
- Mansouri, S.; Sarikhani, H.; Sayyari, M.; Soleimani Aghdam, M. Melatonin Accelerates Strawberry Fruit Ripening by Triggering GAMYB Gene Expression and Promoting ABA Accumulation. Sci. Hortic. 2021, 281, 109919. [Google Scholar] [CrossRef]
- Byeon, Y.; Lee, H.-J.; Lee, H.Y.; Back, K. Cloning and Functional Characterization of the Arabidopsis N-AcetylserotoninO-Methyltransferase Responsible for Melatonin Synthesis. J. Pineal Res. 2016, 60, 65–73. [Google Scholar] [CrossRef]
- Hsu, C.-C.; Chen, S.-Y.; Chiu, S.-Y.; Lai, C.-Y.; Lai, P.-H.; Shehzad, T.; Wu, W.-L.; Chen, W.-H.; Paterson, A.H.; Chen, H.-H. High-Density Genetic Map and Genome-Wide Association Studies of Aesthetic Traits in Phalaenopsis Orchids. Sci. Rep. 2022, 12, 3346. [Google Scholar] [CrossRef] [PubMed]
- Dowell, J.A.; Reynolds, E.C.; Pliakas, T.P.; Mandel, J.R.; Burke, J.M.; Donovan, L.A.; Mason, C.M. Genome-Wide Association Mapping of Floral Traits in Cultivated Sunflower (Helianthus annuus). J. Hered. 2019, 110, 275–286. [Google Scholar] [CrossRef] [PubMed]
- Kim, M.; Nguyen, T.T.P.; Ahn, J.-H.; Kim, G.-J.; Sim, S.-C. Genome-Wide Association Study Identifies QTL for Eight Fruit Traits in Cultivated Tomato (Solanum lycopersicum L.). Hortic. Res. 2021, 8, 203. [Google Scholar] [CrossRef]
- Akohoue, F.; Achigan-Dako, E.G.; Sneller, C.; Van Deynze, A.; Sibiya, J. Genetic Diversity, SNP-Trait Associations and Genomic Selection Accuracy in a West African Collection of Kersting’s Groundnut [Macrotyloma geocarpum (Harms) Maréchal & Baudet]. PLoS ONE 2020, 15, e0234769. [Google Scholar] [CrossRef]
- Barkan, A.; Small, I. Pentatricopeptide Repeat Proteins in Plants. Annu. Rev. Plant Biol. 2014, 65, 415–442. [Google Scholar] [CrossRef] [PubMed]
- Li, X.; Sun, M.; Liu, S.; Teng, Q.; Li, S.; Jiang, Y. Functions of PPR Proteins in Plant Growth and Development. IJMS 2021, 22, 11274. [Google Scholar] [CrossRef]
- Waterworth, W.M.; Kozak, J.; Provost, C.M.; Bray, C.M.; Angelis, K.J.; West, C.E. DNA Ligase 1 Deficient Plants Display Severe Growth Defects and Delayed Repair of Both DNA Single and Double Strand Breaks. BMC Plant Biol. 2009, 9, 79. [Google Scholar] [CrossRef] [PubMed]
- Waterworth, W.M.; Masnavi, G.; Bhardwaj, R.M.; Jiang, Q.; Bray, C.M.; West, C.E. A Plant DNA Ligase Is an Important Determinant of Seed Longevity: Characterization of Arabidopsis DNA Ligase 6. Plant J. 2010, 63, 848–860. [Google Scholar] [CrossRef] [PubMed]
- Kim, K.-W.; Chung, H.-K.; Cho, G.-T.; Ma, K.-H.; Chandrabalan, D.; Gwag, J.-G.; Kim, T.-S.; Cho, E.-G.; Park, Y.-J. PowerCore: A Program Applying the Advanced M Strategy with a Heuristic Search for Establishing Core Sets. Bioinformatics 2007, 23, 2155–2162. [Google Scholar] [CrossRef] [PubMed]
- Elshire, R.J.; Glaubitz, J.C.; Sun, Q.; Poland, J.A.; Kawamoto, K.; Buckler, E.S.; Mitchell, S.E. A Robust, Simple Genotyping-by-Sequencing (GBS) Approach for High Diversity Species. PLoS ONE 2011, 6, e19379. [Google Scholar] [CrossRef]
- Martin, M. Cutadapt Removes Adapter Sequences from High-Throughput Sequencing Reads. EMBNET J. 2011, 17, 10. [Google Scholar] [CrossRef]
- Cox, M.P.; Peterson, D.A.; Biggs, P.J. SolexaQA: At-a-Glance Quality Assessment of Illumina Second-Generation Sequencing Data. BMC Bioinform. 2010, 11, 485. [Google Scholar] [CrossRef]
- Li, H. Aligning Sequence Reads, Clone Sequences and Assembly Contigs with BWA-MEM. arXiv 2013. [Google Scholar] [CrossRef]
- Li, H.; Handsaker, B.; Wysoker, A.; Fennell, T.; Ruan, J.; Homer, N.; Marth, G.; Abecasis, G.; Durbin, R. 1000 Genome Project Data Processing Subgroup The Sequence Alignment/Map Format and SAMtools. Bioinformatics 2009, 25, 2078–2079. [Google Scholar] [CrossRef] [PubMed]
- Kim, J.-E.; Oh, S.-K.; Lee, J.-H.; Lee, B.-M.; Jo, S.-H. Genome-Wide SNP Calling Using Next Generation Sequencing Data in Tomato. Mol. Cells 2014, 37, 36–42. [Google Scholar] [CrossRef] [PubMed]
- Pritchard, J.K.; Stephens, M.; Donnelly, P. Inference of Population Structure Using Multilocus Genotype Data. Genetics 2000, 155, 945–959. [Google Scholar] [CrossRef] [PubMed]
- Falush, D.; Stephens, M.; Pritchard, J.K. Inference of Population Structure Using Multilocus Genotype Data: Linked Loci and Correlated Allele Frequencies. Genetics 2003, 164, 1567–1587. [Google Scholar] [CrossRef]
- Earl, D.A.; vonHoldt, B.M. STRUCTURE HARVESTER: A Website and Program for Visualizing STRUCTURE Output and Implementing the Evanno Method. Conserv. Genet. Resour. 2012, 4, 359–361. [Google Scholar] [CrossRef]
- Evanno, G.; Regnaut, S.; Goudet, J. Detecting the Number of Clusters of Individuals Using the Software Structure: A Simulation Study. Mol. Ecol. 2005, 14, 2611–2620. [Google Scholar] [CrossRef]
- Zheng, X.; Levine, D.; Shen, J.; Gogarten, S.M.; Laurie, C.; Weir, B.S. A High-Performance Computing Toolset for Relatedness and Principal Component Analysis of SNP Data. Bioinformatics 2012, 28, 3326–3328. [Google Scholar] [CrossRef]
- Jombart, T.; Devillard, S.; Balloux, F. Discriminant Analysis of Principal Components: A New Method for the Analysis of Genetically Structured Populations. BMC Genet. 2010, 11, 94. [Google Scholar] [CrossRef]
- Tamura, K.; Stecher, G.; Kumar, S. MEGA11: Molecular Evolutionary Genetics Analysis Version 11. Mol. Biol. Evol. 2021, 38, 3022–3027. [Google Scholar] [CrossRef]
- Zhang, Z.; Ersoz, E.; Lai, C.-Q.; Todhunter, R.J.; Tiwari, H.K.; Gore, M.A.; Bradbury, P.J.; Yu, J.; Arnett, D.K.; Ordovas, J.M.; et al. Mixed Linear Model Approach Adapted for Genome-Wide Association Studies. Nat. Genet. 2010, 42, 355–360. [Google Scholar] [CrossRef]
- Lipka, A.E.; Tian, F.; Wang, Q.; Peiffer, J.; Li, M.; Bradbury, P.J.; Gore, M.A.; Buckler, E.S.; Zhang, Z. GAPIT: Genome Association and Prediction Integrated Tool. Bioinformatics 2012, 28, 2397–2399. [Google Scholar] [CrossRef] [PubMed]


Publisher’s Note: MDPI stays neutral with regard to jurisdictional claims in published maps and institutional affiliations. |
© 2022 by the authors. Licensee MDPI, Basel, Switzerland. This article is an open access article distributed under the terms and conditions of the Creative Commons Attribution (CC BY) license (https://creativecommons.org/licenses/by/4.0/).