Article

Digalloyl Glycoside: A Potential Inhibitor of Trypanosomal PFK from Euphorbia abyssinica J.F. Gmel

1
Department of Pharmacognosy, Faculty of Pharmacy, Cairo University, Giza 12613, Egypt
2
Department of Pharmacognosy, Faculty of Pharmacy, Beni-Suef University, Beni-Suef 62514, Egypt
3
Department of Pharmacognosy, Faculty of Pharmacy, Nahda University Beni-Suef, Beni-Suef 62521, Egypt
4
Department of Pharmacognosy, Faculty of Pharmacy, Heliopolis University, Cairo 11785, Egypt
5
Department of Pharmaceutical Chemistry, Faculty of Pharmacy, Nahda University Beni-Suef, Beni-Suef 62521, Egypt
6
Department of Medicinal Chemistry and Pharmacognosy, College of Pharmacy, Qassim University, Buraidah 51452, Saudi Arabia
7
Department of Pharmaceutical Chemistry, College of Pharmacy, University of Hail, Hail 34464, Saudi Arabia
*
Author to whom correspondence should be addressed.
Plants 2022, 11(2), 173; https://doi.org/10.3390/plants11020173
Submission received: 16 December 2021 / Revised: 1 January 2022 / Accepted: 4 January 2022 / Published: 10 January 2022
(This article belongs to the Special Issue Research of Bioactive Substances in Plant Extracts)

Abstract

:
Human African trypanosomiasis is an endemic infectious disease caused by Trypanosoma brucei via the bite of tsetse-fly. Most of the drugs used for the treatment, e.g., Suramin, have shown several problems, including the high level of toxicity. Accordingly, the discovery of anti-trypanosomal drugs from natural sources has become an urgent requirement. In our previous study on the anti-trypanosomal potential of Euphorbia species, Euphorbia abyssinica displayed significant anti-trypanosomal activity. Therefore, a phytochemical investigation of the methanolic extract of E. abyssinica was carried out. Twelve compounds, including two triterpenes (1, 2); one sterol-glucoside (4); three ellagic acid derivatives (3, 9, 11); three gallic acid derivatives (5, 6, 10); and three flavonoids (7, 8, 12), were isolated. The structures of isolated compounds were determined through different spectroscopic techniques. Compound (10) was obtained for the first time from genus Euphorbia while all other compounds except compound (4), were firstly reported in E. abyssinica. Consequently, an in silico study was used to estimate the anti-trypanosomal activity of the isolated compounds. Several compounds displayed interesting activity where 1,6-di-O-galloyl-d-glucose (10) appeared as the most potent inhibitor of trypanosomal phosphofructokinase (PFK). Moreover, molecular dynamics (MD) simulations and ADMET calculations were performed for 1,6-di-O-galloyl-d-glucose. In conclusion, 1,6-di-O-galloyl-d-glucose revealed high binding free energy as well as desirable molecular dynamics and pharmacokinetic properties; therefore, it could be suggested for further in vitro and in vivo studies for trypanosomiasis.

1. Introduction

Trypanosoma brucei is the causative agent of human African trypanosomiasis (HAT), sleeping sickness, via the bite of the tsetse fly. One of the most druggable target enzymes for the treatment of HAT is trypanosomal phosphofructokinase (PFK) enzyme [1,2]. PFK enzyme is dedicated due to the highly conserved active sites and phosphorylated substrates [3]. It catalyzes the phosphorylation of fructose 6-phosphate (F6P) to fructose 1,6-bisphosphate, an early step in the glycolytic pathway in T. brucei [4]. This first committed glycolysis step considers the main irreversible reaction in parasites that occurs under physiological conditions [5]. The infectious stage of the parasite bloodstream is solely dependent on the glucose metabolism for ATP generation [6]. Thus, the inhibition of the trypanosomal PFK blocks the glycolytic pathway causing very fast parasite kill times without affecting the human PFKs [3].
Considering PFK critical biological role, it has been reported as a promising and selective drug target without the diverse effects of chemotherapy of numerous trypanosomatides [7]. Structurally, PFK shows a homotetrameric structure (chains A–D) forming a dimer of dimers. Furthermore, each monomer chain has four well-known domains (domains A–D). Two subdomains present a compact structure, namely domain B (residues 95–233, 386–409) and domain C (residues 234–385, 442–453), while subdomains A and D present a less organized structure [8].
In detail, the catalytic site involved in the phosphorylation of fructose 6-phosphate includes one sub-cavity responsible for binding ATP, and a proximal sub-cavity for binding before phosphorylation [9]. Moreover, the inhibitor was sited within a hidden cavity next to the position of the ATP-Mg complex of the holoenzyme that created intermolecular connections with residues Gly174, Arg173, Ser341, Asn343, Lys226, Gly107, Thr201, Gly198, and Gly200 [10]. Suramin is informed as a classic, PFK inhibitor, an anti-trypanosomal drug that used since 1920 with high potential activity [10,11]. On the other hand, it is known to exhibit significant side effects, as hypersensitivity, agranulocytosis, and nephrotoxicity [12].
E. abyssinica J.F. Gmel, commonly called desert candle, is a succulent monoecious geophyte, shrub, or tree that grow up to 9 m high [13]. It is widespread across most of Africa, the Arabian Peninsula, and in Southern Asia from Pakistan to Malaysia, Indonesia, and Papua New Guinea [14]. Chemical screening of E. abyssinica has indicated only low quantities of diterpenes [15]. Its latex was reported to yield ingenol esters and lathyrane derivatives as minor components besides euphol, euphorbol, lupeol, oleanolic acid, β-sitosterol, and β-sitosterol-3-O-glucoside [13,16]. It has also been reported to contain rubber, waxes, and resins as major constituents, in addition to 8(R)-hydroxy-dec-3(E)-en-oic acid, showing significant anti-fungal activity against Aspergillus flavus, Aspergillus niger, and Candida albicans [13]. Furthermore, E. abyssinica has exhibited cytotoxic activity against Caco2 (IC50 11.3 µg/mL) [17]. Moreover, the root of E. abyssinica has shown potent chemosuppressive antimalarial activity against Plasmodium berghei infection in mice [18].
Recently, molecular docking is extensively applied for biologically active screening and structure-activity studies concerning drug discovery [19]. It is important in the estimation of bioactivity of chemical compounds against a target and has shown great progress [20]. The evaluation of drug design depends on the identification and characterization of small-molecule binding sites on the target proteins [21]. Molecular docking analysis allows the prediction of molecular interactions between a protein and a ligand in the bound state [22].
In our previous research, the anti-trypanosomal activity of the methanolic extract of E. abyssinica against T. brucei brucei strain TC221 was investigated, and IC50 values were determined as 17.3 and 19.4 μg/mL after 48 and 72 h incubation, respectively [23]. Consequently, the current study discusses the molecular modeling study of the compounds isolated from E. abyssinica J.F. Gmel. against the target proteins (PFK) of T. brucei. Furthermore, the molecular dynamics and pharmacokinetic properties of the most active compound are also presented in order to conclude the compound activity.

2. Results

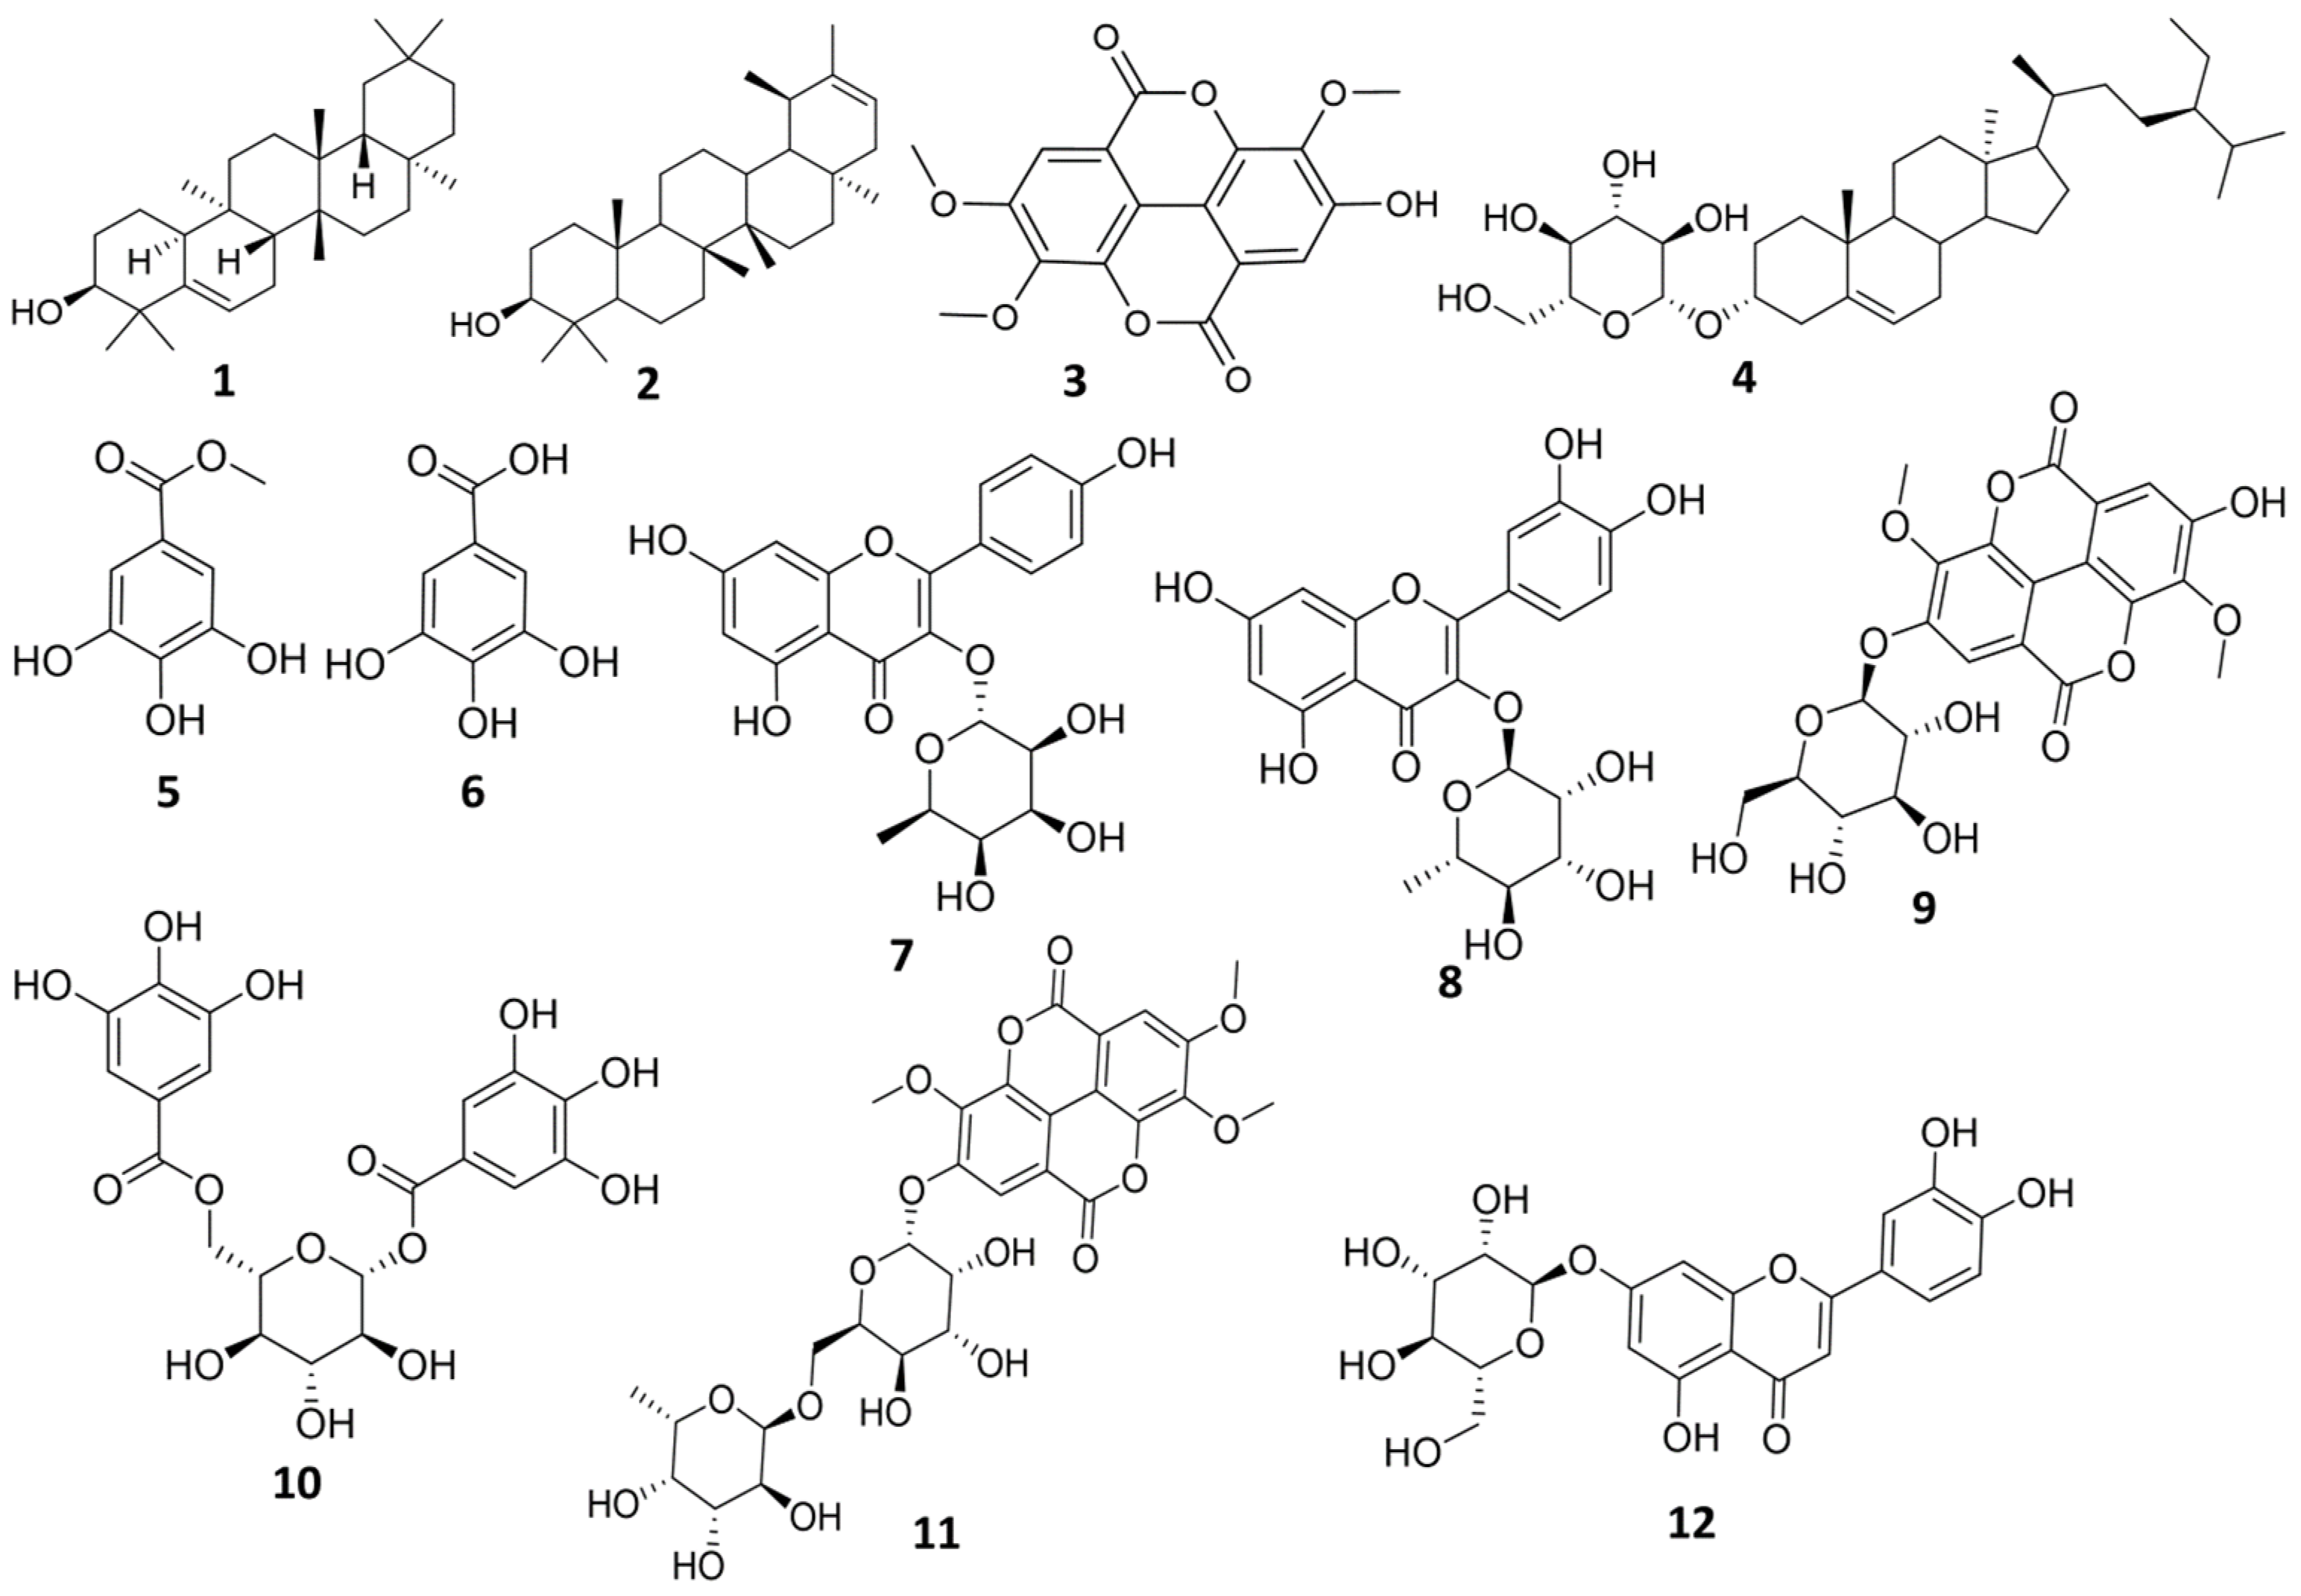
2.1. Investigation of Methylene Chloride Fraction of E. abyssinica J.F. Gmel

Chromatographic investigation of methylene chloride fraction led to isolation of four compounds. The structure of the isolated compounds was elucidated using 1D NMR and LC-HRMS. Compound (1): White needle powder (15 mg), m.p. 208–212 °C, gave a positive Libermann–Burchard’s test indicating its steroidal or triterpenoidal nature. LC-HRMS [M + H]+ m/z: 427.3931, Rt: 26.12 calculated for C30H50O. 1H-NMR (400 MHz) in (CD3OD) (Figure S1) δ 5.61 (1 H, d, J = 6.41 Hz, H-6), 3.46 (1H, br d, J = 3.24 Hz, H-3), 1.21 (3H, s, Me-28), 1.15 (3H, s, Me-24), 1.14 (3H, s, Me-26), 1.06 (3H, s, Me-23), 1.04 (3H, s, Me-27), 1.03 (3H, s, Me-29), 0.98 (3H, s, H-30), 0.91 (3H, s, H-25). DEPT-Q NMR (100 MHz, CD3OD) (Figure S2) δ 140.99 (C-5), 121.24 (C-6), 75.61 (C-3), 50.21 (C-10), 47.20 (C-8), 42.89 (C-18), 40.05 (C-4), 39.06 (C-14), 38.59 (C-22), 37.43 (C-13), 35.81 (C-16), 35.03 (C-19), 34.76 (C-9), 34.50 (C-11), 34.08 (C-21), 33.47 (C-30), 32.84 (C-15), 31.18 (C-12), 31.54 (C-29), 31.17 (C-28), 30.01 (C-17), 28.87 (C-20), 28.52 (C-23), 27.67 (C-2), 24.64 (C-24), 23.21 (C-7), 19.02 (C-26), 18.74 (C-1), 17.60 (C-27), 16.13 (C-25).
Compound (2): White crystal powder (25 mg), m.p. 282–285 °C, gave a positive Libermann–Burchard’s test indicating its steroidal or triterpenoidal nature. LC-HRMS [M + H] m/z: 425.3859, Rt: 28.97 calculated for C30H50O. 1H-NMR (400 MHz) in (CDCL3) (Figure S3) δ 5.28 (1H, d, J = 6.96 Hz, H-21), 3.21 (1H, dd, J = 1.36, 6.12 Hz, H-3), 1.69 (3 H, s, H-30), 1.06 (3H, s, H-26), 1.04 (3H, d, J = 2.8 Hz, H-29), 1.01 (3H, s, H-23), 0.97 (3H, s, H-27), 0.89 (3H, s, H-25), 0.76 (3H, s, H-24), 0.70 (3H, s, H-28). DEPT-Q NMR (100 MHz, CDCl3) (Figure S4) δ 139.86 (C-20), 118.90 (C-21), 79.05 (C-3), 55.30 (C-5), 50.43 (C-9), 48.71 (C-18), 42.34 (C-14), 42.19 (C-22), 41.07 (C-8), 39.23 (C-13), 38.87 (C-4), 38.77 (C-1), 37.11 (C-10), 36.72 (C-16), 36.32 (C-19), 34.39 (C-17), 34.24 (C-7), 28.01 (C-23), 27.66 (C-12), 27.39 (C-2), 27.06 (C-15), 22.56 (C-29), 21.65 (C-30), 21.63 (C-11), 18.31 (C-6), 17.72 (C-28), 16.31 (C-25), 16.06 (C-26), 15.40 (C-24), 14.75 (C-27).
Compound (3): Yellowish white amorphous powder (50 mg), m.p. 289–291 °C, produced a positive reaction to FeCl3 reagent. LC-HRMS [M + H]+ m/z: 345.0602, Rt: 16.99 calculated for C17H12O8. 1H-NMR (400 MHz) in (DMSO-d6) (Figure S5) δ 7.59 (1H, s, H-5′), 7.52 (1H, s, H-5), 4.10 (3H, s, OCH3 on C-3), 4.08 (3H, s, OCH3 on C-4), 4.03 (3H, s, OCH3 on C-3′), 3.51 (1H, s, OH on C-4′). DEPT-Q NMR (100 MHz) in (DMSO-d6) (Figure S6) δ 159.00 (C-7), 158.74 (C-7′), 153.63 (C-4), 153.07 (C-4′), 141.76 (C-2), 141.24 (C-2′), 140.94 (C-3), 140.10 (C-3′), 114.41 (C-1), 113.26 (C-1′), 113.20 (C-6), 112.69 (C-6′), 112.46 (C-5), 107.91 (C-5′), 61.85 (OCH3 on C-3), 61.28 (OCH3 on C-3′), 57.01 (OCH3 on C-4).
Compound (4): White amorphous powder (24 mg), m.p. 290 °C; the color of the spot was invisible in TLC and under UV but after spraying with p-anisaldehyde, it was violet. It gave a positive Libermann–Burchard’s test indicating its steroidal or triterpenoidal nature and gave a positive with Molish’s test indicating its glycosidic nature. LC-HRMS [M + H] m/z: 575.3155, Rt: 25.82 calculated for C35H60O6. 1H-NMR (400 MHz) in (DMSO-d6) (Figure S7) δ 5.34 (1H, t, H-6), 3.56 (1H, m, H-3), 0.96 (3H, s, Me-18), 0.91 (3H, d, J = 5.6 Hz, Me-21), 0.84 (3H, d, J = 7.2 Hz, Me-26), 0.82 (3H, d, J = 8.0 Hz, Me-27), 0.79 (3H, d, J = 8.0 Hz, Me-29), 0.66 (3H, s, Me-19), glucose; 4.22 (1H, d, J = 9.2 Hz, H-1′), 3.67 & 3.83 (glc., 2H, d, J = 10.2 Hz, H-6′), 3.13–3.38 (glc., 4H, m). DEPT-Q NMR (100 MHz, DMSO-d6) (Figure S8) δ 140.87 (C-5), 121.68 (C-6), 77.40 (C-3), 56.64 (C-14), 55.88 (C-17), 50.06 (C-9), 45.60 (C-24), 42.32 (C-13), 38.83 (C-12), 38.04 (C-4), 36.67 (C-1), 36.13 (C-10), 35.94 (C-20), 33.80 (C-22), 31.88 (C-8), 31.84 (C-7), 29.16 (C-2), 28.51 (C-25), 28.26 (C-16), 25.88 (C-23), 24.32 (C-15), 23.06 (C-28), 21.06 (C-11), 20.18 (C-26), 19.56 (C-27), 19.39 (C-19), 19.08 (C-21), 12.24 (C-29), 12.13 (C-18), glucose moiety 101.24 (C-1′), 77.39 (C-3′), 77.21 (C-5′), 73.92 (C-2′), 70.55 (C-4′), 61.54 (C-6′).

2.2. Investigation of Ethyl Acetate Fraction of E. abyssinica J.F. Gmel

Chromatographic investigation of ethyl acetate fraction led to the isolation of seven compounds. The structure of the isolated compounds was elucidated using 1D, 2D NMR, and LC-HRMS. Compound (5): White crystalline powder (17 mg), m.p. 198–200 °C, produced a positive reaction to FeCl3 reagent. LC-HRMS [M + H] m/z: 183.0301, Rt: 8.37 calculated for C8H8O5. 1H-NMR (400 MHz) in (CD3OD) (Figure S9) δ 7.06 (2 H, s, H-2 and H-6), 3.83 (3 H, s, OCH3 on C-7). DEPT-Q NMR (100 MHz) in (CD3OD) (Figure S10) δ 168.04 (C-7), 145.29 (C-3 and C-5), 138.95 (C-4), 120.22 (C-1), 108.84 (C-2 and C-6), 50.99 (OCH3).
Compound (6): White crystalline powder (14 mg), m.p. 258–263 °C, produced a positive reaction to FeCl3 reagent. LC-HRMS [M + H] m/z: 169.0143, Rt: 5.01 calculated for C7H6O5. 1H-NMR (400 MHz) in (CD3OD) (Figure S11) δ 7.14 (2H, s, H-2 & H-6). DEPT-Q NMR (100 MHz) in (CD3OD) (Figure S12) δ 168.23 (C-7), 144.28 (C-3 & C-5), 137.43 (C-4), 119.75 (C-1), 108.11 (C-2 and C-6).
Compound (7): Yellow powder (10 mg), m.p. 172–174 °C, LC-HRMS [M + H]+ m/z: 433.1125, Rt: 12.70 calculated for C21H20O10. 1H-NMR (400 MHz) in (CD3OD) (Figure S13) δ 7.76 (2 H, d, J = 8.46 Hz, H-2′ & H-6′), 6.94 (2 H, d, J = 8.46 Hz, H-3′ & H-5′), 6.36 (1 H, d, J = 2.12 Hz, H-8), 6.19 (1 H, d, J = 2.12 Hz, H-6), 5.39 (1 H, d, J = 1.54 Hz, H-1″), 4.27 (1 H, dd, J = 1.54, 3.00 Hz, H-2″), 3.76 (1 H, m, H-3″), 3.66 (1 H, m, H-4″), 3.33 (1 H, m, H-5″), 0.95 (3 H, d, J = 5.6 Hz, H-6″). DEPT-Q NMR (100 MHz) in (CD3OD) (Figure S14) δ 178.15 (C-4), 164.35 (C-7), 162.12 (C-5), 160.19 (C-4′), 158.03 (C-9), 157.15 (C-2), 134.83 (C-3), 130.91 (C-2′), 130.67 (C-6′), 121.53 (C-1′), 115.16 (C-3′), 114.65 (C-5′), 104.76 (C-10), 102.26 (C-1″), 98.67 (C-6), 93.48 (C-8), 71.84 (C-4″), 70.75 (C-2″), 70.65 (C-3″), 70.54 (C-5″), 16.46 (C-6″).
Compound (8): Yellow amorphous powder (12 mg), m.p. 179–183 °C, LC-HRMS [M + H]+ m/z: 449.1074, Rt: 11.87 calculated for C21H20O11. TLC investigation revealed an orange spot while it showed deep purple spot under UV light, which became yellow–green when fumed with ammonia vapor but showed dark orange color with p-anisaldehde indicating its flavonoid-3-O-substituted nature. 1H-NMR (400 MHz) in (CD3OD) (Figure S15) δ 7.35 (1 H, d, J = 2.12 Hz, H-2′), 7.31 (1 H, dd, J = 2.12, 8.36 Hz, H-6′), 6.93 (1 H, d, J = 8.24 Hz, H-5′), 6.35 (1 H, d, J = 2.12 Hz, H-8), 6.19 (1 H, d, J = 2.12 Hz, H-6), 5.37 (1 H, d, J = 1.50 Hz, H-1″), 4.27 (1 H, dd, J = 1.72, 2.62 Hz, H-3″), 3.80 (1 H, dd, J = 2.62, 9.14 Hz, H-2″), 3.45 (1 H, m, H-4″), 3.37 (1 H, m, H-5″), 0.97 (3 H, d, J = 5.84 Hz, H-6″). DEPT-Q NMR (100 MHz) in (CD3OD) (Figure S16) δ 178.21 (C-4), 164.40 (C-7), 161.68 (C-5), 157.89 (C-9), 157.04 (C-2), 148.33 (C-4′), 144.97 (C-3′), 134.84 (C-3), 121.62 (C-1′), 121.59 (C-6′), 115.64 (C-5′), 115.02 (C-2′), 104.50 (C-10), 102.11 (C-1″), 98.49 (C-6), 93.43 (C-8), 71.91 (C-4″), 70.74 (C-3″), 70.64 (C-2″), 70.54 (C-5″), 16.30 (C-6″).
Compound (9): Yellowish white amorphous powder (25 mg), m.p. 297 °C, produced a positive reaction to FeCl3 reagent. LC-HRMS [M + H]+ m/z: 493.0970, Rt: 9.57 calculated for C22H20O13. 1H-NMR (400 MHz) in (DMSO-d6) (Figure S17) δ 7.82 (1 H, s, H-5′), 7.53 (1 H, s, H-5), 5.16 (1 H, d, J = 7.36 Hz, H-1″), 4.09 (3 H, s, OCH3 on C-3′), 4.05 (3 H, s, OCH3 on C-3), 3.73 (1 H, m, H-6″), 3.69 (1 H, m, H-6″), 3.59 (1 H, m, H-2″), 3.55 (1 H, m, H-5″), 3.54 (1 H, m, H-3″), 3.39 (1 H, s, OH on C-4), 3.24 (1 H, m, H-4″). DEPT-Q NMR (100 MHz) in (DMSO-d6) (Figure S18) δ 158.88 (C-7′), 158.83 (C-7), 152.01 (C-4), 142.14 (C-2′), 141.41 (C-2), 140.72 (C-3), 114.67 (C-1′), 113.24 (C-6′), 112.50 (C-6), 112.34 (C-5′), 112.08 (C-5), 111.57 (C-1), 101.79 (C-1″), 77.73 (C-3″), 76.96 (C-5″), 73.80 (C-2″), 69.96 (C-4″), 62.14 (CH3 on C-3′), 61.52 (CH3 on C-3), 61.02 (C-6″).
Compound (10): Off-white amorphous powder (16 mg), m.p. 180–182 °C, produced a positive reaction to FeCl3 reagent. LC-HRMS [M + H]+ m/z: 485.0921, Rt: 8.29 calculated for C20H20O14. 1H-NMR (400 MHz) in (CD3OD) (Figure S19) δ 7.19 (2H, s, H-2 and H-2′), 7.13 (2H, s, H-6 & H-6′), 5.75 (1H, d, J = 7.48 Hz, H-1″), 4.60 (1H, dd, J = 2.24, 12.14 Hz, H-6″), 4.45 (1H, dd, J = 4.86, 12.14 Hz, H-6″), 3.81 (1H, m, H-5″), 3.66–3.5, m (H-2″: H-4″). DEPT-Q NMR (100 MHz) in (CD3OD) (Figure S20) δ 167.15 (C-7), 165.79 (C-7′), 145.03 (C-3 & C-5), 145.03 (C-3′ and C-5′), 139.10 (C-4), 138.45 (C-4′), 119.94 (C-1), 119.22 (C-1′), 109.44 (C-2 & C-6), 109.04 (C-2′ and C-6′), 94.58 (C-1″), 76.53 (C-3″), 74.96 (C-5″), 72.71 (C-2″), 69.85 (C-4″), 63.18 (C-6″).
Compound (11): Yellowish white amorphous powder (45 mg), m.p. 267–268 °C, produced a positive reaction to FeCl3 reagent. LC-HRMS [M + H]+ m/z: 653.1704, Rt: 11.93 calculated for C29H32O17. 1H-NMR (400 MHz) in (DMSO-d6) (Figure S21) δ 7.82 (1 H, s, H-5′), 7.57 (1 H, s, H-5), 5.15 (1 H, d, J = 7.48 Hz, H-1″), 4.51 (1 H, d, J = 1.62 Hz, H-1‴), 4.05 (3 H, s, OCH3 on C-3′), 3.99 (3 H, s, OCH3 on C-3), 3.86 (3 H, s, OCH3 on C-4), 3.84 (1 H, d, J = 11.20 Hz, H-6″), 3.47 (1 H, dd, J = 6.72, 11.20 Hz, H-6″), 3.61–3.09 (m, sugar moiety), 1.02 (3 H, d, J = 6.14 Hz, H-6‴). DEPT-Q NMR (100 MHz) in (DMSO-d6) (Figure S22) δ 158.62 (C-7), 158.40 (C-7′), 154.59 (C-4), 152.21 (C-4′), 142.38 (C-3′), 141.47 (C-3), 141.35 (C-2′), 141.22 (C-2), 113.98 (C-1′), 113.03 (C-5′), 112.95 (C-1), 112.66 (C-6′), 112.59 (C-6), 107.76 (C-5), 102.04 (C-1″), 101.02 (C-1‴), 76.83 (C-3″), 76.33 (C-5″), 73.77 (C-2″), 72.43 (C-4‴), 71.10 (C-3‴), 70.60 (C-2‴), 70.18 (C-4″), 68.69 (C-5‴), 66.53 (C-6″), 62.15 (OCH3 on C-3′), 61.72 (OCH3 on C-3), 57.11 (OCH3 on C-4), 18.23 (C-6‴).

2.3. Investigation of N-Butanol Fraction of E. abyssinica J.F. Gmel

Chromatographic investigation of n-butanol fraction led to isolation of one compound. The structure of the isolated compound was elucidated using 1H-NMR, and LC-HRMS. Compound (12): Yellow amorphous powder (6 mg), m.p. 320–330 °C. UV λmax (MeOH) nm: 225, 258, 347.5, (AlCl3) 272.5, 297, 331, 421. LC-HRMS [M + H]+ m/z: 449.1074, Rt: 11.87 calculated for (C21H20O11). 1H-NMR (400 MHz) (CD3OD, 400 MHz) (Figure S23) δ δ 7.41 (1H, dd, J = 1.94, 8.88 Hz, H-6′), 7.39 (1H, d, J = 1.94 Hz, H-2′), 6.91 (1H, d, J = 8.88 Hz, H-5′), 6.55 (1H, s, H-3), 6.44 (1H, d, J = 2.06 Hz, H-8), 6.21 (1H, d, J = 2.06 Hz, H-6), 5.11 (1H, d, J = 7.16 Hz, H-1″), 4.28 (1H, d, J = 11.58 Hz, H-6″), 3.84 (1H, m, H-5″), 3.72 (1H, m, H-2″), 3.56 (1H, dd, J = 2.8, 5.2 Hz, H-6″), 3.50 (1H, m, H-3″, 3.20 (1H, m, H-4″). DEPT-Q NMR (100 MHz) in (CD3OD) (Figure S24) δ 182.52 (C-4), 165.16 (C-7), 164.64 (s, C-2), 161.79 (C-5), 158.00 (C-9), 149. 59 (C-4′), 145.86 (C-3′), 122.57 (C-1′), 118.90 (C-6′), 115.38 (C-5′), 112.76 (C-2′), 103.89 (C-10), 102.46 (C-3), 99.89 (C-1″), 98.73 (C-6), 93.61 (C-8), 76.48 (C-5″), 74.17 (C-3″), 73.17 (C-2″), 70.94 (C-4″), 63.37 (C-6″). All isolated compounds are represented in (Figure 1).

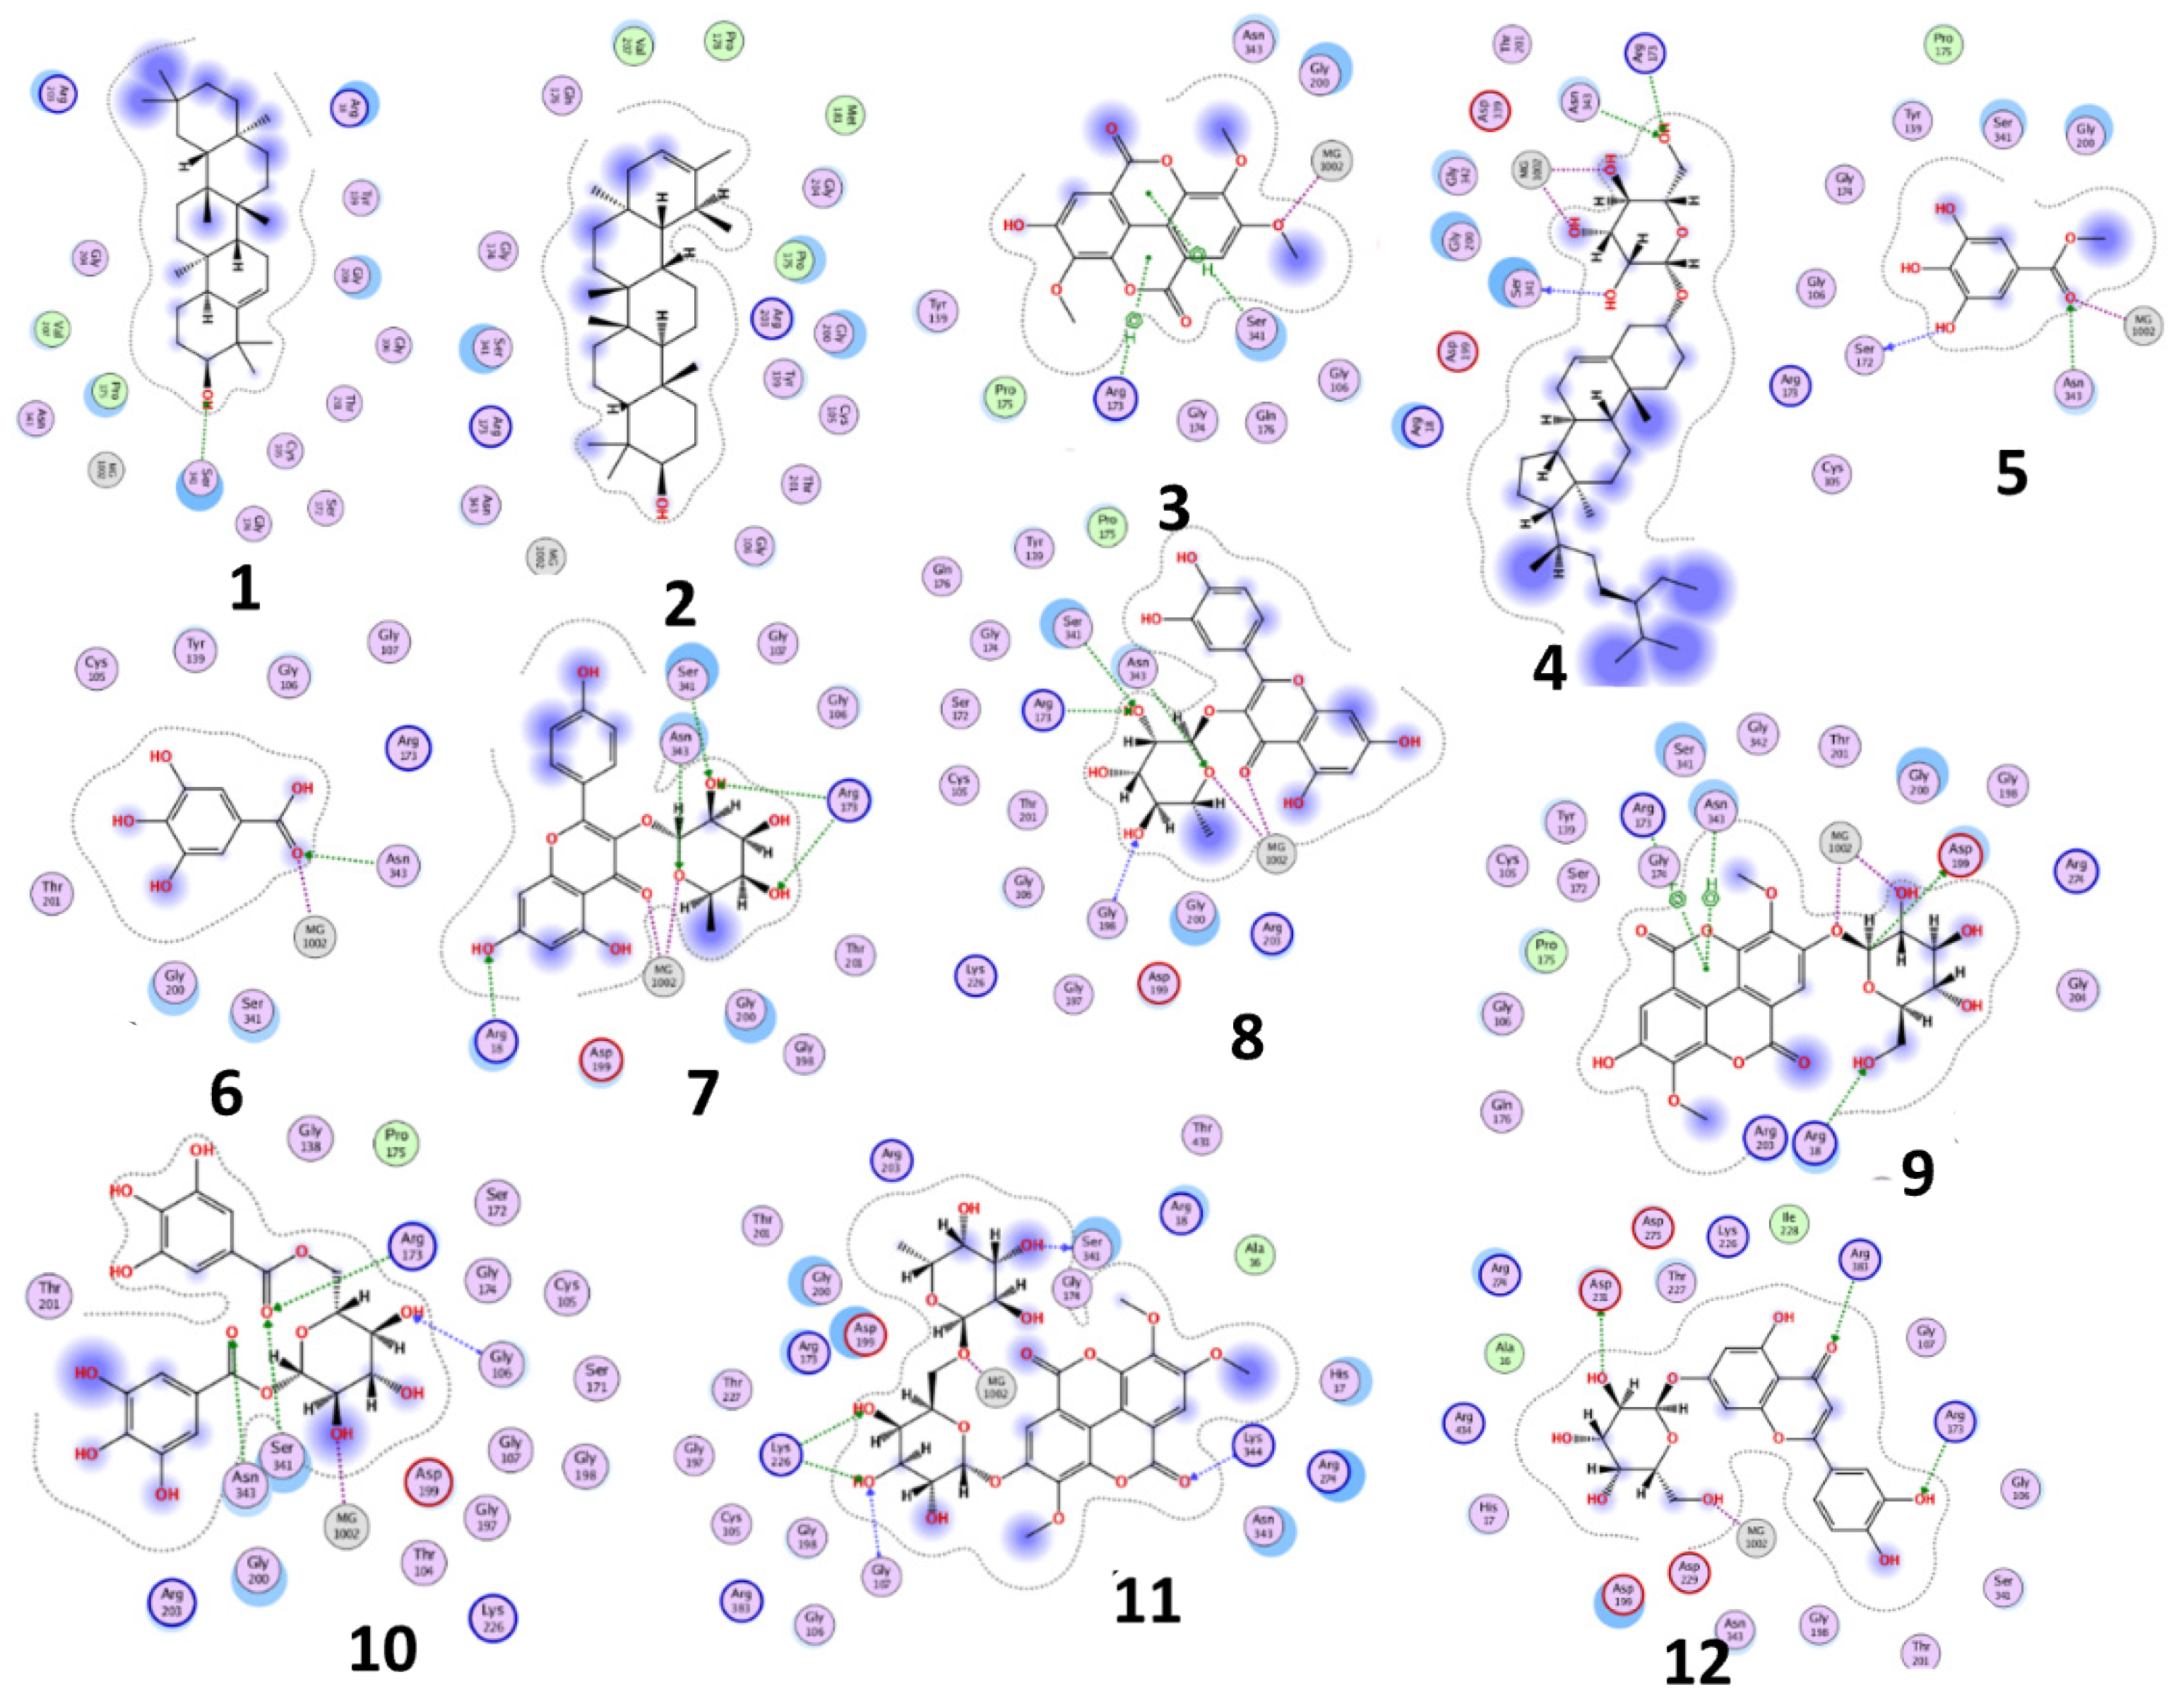
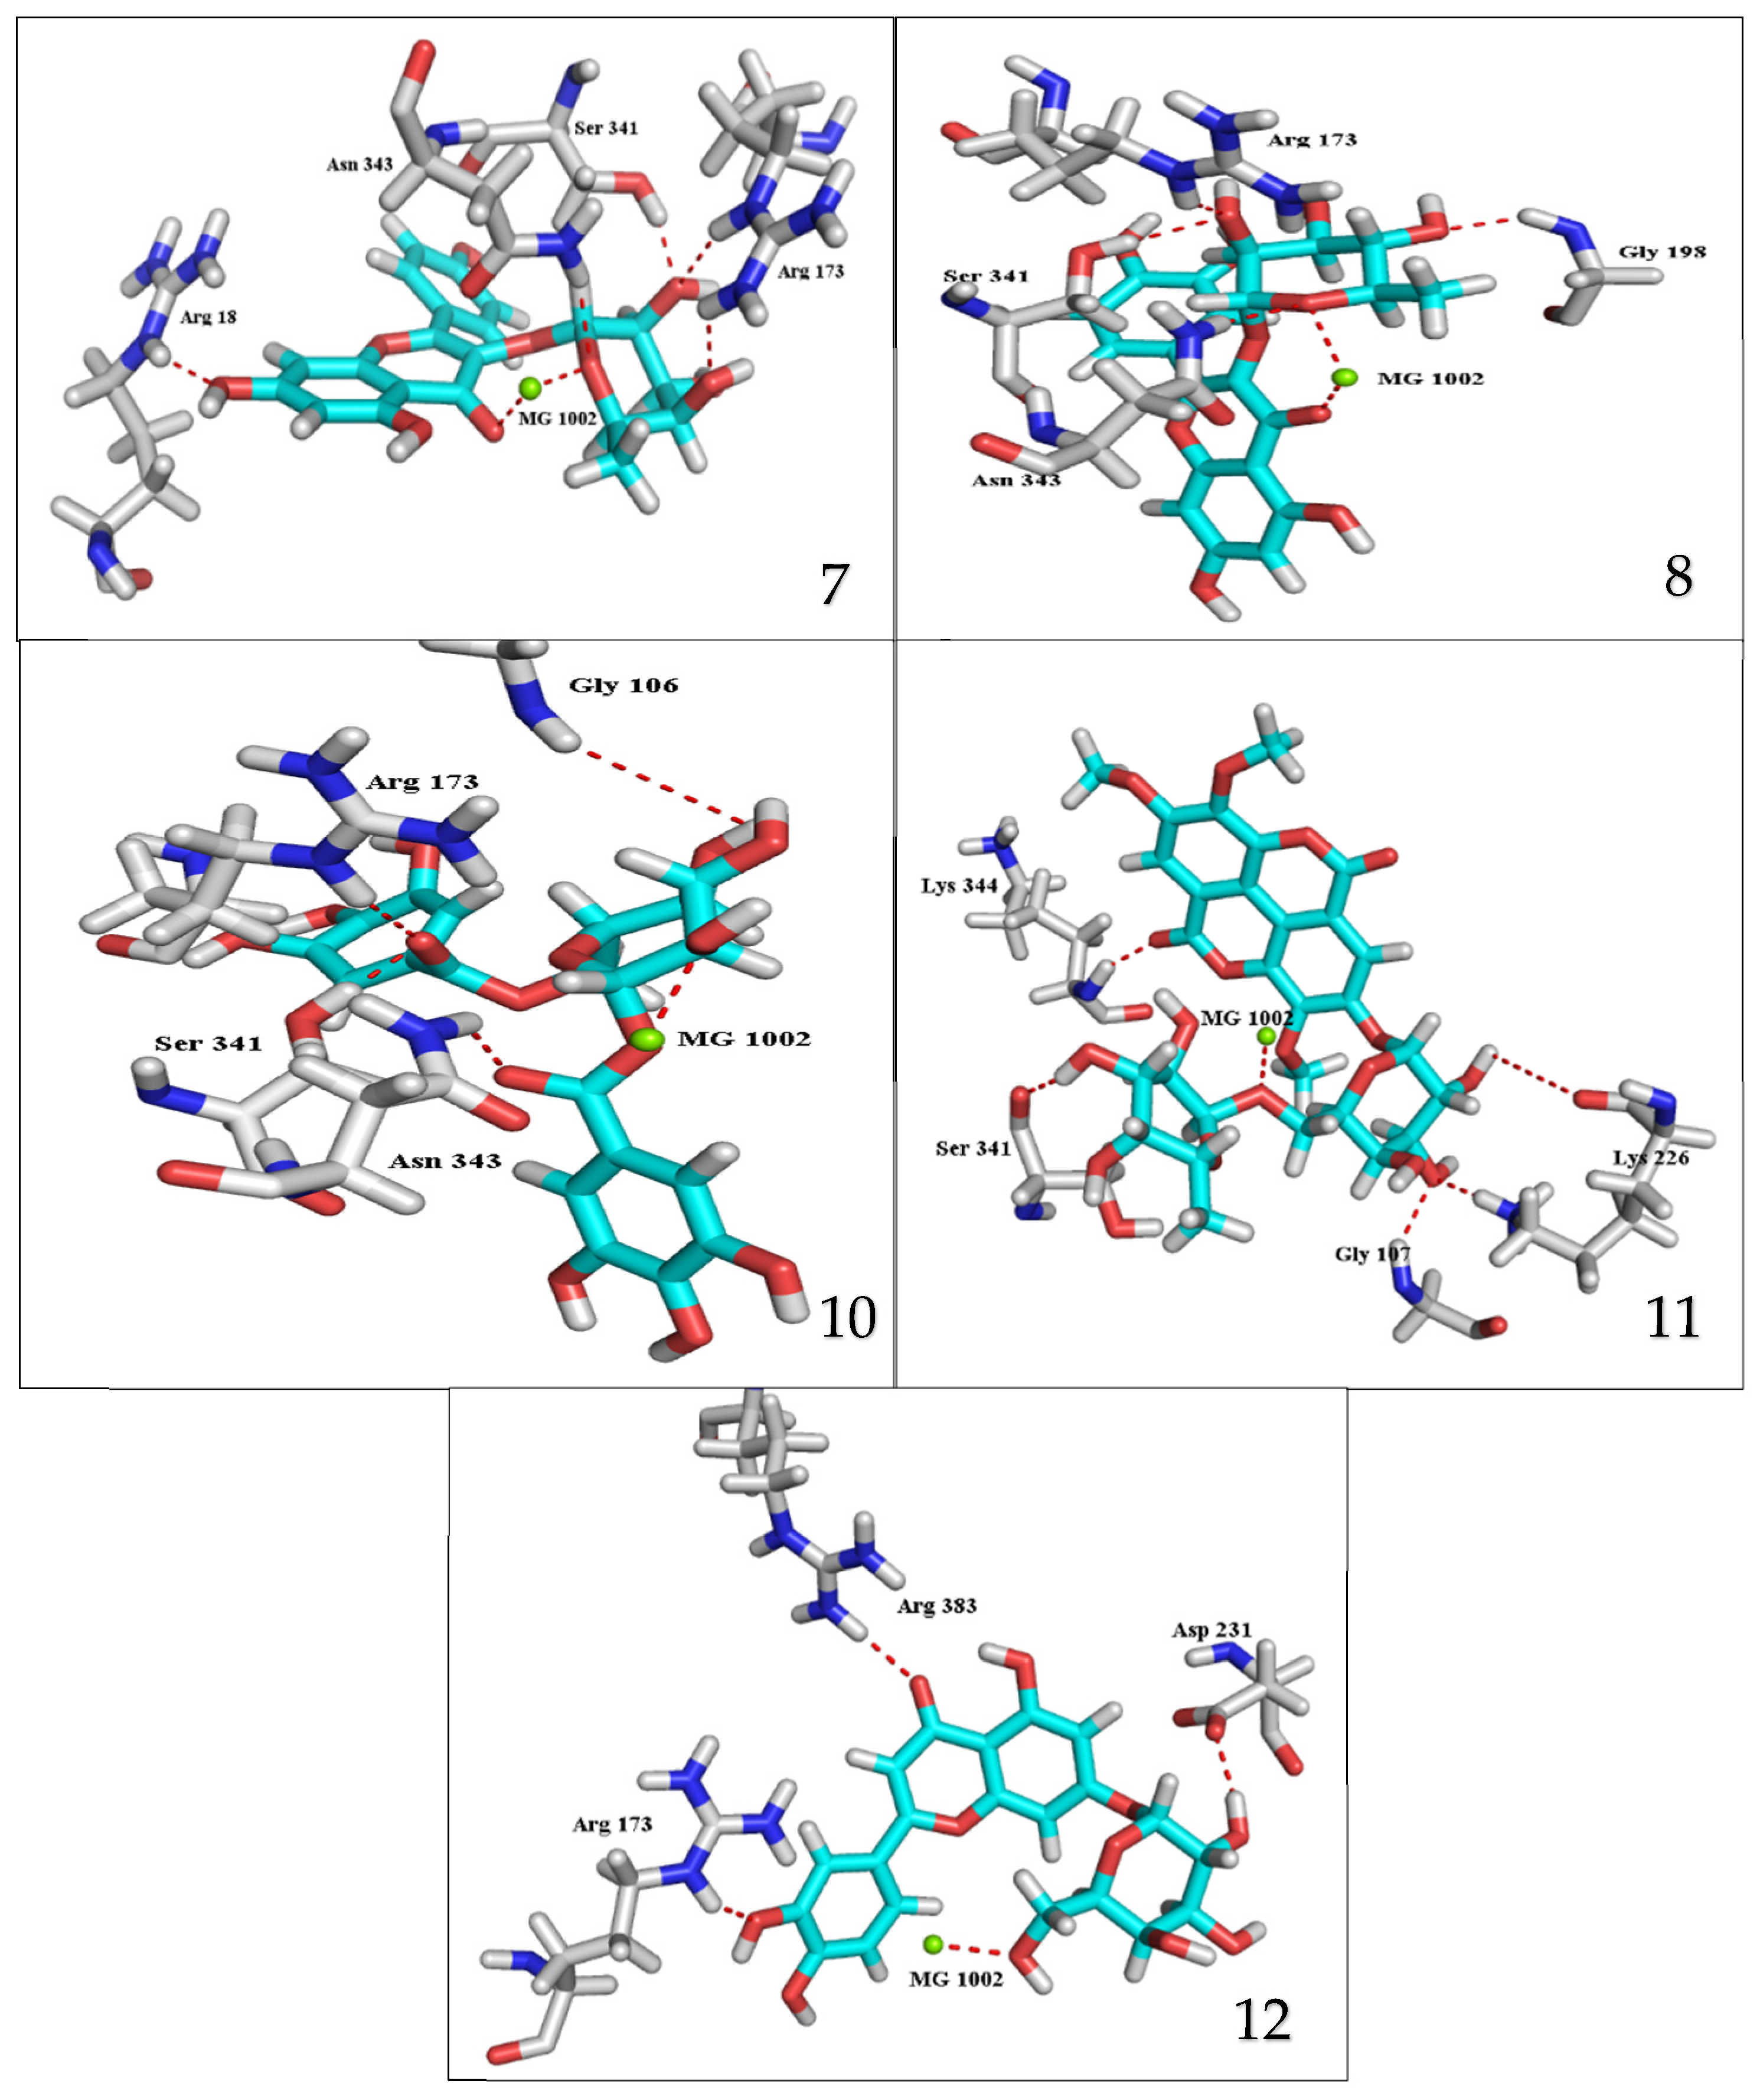
2.4. Docking Study for Anti-Trypanosomal Activity

The results of docking procedures (Table 1) contained binding free energies Kcal/mol, binding affinity constant (ki in nm) [24], distances (in Å) from the main residues, and type of interactions. Most compounds exhibited good affinity to the selected pocket according to binding affinity (Figure 2) while suramin was represented in (Figure 3). Notably compounds 10, 7, 11, 8 and 12 in order, showed good binding affinity energies (from −18.9900 to −23.0767 Kcal/mol) when compared to the co-docked ligand suramin as a positive control (Figure 4). The main residues involved in the interaction between compounds and T. brucei PFK enzyme were Arg173, Ser341, Asn343, Lys226, Thr201, and Gly107 residues as well as Mg Atom (MG1002) that mark them as good candidates for T. brucei PFK inhibition, that could be used for the treatment of trypanosomiasis. Hydrogen acceptor and metal interactions were found to be the main formed interactions between compounds and the enzyme. 3D figures of the most active compounds via PyMOL 2.4 software were represented in (Figure 5).

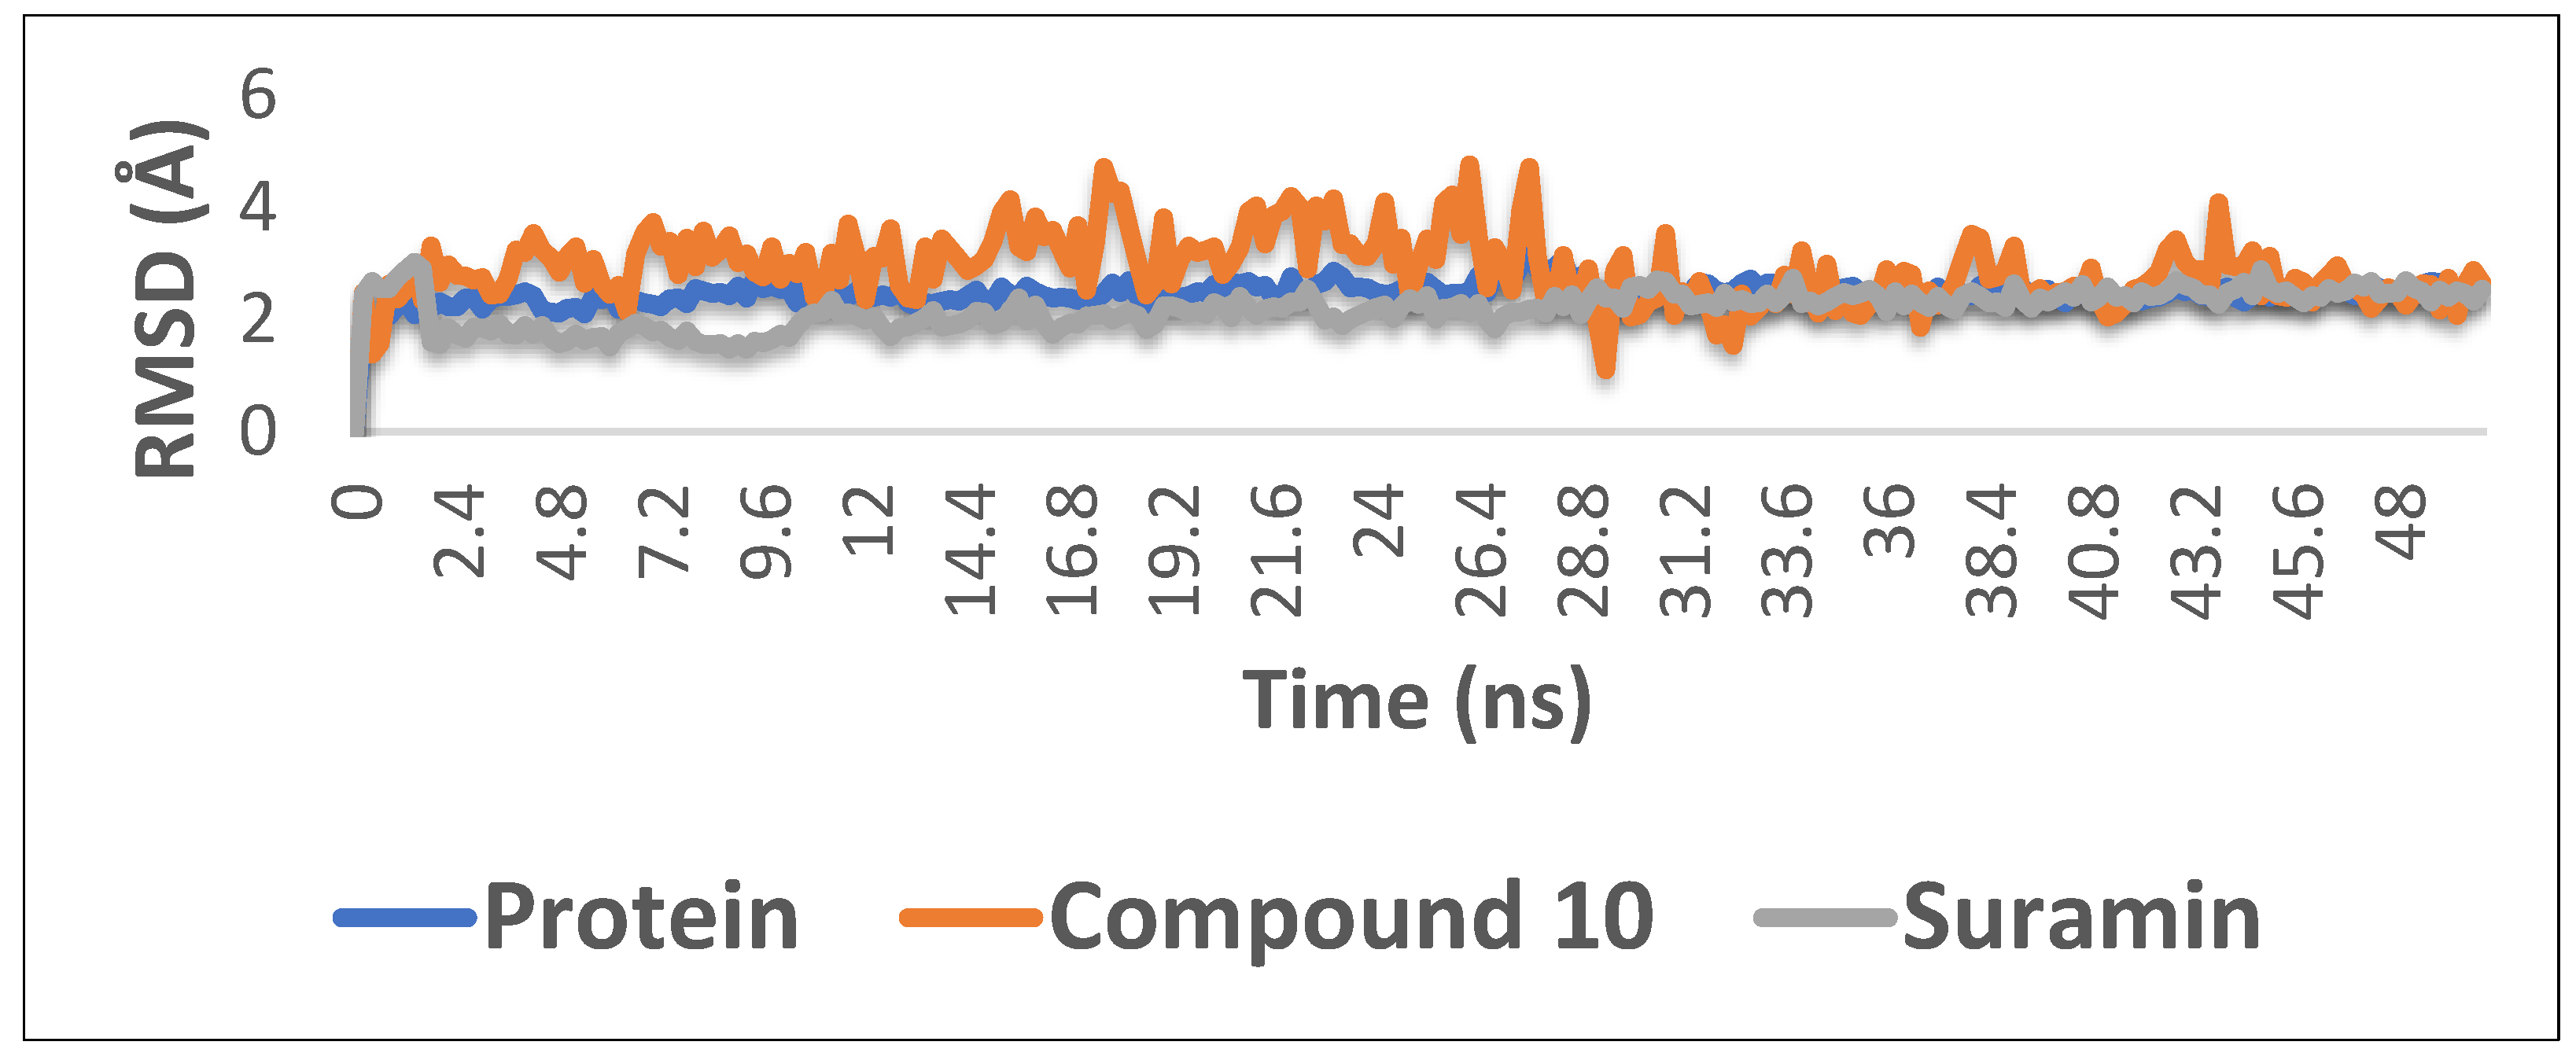
2.5. Molecular Dynamics Simulations

With the aim of proofing the reliability of molecular docking results, further computational validation was achieved through a number of MDS experiments and binding free energy (ΔG) calculations on compound 10 (1,6-di-O-galloyl-d-glucose), as well as suramin. As seen in Figure 6, compound 10 was able to achieve stable binding inside the enzyme′s (i.e., phosphofructokinase, PDB ID:3F5M) active site with an average RMSD from the initial docking pose of 3.1 Å; however, it showed higher fluctuation in comparison with the standard drug suramin. Accordingly, it obtained a binding free energy value (ΔG) of −7.1 kcal/mol (ΔG of suramin was −8.8 kcal/mol).

2.6. Prediction of the Pharmacokinetic Properties and Toxicological Properties Using ADMET

After the molecular docking studies of 12 isolated compounds, the absorption, distribution, metabolism, elimination, and toxicity (ADMET) of the best dock scored compound along with suramin were evaluated (Table 2).

3. Discussion

3.1. Identification of the Isolated Compounds

The phytochemical investigation of different E. abyssinica J.F. Gmel. fractions resulted in the isolation of 12 compounds. The isolated compounds were identified based on various methods, including UV, 1H-NMR, and DEPT-Q NMR spectroscopic analysis, Co-TLC along with authentic samples, in addition to comparison with published data. The isolated compounds were identified as: Glut-5-en-3-β-ol (1) [25,26], ψ-taraxasterol (2) [27,28], 3,3′,4-O-trimethylellagic acid (3) [29], β-sitosterol glucoside (4) [30], methyl gallate (5) [31], gallic acid (6) [32,33], kaempferol-3-O-α-L-rhamnoside (7) [34], quercetin-3-O-α-L-rhamnopyrnosyl (8) [34], 3,3′-dimethylellagic acid-4′-O-β-D-glucopyranoside (9) [35], 1,6-di-O-galloyl-d-glucose (10) [36,37], 3,3′,4-tri-O-methyl-4′-O-rutinosyl-ellagic acid (11) [38], and luteolin-7-O-glucoside (12) [39].
Compound (11) was confirmed by HMBC as it showed long-range correlations between H-1″ (5.15) of glucose and C-4′ (152.21) of the aglycon. The H-1‴ (4.51) of rhamnosyl moiety also displayed long-range correlations with C-6″ (66.53) of glucosyl moiety in HMBC spectrum, suggesting the presence of 1–6 linkages between rhamnose and glucose. The coupling constant (J = 7.48 Hz) of the anomeric proton signal of the glucose indicated a glucosyl moiety having the β configuration. On the other hand, the chemical shift of the anomeric proton (J = 1.62 Hz) of the rhamnose indicated the rhamnosyl moiety having the α configuration.
Noticeably, this is the first report for the occurrence of 1,6-di-O-galloyl-d-glucose (10) in genus Euphoria. However, glut-5-en-3-β-ol (1), ψ-taraxasterol (2), 3,3′,4-O-trimethylellagic acid (3), methyl gallate (5), gallic acid (6), kaempferol-3-O-α-L-rhamnoside (7), quercetin-3-O-α-L-rhamnopyrnosyl (8), 3,3′-dimethylellagic acid-4′-O-β-D-glucopyranoside (9), 3,3′,4-tri-O-methyl-4′-O-rutinosyl-ellagic acid (11), and luteolin-7-O-glucoside (12) were reported, previously, in other Euphoria species [40,41,42,43,44,45,46,47], this is the first report for their isolation from E. abyssinica J.F. Gmel.

3.2. Docking Study for Anti-Trypanosomal Activity

E. abyssinica methanolic extract was previously reported to exhibit potent anti-trypanosomal activity IC50 17.3 and 19.4 μg/mL after 48 and 72 h incubation [23]. Phytochemical investigation of the methanolic extract was performed for isolation and identification of the major compounds. Twelve pure compounds were isolated and identified. Then, molecular docking was performed with T. brucei Phosphofructokinase (PFK) enzyme where most of them showed good affinity to the selected pocket according to binding affinity results. Interestingly, 1,6-di-O-galloyl-d-glucose (10), kaempferol-3-O-α-L-rhamnoside (7), 3,3′,4-tri-O-methyl-4′-O-rutinosyl-ellagic acid (11), and quercetin-3-O-α-L-rhamnopyrnosyl (8), luteolin-7-O-glucoside (12), in this order, showed good binding affinity energies when compared to the co-docked ligand suramin. Several reports highlighted the in vitro efficacy of some flavonoid compounds against T. brucei [19]. Moreover, penta-O-galloyl-β-D-glucose was revealed to have in vitro anti-trypanosomal activity [48]. Furthermore, gallic acid was cited to exert its effect on T. brucei via iron chelation that caused structural and morphological changes and stopping the cell cycle [49]. Most of the reported data informed that the biological activities of galloyl–glucose were related to the number of galloyl moiety [50]. Moreover, quercetin was reported to exhibit potent anti-trypanosomal activity [51]. Herein, the presented results confirmed the potential activity of the flavonoids and gallic acid derivatives against T. brucei (PFK) enzyme and highlighted the high effect of ellagic acid derivatives for further in vitro investigation.

3.3. Molecular Dynamics Simulations

Molecular dynamics (MD) simulation was scientifically used to confirm the reliability of physics-based methodology to evaluate protein-ligand binding interactions [52]. In the current study, MD simulations were carried out on the spike protein (PFK), viz., compound 10 (1,6-di-O-galloyl-d-glucose), and suramin. The results revealed that 1,6-di-O-galloyl-d-glucose held a structural role in modulating the conformational dynamics of the protein. Elsewhere, it was able to solely shield the spike protein and stabilize PFK-like suramin.

3.4. Prediction of the Pharmacokinetic Properties and Toxicological Properties Using ADMET

1,6-di-O-galloyl-d-glucose (10) owns a low molecular weight of less than 500 Da that was considered a major advantage when compared with the larger molecular weight of suramin. This improved the absorption and decreases the toxicity over suramin, which was reported to cause renal impairment [11]. However, tannins were considered to be safe or even beneficial at low dietary levels [50]. The results of the ADMET prediction revealed that 1,6-di-O-galloyl-d-glucose showed high water solubility and respectable cellular permeability. 1,6-di-O-galloyl-d-glucose was likely to be a substrate for P-glycoprotein which was an ATP-binding cassette (ABC) transporter, so it was able to modulate the physiological functions of P-glycoprotein in limiting the active uptake. In addition, the prediction of the distribution properties showed poor blood–brain barrier (BBB) permeability and CNS permeability. Furthermore, 1,6-di-O-galloyl-d-glucose displayed good volume of distribution. However, there was no significant effect on cytochrome P450 metabolism or renal OCT2 substrate excretion. The total clearance as Log(CLtot) was also performed. It predicted the combination of hepatic clearance (metabolism in the liver and biliary clearance) and renal clearance (excretion via the kidneys) and it was found to be 0.47 mL/min/kg. Moreover, pkCSM software was used to predict the toxicological properties of 1,6-di-O-galloyl-d-glucose, such as mutagenicity, hepatotoxicity, cardiotoxicity, and skin sensitization. Herein, the bacterial mutagenic Ames toxicity testing showed that it was a non-mutagenic compound, but the toxicity in T. pyriformis and the cardiotoxicity, in the form of human ether-a-go-go-related gene II (hERG II) is high. Lastly, the maximum tolerated human dose is somewhat acceptable. Conclusively, 1,6-di-O-galloyl-d-glucose showed better-predicted safety and oral bioavailability than the synthetic drug “suramin”.

4. Materials and Methods

4.1. Plant Material

The aerial non-flowering parts of E. abyssinica J.F. Gmel were collected during October 2018 from Helal Cactus farm, Abdel Samad village, El-Mansuriya, Giza, Egypt. It was identified and authenticated by Prof. Dr. Abdel-Halim Mohammed; Professor of Agriculture, Flora department, Agricultural museum, Dokki, Giza, Egypt. A voucher specimen was deposited at the Department of Pharmacognosy, Faculty of Pharmacy, Beni-Suef University under the registration number (2018-BuPD-80).

4.2. Chromatographic Materials and Apparatus

Silica gel G 60 for Column chromatography (70–230 mesh) (Sigma–Aldrich, Chemie,ês Germany), Sephadex LH 20 (Pharmacia, Uppsala, Sweden), aluminium sheet (20 × 20 cm) precoated with silica gel 60 F254, (Merck, Darmstadt, Germany), Polyamide powder S6 for CC (Riedel–De Haen AG, Seezle–Hannover, Germany), p-anisaldehyde/H2SO4 spray reagent [53], and aluminium chloride spray reagent [54]. Solvents used in this work, e.g., n-hexane (60–80 °C), methylene chloride, ethyl acetate, n-butanol, and methanol, were purchased from El-Nasr Company for Pharmaceuticals and Chemicals, Egypt, and were distilled before use. Deuterated solvents (Sigma–Aldrich, Germany), including methanol (CD3OD), chloroform (CDCl3), and dimethyl sulfoxide (DMSO-d6), were used for nuclear magnetic resonance (NMR) spectroscopic analyses. Authentic samples for TLC were from E. Merck, Darmstadt, Germany.
Glass tanks for extraction and development of TLC chromatograms, Rotary evaporator (Buchi, labortechnik AG 9230 Flawil, Switzerland) for the concentration of extracts and fractions, micropipettes (0.1 mL), for spot application, glass columns for chromatography with different dimensions (120 × 5.5 cm, 100 × 5 cm, 30 × 5 cm, 50 × 3 cm, and 40 × 2 cm), an atomizer for spraying the chromatograms, sensitive electric balance (Sartorius, type 1712, West Germany), portable ultraviolet lamb for localization of spots on thin-layer chromatograms (λmax = 254 and 330 nm, Shimadzu), a product of Hanovia Lambs, UV-visible spectrophotometer, Shimadzu UV (P/N 204–58000) was used for recording UV spectra and measuring the absorbance in the UV range, and Bruker Ascend TM 400/R NMR spectrometer, 1H-NMR, 400 MHZ, DEPT-Q NMR, 100 MHz spectra were recorded in a suitable deuterated solvent using TMS as internal standard and chemical shift values expressed in δ ppm (NMR Laboratory, Microanalytical unit) faculty of pharmacy, Beni-Suef University.

4.3. Extraction and Fractionation

The fresh non-flowering aerial parts of E. abyssinica J.F. Gmel. (6.5 kg) were cut into small pieces with a knife then with vegetable chopper and extracted by cold maceration with methanol (80%) till exhaustion. The methanolic extract was evaporated using the rotary evaporator to yield 300 g residue. About 250 g of the residue were suspended in 300 mL distilled water and partitioned successively with n-hexane (4 × 500 mL), methylene chloride (6 × 500 mL), ethyl acetate (5 × 500 mL), and n-butanol saturated with water (7 × 500 mL). Different fractions were evaporated to dryness using the rotary evaporator. The yield of the different extractives was 8, 12, 10, and 15 g residue of the n-hexane, methylene chloride, ethyl acetate, and n-butanol fractions, respectively.

4.4. Investigation of Methylene Chloride Fraction of E. abyssinica J.F. Gmel

The methylene chloride fraction (10 g) was chromatographed on 300 g silica gel H (E-Merk). Gradient elution was carried out using n-hexane 100%, then with n-hexane containing 10% increment of ethyl acetate till 100% ethyl acetate. Each fraction (200 mL) was collected, and monitored by TLC, using methylene chloride: methanol (9.5:0.5 and 9:1) as a solvent system, whereby 8 fractions (F1–F8) were obtained.
Fraction 2 (1.2 g) was rechromatographed over 100 g silica gel H and gradient eluted with n-hexane, then with n-hexane containing 20% increment of methylene chloride till 100% methylene chloride and then with methylene chloride containing 5% increment of methanol till 100% methanol, and then further monitoring by TLC using methylene chloride: methanol (9.5:0.5 and 9:1) as the solvent system was performed, 6 subfractions (f1–f6) were obtained. After further purification of (f2, f3) separately on 25 g Sephadex-LH column using isocratic system 30% methanol: 70% methylene chloride, compound (1) (15 mg) and compound (2) (25 mg) were obtained, respectively.
Fraction 7 (200 mg) was rechromatographed over 20 g silica gel H and gradient eluted with methylene chloride and then with methylene chloride containing 2% increment of methanol till 100% methanol. Fractions (f24–f27) were collected to give compound (3) (50 mg).
Fraction 8 (500 mg) was rechromatographed over 100 g silica gel H and gradient eluted with methylene chloride and then with methylene chloride containing 5% increment of methanol till 100% methanol. Additional monitoring by TLC using methylene chloride: methanol (9:1 and 8.5:1.5) as a solvent system was performed, 6 subfractions (f1–f5) were obtained. After further purification of f3 on 25 g Sephadex-LH column using 90% methanol: 10% methylene chloride as a solvent system, compound (4) (24 mg) was obtained.

4.5. Investigation of Ethyl Acetate Fraction of E. abyssinica J.F. Gmel

The ethyl acetate fraction (8 g) was chromatographed on 125 g polyamide column. Gradient elution was carried out using distilled water, then with distilled water containing 10% increment of methanol till 100% methanol. Fractions of 100 mL each were collected and monitored by TLC using methylene chloride, methanol (9:1 and 8.5:1.5), as a solvent system. Similar fractions were pooled together whereby 4 fractions (F1–F4) were obtained.
Fraction 3 (3.0 g) was rechromatographed over 150 g silica gel H and gradient eluted with methylene chloride then with methylene chloride containing 10% increment of ethyl acetate till 100% ethyl acetate and then with washed by methanol. Fractions of 100 mL each were collected and monitored by TLC using methylene chloride: methanol (9:1, 8.5:1.5, and 8:2) as a solvent system, 5 subfractions (f1–f5) were obtained. After further purification of f2 (100 mg) on 25 g of Sephadex-LH 20 column using 100% methanol as a solvent system, compound (5) (17 mg) and compound (6) (14 mg) were obtained.
Fraction f3 (800 mg) was rechromatographed over 100 g silica gel H and gradient eluted with methylene chloride then with methylene chloride containing 2% increment of methanol till 100% methanol. Extra monitoring by TLC using methylene chloride: methanol (9:1, 8.5:1.5, and 8:2) as the solvent system was performed and 5 subfractions (fr1–fr5) were obtained. Another purification of fr1, fr3, and fr4 on 25 g Sephadex-LH 20 column using 100% methanol as a solvent system, compound (7) (10 mg) was obtained from subfraction fr1 while compound (8) and compound (9) (12 mg, 25 mg, respectively) were obtained from subfraction fr3 and compound (10) (16 mg) was obtained from subfraction fr4.
Fraction f4 (300 mg) was rechromatographed over 30 g silica gel H and gradient eluted with methylene chloride and then with methylene chloride containing 2% increment of methanol till 100% methanol, compound (11) (85 mg) was obtained.

4.6. Investigation of N-Butanol Fraction of E. abyssinica J.F. Gmel

The n-butanol fraction (12 g) was chromatographed on a 125 g polyamide column. Gradient elution was carried out using water 100%, then with distilled water containing 10% increment of methanol till 100% methanol. Fractions of 100 mL of each were collected and monitored by TLC using methylene chloride: methanol (8.5:1.5, 8:2, and 7:3) as a solvent system. The similar fractions were pooled together whereby 6 fractions (F1–F6) were obtained. Fraction 5 (0.5 g) was rechromatographed over 15 g Sephadex-LH 20 column using an isocratic system of 80% methanol: 20% H2O, 10 mL of each, compound (12) (6 mg) was obtained.

4.7. Docking Study for Anti-Trypanosomal Activity

To investigate the protein–ligand interactions, isolated compounds from E. abyssinica were drawn using Marvin sketch powered by Chem-Axon, and ChemBioDraw Ultra 14.0, and then they were applied to a molecular operating environment (MOE) platform to undergo energy optimization for each compound using the MMFF94× force-field. The crystal structure of ATP-bound phosphofructokinase from T. brucei (PDB ID:3F5M) contains 4 chains protein structure and co-crystallized with ATP ligand, snapshotted with X-ray diffraction at 2.70 Å resolution [5]. The structure was obtained from the RSCB protein data bank (http://www.rscb.org accessed on 17 November 2021) and the molecular docking was conducted using the MOE 2020.0101 package.
Visualization and generation of the 3D figures were performed using PyMOL 2.4 software. To ensure the validity of the docking protocol, re-docking of the co-crystallized native ligand into the active site was performed. The coordinates of the best scoring docking pose of the native ligand were compared with its coordinates in the co-crystallized PDB file based on the binding mode and root mean square deviation (RMSD). They showed an alignment with the original ligand as obtained from the X-ray resolved PDB file. The isolated 12 compounds from E. abyssinica and suramin were docked into PFK active domain, then 50 poses of each compound were scored by initial rescoring methodology (London dG) and the final re-scoring methodology (London dG) after placement using Triangle Matcher and post-placement refinement was force-field.

4.8. Molecular Dynamics Simulations

Molecular dynamic simulations (MDS) for the generated ligand-enzyme complexes were performed using the Nanoscale Molecular Dynamics (NAMD) 2.6 software [55], applying the CHARMM27 force field [56]. Hydrogen atoms were added to the protein structures using the psfgen plugin included in the Visual Molecular Dynamic (VMD) 1.9 software [57]. Afterward, the whole generated systems were solvated using water molecules (TIP3P) and 0.15 M NaCl. At first, the total energy of the generated systems was minimized and gradually heated to reach 300 K and equilibrated for 200 s. Subsequently, the MDS was continued for 50 ns, and the trajectory was stored every 0.1 ns and further analyzed with the VMD 1.9 software. The MDS output was sampled every 0.1 ns to calculate the root mean square deviation (RMSD). The parameters of compound 4 were prepared using the online software the VMD Force Field Toolkit (ffTK) [57]. Binding free energies (ΔG) were calculated using the free energy perturbation (FEP) method [58]. The web-based software Absolute Ligand Binder was used to generate the input files for NAMD software which was performed the simulations required for ΔGs calculations [58].

4.9. Prediction of the Pharmacokinetic Properties and Toxicological Properties Using ADMET

The online pkCSM pharmacokinetics prediction properties were used for the calculation of the pharmacokinetic properties of compound (10) and suramin (http://biosig.unimelb.edu.au/pkcsm/prediction accessed on 18 November 2021). The following properties were investigated: Absorption, (water solubility, Caco-2 permeability, intestinal human absorption (HIA), skin permeability, and P-glycoprotein interactions); distribution, (VDss, Fu, Log BB, and CNS permeability); metabolism; excretion. Furthermore, online pkCSM pharmacokinetics were used to predict the toxicity of the molecules, including skin sensitization, hepatotoxicity, and others. The results were analyzed and compared with the reference values of the pkCSM pharmacokinetics prediction properties.

5. Conclusions

Based upon the previous reports of the significant anti-trypanosomal activity of E. abyssinica methanolic extract, a phytochemical investigation of different fractions was carried out. Twelve compounds were isolated where 1,6-di-O-galloyl-d-glucose (10) was isolated for the first time from the Euphoria genus. Moreover, molecular docking of the isolated compounds with T. brucei PFK enzyme indicated compound (10) as a potent trypanosomal PFK inhibitor. The binding stability of (10) inside the pocket of the PFK proteins with time was further validated through molecular dynamics simulations involving root mean square deviation and estimated as ~3.2 Å. Furthermore, ADMET showed satisfactory pharmacokinetic and toxicological properties. The predicted pharmacokinetic properties were within the standardized range for human use. Therefore, combining the docking results, ADMET predictions, and the biological activity of compound 10, we suggest this compound as a promising candidate for further in vitro, in vivo, and clinical studies.

Supplementary Materials

The following are available online at https://www.mdpi.com/article/10.3390/plants11020173/s1, Figure S1: 1H-NMR (400 MHz, CD3OD δ ppm) spectrum of compound 1, Figure S2: DEPT-Q NMR (100 MHz, CD3OD δ ppm) spectrum of compound 1. Figure S3: 1H-NMR (400 MHz, CDCl3 δ ppm) spectrum of compound 2. Figure S4: DEPT-Q NMR (100 MHz, CDCl3 δ ppm) spectrum of compound 2. Figure S5: 1H-NMR (400 MHz, DMSO-d6 δ ppm) spectrum of compound 3. Figure S6: DEPT-Q NMR (100 MHz, DMSO-d6 δ ppm) spectrum of compound 3. Figure S7: 1H-NMR (400 MHz, DMSO-d6 δ ppm) spectrum of compound 4. Figure S8: DEPT-Q NMR (100 MHz, DMSO-d6 δ ppm) spectrum of compound 4. Figure S9: 1H-NMR (400 MHz, CD3OD δ ppm) spectrum of compound 5. Figure S10: DEPT-Q NMR (100 MHz, CD3OD δ ppm) spectrum of compound 5. Figure S11: 1H-NMR (400 MHz, CD3OD δ ppm) spectrum of compound 6. Figure S12: DEPT-Q NMR (100 MHz, CD3OD δ ppm) spectrum of compound 6. Figure S13: 1H-NMR (400 MHz, CD3OD δ ppm) spectrum of compound 7. Figure S14: DEPT-Q NMR (100 MHz, CD3OD δ ppm) spectrum of compound 7. Figure S15: 1H-NMR (400 MHz, CD3OD δ ppm) spectrum of compound 8. Figure S16: DEPT-Q NMR (100 MHz, CD3OD δ ppm) spectrum of compound 8. Figure S17: 1H-NMR (400 MHz, DMSO-d6 δ ppm) spectrum of compound 9. Figure S18: DEPT-Q NMR (100 MHz, DMSO-d6 δ ppm) spectrum of compound 9. Figure S19: 1H-NMR (400 MHz, CD3OD δ ppm) spectrum of compound 10. Figure S20: DEPT-Q NMR (100 MHz, CD3OD δ ppm) spectrum of compound 10. Figure S21: 1H-NMR (400 MHz, DMSO-d6 δ ppm) spectrum of compound 11. Figure S22: DEPT-Q NMR (100 MHz, DMSO-d6 δ ppm) spectrum of compound 11 Figure S23: 1H-NMR (400 MHz, CD3OD δ ppm) spectrum of compound 12. Figure S24: DEPT-Q NMR (100 MHz, CD3OD δ ppm) spectrum of compound 12.

Author Contributions

Conceptualization, S.S.E.-H.; data curation, N.M.L. and E.A.; formal analysis, N.M.L. and M.A.M.; funding acquisition, N.M.L., S.A.A. and B.H.; investigation, N.M.L.; methodology, M.A.M.; project administration, R.M. and E.A.; resources, N.M.L. and E.A.; software, M.A.M.; supervision, S.S.E.-H. and S.F.A.; validation, E.A. and M.A.M.; visualization, R.M. and S.F.A.; writing—original draft, N.M.L.; writing—review and editing, E.A. All authors have read and agreed to the published version of the manuscript.

Funding

This research received no external funding.

Institutional Review Board Statement

Not applicable.

Informed Consent Statement

Not applicable.

Data Availability Statement

All data generated or analyzed during this study are included in this published article.

Acknowledgments

The authors would like to thank the Deanship of Scientific Research, Qassim University for funding the publication of this project. The authors thank Nahda University, Beni-Suef (NUB) for supporting this work. We thank Ahmed M. Sayed for helping with molecular dynamics simulations study.

Conflicts of Interest

The authors declare no conflict of interest.

References

  1. Merritt, C.; Silva, L.E.; Tanner, A.L.; Stuart, K.; Pollastri, M.P. Kinases as druggable targets in trypanosomatid protozoan parasites. Chem. Rev. 2014, 114, 11280–11304. [Google Scholar] [CrossRef] [Green Version]
  2. Ayyildiz, M.; Celiker, S.; Ozhelvaci, F.; Akten, E.D. Identification of Alternative Allosteric Sites in Glycolytic Enzymes for Potential Use as Species-Specific Drug Targets. Front. Mol. Biosci. 2020, 7, 88. [Google Scholar] [CrossRef] [PubMed]
  3. McNae, I.W.; Kinkead, J.; Malik, D.; Yen, L.-H.; Walker, M.K.; Swain, C.; Webster, S.P.; Gray, N.; Fernandes, P.M.; Myburgh, E. Fast acting allosteric phosphofructokinase inhibitors block trypanosome glycolysis and cure acute African trypanosomiasis in mice. Nat. Commun. 2021, 12, 1052. [Google Scholar] [CrossRef] [PubMed]
  4. Dunaway, G.A. A review of animal phosphofructokinase isozymes with an emphasis on their physiological role. Mol. Cell. Biochem. 1983, 52, 75–91. [Google Scholar] [CrossRef] [PubMed]
  5. McNae, I.W.; Martinez-Oyanedel, J.; Keillor, J.W.; Michels, P.A.M.; Fothergill-Gilmore, L.A.; Walkinshaw, M.D. The crystal structure of ATP-bound phosphofructokinase from Trypanosoma brucei reveals conformational transitions different from those of other phosphofructokinases. J. Mol. Biol. 2009, 385, 1519–1533. [Google Scholar] [CrossRef]
  6. Albert, M.-A.; Haanstra, J.R.; Hannaert, V.; Van Roy, J.; Opperdoes, F.R.; Bakker, B.M.; Michels, P.A.M. Experimental and in silico analyses of glycolytic flux control in bloodstream form Trypanosoma brucei. J. Biol. Chem. 2005, 280, 28306–28315. [Google Scholar] [CrossRef] [PubMed] [Green Version]
  7. Opperdoes, F.R. Compartmentation of carbohydrate metabolism in trypanosomes. Annu. Rev. Microbiol. 1987, 41, 127–151. [Google Scholar] [CrossRef]
  8. Martinez-Oyanedel, J.; McNae, I.W.; Nowicki, M.W.; Keillor, J.W.; Michels, P.A.M.; Fothergill-Gilmore, L.A.; Walkinshaw, M.D. The first crystal structure of phosphofructokinase from a eukaryote: Trypanosoma brucei. J. Mol. Biol. 2007, 366, 1185–1198. [Google Scholar] [CrossRef]
  9. T Jacobs, R.; Nare, B.; A Phillips, M. State of the art in African trypanosome drug discovery. Curr. Top. Med. Chem. 2011, 11, 1255–1274. [Google Scholar] [CrossRef] [Green Version]
  10. Brimacombe, K.R.; Walsh, M.J.; Liu, L.; Vásquez-Valdivieso, M.G.; Morgan, H.P.; McNae, I.; Fothergill-Gilmore, L.A.; Michels, P.A.M.; Auld, D.S.; Simeonov, A. Identification of ML251, a potent inhibitor of T. brucei and T. cruzi phosphofructokinase. ACS Med. Chem. Lett. 2014, 5, 12–17. [Google Scholar] [CrossRef] [Green Version]
  11. Girdhar, S.; Girdhar, A.; Lather, V.; Pandita, D. Novel therapeutic targets for human African trypanosomiasis. Curr. Treat. Options Infect. Dis. 2017, 9, 200–209. [Google Scholar] [CrossRef]
  12. Luisi, G.; Carradori, S. New Compounds for the Management of Trypanosoma brucei Infection. In Topics in Medicinal Chemistry; Springer: Berlin/Heidelberg, Germany, 2021. [Google Scholar] [CrossRef]
  13. EL-Fiky, F.; Asres, K.; Gibbons, S.; Hammoda, H.; Badr, J.; Umer, S. Phytochemical and Antimicrobial Investigation of Latex from Euphorbia abyssinica Gmel. Nat. Prod. Commun. 2008, 3, 1505–1508. [Google Scholar] [CrossRef] [Green Version]
  14. Dorsey, B.L.; Haevermans, T.; Aubriot, X.; Morawetz, J.J.; Riina, R.; Steinmann, V.W.; Berry, P.E. Phylogenetics, morphological evolution, and classification of Euphorbia subgenus Euphorbia. Taxon 2013, 62, 291–315. [Google Scholar] [CrossRef] [Green Version]
  15. Vasas, A.; Hohmann, J. Euphorbia Diterpenes: Isolation, Structure, Biological Activity, and Synthesis (2008–2012). Chem. Rev. 2014, 114, 8579–8612. [Google Scholar] [CrossRef] [PubMed] [Green Version]
  16. Marco, J.A.; Sanz-Cervera, J.F.; Ropero, F.J.; Checa, J.; Fraga, B.M. Ingenane and lathyrane diterpenes from the latex of Euphorbia acrurensis. Phytochemistry 1998, 49, 1095–1099. [Google Scholar] [CrossRef]
  17. El-Hawary, S.S.; Mohammed, R.; Tawfike, A.F.; Lithy, N.M.; AbouZid, S.F.; Amin, M.N.; Abdelmohsen, U.R.; Amin, E. Cytotoxic activity and metabolic profiling of fifteen Euphorbia Species. Metabolites 2021, 11, 15. [Google Scholar] [CrossRef]
  18. Muluye, A.B.; Desta, A.G.; Abate, S.K.; Dano, G.T. Anti-malarial activity of the root extract of Euphorbia abyssinica (Euphorbiaceae) against Plasmodium berghei infection in mice. Malar. J. 2019, 18, 261. [Google Scholar] [CrossRef] [Green Version]
  19. Boniface, P.K.; Elizabeth, F.I. Flavonoid-derived privileged scaffolds in anti-trypanosoma brucei drug discovery. Curr. Drug Targets 2019, 20, 1295–1314. [Google Scholar] [CrossRef]
  20. Jabalia, N.; Kumar, A.; Kumar, V.; Rani, R. In Silico Approach in Drug Design and Drug Discovery: An Update. In Innovations and Implementations of Computer Aided Drug Discovery Strategies in Rational Drug Design; Springer: Singapore, 2021; pp. 245–271. [Google Scholar]
  21. Kanapeckaitė, A.; Beaurivage, C.; Jančorienė, L.; Mažeikienė, A. In silico drug discovery for a complex immunotherapeutic target-human c-Rel protein. Biophys. Chem. 2021, 276, 106593. [Google Scholar] [CrossRef]
  22. Silakari, O.; Singh, P.K. Concepts and Experimental Protocols of Modelling and Informatics in Drug Design; Academic Press: Cambridge, MA, USA, 2020; ISBN 0128205466. [Google Scholar]
  23. El-Hawary, S.S.; Lithy, N.M.; Amin, E.; AbouZid, S.F.; Mohammed, R. Anti-trypanosomal activity and DNA fingerprinting of fifteen Euphorbia species using ISSR and SCoT markers. Beni-Suef Univ. J. Basic Appl. Sci. 2021, 10, 54. [Google Scholar] [CrossRef]
  24. Onawole, A.T.; Kolapo, T.U.; Sulaiman, K.O.; Adegoke, R.O. Structure based virtual screening of the Ebola virus trimeric glycoprotein using consensus scoring. Comput. Biol. Chem. 2018, 72, 170–180. [Google Scholar] [CrossRef] [PubMed]
  25. Akihisa, T.; Yamamoto, K.; Tamura, T.; Kimura, Y.; Iida, T.; Nambara, T.; Chang, F.C. Triterpenoid Ketones from Lingnania chungii MoClure: Arborinone, friedelin and glutinone. Chem. Pharm. Bull. 1992, 40, 789–791. [Google Scholar] [CrossRef] [Green Version]
  26. Olea, R.S.G.; Torres, L.M.B.; Roque, L.C.; Roque, N.F. 13C NMR spectroscopic data for glutinol and derivatives. Magn. Reson. Chem. 1994, 32, 378–379. [Google Scholar] [CrossRef]
  27. Kuo, Y.-H.; Chaiang, Y.-M. Five new taraxastane-type triterpenes from the aerial roots of Ficus microcarpa. Chem. Pharm. Bull. 1999, 47, 498–500. [Google Scholar] [CrossRef] [Green Version]
  28. Reynolds, W.F.; McLean, S.; Poplawski, J.; Enriquez, R.G.; Escobar, L.I.; Leon, I. Total assignment of 13C and 1H spectra of three isomeric triterpenol derivatives by 2D NMR: An investigation of the potential utility of 1H chemical shifts in structural investigations of complex natural products. Tetrahedron 1986, 42, 3419–3428. [Google Scholar] [CrossRef]
  29. Zhang, F.; Fu, T.J.; Peng, S.L.; Liu, Z.R.; Ding, L.S. Two new triterpenoids from the roots of Sanguisorba officinalis L. J. Integr. Plant Biol. 2005, 47, 251–256. [Google Scholar] [CrossRef]
  30. Vo, T.K.; Ta, Q.T.H.; Chu, Q.T.; Nguyen, T.T.; Vo, V.G. Anti-Hepatocellular-Cancer Activity Exerted by β-Sitosterol and β-Sitosterol-Glucoside from Indigofera zollingeriana Miq. Molecules 2020, 25, 3021. [Google Scholar] [CrossRef] [PubMed]
  31. Sánchez, E.; Heredia, N.; Camacho-Corona, M.D.R.; García, S. Isolation, characterization and mode of antimicrobial action against Vibrio cholerae of methyl gallate isolated from Acacia farnesiana. J. Appl. Microbiol. 2013, 115, 1307–1316. [Google Scholar] [CrossRef] [PubMed]
  32. Hernández-García, E.; García, A.; Avalos-Alanís, F.G.; Rivas-Galindo, V.M.; Delgadillo-Puga, C.; Camacho-Corona, M.D.R. Nuclear magnetic resonance spectroscopy data of isolated compounds from Acacia farnesiana (L) Willd fruits and two esterified derivatives. Data Br. 2019, 22, 255–268. [Google Scholar] [CrossRef]
  33. Farag, M.A.; Al-Mahdy, D.A.; Salah El Dine, R.; Fahmy, S.; Yassin, A.; Porzel, A.; Brandt, W. Structure Activity Relationships of Antimicrobial Gallic Acid Derivatives from Pomegranate and Acacia Fruit Extracts against Potato Bacterial Wilt Pathogen. Chem. Biodivers. 2015, 12, 955–962. [Google Scholar] [CrossRef]
  34. Lee, S.Y.; So, Y.-J.; Shin, M.S.; Cho, J.Y.; Lee, J. Antibacterial effects of afzelin isolated from Cornus macrophylla on Pseudomonas aeruginosa, a leading cause of illness in immunocompromised individuals. Molecules 2014, 19, 3173–3180. [Google Scholar] [CrossRef] [PubMed]
  35. Nono, R.N.; Barboni, L.; Teponno, R.B.; Quassinti, L.; Bramucci, M.; Vitali, L.A.; Petrelli, D.; Lupidi, G.; Tapondjou, A.L. Antimicrobial, antioxidant, anti-inflammatory activities and phytoconstituents of extracts from the roots of Dissotis thollonii Cogn. (Melastomataceae). S. Afr. J. Bot. 2014, 93, 19–26. [Google Scholar] [CrossRef]
  36. Nonaka, G.; Nishioka, I. Tannins and related compounds. X. Rhubarb (2): Isolation and structures of a glycerol gallate, gallic acid glucoside gallates, galloylglucoses and isolindleyin. Chem. Pharm. Bull. 1983, 31, 1652–1658. [Google Scholar] [CrossRef] [Green Version]
  37. Li, C.W.; Dong, H.J.; Cui, C. Bin The synthesis and antitumor activity of twelve galloyl glucosides. Molecules 2015, 20, 2034–2060. [Google Scholar] [CrossRef] [Green Version]
  38. Lin, S.J.; Yeh, C.H.; Yang, L.M.; Liu, P.C.; Hsu, F.L. Phenolic compounds from Formosan Euphorbia tirucalli. J. Chin. Chem. Soc. 2001, 48, 105–108. [Google Scholar] [CrossRef]
  39. Wang, M.; Li, J.; Rangarajan, M.; Shao, Y.; LaVoie, E.J.; Huang, T.-C.; Ho, C.-T. Antioxidative phenolic compounds from sage (Salvia officinalis). J. Agric. Food Chem. 1998, 46, 4869–4873. [Google Scholar] [CrossRef]
  40. Uchida, H.; Yamashita, H.; Anai, T.; Muranaka, T.; Ohyama, K. Agrobacterium-Mediated Transformation of Euphorbia tirucalli Callus. Biosci. Biotechnol. Biochem. 2010, 74, 851–853. [Google Scholar] [CrossRef] [Green Version]
  41. Khan, A.Q.; Ahmed, Z.; Malik, A. Further triterpenes from the stem bark of Euphorbia tirucalli. Planta Med. 1987, 53, 577. [Google Scholar] [CrossRef]
  42. Jia, H.Y.; Liao, Z.X.; Liu, F.Y.; Wu, L.; Xu, C.; Zuo, B. A new phenylpropanoid from the roots of Euphorbia nematocypha. Nat. Prod. Res. 2015, 29, 650–655. [Google Scholar] [CrossRef]
  43. Wang, L.; Yu, M.-M.; Chi, Y.-Q.; Ouyang, W.-B.; Zang, Z.; Zhao, Y. Chemical constituents of Euphorbia dracunculoides. Zhongguo Zhong Yao Za Zhi= Zhongguo Zhongyao Zazhi= China J. Chin. Mater. Med. 2014, 39, 3969–3973. [Google Scholar]
  44. Le, D.T.K.; Bui, H.X.; Nguyen, T.T.A.; Pham, T.N.K.; Duong, H.T. Chemical constituents of Euphorbia tirucalli L. Sci. Technol. Dev. J. Sci. 2018, 2, 76–82. [Google Scholar] [CrossRef]
  45. Yoshida, T.; Yokoyama, K.; Namba, O.; Okuda, T. Tannins and Related Polyphenols of Euphorbiaceous Plants. VII. Tirucallins A, B and Euphorbin F, Monomeric and Dimeric Ellagitannins from Euphorbia tirucalli L. Chem. Pharm. Bull. 1991, 39, 1137–1143. [Google Scholar] [CrossRef] [Green Version]
  46. Yang, D.S.; Li, Z.L.; Wei, J.G.; Yang, Y.P.; Li, X.L. Chemical constituents of Euphorbia royleana. Chin. Tradit. Herb. Drugs 2013, 44, 2039–2043. [Google Scholar]
  47. Tian, Y.; Sun, L.-M.; Liu, X.-Q.; Li, B.; Wang, Q.; Dong, J.-X. Anti-HBV active flavone glucosides from Euphorbia humifusa Willd. Fitoterapia 2010, 81, 799–802. [Google Scholar] [CrossRef]
  48. Santos, R.T.D.; Hiramoto, L.L.; Lago, J.H.G.; Sartorelli, P.; Tempone, A.G.; Pinto, E.G. Anti-trypanosomal activity of 1, 2, 3, 4, 6-penta-O-galloyl-β-D-glucose isolated from Plectranthus barbatus Andrews (Lamiaceae). Quim. Nova 2012, 35, 2229–2332. [Google Scholar] [CrossRef] [Green Version]
  49. Amisigo, C.M.; Antwi, C.A.; Adjimani, J.P.; Gwira, T.M. In vitro anti-trypanosomal effects of selected phenolic acids on Trypanosoma brucei. PLoS ONE 2019, 14, e0216078. [Google Scholar] [CrossRef] [PubMed] [Green Version]
  50. Zhang, J.; Li, L.; Kim, S.-H.; Hagerman, A.E.; Lü, J. Anti-cancer, anti-diabetic and other pharmacologic and biological activities of penta-galloyl-glucose. Pharm. Res. 2009, 26, 2066–2080. [Google Scholar] [CrossRef] [PubMed] [Green Version]
  51. Olanrewaju Timothy, O.; Odumosu Patricia, O.; Eyong Kenneth, O. Anti-trypanosomal evaluation of Ximenia americana root bark and chromatographic-mass spectrometric profile. GSC Biol. Pharm. Sci. 2019, 7, 108–117. [Google Scholar] [CrossRef]
  52. Guterres, H.; Im, W. Improving protein-ligand docking results with high-throughput molecular dynamics simulations. J. Chem. Inf. Model. 2020, 60, 2189–2198. [Google Scholar] [CrossRef]
  53. Hecker, E. Cocarcinogenic Principles from the Seed Oil of Croton tiglium and from Other Euphorbiaceae. Cancer Res. 1968, 28, 2338–2349. [Google Scholar] [PubMed]
  54. Markham, K.R. Techniques of Flavonoid Identification; Academic press: Cambridge, MA, USA, 1982; ISBN 0124726801. [Google Scholar]
  55. Phillips, J.C.; Braun, R.; Wang, W.; Gumbart, J.; Tajkhorshid, E.; Villa, E.; Chipot, C.; Skeel, R.D.; Kale, L.; Schulten, K. Scalable molecular dynamics with NAMD. J. Comput. Chem. 2005, 26, 1781–1802. [Google Scholar] [CrossRef] [Green Version]
  56. MacKerell Jr, A.D.; Bashford, D.; Bellott, M.; Dunbrack, R.L., Jr.; Evanseck, J.D.; Field, M.J.; Fischer, S.; Gao, J.; Guo, H.; Ha, S. All-atom empirical potential for molecular modeling and dynamics studies of proteins. J. Phys. Chem. B 1998, 102, 3586–3616. [Google Scholar] [CrossRef]
  57. Jo, S.; Kim, T.; Iyer, V.G.; Im, W. CHARMM-GUI: A web-based graphical user interface for CHARMM. J. Comput. Chem. 2008, 29, 1859–1865. [Google Scholar] [CrossRef] [PubMed]
  58. Jo, S.; Jiang, W.; Lee, H.S.; Roux, B.; Im, W. CHARMM-GUI Ligand Binder for absolute binding free energy calculations and its application. J. Chem. Inf. Model. 2013, 53, 267–277. [Google Scholar] [CrossRef] [PubMed] [Green Version]
Figure 1. Structure of the isolated compounds from E. abyssinica.
Plants 11 00173 g001
Figure 2. 2D interaction diagram of the top docking pose of the isolated compounds.
Plants 11 00173 g002
Figure 3. 2D interaction diagram of the top docking pose of suramin.
Plants 11 00173 g003
Figure 4. Binding free energy score of the most active isolated compounds and suramin with T. brucei PFK enzyme (PDB ID:3F5M).
Plants 11 00173 g004
Figure 5. 3D interaction caption of the top docking pose of the most active isolated compounds.
Plants 11 00173 g005
Figure 6. The RMSD curve from the molecular dynamics simulations of compound 10. The X-axis represents the simulation time (in ps), while the y-axis represents the RMSD value (in nm).
Plants 11 00173 g006
Table 1. Binding energy score of the target isolated twelve compounds and suramin with T. brucei Phosphofructokinase enzyme (PDB ID:3F5M).
Compound Phosphofructokinase Enzyme (PDB ID:3F5M)
Binding Free Energy
(Kcal/mol)
Binding Affinity Constant (ki = nM)Distance (in Å) from
Main Residue
Interaction
Glut-5-en-3-β-ol (1)−10.528319.62.05Ser341H-acceptor
ψ-Taraxasterol (2)−5.590280830---
3,3′,4-O-Trimethylellagic acid (3)−9.799067.073.66
2.48
1.02
Arg173
Ser341
MG1002
pi-H
pi-H
Metal
β-Sitosterol glucoside (4)−13.98940.0571.96
1.74
1.48
1.13
1.12
Arg173
Ser341
Asn343
MG1002
MG1002
H-acceptor
H-donor
H-acceptor
Metal
Metal
Methyl gallate (5)−13.02530.291.99
1.91
1.13
Asn343
Ser172
MG1002
H-acceptor
H-donor
Metal
Gallic acid (6)−11.33165.062.10
1.10
Asn343
MG1002
H-acceptor Metal
Kaempferol-3-O-α-L-rhamnoside (7)
(Afzelin)
−21.39482.22 × 10−72.35
1.97
1.75
1.94
2.01
1.05
1.02
Arg173
Arg173
Ser341
Asn343
Arg18
MG1002
MG1002
H-acceptor
H-acceptor
H-acceptor
H-acceptor
H-acceptor
Metal
Metal
Quercetin-3-O-α-L-rhamnopyrnosyl (8) (Quercitrin)−20.33341.3 × 10−61.93
2.11
1.88
1.91
1.33
1.08
Arg173
Ser341
Asn343
Gly198
MG1002
MG1002
H-acceptor
H-acceptor
H-acceptor
H-acceptor
Metal
Metal
3,3′-Dimethylellagic acid-4′-O-β-d-glucopyranoside (9)−12.87990.373.94
3.61
2.14
2.84
1.98
2.13
Arg173
Asn343
Asp199
Arg18
MG1002
MG1002
pi-cation
pi-H
H-donor
H-acceptor
Metal
Metal
1,6-di-O-galloyl-d-glucose (10)−23.07671.3 × 10−82.42
1.58
1.84
2.11
1.22
Arg173
Ser341
Asn343
Gly106
MG1002
H-acceptor
H-acceptor
H-acceptor
H-acceptor
Metal
3,3′,4-Tri-O-methyl-4′-O-rutinosyl-ellagic acid (11)−21.26402.2× 10−72.05
2.29
1.83
2.11
1.83
1.41
Ser341
Lys226
Lys226
Gly107
Lys344
MG1002
H-donor
H-acceptor
H-acceptor
H-acceptor
H-acceptor
Metal
Luteolin-7-O-glucoside (12) (cynaroside)−18.99001.3 × 10−52.74
2.09
2.81
1.13
Arg173
Arg383
Asp231
MG1002
H-acceptor
H-acceptor
H-donor
Metal
Suramin−25.33262.9 × 10−101.82
2.04
2.18
1.80
2.12
2.24
2.26
2.00
1.00
Arg173
Arg173
Arg173
Ser341
Asn343
Asn343
Arg18
Pro175
MG1002
H-donor
H-acceptor
H-acceptor
H-donor
H-acceptor
H-acceptor
H-acceptor
H-donor
Metal
Table 2. ADMET properties of compound 10 and suramin.
PropertiesCompound 10Suramin
AbsorptionCaco-2 permeability (log Papp in 10−6 cm/s)−1.682−3.097
HIA (% Absorbed)15.64%0
P-glycoprotein substrateYesNon
P-glycoprotein I inhibitorNonNon
P-glycoprotein II inhibitorNonNon
Pure water solubility (log mol/L)−2.895−2.892
Skin Permeability (log Kp)−2.735−2.735
DistributionBBB Permeability (log BB)−2.435−4.438
CNS permeability (log PS)−4.668−4.991
VDss human (log L/kg)1.614−0.007
Fraction unbound human (Fu)0.3470.379
MetabolismCYP 2C19 inhibitorNonNon
CYP 2C9 inhibitorNonNon
CYP 2D6 inhibitorNonNon
CYP 2D6 substrateNonNon
CYP 3A4 inhibitorNonNon
CYP 3A4 substrateNonNon
CYP 1A2 inhibitorNonNon
ExcretionTotal Clearance (log mL/min/kg)0.47−4.065
Renal OCT2 substrateNonNon
ToxicityAmes testnon-mutagennon-mutagen
Max. tolerated dose human (log mg/kg/day)0.490.438
Oral Rat Acute Toxicity LD50 (mol/kg)2.5152.482
Oral Rat Chronic Toxicity LOAEL (log mg/kg-bw/day)3.4916.817
hERG I inhibitorNonNon
hERG II inhibitorYesYes
T. pyriformis toxicity (log μg/L)0.2850.285
minnow toxicity (log mM)5.8376.162
Publisher’s Note: MDPI stays neutral with regard to jurisdictional claims in published maps and institutional affiliations.

