Abstract
Breeding for Al tolerance is the most sustainable strategy to reduce yield losses caused by Al toxicity in plants. The use of rapid, cheap and reliable testing methods and environments enables breeders to make quick selection decisions. The objectives of this study were to (i) identify high dry matter yielding and stable quality protein maize (QPM) lines grown under Al toxic and optimum conditions and (ii) compare the discriminating power of laboratory- and greenhouse-based testing environments. A total of 75 tropical QPM inbred lines were tested at seedling stage for dry matter yield and stability under optimum and Al toxic growing conditions across six laboratory- and greenhouse-based environments. The nutrient solution method was used for the laboratory trials, while the soil bioassay method was used for the greenhouse trials. A yield loss of 55% due to Al toxicity was observed, confirming the adverse effects of Al toxicity on maize productivity. The ANOVA revealed the presence of genetic variation among the set of genotypes used in this study, which can be exploited through plant breeding. Seventeen stable and high-yielding lines were identified and recommended. Greenhouse-based environments were more discriminating than laboratory environments. Therefore, we concluded that greenhouse environments are more informative than laboratory environments when testing genotypes for Al tolerance.
1. Introduction
Low pH or acidic soils are one of the major limitations to maize (Zea mays L.) productivity in the tropics. Acidic soils are widely distributed in tropical and subtropical areas, constituting about 50% of the world’s potentially arable soils. They are found in approximately 20% of the world’s maize mega environments [1,2]. Acidic soil conditions enhance the solubility of aluminum (Al) and other metals, which leads to toxicity in maize and other sensitive crops [2,3].
Aluminum toxicity adversely affects plant growth and development by inhibiting cell division and the expansion of root meristems, causing stunted root elongation [4]. This reduces the capacity of plants to uptake nutrients and water, exposing plants to drought, which in turn causes poor dry matter accumulation and yield loss. Liming provides a quick and short-term solution for soil acidity and Al toxicity, but it is beyond the reach of most farmers in the developing world. Genetically improving maize cultivars to be tolerant to Al toxicity through plant breeding is a sustainable strategy to curb the effect of Al toxicity on maize production in acid soils. Great efforts have been made so far in Africa towards breeding maize cultivars that are tolerant to various abiotic and biotic stresses, including drought stress [5,6], low soil nitrogen [7], various diseases and pests [8,9] and other stresses [10]. However, more work is still required to develop maize cultivars tolerant to Al toxicity.
Testing and selecting stable parental lines that combine Al tolerance, high yield potential and stability are the initial critical steps in breeding for Al tolerance in plants. Testing maize for Al tolerance can be carried out in the field, laboratory or greenhouse. Although field testing has proved to be the most effective in testing maize genotypes for Al tolerance, it is very expensive and time-consuming [11,12]. Laboratory- or greenhouse-based testing techniques offer cheap, easy, and quick alternatives to screening large sets of genotypes for Al tolerance [13,14]. The other advantage of laboratory- and greenhouse-based testing methods is that they are very amenable to seedling-stage testing techniques. Seedling stage testing allows breeders to make selections at an early stage of plant growth, thereby increasing genetic gain by shortening the breeding cycle. Thus, seedling stage selection supports speed breeding, which is one of the effective modern breeding technology [15]. In addition, it has been proven that laboratory- and greenhouse-based testing techniques give results that are positively correlated with those obtained using field testing methods [16,17,18].
The nutrient solution method is the most used laboratory-based technique, while the soil bioassay, also known as the pot-based method, is the most popular greenhouse-based technique for testing plant seedlings for tolerance to Al toxicity [13,14]. These two methods provide adequate Al stress to the plants, allowing the effective preliminary testing of many genotypes in a small area and consequently reducing the number of promising genotypes to be taken to the field for further analysis. However, given the differences between the laboratory and greenhouse growing conditions, it is important to determine how maize genotypes perform in and across the two environments. Logically, genotypes that can perform well in the laboratory and greenhouse are likely to be stable performers, and the chances that they will excel in the field are high. Furthermore, genotypes that exhibit high and stable performance across both Al toxic and optimum conditions are desirable for a breeding program, as they allow breeders to develop cultivars that can thrive on both acidic and non-acidic soils. However, the discriminating ability of laboratory- and greenhouse-based methods and environments among maize genotypes has never been compared. Therefore, it is important to find out which one of the two-testing environments is the most effective in discriminating among maize genotypes for Al tolerance or susceptibility.
In this study, the additive main effect and multiplicative interaction (AMMI) model was used to assess the performance and stability of maize lines across laboratory- and greenhouse-based test environments [19]. One of the strengths of AMMI analysis is that it provides AMMI stability values (ASV), which help identify stable genotypes across environments. Good stability is indicated by a lower ASV, while a higher ASV reflects the poor stability of a genotype [19]. However, AMMI analysis is ineffective in showing the discriminating power of test environments compared to the genotype plus genotype by environment interaction (GGE) biplot [20]. Therefore, the GGE biplot was employed in this study to compare the capacities of laboratory and greenhouse environments to discriminate among genotypes [21].
This study aimed to identify high dry matter yielding and stable quality protein maize (QPM) inbred lines at the seedlings stage grown under Al toxic and optimum laboratory- and greenhouse-based environments. The study also sought to compare the discriminating ability of laboratory- and greenhouse-based Al tolerance testing environments. The study is a preliminary dry matter yield stability analysis of elite tropical QPM maize inbred lines for Al tolerance. The lines are an important part of the germplasm used in the QPM breeding program at the University of Fort Hare (UFH). The hypotheses of the study were that there are (i) no stable genotypes in terms of dry performance across Al toxic and optimum environments among the QPM lines available at the UFH’s breeding program and (ii) no differences between the laboratory- and greenhouse-based environments in terms of discriminating maize genotypes for Al tolerance.
2. Results
2.1. Analysis of Variance
The combined ANOVA for the dry matter yield of the 75 QPM genotypes evaluated across six environments is shown in Table 1. Highly significant differences (p < 0.001) were observed for genotype (G), environment (E) and genotype × environment interactions (G × E). This prompted further analysis of G × E using AMMI and GGE biplots, as described in the following section. The genotype main effect contributed 6.08% to the total sum of squares, while the environment and genotype by environment interaction had 82.82% and 11.08%, respectively.

Table 1.
Analysis of variance for dry matter yield of 75 QPM genotypes tested in six controlled environments.
2.2. AMMI and GGE Biplots
The AMMI ANOVA for the dry matter yield of the 75 QPM inbred lines tested in six environments is presented in Table 2. The genotype, environment and genotype × environment interaction (GEI) effects were highly significant (p < 0.001). The GEI effect accounted for 11.08% of the total variation, which was further partitioned into two highly significant (p < 0.001) interaction principal components axes (IPCA 1 and IPCA 2).
Table 2.
Additive main effects and multiplicative interaction analysis of variance for dry matter yield of 75 QPM genotypes tested across six environments.
For the AMMI, the two IPCAs explained a total of 87.43% of G × E variation, with IPCA1 contributing 54.64% and IPCA2 providing 32.46% to the biplot (Figure 1a). Genotypes that were located at or closer to the point of origin are considered to be broadly adopted. Line QSY 28 was the most broadly adapted, as it is located closer to the point of origin (Figure 1b). The length of the vector of an environment from the biplot origin is proportional to the amount of G × E exhibited by that environment. Thus, environments with longer vectors possess strong interactive forces, while those with shorter vectors produce weak interactive forces. In this regard, environments S1, C2 and S2 had stronger interactive forces than LS, LC and C1. Generally, greenhouse environments had stronger interactive forces than laboratory environments, which had the weakest interactive forces (Figure 1a,b). Genotypes closer to the environment scores showed high interactive behavior with the respective environments.
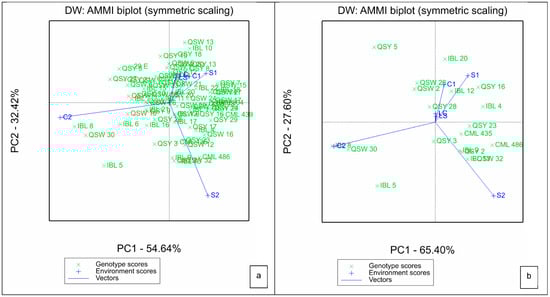
Figure 1.
Additive main effects and multiplicative interaction biplot for IPCA 1 and IPCA 2 scores of (a) all the 75 QPM genotypes and (b) 20 highest yielding genotypes (b) and six environments. S1: Al toxic environment under soil bioassay conditions in the greenhouse 1; S2: Al toxic environment under soil bioassay conditions in the greenhouse 2; C1: control environment under soil bioassay conditions in the greenhouse 1; C2: control environment under soil bioassay conditions in the greenhouse 2; LC: control environment under nutrient solution conditions, LS: Al toxic environment under nutrient solution conditions.
For the GGE biplot, the two principal components contributed a total of 83.63%: PCA1 had 46.67%, while PCA2 had 36.96% (Figure 2). The length of the environmental vectors is proportional to their standard deviation, which is a measure of the discriminating ability of the environments. The environments with longer vectors are more discriminating than those with shorter vectors. Environments S2 and C2 had the longest vectors, followed by S1 and C1, with laboratory environments (LS and LC) having the shortest vectors (Figure 2).
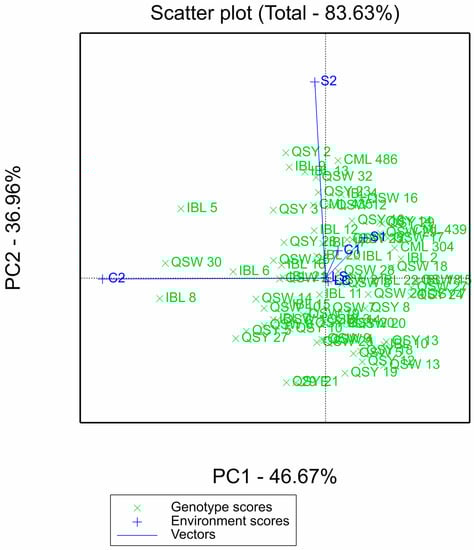
Figure 2.
GGE biplot of the 75 QPM inbred lines evaluated across six laboratory and greenhouse environments. S1: Al toxic environment under soil bioassay conditions in the greenhouse 1; S2: Al toxic environment under soil bioassay conditions in the greenhouse 2; C1: control environment under soil bioassay conditions in the greenhouse 1; C2: control environment under soil bioassay conditions in the greenhouse 2; LC: control environment under nutrient solution conditions, LS: Al toxic environment under nutrient solution conditions.
2.3. Mean Dry Matter Yield, ASV and Top Four Genotypes across Environments
The genotypes’ mean dry matter yield performance across the six environments were non-consistent. The performance of the top ten, top two checks and bottom five yielding genotypes across the six environments is presented in Table 3, while the performance of all 75 genotypes is presented in Appendix A (Table A1). Thus, the ranking of genotypes changed from one environment to another. Higher dry matter yields were observed in optimum environments as compared to Al toxic environments with a 55% mean yield difference. The grand mean weight across the six environments was 19.1 g. Thirty-six experimental lines yielded above the grand mean. Experimental inbred line QSY 2 was the highest yielder with 23.9 g, followed by experimental lines IBL 5 and IBL 9 with 23.2 and 23.0 g, respectively. The highest yielding check was CML 486 with 21.9 g. Five experimental lines (QSY 2, IBL 5, IBL 9, QSW 30 and QSW 26) yielded above the top yielding check. The first optimum greenhouse environment (C1) had the highest mean biomass yield of 37.8 g, followed by optimum greenhouse environment (C2) with 35.7 g. The laboratory Al toxic environment (LS) had the lowest biomass yield of 0.1 g.
Table 3.
Means and ASV of the top ten and bottom five yielding genotypes across the six environments. The genotypes are ranked according to mean dry weight (DW).
The AMMI stability values for genotypes ranged from 0.26 (QSY 20) to 4.816 (IBL 8). The mean ASV was 1.64. The five genotypes with the least ASV were QSY 20, IBL 20, IBL 11, QSW 28 and QSW 8 with values of 0.26, 0.34, 0.37, 0.41 and 0.44, respectively (Table 4). Seventeen lines had a dry matter yield above the grand mean (19.1 g) and ASV lower than the grand mean of 1.64. These lines were QSW 26, QSY 3, IBL 20, QSY 23, IBL4, IBL12, QSY 28, QSY16, QSW2, QSW 25, QSW 21, QSW 12, QSW 7, IBL17, IBL 21, IBL 15 and IBL 16.
Table 4.
Best four genotypes in each of the six environments.
The top four selections from each of the six environments are shown in Table 4. Experimental line IBL 20 appeared in the top four in four of the six environments, which are LS, LC, S1 and C1, whilst experimental line QSW7 appeared in the top four in environments LS, LC and C1. Lines QSW 26, QSY 5 and QSW 26 appeared in the top four in two environments each.
3. Discussion
Both general and AMMI ANOVAs revealed considerable variation among the 75 QPM genotypes and the six laboratory and greenhouse environments. Genotype (G), environment (E) and genotype by environment interaction (G × E) were highly significant (p < 0.001). The significance of the genotype main effect implies that there is genetic variability among the set of genotypes used in this study. Hence, there is an opportunity for selection and breeding for Al tolerance using the set of lines understudy. This result confirms what was reported by [15] in their study using the relative root length (RRL) and hematoxylin staining (HS) to classify a similar set of genotypes into Al tolerant and sensitive. Using the RRL method, they found out that 94.7% of the lines were Al tolerant, while using the HS technique, they reported 77.9% of the genotypes to be tolerant. However, the fact that only 6.08% of the total variation was attributed to genotype indicates a need to introduce more sources of variation from external sources or through artificial mutation. Genetic variability for Al tolerance has previously been reported in maize inbred lines, hybrids and open-pollinated varieties by other researchers [12,13,22].
Significant G × E indicates that genotype performance was inconsistent across the six environments. Thus, the selection of the best lines cannot be based on ranking but on whether they are broadly or specifically adapted to environments [19]. However, the focus of this study was to identify lines that combine high dry matter yield and stability across Al stressed and optimum laboratory- and greenhouse-based environments. Genotypes with low ASV are considered stable, while those with high ASV are less stable. In this study, seventeen experimental lines had the desired combination of high dry matter yield above the grand mean (19.1) and ASV less than the grand mean (1.64). These are QSW 26, QSY 3, IBL 20, QSY 23, IBL4, IBL12, QSY 28, QSY16, QSW2, QSW 25, QSW 21, QSW 12, QSW 7, IBL17, IBL 21, IBL 15 and IBL 16. Such lines are potential donors of Al tolerance genes that can be exploited through plant breeding. Therefore, they are recommended for further field-based testing.
The other objective of this study was to compare the discriminating ability of laboratory- and greenhouse-based Al tolerance testing environments. The discriminative power of an environment is directly proportional to its vector length on the GGE biplot. Both GGE and AMMI biplots revealed that the greenhouse-based environments (S1, S2, C1 and C2) were more discriminating and had more interactive forces than the laboratory ones (LS and LC). Therefore, we conclude that testing maize genotypes for Al tolerance in the greenhouse environment is more informative and effective than using the laboratory environment. This could be attributed to the fact that greenhouse conditions and soil bioassays provided better growing conditions to genotypes so that they could express their performance compared to laboratory conditions and nutrient solutions. This result agrees with [23], who found soil bioassays more efficient than nutrient solution in discriminating genotypes for Al toxicity. The use of controlled environments such as greenhouses is becoming increasingly important in plant breeding, mainly due to their suitability for modern plant breeding techniques such as speed breeding [15,24] and marker-assisted breeding [25]. Furthermore, they allow breeders to implement early growth stage selection, which helps achieve high genetic gain and quick varietal turnover. The application of modern breeding techniques has proven crucial for achieving food security [26].
The fact that the environment main effect was significant and had the largest contribution (82.82%) to the total variation underlines the varying effects that the different environments had on the genotype’s performance. This could be attributed to the huge differences between laboratory and greenhouse growing conditions and between optimum and Al-stressed environments. The large contribution of testing environments has been reported in other studies on abiotic stress tolerant stability analysis [27,28]. In their study, [29] reported an environmental contribution of 80%, which is almost equal to our findings.
A yield loss of 55% due to Al toxicity was observed in this study, which confirms the negative effect of Al toxicity on maize productivity. A similar yield-loss margin was reported by [12] in their field-based study using tropical maize germplasm. This study tested Al-stress tolerance at the seedling stage to identify promising lines early. Early growth stage selection helps breeders to accelerate genetic gain. It has been shown that the performance of maize under stress at the reproductive stage can be projected from its performance at the seedling and vegetative stages using growth traits such as plant biomass [16,17,18]. Thus, the current study is a reliable preliminary testing and stability analysis of elite QPM maize inbred lines for Al tolerance before advancing the best lines for further field testing. The findings of this study may be useful to fellow crop scientists, plant breeders and students of plant breeding and crop physiology.
4. Materials and Methods
4.1. Site Description
The study was carried out at the University of Fort Hare (UFH) in Alice, South Africa, once in the laboratory and twice during the 2019/2020 seasons in the greenhouse tunnel. The laboratory is in the Agronomy department under the Plant Breeding and Genetics Unit, and the greenhouse tunnel is at the University Farm. Light was provided by fluorescent lights (T5) that emit a 400–700-nanometer (nm) wavelength in the laboratory. The greenhouse tunnel was made up of clear polyethylene plastic that allows the transmission of sunlight. The average temperature in the greenhouse was 22 °C and 25 °C, respectively, for the two seasons, and 25 °C in the laboratory. Each trial in the laboratory and greenhouse was accompanied by its control counterparts, which received optimum management. Each trial was considered as an environment. Hence, there were six environments, which are the laboratory stressed with Al (LS), laboratory optimum (LC), first greenhouse stressed with Al (S1), first greenhouse optimum (C1), second greenhouse stressed with Al (S2) and second greenhouse optimum (C2).
4.2. Germplasm
A total of 75 quality protein maize (QPM) inbred lines were used in this study (Table 5), four of which were Al tolerant checks. The lines were obtained from CIMMYT-Zimbabwe, and Quality Seeds Company (Pvt, Ltd.) in KwaZulu-Natal, South Africa. CIMMYT-Mexico supplied four reference checks.
Table 5.
Names and sources 75 QPM germplasm used in this study.
4.3. Experimental Procedures
Laboratory Experiment under Nutrient Solution
Quality protein maize seeds were surface sterilized with 0.1% sodium hypochlorite solution for 5 min by shaking continuously. The seeds were then thoroughly washed with tap water for another 5 min and rinsed with distilled water three times. This was followed by placing the seeds in petri dishes with moistened filter paper and germinating them at 27 °C for 7 days in an incubator. Five healthy and uniform germinated seeds per genotype were placed in plastic trays containing Hoagland solution for 3 days (72 h) at room temperature. The seedlings were grown for 72 h in the nutrient solution, after which they were transferred to the stress solution amended with an aluminum concentration level of 600 µM, while the control did not receive any aluminum sulfate (Al2 [SO4]3).
Five uniform seedlings per genotype were used for data collection, and each treatment was replicated three times in a completely randomized design (CRD). The Al concentration used in this study was adopted from [22], who reported that with 600 µM of ionic strength in the nutrient solution, the aluminum concentration would adequately discriminate aluminum-sensitive and aluminum-tolerant genotypes. A 1M HCl solution was used to adjust the pH of the stress solution to 4.0. The pH remained stable during the whole experiment without further adjustment. According to [30], a pH of 4 is important to activate Al toxicity, since the availability of most toxic forms of Al (Al3+) are dependent on the pH of the solution. The control solution had a pH of 5.8, which is optimum for seedling growth. The seedlings were harvested after the 72 h in stress conditions and weighed for dry matter determination.
4.4. Greenhouse Tunnel Experiment under Soil Bioassay
The experiment was laid out in a randomized complete block design (RCBD) with three replications in three blocks. The experimental procedure was adopted from [14] where alluvial soils, which were classified as Haplic Cambisol in accordance with the World Reference Base for Soil Resources (WRB) system [30] (pH 5.8), were collected from the UFH farm. The soil was watered to field capacity and incubated with Al sulphate (Al2 [SO4]3) for 48 h before planting. A pressure plate apparatus was used to determine the field capacity of the soil [31]. Aluminum sulphate (Al2 [SO4]3) was applied at the rate of 24 mg kg−1 of soil because the critical concentration of exchangeable cations above which toxicity is observed in the soil for most cereals is 23–24 mg/kg−1 [32]. At planting, plastic pots measuring 30 cm high and 11 cm wide were filled with soil amended with a compound basal fertilizer, hygrofert (153 g/kg N, 69 g/kg P, 183 g/kg Mg and 14 g/kg S). Two seeds per pot were sown and later thinned to one immediately after crop emergence. Hand pulling practice was performed for weed control, and no disease or pest incidence was observed. The pots were watered regularly to ensure that there was no moisture stress. The irrigation solution was maintained at pH 4.5 using HCl so that the Al3+ in the soil would be available to the plant throughout the experiment.
4.5. Data Collection and Analysis
In the laboratory the plants were harvested at 3 days after exposure to Al stress, and in the greenhouse tunnel 4 weeks after planting. This was followed by oven-drying the harvested plants at 65 °C until a constant weight was reached. The dry weight was determined by weighing the samples using a Microgram balance manufactured in Germany (d = 0.1 mg, Sartorius AG Gottingen CP 64).
4.6. Statistical Analysis
Statistical analyses were performed using GenStat® 17th edition statistical software. A combined analysis of variance (ANOVA) across the environments allowed an estimation of the differences between the main effects (G), environment (E) and their interactions (G × E) on dry matter yield. To determine the stability values, the data on dry matter yield were further subjected to an AMMI analysis. A GGE biplot was used to assess the discriminating power of testing environments.
5. Conclusions
Our study has shown that the set of 75 QPM inbred lines used have genetic variation for Al tolerance. Hence, it is feasible to apply selection to improve dry matter yield under Al toxic and optimum growing conditions. However, more sources of variation should be introduced since the level of observed genetic variation was not very high. It was also revealed that greenhouse-based environments have better discriminating ability for Al tolerance and susceptibility than laboratory-based environments. Seventeen experimental lines were identified to possess a desired combination of high dry matter yield above the grand mean and ASVs that are less than the grand mean. They are therefore recommended for advancement to the field-testing stage. These are QSW 26, QSY 3, IBL 20, QSY 23, IBL4, IBL12, QSY 28, QSY16, QSW2, QSW 25, QSW 21, QSW 12, QSW 7, IBL17, IBL 21, IBL 15 and IBL 16. The findings of the study may be applied by maize breeders in their breeding programs.
Author Contributions
Conceptualization, R.M.Z. and C.S.M.; methodology, R.M.Z. and C.S.M.; software, A.K., R.M.Z. and C.S.M.; validation, A.K., R.M.Z. and C.S.M.; formal analysis, A.K., R.M.Z. and C.S.M.; investigation, R.M.Z. and C.S.M.; resources, C.S.M.; data curation, A.K., R.M.Z. and C.S.M.; writing—original draft preparation, R.M.Z. and A.K.; writing—review and editing, A.K., R.M.Z. and C.S.M.; supervision, C.S.M.; project administration, C.S.M.; funding acquisition, C.S.M. All authors have read and agreed to the published version of the manuscript.
Funding
This research was funded by the National Research Fund (NRF) of South Africa (Ref: CSRU 180504326029) and the University of Fort Hare (UFH).
Data Availability Statement
Data will be availed when requested.
Acknowledgments
The authors acknowledge the NRF and UFH.
Conflicts of Interest
The authors declare no conflict of interest.
Appendix A
Table A1.
Mean yield all the 75 QPM maize inbred lines tested across the six environments.
Table A1.
Mean yield all the 75 QPM maize inbred lines tested across the six environments.
| Genotype | C1 | C2 | LC | LS | S1 | S2 | Mean DW | Stability (ASV) |
|---|---|---|---|---|---|---|---|---|
| QSY 2 | 42.9 | 41.5 | 0.5 | 0.1 | 25.2 | 33.2 | 23.9 | 1.751 |
| IBL 5 | 36.5 | 56.0 | 0.1 | 0.1 | 18.2 | 28.0 | 23.2 | 3.783 |
| IBL 9 | 38.5 | 41.0 | 0.2 | 0.1 | 26.5 | 31.6 | 23.0 | 1.654 |
| QSW 30 | 37.9 | 58.9 | 0.2 | 0.1 | 18.7 | 20.3 | 22.7 | 4.312 |
| QSW 26 | 39.6 | 44.6 | 0.2 | 0.1 | 29.3 | 18.2 | 22.0 | 1.115 |
| CML 486 | 39.5 | 33.4 | 0.3 | 0.3 | 25.2 | 32.6 | 21.9 | 2.226 |
| QSY 3 | 41.0 | 42.8 | 0.1 | 0.1 | 20.7 | 26.6 | 21.9 | 1.441 |
| IBL 20 | 43.1 | 38.6 | 0.2 | 0.1 | 31.2 | 17.9 | 21.8 | 0.339 |
| IBL 13 | 38.7 | 37.9 | 0.2 | 0.2 | 22.1 | 31.8 | 21.8 | 1.825 |
| QSY 23 | 36.9 | 37.0 | 0.4 | 0.1 | 28.3 | 28.0 | 21.8 | 1.329 |
| IBL 4 | 38.6 | 34.1 | 0.2 | 0.2 | 30.5 | 27.0 | 21.8 | 1.574 |
| IBL 12 | 44.3 | 37.9 | 0.2 | 0.1 | 25.8 | 22.3 | 21.8 | 0.441 |
| QSY 28 | 39.7 | 42.1 | 0.1 | 0.1 | 25.0 | 21.5 | 21.4 | 0.884 |
| QSY 5 | 42.6 | 48.8 | 1.1 | 0.0 | 26.3 | 8.8 | 21.3 | 2.714 |
| IBL 8 | 35.6 | 59.3 | 0.1 | 0.1 | 15.8 | 16.4 | 21.2 | 4.816 |
| QSY 16 | 46.2 | 32.0 | 0.6 | 0.1 | 24.5 | 23.6 | 21.2 | 1.428 |
| QSW 32 | 33.1 | 36.4 | 1.0 | 0.1 | 24.8 | 31.3 | 21.1 | 1.867 |
| CML 435 | 37.4 | 37.1 | 0.1 | 0.1 | 23.9 | 27.1 | 21.0 | 1.244 |
| QSW 2 | 38.4 | 42.9 | 1.9 | 0.1 | 24.9 | 16.8 | 20.8 | 1.187 |
| IBL 6 | 34.7 | 49.0 | 0.1 | 0.1 | 21.4 | 19.0 | 20.7 | 2.56 |
| QSW 14 | 37.6 | 46.6 | 0.1 | 0.1 | 25.1 | 14.1 | 20.6 | 2.052 |
| QSW 25 | 40.2 | 33.3 | 0.2 | 0.1 | 28.7 | 21.0 | 20.6 | 1.056 |
| QSY 14 | 42.1 | 28.5 | 0.1 | 0.1 | 29.6 | 22.9 | 20.6 | 2.135 |
| QSW 16 | 39.0 | 30.2 | 0.2 | 0.2 | 25.7 | 27.3 | 20.4 | 2.011 |
| QSW 21 | 40.2 | 36.6 | 0.1 | 0.1 | 30.2 | 15.1 | 20.4 | 0.565 |
| QSW 12 | 37.1 | 34.0 | 1.1 | 0.0 | 21.0 | 27.6 | 20.2 | 1.492 |
| QSY 27 | 37.4 | 49.7 | 0.5 | 0.1 | 24.0 | 9.0 | 20.1 | 3.056 |
| QSW 7 | 38.1 | 37.5 | 0.2 | 0.1 | 33.3 | 11.0 | 20.0 | 1.048 |
| QSW 17 | 42.9 | 27.2 | 0.2 | 0.1 | 28.1 | 20.9 | 19.9 | 2.173 |
| IBL 17 | 41.4 | 35.5 | 0.1 | 0.1 | 20.2 | 22.1 | 19.9 | 0.635 |
| IBL 21 | 35.2 | 42.1 | 0.1 | 0.1 | 24.5 | 17.5 | 19.9 | 1.17 |
| IBL 15 | 40.3 | 41.9 | 0.2 | 0.1 | 23.3 | 13.2 | 19.8 | 1.348 |
| QSW 1 | 37.9 | 43.7 | 0.2 | 0.1 | 25.9 | 11.0 | 19.8 | 1.787 |
| QSW 29 | 39.7 | 28.1 | 0.2 | 0.1 | 28.4 | 22.0 | 19.8 | 1.997 |
| QSW 6 | 38.7 | 45.0 | 0.7 | 0.1 | 22.0 | 11.0 | 19.6 | 2.168 |
| IBL 16 | 35.0 | 41.4 | 0.1 | 0.1 | 20.0 | 20.1 | 19.4 | 1.323 |
| QSY 29 | 39.2 | 27.2 | 0.2 | 0.2 | 25.3 | 24.0 | 19.4 | 2.145 |
| IBL 1 | 41.6 | 30.6 | 0.1 | 0.1 | 20.8 | 20.0 | 18.9 | 1.061 |
| QSW 28 | 38.1 | 33.6 | 0.2 | 0.1 | 22.8 | 18.2 | 18.8 | 0.41 |
| CML 304 | 37.9 | 25.9 | 0.2 | 0.2 | 28.1 | 20.3 | 18.8 | 2.201 |
| QSY 8 | 39.5 | 31.1 | 0.3 | 0.2 | 29.5 | 11.6 | 18.7 | 1.326 |
| QSY 17 | 32.0 | 31.2 | 0.6 | 0.1 | 24.6 | 23.0 | 18.6 | 1.269 |
| IBL 11 | 36.4 | 36.4 | 0.8 | 0.0 | 22.3 | 15.4 | 18.6 | 0.37 |
| IBL 22 | 38.6 | 29.0 | 0.2 | 0.2 | 27.0 | 15.9 | 18.5 | 1.4 |
| QSW 20 | 39.7 | 33.3 | 0.2 | 0.1 | 28.0 | 9.7 | 18.5 | 1.162 |
| CML 439 | 35.7 | 23.7 | 0.2 | 0.1 | 27.8 | 23.0 | 18.4 | 2.695 |
| IBL 7 | 35.5 | 42.8 | 0.2 | 0.1 | 18.7 | 12.9 | 18.4 | 1.895 |
| IBL 14 | 40.0 | 34.4 | 0.2 | 0.0 | 23.6 | 11.0 | 18.2 | 0.805 |
| QSW 10 | 32.9 | 43.6 | 0.2 | 0.1 | 16.7 | 15.2 | 18.1 | 2.117 |
| QSW 3 | 35.9 | 36.6 | 0.1 | 0.1 | 24.2 | 11.6 | 18.1 | 0.792 |
| QSW 19 | 31.8 | 39.0 | 0.2 | 0.2 | 23.8 | 13.0 | 18.0 | 1.054 |
| IBL 2 | 35.9 | 24.6 | 0.1 | 0.1 | 26.7 | 19.4 | 17.8 | 2.222 |
| QSY 10 | 36.7 | 40.1 | 0.1 | 0.0 | 16.9 | 11.8 | 17.6 | 1.571 |
| IBL 10 | 42.5 | 28.0 | 1.9 | 0.1 | 25.8 | 7.0 | 17.5 | 1.909 |
| QSW 18 | 37.7 | 25.5 | 0.1 | 0.1 | 22.5 | 18.8 | 17.5 | 1.839 |
| QSW 4 | 41.7 | 35.3 | 0.9 | 0.0 | 16.8 | 9.6 | 17.4 | 1.035 |
| QSW 15 | 37.6 | 22.8 | 0.2 | 0.2 | 27.3 | 16.0 | 17.4 | 2.475 |
| QSY 18 | 39.2 | 31.2 | 1.9 | 0.1 | 24.7 | 6.8 | 17.3 | 1.454 |
| QSW 8 | 33.4 | 32.1 | 0.1 | 0.1 | 18.7 | 18.0 | 17.1 | 0.438 |
| IBL 18 | 41.6 | 21.7 | 1.0 | 0.1 | 21.1 | 16.7 | 17.0 | 2.459 |
| QSW 9 | 32.5 | 36.3 | 0.2 | 0.1 | 23.5 | 9.6 | 17.0 | 1.023 |
| QSW 24 | 32.4 | 29.0 | 0.2 | 0.1 | 23.5 | 15.7 | 16.8 | 0.921 |
| QSW 13 | 39.6 | 28.0 | 1.8 | 0.0 | 25.7 | 4.6 | 16.6 | 1.949 |
| QSW 27 | 36.8 | 22.4 | 2.0 | 0.1 | 21.7 | 16.4 | 16.6 | 2.196 |
| QSW 5 | 37.5 | 31.7 | 0.2 | 0.1 | 22.1 | 7.2 | 16.5 | 1.162 |
| QSW 23 | 33.1 | 36.3 | 0.2 | 0.1 | 19.1 | 10.0 | 16.5 | 1.098 |
| QSY 7 | 37.2 | 21.5 | 0.1 | 0.1 | 24.8 | 14.7 | 16.4 | 2.478 |
| 29E | 35.6 | 39.5 | 0.2 | 0.1 | 17.0 | 4.6 | 16.2 | 2.2 |
| QSY 13 | 39.2 | 26.6 | 1.1 | 0.1 | 21.2 | 8.8 | 16.2 | 1.506 |
| QSY 19 | 34.3 | 33.1 | 0.6 | 0.1 | 23.4 | 4.7 | 16.1 | 1.449 |
| QSY 20 | 31.9 | 32.3 | 0.1 | 0.0 | 19.0 | 12.7 | 16.0 | 0.257 |
| QSY 24 | 36.5 | 22.3 | 0.6 | 0.1 | 20.7 | 15.5 | 16.0 | 2.077 |
| QSY 9 | 31.0 | 36.0 | 0.2 | 0.1 | 12.9 | 14.1 | 15.7 | 1.135 |
| QSY 21 | 30.6 | 40.1 | 0.8 | 0.1 | 14.4 | 5.9 | 15.3 | 2.363 |
| QSY 12 | 35.0 | 29.2 | 0.8 | 0.2 | 16.4 | 7.6 | 14.9 | 0.897 |
References
- Kochian, L.V.; Hoekenga, O.A.; Pineros, M.A. How do crop plants tolerate acid soils? Mechanisms of aluminum tolerance and phosphorous efficiency. Annu. Rev. Plant Biol. 2004, 55, 459–493. [Google Scholar] [CrossRef] [PubMed]
- Phukunkamkaew, S.; Tisarum, R.; Pipatsitee, P.; Samphumphuang, T.; Maksup, S.; Cha-um, S. Morpho-physiological responses of indica rice (Oryza sativa sub. indica) to aluminum toxicity at seedling stage. Environ. Sci. Pollut. Res. 2021, 28, 29321–29331. [Google Scholar] [CrossRef] [PubMed]
- Zioła-Frankowska, A.; Frankowski, M. Speciation analysis of aluminium in plant parts of Betula pendula and in soil. J. Environ. Sci. 2018, 65, 153–161. [Google Scholar] [CrossRef] [PubMed]
- Frankowski, M. Aluminum uptake and migration from the soil compartment into Betula pendula for two different environments: A polluted and environmentally protected area of Poland. Environ. Sci. Pollut. Res. 2016, 23, 1398–1407. [Google Scholar] [CrossRef] [PubMed]
- Kondwakwenda, A.; Sibiya, J.; Zengeni, R.; Musvosvi, C. Aspects in breeding maize for drought tolerance: Progress and modern breeding approaches. AJCS 2021, 15, 510–517. [Google Scholar]
- Oikeh, S.; Ngonyamo-Majee, D.; Mugo, S.I.N.; Mashingaidze, K.; Cook, V.; Stephens, M. The Water Efficient Maize for Africa Project as an Example of a Public–Private Partnership. In Convergence of Food Security, Energy Security and Sustainable Agriculture; Songstad, D.D., Hatfield, J.L., Tomes, D.T., Eds.; Springer: Berlin/Heidelberg, Germany, 2014; pp. 317–329. [Google Scholar]
- Das, B.; Atlin, G.N.; Olsen, M.; Burgueño, J.; Tarekegne, A.; Babu, R.; Ndou, E.N.; Mashingaidze, K.; Moremoholo, L.; Ligeyo, D.; et al. Identification of donors for low-nitrogen stress with maize lethal necrosis (MLN) tolerance for maize breeding in sub-Saharan Africa. Euphytica 2019, 215, 80. [Google Scholar] [CrossRef] [PubMed]
- Sibiya, J.; Tongoona, P.; Derera, J.; van Rij, N. Genetic analysis and genotype × environment (G × E) for grey leaf spot disease resistance in elite African maize (Zea mays L.) germplasm. Euphytica 2012, 185, 349–362. [Google Scholar] [CrossRef]
- Vivek, B.S.; Odongo, O.; Njuguna, J.; Imanywoha, J.; Bigirwa, G.; Diallo, A.; Pixley, K. Diallel analysis of grain yield and resistance to seven diseases of 12 African maize (Zea mays L.) inbred lines. Euphytica 2010, 172, 329–340. [Google Scholar] [CrossRef]
- Kondwakwenda, A.; Mutari, B.; Simango, K.; Nchanji, E.B.; Chirwa, R.; Rubyogo, J.C.; Sibiya, J. Decades of Cultivar Development: A Reconciliation of Maize and Bean Breeding Projects and Their Impacts on Food, Nutrition Security, and Income of Smallholder Farmers in Sub-Saharan Africa. In Food Security for African Smallholder Farmers; Springer: Berlin/Heidelberg, Germany, 2022; pp. 3–26. [Google Scholar]
- Agalo, J.; Gudu, S.; Kisinyo, P.; Ligeyo, D.; Matonyei, T.; Nyangweso, P.; Onkware, A.; Ouma, E.; Too, E.; Were, B. Enhancing maize grain yield in acid soils of western Kenya using aluminium tolerant germplasm. J. Agric. Sci. Technol. A 2013, 3, 33–46. [Google Scholar]
- Mutimaamba, C.; MacRobert, J.; Cairns, J.E.; Magorokosho, C.E.; Ndhlela, T.; Mukungurutse, C.; Minnaar-Ontong, A.; Labuschagne, M.T. Diallel analysis of acid soil tolerant and susceptible maize inbred lines for grain yield under acid and non-acid soil conditions. Euphytica 2017, 213, 88. [Google Scholar] [CrossRef]
- Urrea-Gómez, R.; Ceballos, H.; Pandey, S.; Bahia Filho, A.F.; Leon, L.A. A greenhouse screening technique for acid soil tolerance in maize. Agron. J. 1996, 88, 806–812. [Google Scholar] [CrossRef]
- Zishiri, R.M.; Mutengwa, C.S.; Tandzi, L.N.; Manyevere, A. Growth Response and Dry Matter Partitioning of Quality Protein Maize (Zea mays L.) Genotypes under Aluminum Toxicity. Agronomy 2022, 12, 1262. [Google Scholar] [CrossRef]
- Watson, A.; Ghosh, S.; Williams, M.J.; Cuddy, W.S.; Simmonds, J.; Rey, M.-D.; Asyraf Md Hatta, M.; Hinchliffe, A.; Steed, A.; Reynolds, D. Speed breeding is a powerful tool to accelerate crop research and breeding. Nat. Plants 2018, 4, 23–29. [Google Scholar] [CrossRef]
- Badr, A.; El-Shazly, H.H.; Tarawneh, R.A.; Börner, A. Screening for drought tolerance in maize (Zea mays L.) germplasm using germination and seedling traits under simulated drought conditions. Plants 2020, 9, 565. [Google Scholar] [CrossRef]
- Dodig, D.; Božinović, S.; Nikolić, A.; Zorić, M.; Vančetović, J.; Ignjatović-Micić, D.; Delić, N.; Weigelt-Fischer, K.; Altmann, T.; Junker, A. Dynamics of maize vegetative growth and drought adaptability using image-based phenotyping under controlled conditions. Front. Plant Sci. 2021, 12, 652116. [Google Scholar] [CrossRef]
- Montes, J.; Technow, F.; Dhillon, B.; Mauch, F.; Melchinger, A. High-throughput non-destructive biomass determination during early plant development in maize under field conditions. Field Crops Res. 2011, 121, 268–273. [Google Scholar] [CrossRef]
- Gauch, H.G., Jr. A simple protocol for AMMI analysis of yield trials. Crop Sci. 2013, 53, 1860–1869. [Google Scholar] [CrossRef]
- Yan, W.; Kang, M.S.; Ma, B.; Woods, S.; Cornelius, P.L. GGE Biplot vs. AMMI Analysis of Genotype-by-Environment Data. Crop Sci. 2007, 47, 643. [Google Scholar] [CrossRef]
- Yan, W.; Tinker, N.A. Biplot analysis of multi-environment trial data: Principles and applications. Can. J. Plant Sci. 2006, 86, 623–645. [Google Scholar] [CrossRef]
- Richard, C.; Munyinda, K.; Kinkese, T.; Osiru, D.S. Genotypic variation in seedling tolerance to aluminum toxicity in historical maize inbred lines of Zambia. Agronomy 2015, 5, 200–219. [Google Scholar] [CrossRef]
- Giaveno, C.D.; Miranda Filho, J.B.d. Field comparison between selection methods at the maize seedling stage in relation to aluminum tolerance. Sci. Agric. 2002, 59, 397–401. [Google Scholar] [CrossRef]
- Ghosh, S.; Watson, A.; Gonzalez-Navarro, O.E.; Ramirez-Gonzalez, R.H.; Yanes, L.; Mendoza-Suárez, M.; Simmonds, J.; Wells, R.; Rayner, T.; Green, P. Speed breeding in growth chambers and glasshouses for crop breeding and model plant research. Nat. Protoc. 2018, 13, 2944–2963. [Google Scholar] [CrossRef] [PubMed]
- Ahmar, S.; Gill, R.A.; Jung, K.-H.; Faheem, A.; Qasim, M.U.; Mubeen, M.; Zhou, W. Conventional and molecular techniques from simple breeding to speed breeding in crop plants: Recent advances and future outlook. Int. J. Mol. Sci. 2020, 21, 2590. [Google Scholar] [CrossRef] [PubMed]
- Varshney, R.K.; Bohra, A.; Roorkiwal, M.; Barmukh, R.; Cowling, W.A.; Chitikineni, A.; Lam, H.-M.; Hickey, L.T.; Croser, J.S.; Bayer, P.E. Fast-forward breeding for a food-secure world. Trends Genet. 2021, 37, 1124–1136. [Google Scholar] [CrossRef] [PubMed]
- Setimela, P.; Vivek, B.; Bänziger, M.; Crossa, J.; Maideni, F. Evaluation of early to medium maturing open pollinated maize varieties in SADC region using GGE biplot based on the SREG model. Field Crops Res. 2007, 103, 161–169. [Google Scholar] [CrossRef]
- Mafouasson, H.N.A.; Gracen, V.; Yeboah, M.A.; Ntsomboh-Ntsefong, G.; Tandzi, L.N.; Mutengwa, C.S. Genotype-by-Environment Interaction and Yield Stability of Maize Single Cross Hybrids Developed from Tropical Inbred Lines. Agronomy 2018, 8, 62. [Google Scholar] [CrossRef]
- Gauch Jr, H.G.; Zobel, R.W. Identifying mega-environments and targeting genotypes. Crop Sci. 1997, 37, 311–326. [Google Scholar] [CrossRef]
- Nciizah, A.D.; Wakindiki, I.I.C. Particulate organic matter, soil texture and mineralogy relations in some Eastern Cape ecotopes in South Africa. South Afr. J. Plant Soil 2012, 29, 39–46. [Google Scholar] [CrossRef]
- Nyambo, P.; Taeni, T.; Chiduza, C.; Araya, T. Effects of Maize Residue Biochar Amendments on Soil Properties and Soil Loss on Acidic Hutton Soil. Agronomy 2018, 8, 256. [Google Scholar] [CrossRef]
- Holland, J.E.; White, P.J.; Thauvin, J.N.; Jordan-Meille, L.; Haefele, S.M.; Thomas, C.L.; Goulding, K.W.T.; McGrath, S.P. Liming impacts barley yield over a wide concentration range of soil exchangeable cations. Nutr. Cycl. Agroecosystems 2021, 120, 131–144. [Google Scholar] [CrossRef]


Publisher’s Note: MDPI stays neutral with regard to jurisdictional claims in published maps and institutional affiliations. |
© 2022 by the authors. Licensee MDPI, Basel, Switzerland. This article is an open access article distributed under the terms and conditions of the Creative Commons Attribution (CC BY) license (https://creativecommons.org/licenses/by/4.0/).