Article

Climate Controls on the Spatial Variability of Vegetation Greenup Rate across Ecosystems in Northern Hemisphere

Lhasa Plateau Ecosystem Research Station, Key Laboratory of Ecosystem Network Observation and Modeling, Institute of Geographic Sciences and Natural Resources Research, Chinese Academy of Sciences, Beijing 100101, China
Plants 2022, 11(21), 2971; https://doi.org/10.3390/plants11212971
Submission received: 29 September 2022 / Revised: 29 October 2022 / Accepted: 31 October 2022 / Published: 3 November 2022

Abstract

:
Variations in individual phenological events in response to global change have received considerable attentions. However, the development of phenological stages is relatively neglected, especially based on in situ observation data. In this study, the rate of vegetation greenup (Vgreenup) across the Northern Hemisphere was examined for different plant functional types (PFTs) by using eddy covariance flux data from 40 sites (417 site-years). Then, the controls of climatic variables on the spatial distribution of Vgreenup across PFTs were further investigated. The mean Vgreenup was 0.22 ± 0.11 g C m−2 day−2 across all sites, with the largest and lowest values observed in cropland and evergreen needle-leaf forest, respectively. A strong latitude dependence by Vgreenup was observed in both Europe and North America. The spatial variations of Vgreenup were jointly regulated by the duration of greenup (Dgreenup) and the amplitude of greenup (Agreenup). However, the predominant factor was Dgreenup in Europe, which changed to Agreenup in North America. Spring climatic factors exerted significant influences on the spatial distribution of Vgreenup across PFTs. Specifically, increasing temperature tended to shorten Dgreenup and promote Agreenup simultaneously, resulting in an acceleration of Vgreenup. Dryness had a depression effect on Vgreenup for the whole study area, as exhibited by a lower Vgreenup with increasing vapor pressure deficit or decreasing soil moisture. However, Vgreenup in North America was only significantly and positively correlated with temperature. Without the limitation of other climatic factors, the temperature sensitivity of Vgreenup was higher in North America (0.021 g C m−2 day−2 °C−1) than in Europe (0.015 g C m−2 day−2 °C−1). This study provides new cognitions for Vgreenup dynamics from in situ observations in complement to satellite observations, which can improve our understanding of terrestrial carbon cycles.

1. Introduction

Vegetation phenology is the study of the timing of recurring plant life cycle events that are driven by environmental factors [1,2,3]. It not only is a key indicator of climate change but also exerts important influence on terrestrial ecosystem by altering carbon, nitrogen, and water cycles [4,5]. Many studies have addressed the relationship between the timing of individual phenological events and their drivers [6,7,8]. Under global warming, both remote sensing and ground-based observations reveal the substantial advancement of greenup, delay of leaf senescence, and extension of the growing season [9,10,11,12,13]. However, compared with individual phenological event, the development of the phenological stages has received inadequate attention.
The rate of greenup (Vgreenup) was proposed to facilitate the understanding and description of vegetation greenup development [14,15], which is calculated as the ratio of the duration of greenup (Dgreenup) to the amplitude of greenup (Agreenup). The variation in Vgreenup has strong linkage with vegetation growth and carbon sequestration by altering vegetation photosynthesis, respiration, and even autumn leaf senescence [16]. Vgreenup also influences vegetation cover and can further provide feedback to the climate system by regulating the exchange of water and energy between the land surface and atmosphere [17,18]. Therefore, the dynamics of greenup development and the underlying mechanism need to be thoroughly investigated to improve regional and global carbon cycles modeling performances.
Increasing Vgreenup has been reported for the Northern Hemisphere and the globe based on remote sensing observations [19,20,21]. Using the leaf area index (LAI) dataset, Wang et al. [19] found that the global average Vgreenup had increased by 0.003 m2 m−2 day−1 in response to climate change and human land management from 1982–2015, whereas the average Dgreenup had shortened by 1.4 days, and Agreenup had increased by 0.116 m2 m−2. Another study also showed an increasing trend of Vgreenup induced by the warming at high latitudes above 60° N, from 1982–2016, based on LAI data [20]. Despite the globally accelerated Vgreenup, some areas experienced decreasing Vgreenup. For example, Vgreenup declined in Northeast China between 1982 and 2015 due to the impact of frost [22]. Therefore, Vgreenup will not exhibit identical trends under distinct environments, so it is crucial to reveal the underlying mechanism. Though the relationships between Vgreenup and some climatic factors (such as temperature, precipitation, and radiation) have been revealed, more comprehensive research including additional climatic factors is still needed to better understand the driving mechanism underlying Vgreenup. For example, dryness and wind speed were confirmed to have significant effects on vegetation phenology and productivity [23,24].
Although remote sensing data have the advantages of extensive spatial coverage and high temporal frequencies, their results can be highly biased by data quality, due to snow and cloud contamination, sensor degradation bias, and the mixed pixel problem, especially in sparse vegetation areas [2]. Moreover, high limitations exist for revealing the driving mechanism based on remote sensing techniques without ground validation. Continuous ground observation can provide data for a deepened understanding of the driving forces and mechanism underlying greenup development. However, research on Vgreenup based on ground observation is still lacking. At present, the acquisition of ground-observed phenology data mainly originates from manual measurements, repeated digital photography, and eddy covariance measurements [25]. Among these methods, eddy covariance measurements at a flux tower form a reliable and widely used way to extract phenology at a landscape scale [26].
This study aimed to investigate the spatial variations in Vgreenup and its driving climatic factors by using eddy covariance data from 40 flux tower sites (417 site-years) in the northern temperate and boreal regions (>30° N). The specific objectives were: (1) to compare Vgreenup for different plant functional types (PFTs); (2) to elucidate the spatial pattern of Vgreenup and its underlying mechanism; (3) to reveal the difference in Vgreenup variation and driving factors between continents (Europe and North America).

2. Results

2.1. Measures of Vgreenup among PFTs

Vgreenup ranged from 0.06 to 0.54 g C m−2 day−2 across the 40 eddy covariance sites (Table 1), with a mean of 0.22 ± 0.11 g C m−2 day−2. The difference in Vgreenup was also significant among PFTs (F = 123.64, p < 0.001) (Figure 1). Cropland (CRO) exhibited the largest Vgreenup, followed by deciduous broadleaf forest (DBF), grassland (GRA), wetland (WET), mixed forest (MF), and evergreen needle-leaf forest (ENF) (Figure 1). Besides, Vgreenup varied more in CRO than in the other PFTs, as shown by a greater standard deviation. Vgreenup in GRA was comparable to that in DBF. In addition, there was no significant difference in Vgreenup between MF and WET.

2.2. Spatial Distribution of Vgreenup

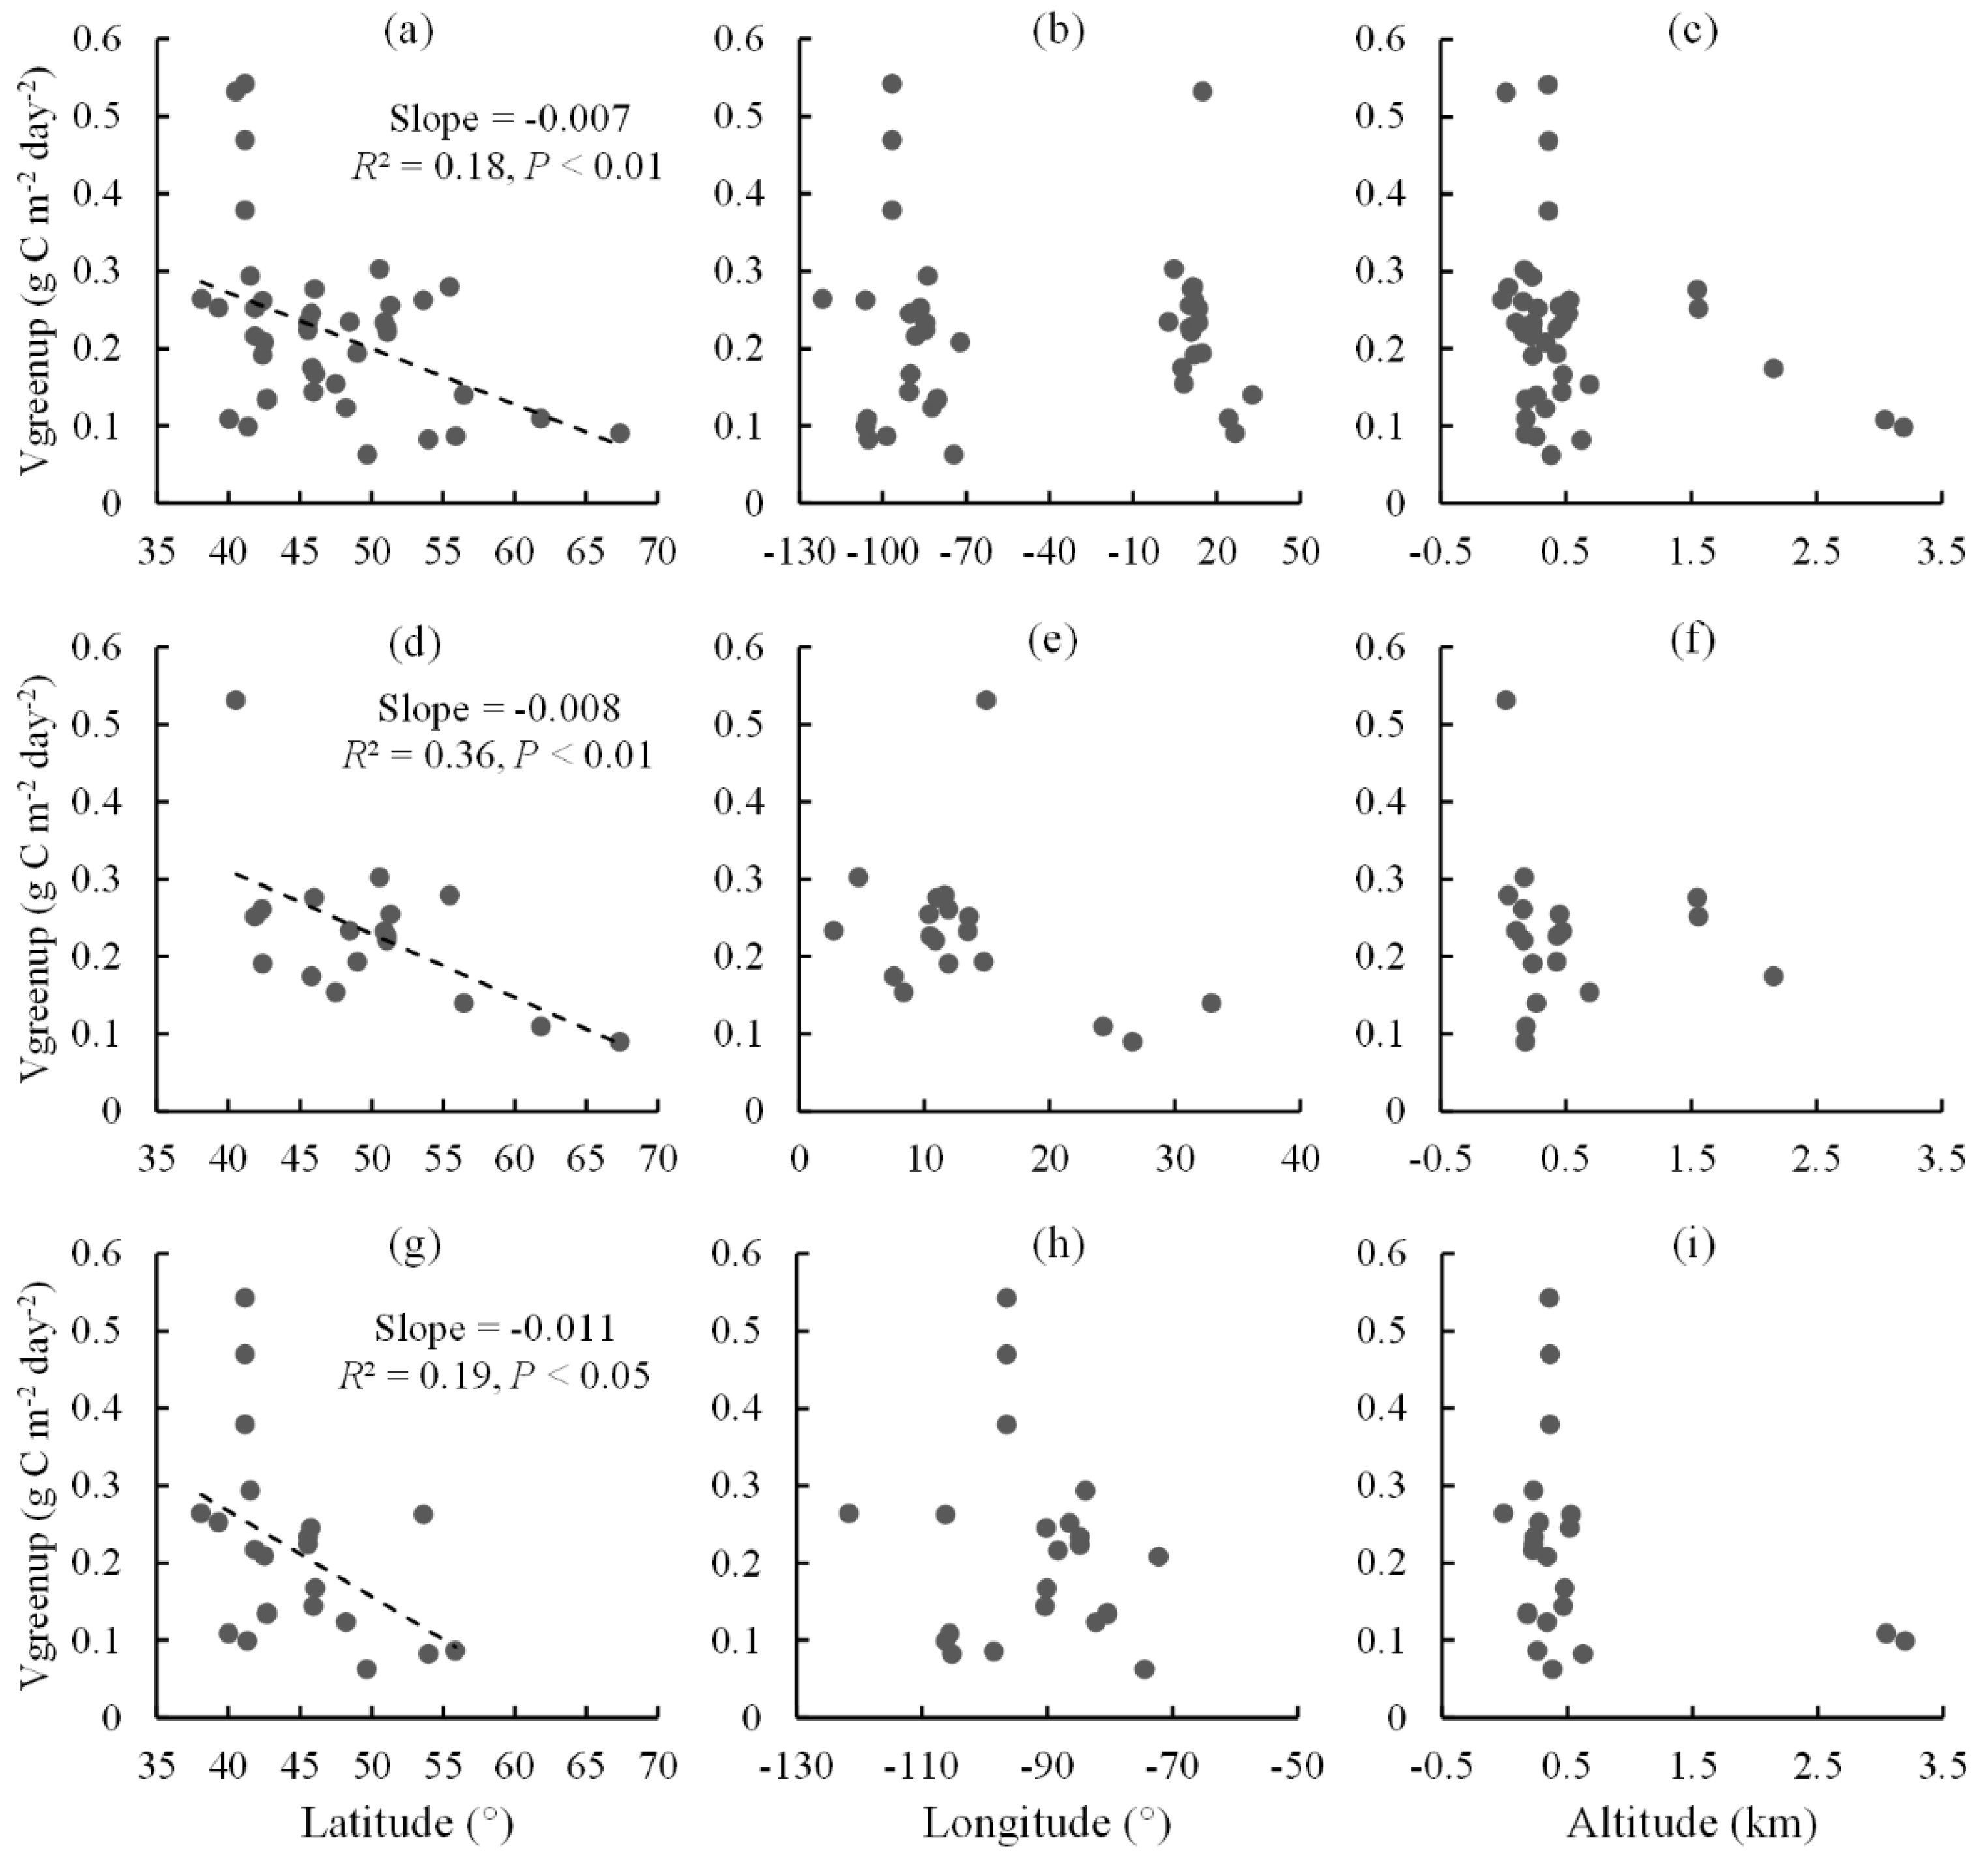
Vgreenup had a clear spatial pattern, which showed a strong dependence on latitude across all sites but no dependence on longitude and altitude (Figure 2a–c). Vgreenup decreased 0.007 g C m−2 day−2 with an increase in latitude per degree, which was different from the increasing Vgreenup trend with latitude observed by remote sensing in a previous study [21]. Besides, the strong dependence of Vgreenup on latitude was also observed in North America as well as in Europe (Figure 2d,g). Vgreenup decreased 0.008 and 0.011 g C m−2 day−2 per degree latitude increase in Europe and North America, respectively. There was no evident dependence of Vgreenup on longitude and altitude on the two continents separately.

2.3. Spatial Relationships between Vgreenup and Its Components

Vgreenup anomalies showed a significantly negative correlation with Dgreenup anomalies and a significantly positive correlation with Agreenup anomalies across all sites in the whole study area (Figure 3a,b). This was different from the findings of a previous satellite-based study [19], in which Vgreenup was positively correlated with both Dgreenup and Agreenup at a global scale. Across all sites in this study, the linear spatial correlation between Vgreenup anomalies and Dgreenup anomalies (R2 = 0.61, p < 0.001) was relatively weaker than that between Vgreenup anomalies and Agreenup anomalies (R2 = 0.83, p < 0.001), which implies the predominant role of Agreenup in the whole study area. The relative contributions of Dgreenup and Agreenup to the spatial variation of Vgreenup were different between Europe and North America (Figure 3c–f). Dgreenup anomalies exhibited a higher correlation (R2 = 0.67, p < 0.001) in explaining the spatial variation of Vgreenup anomalies in comparison to Agreenup anomalies (R2 = 0.59, p < 0.001) in Europe (Figure 3c,d). However, Vgreenup anomalies correlated more strongly with Agreenup anomalies (R2 = 0.95, p < 0.001) than with Dgreenup anomalies (R2 = 0.58, p < 0.001) in North America (Figure 3e,f), which indicated that the spatial variation of Vgreenup was more predominated by Agreenup.

2.4. Spatial Relationships between Vgreenup and Climatic Factors

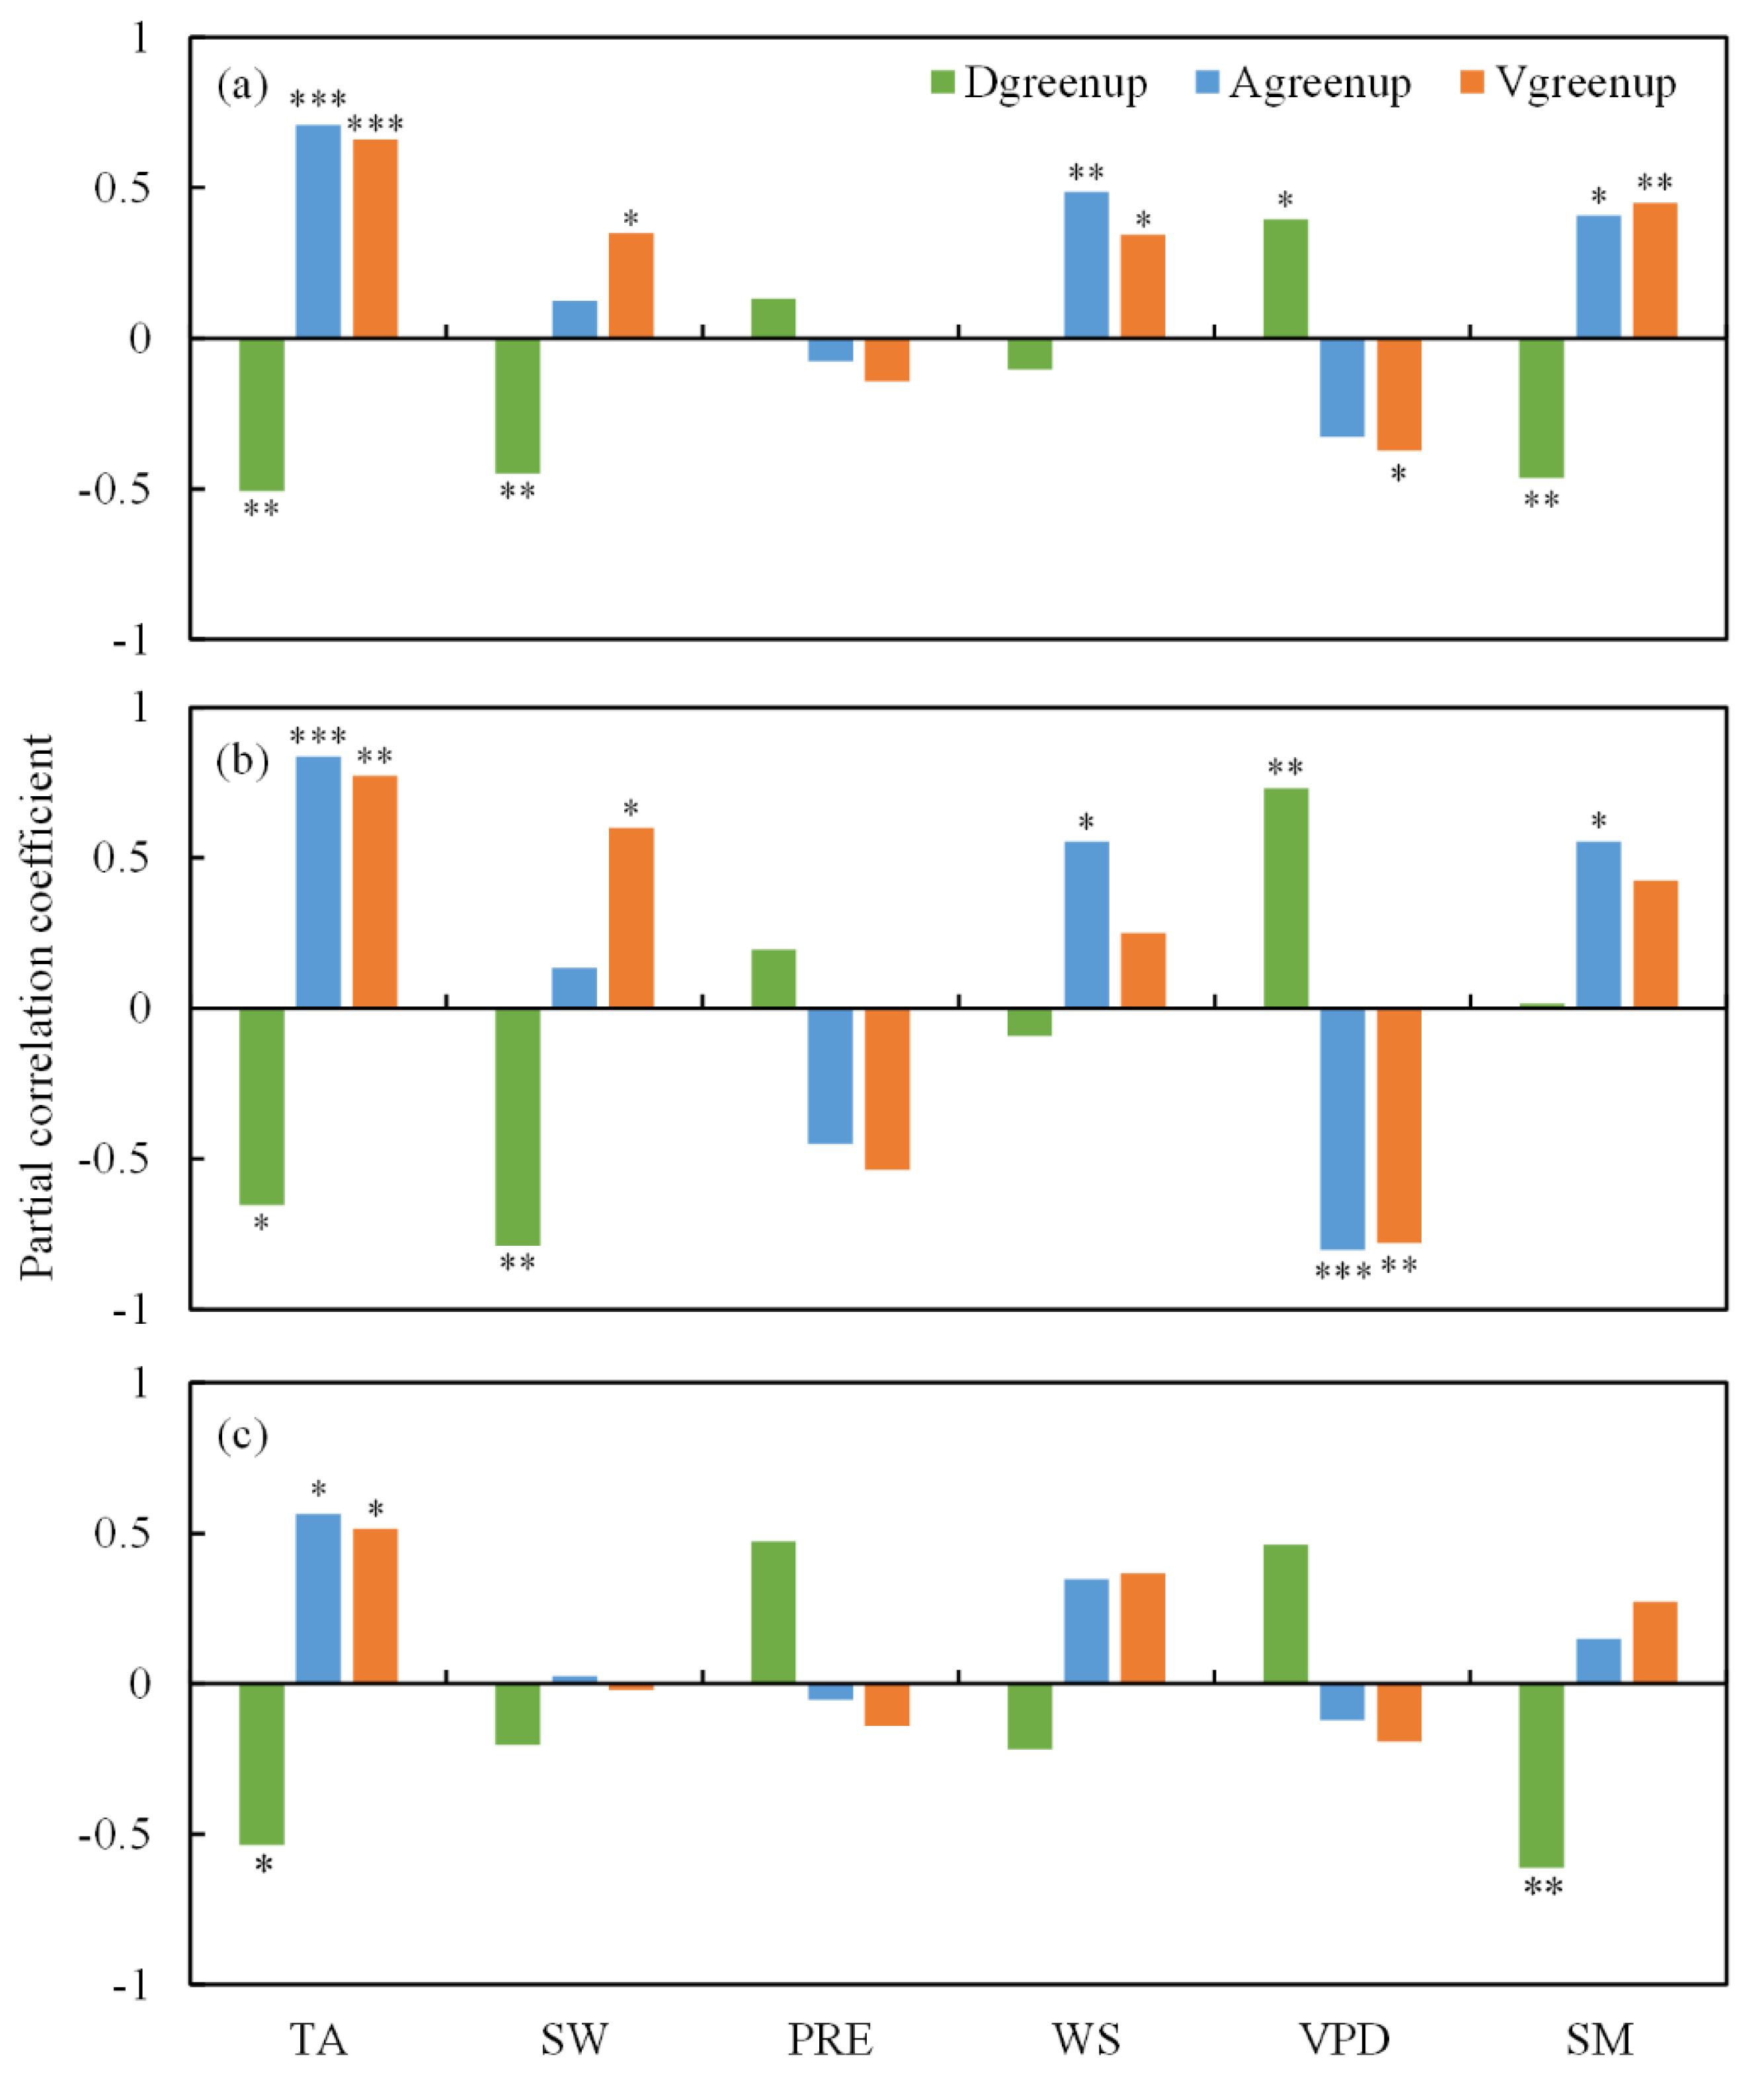
The spatial pattern of Vgreenup was regulated by multiple spring climatic factors across all sites in the whole study area (Figure 4a). Temperature (TA) played a predominant role in controlling the spatial variation in Vgreenup across all sites, with a significantly positive partial correlation (R = 0.66, p < 0.001), followed by soil moisture (SM) (R = 0.45, p < 0.01), vapor pressure deficit (VPD) (R = −0.37, p < 0.05), shortwave radiation (SW) (R = 0.35, p < 0.05), and wind speed (WS) (R = 0.35, p < 0.05). However, no significant relationship was found between precipitation (PRE) and Vgreenup. TA was significantly negatively correlated with Dgreenup (R = −0.51, p < 0.01) and was positively correlated with Agreenup (R = 0.71, p < 0.001), which indicated that increasing TA would shorten Dgreenup and promote Agreenup. Meanwhile, SM and VPD showed contrasting effects on Dgreenup as well as on Agreenup. SM exhibited a negative correlation with Dgreenup (R = −0.46, p < 0.01) and a positive correlation with Agreenup (R = 0.41, p < 0.05), while VPD was positively correlated with Dgreenup (R = 0.41, p < 0.05) and negatively correlated with Agreenup (R = −0.33, p > 0.05). This indicated that increasing VPD and decreasing SM would lengthen Dgreenup and lower Agreenup. Besides, a negative effect of SW on Dgreenup (R = −0.45, p < 0.01) and a positive effect of WS on Agreenup were also observed (R = 0.49, p < 0.01). It could also be observed that PRE had a minor influence on Dgreenup and Vgreenup.
In Europe, the effects of spring climatic factors on Vgreenup and its components were similar to those in the whole study area. Except for PRE, all spring climatic factors showed significant correlations with either Dgreenup or Agreenup in Europe (Figure 4b). A significantly positive effect of TA (R = 0.77, p < 0.01) and SW (R = 0.60, p < 0.05) on Vgreenup and a significantly negative effect of VPD on Vgreenup (R = −0.78, p < 0.01) could be found. However, no significant relationship was found between Vgreenup and spring climatic factors except for TA (R = 0.51, p < 0.05) in North America (Figure 4c). TA also showed significant relationships with Dgreenup (R = −0.54, p < 0.05) and Agreenup (R = 0.56, p < 0.05) in North America. Besides, SM was significantly and negatively correlated with Dgreenup (R = −0.61, p < 0.01) but exerted no significant influence on Agreenup or Vgreenup in North America (Figure 4c).
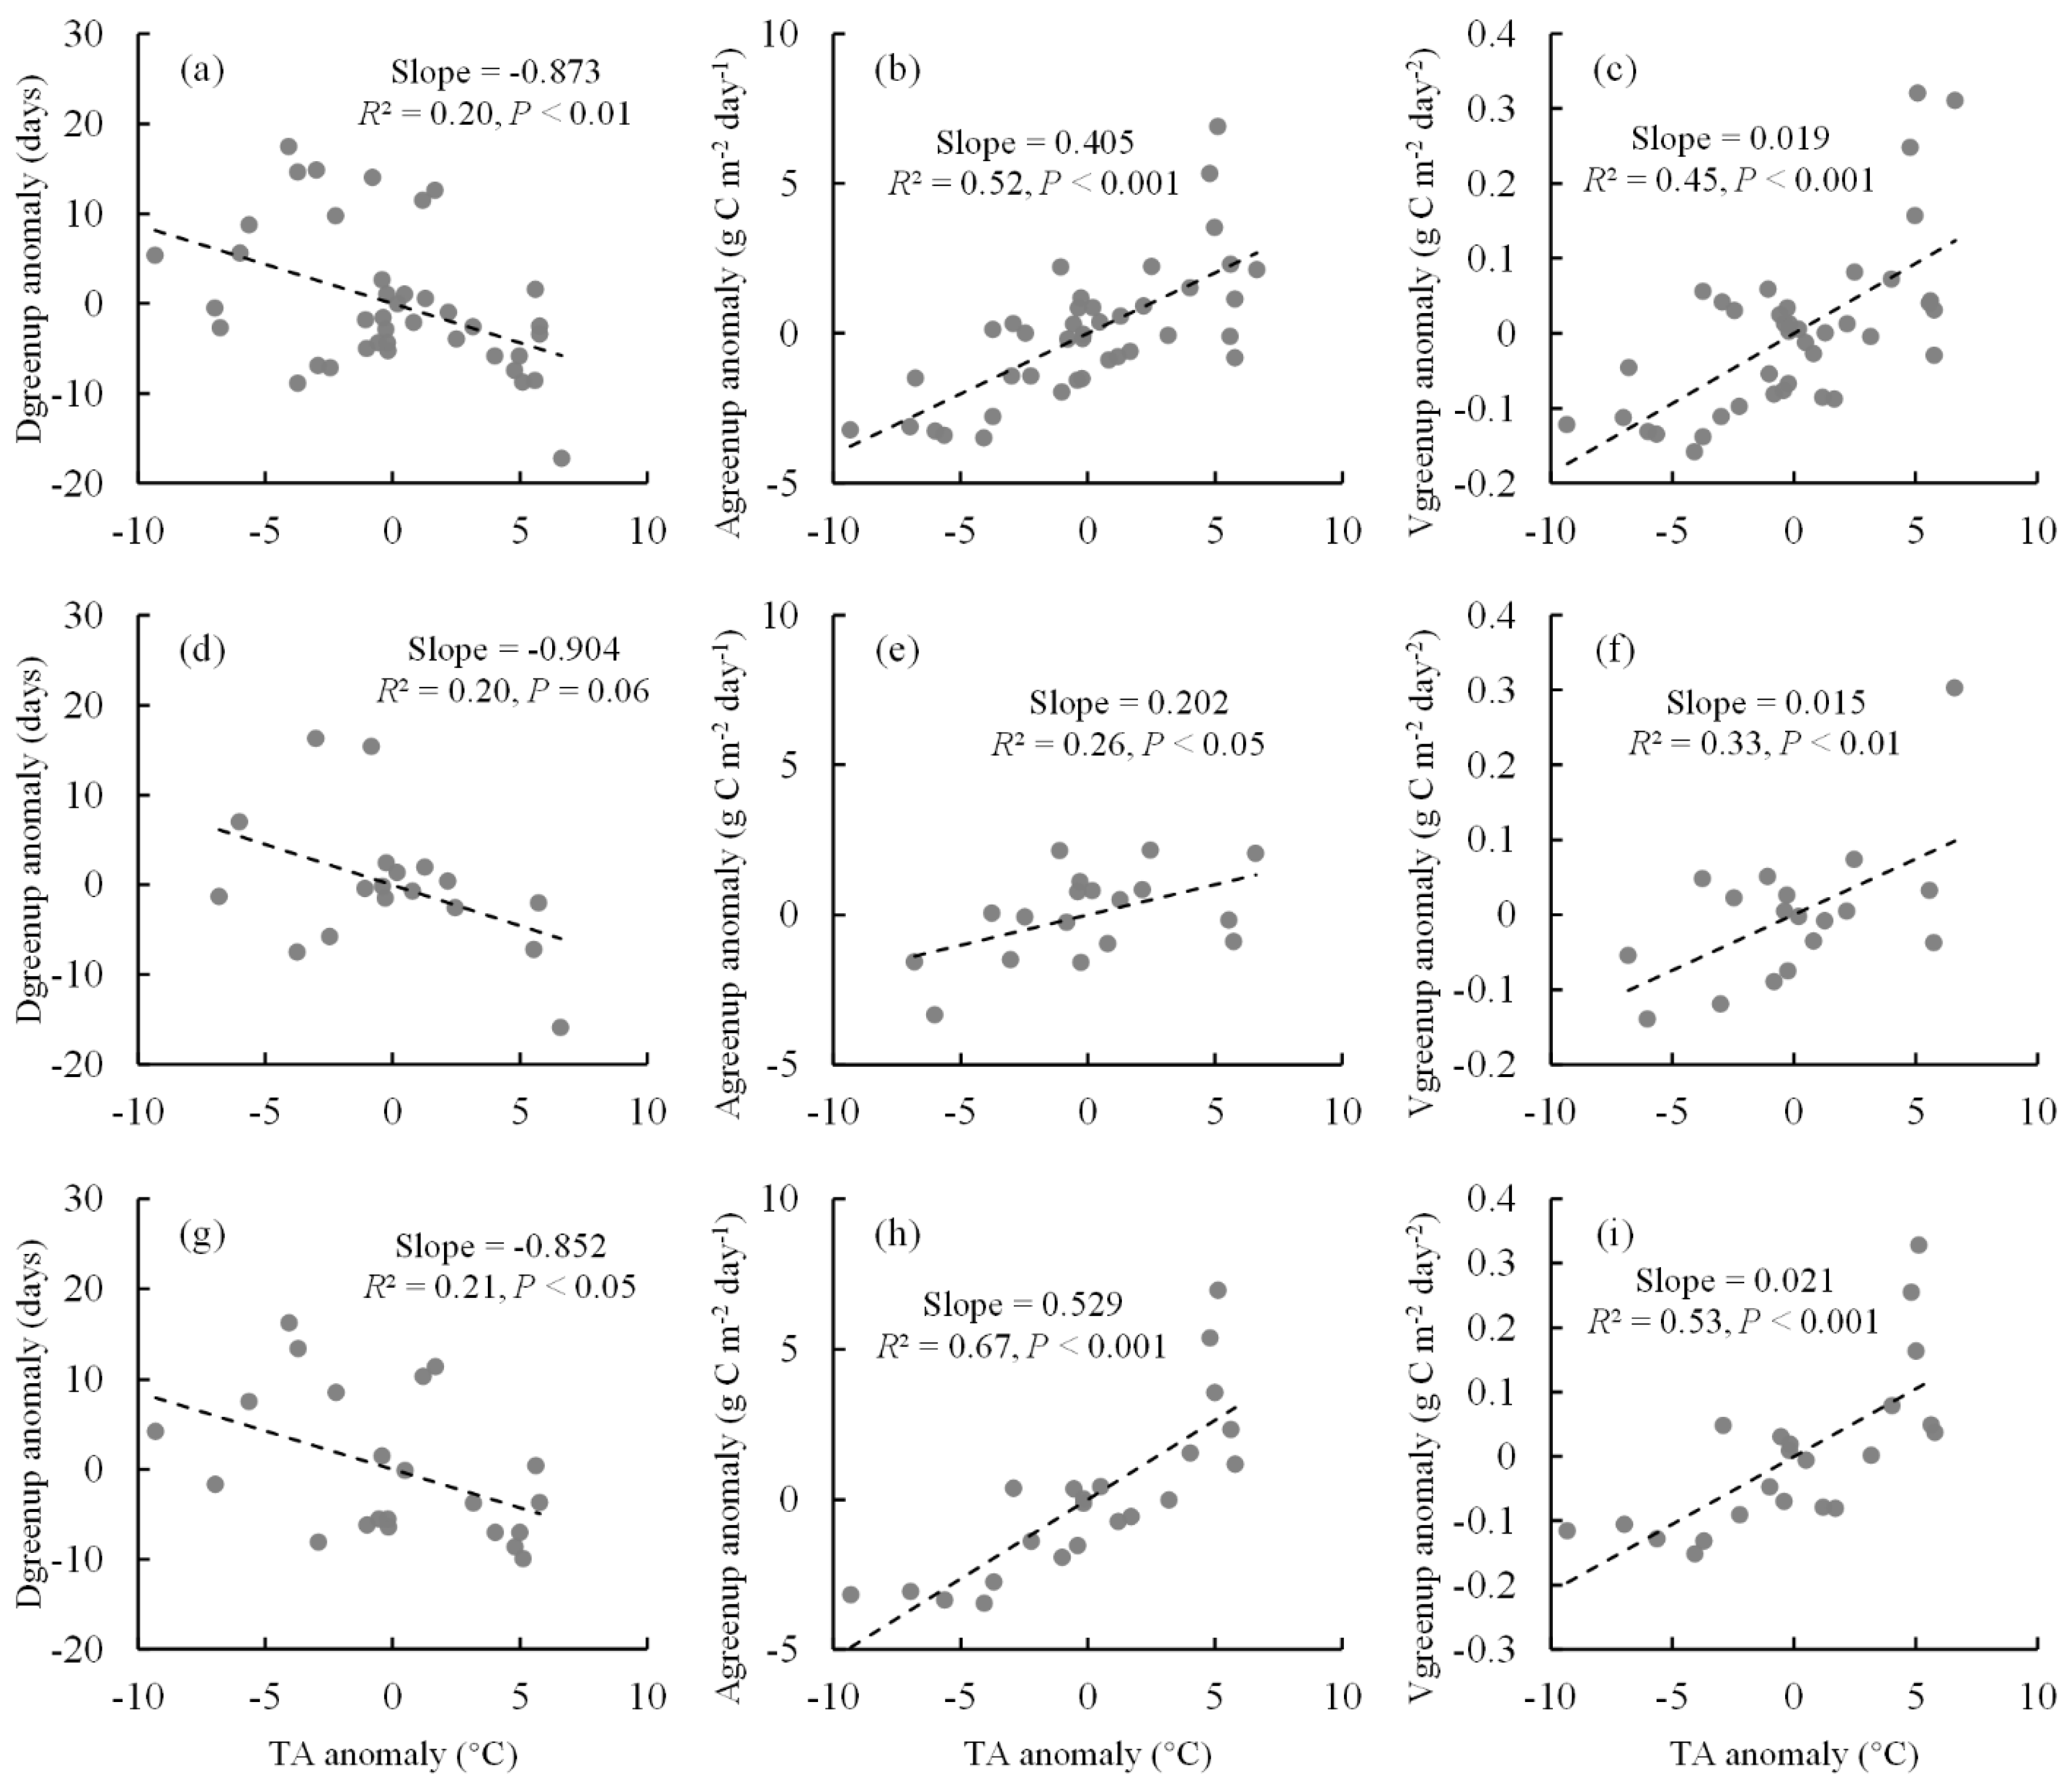
This study also analyzed the temperature sensitivity of Vgreenup and its components (Figure 5). In response to a 1 °C increase in TA, Dgreenup would shorten by 0.87 days across all sites of the whole study area, while Agreenup and Vgreenup would increase by 0.41 g C m−2 day−1 and 0.019 g C m−2 day−2, respectively (Figure 5a–c). The temperature sensitivity amplitudes in relation to Vgreenup and its components were different between Europe and North America (Figure 5d–i). The temperature sensitivity of Dgreenup was slightly greater in Europe (−0.90 days °C−1) than in North America (−0.85 days °C−1) (Figure 5d,g). However, the effect of TA on Agreenup was much stronger in North America than in Europe. With a 1 °C increase in TA, Agreenup would increase by 0.20 and 0.53 g C m−2 day−1 in Europe and North America, respectively (Figure 5e,h). Therefore, a greater temperature sensitivity of Vgreenup was observed in North America (0.021 g C m−2 day−2 °C−1) than in Europe (0.015 g C m−2 day−2 °C−1) (Figure 5f,i).

3. Discussion

Many previous studies have reported the distribution patterns along latitude, longitude, and altitude for vegetation phenology and productivity in adaptation to climate changes [27,28,29]. This study revealed the spatial pattern of Vgreenup across PFTs in the northern temperate and boreal regions. A strong dependence on latitude was observed for Vgreenup across all sites in both Europe and North America (Figure 2a), with a decreasing trend with rising latitude. This means there was more rapid canopy development in lower latitudes than in higher latitudes. However, Vgreenup demonstrated no clear patterns with longitude and altitude (Figure 2b,c). Furthermore, the above patterns were also confirmed when only considering sites in Europe or North America (Figure 2d–i). A previous study based on remote sensing observation found the latitude dependence of Vgreenup on both continents, but an opposite trend with latitude was observed in this study [21]. The discrepancies might be caused by the difference in the target scale between the satellite and field observations.
The spatial variation of Vgreenup was associated with the decoupling of the spatial patterns of its two components [19,22]. In this study, both Dgreenup and Agreenup were significantly correlated with Vgreenup along a spatial dimension, indicating that the spatial variations of Vgreenup were jointly regulated by Dgreenup and Agreenup (Figure 3a,b). In the whole study area, Vgreenup was more correlated with Agreenup (R2 = 0.83) than with Dgreenup (R2 = 0.61), which implies a more predominant effect of Agreenup variability compared with Dgreenup variability. This result is in line with the finding of a previous satellite-based study at a global scale [19]. Nevertheless, the variations of Dgreenup and Agreenup made different contributions to Vgreenup variation between continents. According to the correlation coefficients between Vgreenup and its components (Figure 3c–f), the spatial pattern of Vgreenup was more determined by Dgreenup in Europe but by Agreenup in North America.
This study further investigated the controls of the main spring climatic factors on the distributions of Vgreenup and its components (Dgreenup and Agreenup), by using the partial correlation. TA showed significant effects on Dgreenup (R = −0.51, p < 0.01), Agreenup (R = 0.71, p < 0.001) and Vgreenup (R = 0.66, p < 0.001) in the whole study area (Figure 4a). Specifically, increasing TA could shorten Dgreenup and promote Agreenup simultaneously, leading to an acceleration of Vgreenup. TA was reported to be the major driver for spring phenology based on long-term FLUXNET measurements [30]. Advanced SOG and the peak of the growing season (closing to EOG) in response to climate warming had been widely observed [10,31,32,33], but their non-uniform response magnitude would alter Agreenup. Under global warming, global average Agreenup decreased by 1.4 days during 1982–2015, according to the satellite LAI product [19]. Besides, TA had a stronger link with Agreenup (R = 0.71, p < 0.001) than with Dgreenup (R = −0.51, p < 0.01) in this study. The boosting effect of TA on Agreenup was consistent with the global greening and increasing productivity in recent decades due to climate warming [17,34,35]. Zhang et al., also reported the positive effect of increasing TA on the seasonal maximal gross primary productivity (GPPmax) based on eddy covariance at an alpine meadow site [36]. Rising TA can promote plant growth by enhancing enzymatic activity when TA is lower than the optimum temperature [37]. With the positive effect of spring TA on Vgreenup, increasing spring TA could enhance spring GPP, which had been previously confirmed across 21 FLUXNET sites in temperate and boreal forests [38]. In this study, increasing SW also contributed to shorter Dgreenup and higher Vgreenup, similar to effects of TA (Figure 4a). SW is highly related to the heat requirement for leaf unfolding [39]. Lower solar radiation can significantly delay spring bud development by decreasing the accumulation of growing degree days [40]. Therefore, SW can influence Dgreenup and Vgreenup by altering the temperature sensitivity of SOG and EOG [41].
VPD and SM are commonly used indicators for atmosphere and soil dryness, respectively [42,43,44]. A significant effect by drought on vegetation greenup development was observed in this study. By increasing VPD or decreasing SM, Dgreenup and Agreenup tended to become longer and lower, respectively, resulting in the deceleration of Vgreenup for the whole study area (Figure 4a). Previous studies based on eddy covariance observations also demonstrated the reduction in photosynthesis caused by dryness [45,46]. GPPmax has also been reported to be enhanced by summer PRE, based on data from 24 AmeriFlux sites [47]. However, no significant relationship was found between spring PRE and Vgreenup in this study. This might be caused by the fact that vegetation growth was more directly affected by SM and VPD compared with PRE. Vegetation tends to lower photosynthesis by closing stomata in a high VPD condition [48,49]. Different from VPD, SM influences vegetation photosynthesis by controlling the absorption of soil nutrients. Increasing SM will facilitate plant nutrient absorption, leading to the stimulation of Vgreenup [50].
Besides, this study found that there were positive effects by wind speed on Agreenup and Vgreenup for the entire study area (Figure 4a). This might be explained by the fact that moderate wind speed would increase the gas exchange rate of leaf stomata, accelerating transpiration and intercellular CO2 exchange, which results in a higher intercellular CO2 concentration and improved photosynthesis capacity [51].
In this study, the climatic controls on the spatial variations of Vgreenup were also compared between Europe and North America. The temperature sensitivities of Agreenup and Vgreenup were greater in North America than in Europe (Figure 5). This difference in temperature sensitivity could be caused by the effects of climatic factors other than TA. The spatial variations of Vgreenup were jointly controlled by TA, SW, and VPD in Europe but only affected by TA in North America (Figure 5b,c). Without the limitations of solar radiation and water supply, the vegetation may have developed greater temperature sensitivities to maximize the thermal benefits [52,53,54].
ENF sites were included to investigate Vgreenup in this study. It is difficult to extract the phenological metrics from ENF by using NDVI or LAI, due to their narrow seasonal variations in vegetation greenness [55,56]. In comparison, GPP derived from eddy covariance has a great advantage in extracting the phenological metrics from ENF, which can help improve the estimation of Vgreenup for ENF. Besides, solar-induced chlorophyll fluorescence can reflect vegetation photosynthesis directly [57], which can be used to investigate the phenological metrics and Vgreenup for ENF in the future. VPD and SM are often coupled through land–atmosphere interactions, hindering the ability to predict ecosystem responses to dryness [58,59]. Several methods have been proposed to distinguish the effects of VPD and SM on vegetation growth [60,61,62]. Multi-methods may need to be synthesized for quantifying the relative contributions of VPD and SM to Vgreenup in future work.

4. Materials and Methods

4.1. Carbon Fluxes and Climatic Data

Daily GPP data and climatic data were retrieved from the FLUXNET 2015 Tier 1 dataset (https://fluxnet.org/data/fluxnet2015-dataset/, accessed on 10 May 2022). The FLUXNET 2015 dataset provides in situ estimates of carbon, water, and heat fluxes between ecosystems and atmosphere of 212 sites across the globe, which are determined using the eddy covariance technique. The eddy covariance data for all the sites were processed by consistent and uniform procedures including quality control, gap-filling, and net ecosystem exchange (NEE) partitioning [63]. NEE measurements were partitioned into GPP and ecosystem respiration (ER). GPP based on nighttime partitioning method (GPP_NT_VUT_REF) was used in this study [64]. To avoid spurious effects caused by low-quality data, sites having at least 5 years with high-quality carbon flux data (NEE_VUT_REF_QC > 0.75 in a year) above 30° N were selected. In addition, only sites with mean start of greenup (SOG, defined below) occurring during spring (April–June) were included in this study. At last, 40 sites (417 site-year data) were selected to be analyzed, including 14 DBF sites, 10 ENF sites, 3 MF sites, 3 GRA sites, 8 CRO sites, and 2 WET sites (Figure 6, Table 1).
To analyze the relationship between Vgreenup and climatic variables, this study also collected the daily climatic data including TA, PRE, SW, WS, and VPD provided by the FLUXNET sites. Considering the unavailability of SM at most sites, the daily root-zone SM was extracted from Global Land Evaporation Amsterdam Model (GLEAM) v3.5a to reflect the soil water condition in root zone of each site (https://www.gleam.eu/, accessed on 15 May 2022) [65,66]. The depth of the root zone is different for low vegetation (0–100 cm) and tall vegetation (0–250 cm). The GLEAM v3.5a dataset was produced by combining satellite and reanalysis data, which provides temporally/spatially continuous SM at spatial resolution of 0.25° (~25 km), spanning from 1980 to 2020. The overall performance accuracy of GLEAM SM products is considerably high [43]. The mean values in spring were calculated for all climatic factors.

4.2. Calculation of Vgreenup

To remove outliers of GPP data, a Savitzky–Golay filter was adopted to smooth the daily GPP time series [67]. The width of the moving window was set to be 91 days, and the iteration time was set to be 1 according to a previous study [68]. Then, a modified double logistic function was used to fit the daily GPP for each year [32,69]:
f ( t ) = α 1 + α 2 1 + e 1 ( t β 1 ) α 3 1 + e 2 ( t β 2 )
where f(t) is the daily GPP at day of year (DOY) t; α 1 is the background GPP; α 2 α 1 and α 3 α 1 represent the amplitude relative to the background for the early summer plateau and the late summer plateau, respectively; 1 and 2 are the transition curvature parameters (normalized slope coefficients); and β 1 and β 2 are the midpoints in DOYs of these transitions for greenup and senescence, respectively.
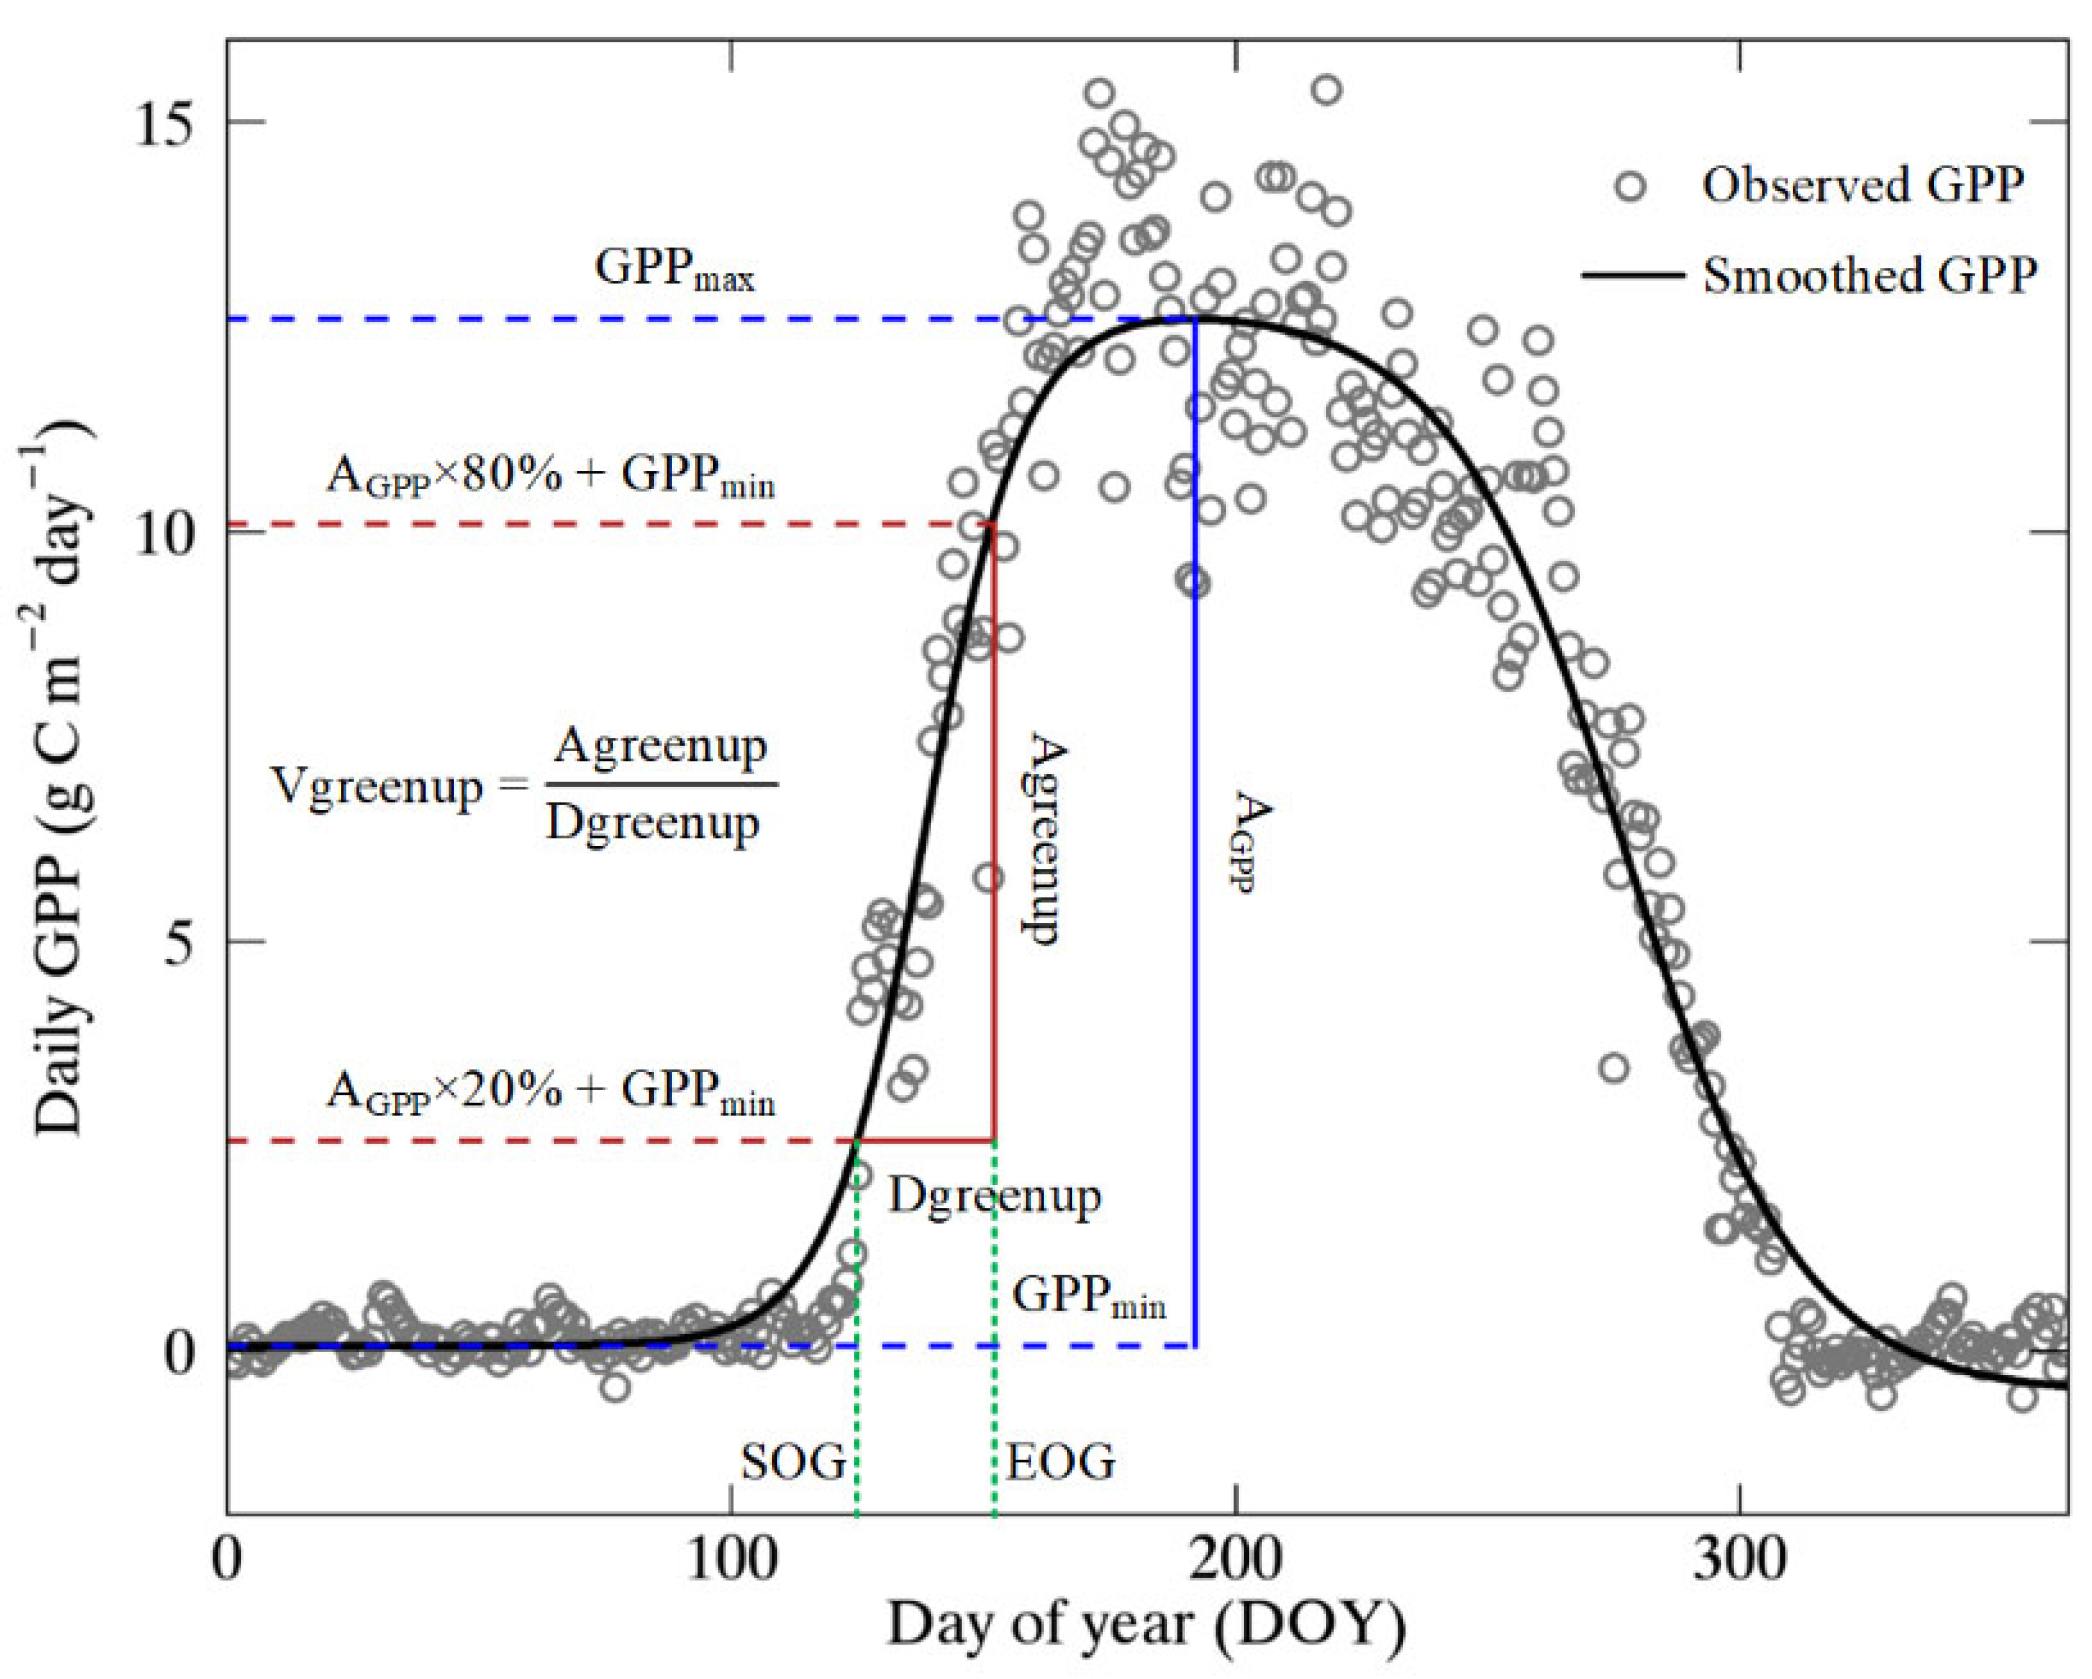
The relative threshold method is a simple but practical method to extract phenological metrics [70]. In this study, the start and end of greenup period (SOG and EOG) were defined as the dates when the fitted GPP curve first reach 20% and 80% the seasonal amplitude, respectively [19]. Dgreenup was defined as the difference between EOG and SOG. Agreenup was calculated as the difference in GPP values at dates of EOG and SOG. At last, Vgreenup was calculated as the ratio of Agreenup to Dgreenup [19]. The process for determining Dgreenup, Agreenup, and Vgreenup is illustrated in Figure 7.

4.3. Statistical Analysis

Considering the limited time series of GPP, this study only analyzed the spatial variations rather than the temporal variations for Vgreenup. The indicators of Dgreenup, Agreenup, and Vgreenup were derived from each site-year. Then, the multi-year indicators were averaged at each site to analyze the spatial pattern of Dgreenup, Agreenup, and Vgreenup. One-way analysis of variance (ANOVA) and least significant difference (LSD) multiple comparisons test were performed to determine significant differences in Vgreenup among PFTs. The significant level was set at α = 0.05. Simple linear regression was adopted to analyze the relationship between Vgreenup and geographical factors (latitude, longitude, and altitude). Correlations between spatial anomalies of Vgreenup and its components (Dgreenup and Agreenup) were analyzed to identify whether the spatial variations in Vgreenup were affected by Dgreenup and Agreenup. Partial correlation analysis was also conducted to evaluate the isolated effects of spring climatic factors (TA, PRE, SW, VPD, WS, and SM) on Dgreenup, Agreenup, and Vgreenup. The statistical significances of the regression and correlation coefficients were examined using the t-test. The p-values less than 0.05 were considered significant. The direction and magnitude regarding driving factors on spatial variations of Vgreenup were compared between Europe and North America. Besides, the results in this study were also compared with the relevant findings in previous studies.

5. Conclusions

Based on 417 site-years’ flux data from 40 sites in the northern temperate and boreal regions, this study examined the characters of Vgreenup for different PFTs and further investigated the roles of climatic variables in controlling the spatial variation of Vgreenup. The results found that CRO and ENF had the largest and lowest Vgreenup among all PTFs, respectively. Vgreenup showed strong dependence on latitude but no obvious dependence on longitude or altitude. The spatial variations of Dgreenup and Agreenup jointly controlled the distribution of Vgreenup but made distinct contributions to Vgreenup variation between Europe and North America. Different controls of spring climatic factors on the spatial variation of Vgreenup were also observed between Europe and North America. In Europe, TA and SW had a positive effect on Vgreenup, while VPD showed a negative influence. However, Vgreenup was only affected by TA in North America. Such a difference led to a higher temperature sensitivity for Vgreenup in North America than in Europe. This study can help us to better understand the development of vegetation greenup from the perspective of field observation, which is an important supplement and validation for satellite-based research. Besides, long-term field observation is needed to further investigate the temporal dynamics of Vgreenup, for a more comprehensive analysis in the future.

Funding

This research was supported by the National Key Research and Development Program of China (2019YFC0507801), the strategic priority research program of the Chinese Academy of Sciences (XDA19070303), the National Natural Science Foundation of China (41901131 and 41725003), and the West Light Foundation of the Chinese Academy of Sciences (2019).

Institutional Review Board Statement

Not applicable.

Informed Consent Statement

Not applicable.

Data Availability Statement

Publicly available datasets were analyzed in this study. The data source and access links are indicated in the text.

Conflicts of Interest

The author declares no conflict of interest.

References

  1. Schwartz, M.D. Phenology: An Integrative Environmental Science; Springer: Dordrecht, The Netherlands, 2003. [Google Scholar]
  2. Piao, S.; Liu, Q.; Chen, A.; Janssens, I.A.; Fu, Y.; Dai, J.; Liu, L.; Lian, X.; Shen, M.; Zhu, X. Plant phenology and global climate change: Current progresses and challenges. Glob. Change Biol. 2019, 25, 1922–1940. [Google Scholar] [CrossRef] [PubMed]
  3. Morisette, J.T.; Richardson, A.D.; Knapp, A.K.; Fisher, J.I.; Graham, E.A.; Abatzoglou, J.; Wilson, B.E.; Breshears, D.D.; Henebry, G.M.; Hanes, J.M.; et al. Tracking the rhythm of the seasons in the face of global change: Phenological research in the 21st century. Front. Ecol. Environ. 2009, 7, 253–260. [Google Scholar] [CrossRef] [Green Version]
  4. Xia, J.; Niu, S.; Ciais, P.; Janssens, I.A.; Chen, J.; Ammann, C.; Arain, A.; Blanken, P.D.; Cescatti, A.; Bonal, D.; et al. Joint control of terrestrial gross primary productivity by plant phenology and physiology. Proc. Natl. Acad. Sci. USA 2015, 112, 2788–2793. [Google Scholar] [CrossRef] [PubMed] [Green Version]
  5. Zhou, S.; Zhang, Y.; Caylor, K.K.; Luo, Y.; Xiao, X.; Ciais, P.; Huang, Y.; Wang, G. Explaining inter-annual variability of gross primary productivity from plant phenology and physiology. Agric. For. Meteorol. 2016, 226–227, 246–256. [Google Scholar] [CrossRef] [Green Version]
  6. Zheng, Z.; Zhu, W.; Chen, G.; Jiang, N.; Fan, D.; Zhang, D. Continuous but diverse advancement of spring-summer phenology in response to climate warming across the Qinghai-Tibetan Plateau. Agric. For. Meteorol. 2016, 223, 194–202. [Google Scholar] [CrossRef]
  7. Zhu, W.; Jiang, N.; Chen, G.; Zhang, D.; Zheng, Z.; Fan, D. Divergent shifts and responses of plant autumn phenology to climate change on the Qinghai-Tibetan Plateau. Agric. For. Meteorol. 2017, 239, 166–175. [Google Scholar] [CrossRef]
  8. Menzel, A.; Sparks, T.H.; Estrella, N.; Koch, E.; Aasa, A.; Ahas, R.; Alm-KÜBler, K.; Bissolli, P.; BraslavskÁ, O.G.; Briede, A.; et al. European phenological response to climate change matches the warming pattern. Glob. Change Biol. 2006, 12, 1969–1976. [Google Scholar] [CrossRef]
  9. Zhang, G.; Zhang, Y.; Dong, J.; Xiao, X. Green-up dates in the Tibetan Plateau have continuously advanced from 1982 to 2011. Proc. Natl. Acad. Sci. USA 2013, 110, 4309–4314. [Google Scholar] [CrossRef] [Green Version]
  10. Jeong, S.-J.; Ho, C.-H.; Gim, H.-J.; Brown, M.E. Phenology shifts at start vs. end of growing season in temperate vegetation over the Northern Hemisphere for the period 1982-2008. Glob. Change Biol. 2011, 17, 2385–2399. [Google Scholar] [CrossRef]
  11. Cleland, E.E.; Chuine, I.; Menzel, A.; Mooney, H.A.; Schwartz, M.D. Shifting plant phenology in response to global change. Trends Ecol. Evol. 2007, 22, 357–365. [Google Scholar] [CrossRef]
  12. Root, T.L.; Price, J.T.; Hall, K.R.; Schneider, S.H.; Rosenzweig, C.; Pounds, J.A. Fingerprints of global warming on wild animals and plants. Nature 2003, 421, 57–60. [Google Scholar] [CrossRef] [PubMed]
  13. Parmesan, C.; Yohe, G. A globally coherent fingerprint of climate change impacts across natural systems. Nature 2003, 421, 37–42. [Google Scholar] [CrossRef] [PubMed]
  14. Bischof, R.; Loe, L.E.; Meisingset, E.L.; Zimmermann, B.; Van Moorter, B.; Mysterud, A. A migratory northern ungulate in the pursuit of spring: Jumping or surfing the green wave? Am. Nat. 2012, 180, 407–424. [Google Scholar] [CrossRef] [PubMed] [Green Version]
  15. Merkle, J.A.; Monteith, K.L.; Aikens, E.O.; Hayes, M.M.; Hersey, K.R.; Middleton, A.D.; Oates, B.A.; Sawyer, H.; Scurlock, B.M.; Kauffman, M.J. Large herbivores surf waves of green-up during spring. Proc. R. Soc. B Biol. Sci. 2016, 283, 20160456. [Google Scholar] [CrossRef] [PubMed] [Green Version]
  16. Zani, D.; Crowther, T.W.; Mo, L.; Renner, S.S.; Zohner, C.M. Increased growing-season productivity drives earlier autumn leaf senescence in temperate trees. Science 2020, 370, 1066–1071. [Google Scholar] [CrossRef] [PubMed]
  17. Piao, S.; Wang, X.; Park, T.; Chen, C.; Lian, X.; He, Y.; Bjerke, J.W.; Chen, A.; Ciais, P.; Tømmervik, H. Characteristics, drivers and feedbacks of global greening. Nat. Rev. Earth Environ. 2020, 1, 14–27. [Google Scholar] [CrossRef] [Green Version]
  18. Zhu, Y.; Zhang, Y.; Zheng, Z.; Liu, Y.; Wang, Z.; Cong, N.; Zu, J.; Tang, Z.; Zhao, G.; Gao, J. Converted vegetation type regulates the vegetation greening effects on land surface albedo in arid regions of China. Agric. For. Meteorol. 2022, 324, 109119. [Google Scholar] [CrossRef]
  19. Wang, L.; Tian, F.; Wang, Y.; Wu, Z.; Schurgers, G.; Fensholt, R. Acceleration of global vegetation greenup from combined effects of climate change and human land management. Glob. Change Biol. 2018, 24, 5484–5499. [Google Scholar] [CrossRef]
  20. Park, H.; Jeong, S.; Penuelas, J. Accelerated rate of vegetation green-up related to warming at northern high latitudes. Glob. Change Biol. 2020, 26, 6190–6202. [Google Scholar] [CrossRef]
  21. Park, H.; Jeong, S.-J.; Ho, C.-H.; Kim, J.; Brown, M.E.; Schaepman, M.E. Nonlinear response of vegetation green-up to local temperature variations in temperate and boreal forests in the Northern Hemisphere. Remote Sens. Environ. 2015, 165, 100–108. [Google Scholar] [CrossRef]
  22. Deng, G.; Zhang, H.; Yang, L.; Zhao, J.; Guo, X.; Ying, H.; Rihan, W.; Guo, D. Estimating frost during growing season and its impact on the velocity of vegetation greenup and withering in Northeast China. Remote Sens. 2020, 12, 1355. [Google Scholar] [CrossRef]
  23. Wu, C.; Wang, J.; Ciais, P.; Penuelas, J.; Zhang, X.; Sonnentag, O.; Tian, F.; Wang, X.; Wang, H.; Liu, R.; et al. Widespread decline in winds delayed autumn foliar senescence over high latitudes. Proc. Natl. Acad. Sci. USA 2021, 118, e2015821118. [Google Scholar] [CrossRef] [PubMed]
  24. Chen, X.; Ciais, P.; Maignan, F.; Zhang, Y.; Bastos, A.; Liu, L.; Bacour, C.; Fan, L.; Gentine, P.; Goll, D.; et al. Vapor pressure deficit and sunlight explain seasonality of leaf phenology and photosynthesis across Amazonian evergreen broadleaved forest. Glob. Biogeochem. Cycles 2021, 35, e2020GB006893. [Google Scholar] [CrossRef]
  25. Tian, F.; Cai, Z.; Jin, H.; Hufkens, K.; Scheifinger, H.; Tagesson, T.; Smets, B.; Van Hoolst, R.; Bonte, K.; Ivits, E.; et al. Calibrating vegetation phenology from Sentinel-2 using eddy covariance, PhenoCam, and PEP725 networks across Europe. Remote Sens. Environ. 2021, 260, 112456. [Google Scholar] [CrossRef]
  26. Gonsamo, A.; Chen, J.M.; Wu, C.; Dragoni, D. Predicting deciduous forest carbon uptake phenology by upscaling FLUXNET measurements using remote sensing data. Agric. For. Meteorol. 2012, 165, 127–135. [Google Scholar] [CrossRef]
  27. Gao, M.; Piao, S.; Chen, A.; Yang, H.; Liu, Q.; Fu, Y.H.; Janssens, I.A. Divergent changes in the elevational gradient of vegetation activities over the last 30 years. Nat. Commun. 2019, 10, 2970. [Google Scholar] [CrossRef] [Green Version]
  28. Zhang, Y.; Xu, M.; Chen, H.; Adams, J. Global pattern of NPP to GPP ratio derived from MODIS data: Effects of ecosystem type, geographical location and climate. Glob. Ecol. Biogeogr. 2009, 18, 280–290. [Google Scholar] [CrossRef]
  29. Cheng, W.; Li, Z.; Yan, L. Uniforming spring phenology under non-uniform climate warming across latitude in China. Sci. Total Environ. 2021, 762, 143177. [Google Scholar] [CrossRef]
  30. Wang, X.; Xiao, J.; Li, X.; Cheng, G.; Ma, M.; Zhu, G.; Altaf Arain, M.; Andrew Black, T.; Jassal, R.S. No trends in spring and autumn phenology during the global warming hiatus. Nat. Commun. 2019, 10, 2389. [Google Scholar] [CrossRef] [Green Version]
  31. Park, T.; Chen, C.; Macias-Fauria, M.; Tømmervik, H.; Choi, S.; Winkler, A.; Bhatt, U.S.; Walker, D.A.; Piao, S.; Brovkin, V.; et al. Changes in timing of seasonal peak photosynthetic activity in northern ecosystems. Glob. Change Biol. 2019, 25, 2382–2395. [Google Scholar] [CrossRef]
  32. Gonsamo, A.; Chen, J.M.; Ooi, Y.W. Peak season plant activity shift towards spring is reflected by increasing carbon uptake by extratropical ecosystems. Glob. Change Biol. 2018, 24, 2117–2128. [Google Scholar] [CrossRef] [PubMed]
  33. Wang, X.; Wu, C. Estimating the peak of growing season (POS) of China’s terrestrial ecosystems. Agric. For. Meteorol. 2019, 278, 107639. [Google Scholar] [CrossRef]
  34. Keenan, T.F.; Riley, W.J. Greening of the land surface in the world’s cold regions consistent with recent warming. Nat. Clim. Change 2018, 8, 825–828. [Google Scholar] [CrossRef]
  35. Song, Y.; Jiao, W.; Wang, J.; Wang, L. Increased global vegetation productivity despite rising atmospheric dryness over the last two decades. Earth’s Future 2022, 10, e2021EF002634. [Google Scholar] [CrossRef]
  36. Zhang, T.; Tang, Y.; Xu, M.; Zhao, G.; Chen, N.; Zheng, Z.; Zhu, J.; Ji, X.; Wang, D.; Zhang, Y.; et al. Joint control of alpine meadow productivity by plant phenology and photosynthetic capacity. Agric. For. Meteorol. 2022, 325, 109135. [Google Scholar] [CrossRef]
  37. Atkinson, D.; Porter, J.R. Temperature, plant development and crop yields. Trends Plant Sci. 1996, 1, 119–124. [Google Scholar] [CrossRef]
  38. Richardson, A.D.; Andy Black, T.; Ciais, P.; Delbart, N.; Friedl, M.A.; Gobron, N.; Hollinger, D.Y.; Kutsch, W.L.; Longdoz, B.; Luyssaert, S. Influence of spring and autumn phenological transitions on forest ecosystem productivity. Philos. Trans. R. Soc. B 2010, 365, 3227–3246. [Google Scholar] [CrossRef] [Green Version]
  39. Peaucelle, M.; Janssens, I.A.; Stocker, B.D.; Descals Ferrando, A.; Fu, Y.H.; Molowny-Horas, R.; Ciais, P.; Peñuelas, J. Spatial variance of spring phenology in temperate deciduous forests is constrained by background climatic conditions. Nat. Commun. 2019, 10, 5388. [Google Scholar] [CrossRef] [Green Version]
  40. Vitasse, Y.; Baumgarten, F.; Zohner, C.M.; Kaewthongrach, R.; Fu, Y.H.; Walde, M.G.; Moser, B. Impact of microclimatic conditions and resource availability on spring and autumn phenology of temperate tree seedlings. New Phytol. 2021, 232, 537–550. [Google Scholar] [CrossRef]
  41. Gao, M.; Wang, X.; Meng, F.; Liu, Q.; Li, X.; Zhang, Y.; Piao, S. Three-dimensional change in temperature sensitivity of northern vegetation phenology. Glob. Change Biol. 2020, 26, 5189–5201. [Google Scholar] [CrossRef]
  42. Yuan, W.; Zheng, Y.; Piao, S.; Ciais, P.; Lombardozzi, D.; Wang, Y.; Ryu, Y.; Chen, G.; Dong, W.; Hu, Z. Increased atmospheric vapor pressure deficit reduces global vegetation growth. Sci. Adv. 2019, 5, eaax1396. [Google Scholar] [CrossRef] [PubMed] [Green Version]
  43. Dang, C.; Shao, Z.; Huang, X.; Qian, J.; Cheng, G.; Ding, Q.; Fan, Y. Assessment of the importance of increasing temperature and decreasing soil moisture on global ecosystem productivity using solar-induced chlorophyll fluorescence. Glob. Change Biol. 2022, 28, 2066–2080. [Google Scholar] [CrossRef] [PubMed]
  44. Stocker, B.D.; Zscheischler, J.; Keenan, T.F.; Prentice, I.C.; Seneviratne, S.I.; Peñuelas, J. Drought impacts on terrestrial primary production underestimated by satellite monitoring. Nat. Geosci. 2019, 12, 264–270. [Google Scholar] [CrossRef] [Green Version]
  45. Fu, Z.; Ciais, P.; Prentice, I.C.; Gentine, P.; Makowski, D.; Bastos, A.; Luo, X.; Green, J.K.; Stoy, P.C.; Yang, H.; et al. Atmospheric dryness reduces photosynthesis along a large range of soil water deficits. Nat. Commun. 2022, 13, 989. [Google Scholar] [CrossRef]
  46. Bastos, A.; Ciais, P.; Friedlingstein, P.; Sitch, S.; Pongratz, J.; Fan, L.; Wigneron, J.-P.; Weber, U.; Reichstein, M.; Fu, Z. Direct and seasonal legacy effects of the 2018 heat wave and drought on European ecosystem productivity. Sci. Adv. 2020, 6, eaba2724. [Google Scholar] [CrossRef] [PubMed]
  47. Zhou, S.; Zhang, Y.; Ciais, P.; Xiao, X.; Luo, Y.; Caylor, K.K.; Huang, Y.; Wang, G. Dominant role of plant physiology in trend and variability of gross primary productivity in North America. Sci. Rep. 2017, 7, 41366. [Google Scholar] [CrossRef] [Green Version]
  48. Novick, K.A.; Ficklin, D.L.; Stoy, P.C.; Williams, C.A.; Bohrer, G.; Oishi, A.C.; Papuga, S.A.; Blanken, P.D.; Noormets, A.; Sulman, B.N.; et al. The increasing importance of atmospheric demand for ecosystem water and carbon fluxes. Nat. Clim. Change 2016, 6, 1023–1027. [Google Scholar] [CrossRef] [Green Version]
  49. Luo, M.; Meng, F.; Sa, C.; Duan, Y.; Bao, Y.; Liu, T.; De Maeyer, P. Response of vegetation phenology to soil moisture dynamics in the Mongolian Plateau. Catena 2021, 206, 105505. [Google Scholar] [CrossRef]
  50. Zhou, X.; Zhou, L.; Nie, Y.; Fu, Y.; Du, Z.; Shao, J.; Zheng, Z.; Wang, X. Similar responses of soil carbon storage to drought and irrigation in terrestrial ecosystems but with contrasting mechanisms: A meta-analysis. Agric. Ecosyst. Environ. 2016, 228, 70–81. [Google Scholar] [CrossRef]
  51. Zhang, T.; Xu, X.; Jiang, H.; Qiao, S.; Guan, M.; Huang, Y.; Gong, R. Widespread decline in winds promoted the growth of vegetation. Sci. Total Environ. 2022, 825, 153682. [Google Scholar] [CrossRef]
  52. Shen, M.; Piao, S.; Cong, N.; Zhang, G.; Jassens, I.A. Precipitation impacts on vegetation spring phenology on the Tibetan Plateau. Glob. Change Biol. 2015, 21, 3647–3656. [Google Scholar] [CrossRef] [PubMed] [Green Version]
  53. Piao, S.; Nan, H.; Huntingford, C.; Ciais, P.; Friedlingstein, P.; Sitch, S.; Peng, S.; Ahlström, A.; Canadell, J.G.; Cong, N. Evidence for a weakening relationship between interannual temperature variability and northern vegetation activity. Nat. Commun. 2014, 5, 5018. [Google Scholar] [CrossRef] [PubMed] [Green Version]
  54. Angert, A.; Biraud, S.; Bonfils, C.; Henning, C.; Buermann, W.; Pinzon, J.; Tucker, C.; Fung, I. Drier summers cancel out the CO2 uptake enhancement induced by warmer springs. Proc. Natl. Acad. Sci. USA 2005, 102, 10823–10827. [Google Scholar] [CrossRef] [PubMed] [Green Version]
  55. Wu, C.; Gonsamo, A.; Gough, C.M.; Chen, J.M.; Xu, S. Modeling growing season phenology in North American forests using seasonal mean vegetation indices from MODIS. Remote Sens. Environ. 2014, 147, 79–88. [Google Scholar] [CrossRef]
  56. Wong, C.Y.S.; Mercado, L.M.; Arain, M.A.; Ensminger, I. Remotely sensed carotenoid dynamics improve modelling photosynthetic phenology in conifer and deciduous forests. Agric. For. Meteorol. 2022, 321, 108977. [Google Scholar] [CrossRef]
  57. Meroni, M.; Rossini, M.; Guanter, L.; Alonso, L.; Rascher, U.; Colombo, R.; Moreno, J. Remote sensing of solar-induced chlorophyll fluorescence: Review of methods and applications. Remote Sens. Environ. 2009, 113, 2037–2051. [Google Scholar] [CrossRef]
  58. Liu, L.; Gudmundsson, L.; Hauser, M.; Qin, D.; Li, S.; Seneviratne, S.I. Soil moisture dominates dryness stress on ecosystem production globally. Nat. Commun. 2020, 11, 4892. [Google Scholar] [CrossRef]
  59. Yu, T.; Jiapaer, G.; Bao, A.; Zheng, G.; Zhang, J.; Li, X.; Yuan, Y.; Huang, X.; Umuhoza, J. Disentangling the relative effects of soil moisture and vapor pressure deficit on photosynthesis in dryland Central Asia. Ecol. Indic. 2022, 137, 108698. [Google Scholar] [CrossRef]
  60. Lu, H.; Qin, Z.; Lin, S.; Chen, X.; Chen, B.; He, B.; Wei, J.; Yuan, W. Large influence of atmospheric vapor pressure deficit on ecosystem production efficiency. Nat. Commun. 2022, 13, 1653. [Google Scholar] [CrossRef]
  61. Fu, Z.; Ciais, P.; Makowski, D.; Bastos, A.; Stoy, P.C.; Ibrom, A.; Knohl, A.; Migliavacca, M.; Cuntz, M.; Šigut, L. Uncovering the critical soil moisture thresholds of plant water stress for European ecosystems. Glob. Change Biol. 2022, 28, 2111–2123. [Google Scholar] [CrossRef]
  62. Fu, G.; Zhang, H.R.; Sun, W. Response of plant production to growing/non-growing season asymmetric warming in an alpine meadow of the Northern Tibetan Plateau. Sci. Total Environ. 2019, 650, 2666–2673. [Google Scholar] [CrossRef] [PubMed]
  63. Pastorello, G.; Trotta, C.; Canfora, E.; Chu, H.; Christianson, D.; Cheah, Y.W.; Poindexter, C.; Chen, J.; Elbashandy, A.; Humphrey, M.; et al. The FLUXNET2015 dataset and the ONEFlux processing pipeline for eddy covariance data. Sci. Data 2020, 7, 225. [Google Scholar] [CrossRef] [PubMed]
  64. Reichstein, M.; Falge, E.; Baldocchi, D.; Papale, D.; Aubinet, M.; Berbigier, P.; Bernhofer, C.; Buchmann, N.; Gilmanov, T.; Granier, A.; et al. On the separation of net ecosystem exchange into assimilation and ecosystem respiration: Review and improved algorithm. Glob. Change Biol. 2005, 11, 1424–1439. [Google Scholar] [CrossRef]
  65. Martens, B.; Miralles, D.G.; Lievens, H.; van der Schalie, R.; de Jeu, R.A.M.; Fernández-Prieto, D.; Beck, H.E.; Dorigo, W.A.; Verhoest, N.E.C. GLEAM v3: Satellite-based land evaporation and root-zone soil moisture. Geosci. Model Dev. 2017, 10, 1903–1925. [Google Scholar] [CrossRef] [Green Version]
  66. Miralles, D.G.; Holmes, T.R.H.; De Jeu, R.A.M.; Gash, J.H.; Meesters, A.G.C.A.; Dolman, A.J. Global land-surface evaporation estimated from satellite-based observations. Hydrol. Earth Syst. Sci. 2011, 15, 453–469. [Google Scholar] [CrossRef] [Green Version]
  67. Chen, J.; Jönsson, P.; Tamura, M.; Gu, Z.; Matsushita, B.; Eklundh, L. A simple method for reconstructing a high-quality NDVI time-series data set based on the Savitzky–Golay filter. Remote Sens. Environ. 2004, 91, 332–344. [Google Scholar] [CrossRef]
  68. Xu, X.; Du, H.; Fan, W.; Hu, J.; Mao, F.; Dong, H. Long-term trend in vegetation gross primary production, phenology and their relationships inferred from the FLUXNET data. J. Environ. Manag. 2019, 246, 605–616. [Google Scholar] [CrossRef]
  69. Gonsamo, A.; Chen, J.M.; D’Odorico, P. Deriving land surface phenology indicators from CO2 eddy covariance measurements. Ecol. Indic. 2013, 29, 203–207. [Google Scholar] [CrossRef]
  70. Wu, C.; Peng, D.; Soudani, K.; Siebicke, L.; Gough, C.M.; Arain, M.A.; Bohrer, G.; Lafleur, P.M.; Peichl, M.; Gonsamo, A.; et al. Land surface phenology derived from normalized difference vegetation index (NDVI) at global FLUXNET sites. Agric. For. Meteorol. 2017, 233, 171–182. [Google Scholar] [CrossRef]
Figure 1. Vgreenup in each plant function type (PTF). The number above each PTF is the mean value of Vgreenup, and the number in the parentheses is the standard deviation of Vgreenup for each PTF. Different letters indicate significant difference (p < 0.05) in one-way ANOVA using LSD multiple comparisons among PTFs. DBF, deciduous broadleaf forest; ENF, evergreen needle-leaf forest; MF, mixed forest; GRA, grassland; CRO, cropland; WET, wetland.
Plants 11 02971 g001
Figure 2. The relationships between Vgreenup and geographical factors. (ac) The geographical patterns of Vgreenup across all sites in Europe and North America; (df) the geographical patterns of Vgreenup across all sites in Europe; (gi) the geographical patterns of Vgreenup across all sites in North America.
Plants 11 02971 g002
Figure 3. The spatial relationships between Vgreenup anomalies and Dgreenup anomalies as well as Agreenup anomalies. (a,b) The spatial relationships across all sites in both Europe and North America; (c,d) the spatial relationships across all sites in Europe; (e,f) the spatial relationships across all sites in North America.
Plants 11 02971 g003
Figure 4. The partial correlation coefficients between spring climatic factors and Dgreenup, Agreenup, and Vgreenup. (a) The partial correlation coefficients across all sites in both Europe and North America; (b) the partial correlation coefficients across all sites in Europe; (c) the partial correlation coefficients across all sites in North America. TA, SW, PRE, WS, VPD, and SM represent temperature, shortwave radiation, precipitation, wind speed, vapor pressure deficit, and soil moisture, respectively. *, ** and *** indicate significant correlation at p < 0.05, 0.01 and 0.001 levels, respectively.
Plants 11 02971 g004
Figure 5. The spatial relationships between temperature anomalies and Dgreenup anomalies, Agreenup anomalies, and Vgreenup anomalies. (ac) The spatial relationships across all sites in both Europe and North America; (df) the spatial relationships across all sites in Europe; (gi) the spatial relationships across all sites in North America.
Plants 11 02971 g005
Figure 6. Spatial distribution of eddy covariance flux sites used in this study. DBF, deciduous broadleaf forest; ENF, evergreen needle-leaf forest; MF, mixed forest; GRA, grassland; CRO, cropland; WET, wetland.
Plants 11 02971 g006
Figure 7. Scheme for determination of Dgreenup, Agreenup, and Vgreenup using daily GPP data at IT-Col site (deciduous broadleaf forest) in 2014. GPPmax and GPPmin represent the maximum and minimum smoothed GPP during the growth period, respectively. AGPP represents the seasonal amplitude of GPP, which is the difference between GPPmax and GPPmin.
Plants 11 02971 g007
Table 1. Statistics of Vgreenup for each site used in this study.
Site IGBP Latitude
(°)
Longitude
(°)
Altitude
(m a.s.l.)
Vgreenup
(g C m−2 day−2)
Observation Period Continent
BE-LonCRO50.554.751670.30 ± 0.052005–2014EU
CA-GroMF48.22−82.163400.12 ± 0.032004–2013NA
CA-ManENF55.88−98.482590.09 ± 0.031995–1996, 1998, 2000–2003NA
CA-OasDBF53.63−106.205300.26 ± 0.031997–2010NA
CA-ObsENF53.99−105.126290.08 ± 0.012000–2010NA
CA-QfoENF49.69−74.343820.06 ± 0.012004–2010NA
CA-TP3ENF42.71−80.351840.13 ± 0.022008–2014NA
CA-TP4ENF42.71−80.361840.13 ± 0.042003–2014NA
CH-LaeMF47.488.366890.15 ± 0.032005–2014EU
CZ-wetWET49.0214.774260.19 ± 0.052007–2014EU
DE-GebCRO51.1010.911620.22 ± 0.082001–2014EU
DE-HaiDBF51.0810.454300.23 ± 0.042000–2012EU
DE-KliCRO50.8913.524780.23 ± 0.042005–2007, 2010–2012, 2014EU
DE-LnfDBF51.3310.374510.25 ± 0.032003–2006, 2010–2012EU
DK-SorDBF55.4911.64400.28 ± 0.031997–2013EU
FI-HyyENF61.8524.291810.11 ± 0.021997–2014EU
FI-SodENF67.3626.641800.09 ± 0.022001, 2003–2014EU
FR-FonDBF48.482.781030.23 ± 0.032005–2013EU
IT-BCiCRO40.5214.96200.53 ± 0.072005–2009EU
IT-ColDBF41.8513.5915600.25 ± 0.041998, 2001, 2007–2009, 2011, 2014EU
IT-MboGRA46.0111.0515500.28 ± 0.042003–2013EU
IT-Ro1DBF42.4111.932350.19 ± 0.032001–2006, 2008EU
IT-Ro2DBF42.3911.921600.26 ± 0.032002, 2004–2007, 2010, 2012EU
IT-TorGRA45.847.5821600.17 ± 0.042009–2014EU
RU-FyoENF56.4632.922650.14 ± 0.031999–2009, 2012–2014EU
US-GLEENF41.37−106.2431970.10 ± 0.042006–2014NA
US-Ha1DBF42.54−72.173400.21 ± 0.041992–2001, 2003–2004, 2006–2007, 2009–2012NA
US-IB2GRA41.84−88.242270.22 ± 0.042005–2011NA
US-LosWET46.08−89.984800.17 ± 0.032001–2006, 2014NA
US-MMSDBF39.32−86.412750.25 ± 0.021999–2014NA
US-NR1ENF40.03−105.5530500.11 ± 0.012000–2014NA
US-Ne1CRO41.17−96.483610.54 ± 0.032002–2012NA
US-Ne2CRO41.16−96.473620.47 ± 0.152003–2012NA
US-Ne3CRO41.18−96.443630.38 ± 0.132002–2012NA
US-OhoDBF41.55−83.842300.29 ± 0.022004–2006, 2008–2013NA
US-PfaMF45.95−90.274700.14 ± 0.031997–2004, 2006–2009, 2011–2014NA
US-TwtCRO38.11−121.65-70.26 ± 0.062000–2014NA
US-UMBDBF45.56−84.712340.22 ± 0.042000–2014NA
US-UmdDBF45.56−84.702390.23 ± 0.022008–2014NA
US-WCrDBF45.81−90.085200.24 ± 0.052000–2003, 2005–2006, 2011–2014NA
DBF, deciduous broadleaf forest; ENF, evergreen needle-leaf forest; MF, mixed forest; GRA, grassland; CRO, cropland; WET, wetland; EU, Europe; NA, North America.
Publisher’s Note: MDPI stays neutral with regard to jurisdictional claims in published maps and institutional affiliations.