Article

Irrigation and Crop Load Management Lessen Rain-Induced Cherry Cracking

by
Victor Blanco
1,*,
Pedro J. Blaya-Ros
2,
Roque Torres-Sánchez
3 and
Rafael Domingo
2
1
Department of Horticulture, Washington State University, Pullman, WA 99164, USA
2
Departamento de Ingeniería Agronómica, Universidad Politécnica de Cartagena (UPCT), Paseo Alfonso XIII, 48, E30203 Cartagena, Spain
3
Departamento de Automática, Ingeniería Eléctrica y Tecnología Electrónica, Universidad Politécnica de Cartagena (UPCT), Campus de la Muralla s/n, E30202 Cartagena, Spain
*
Author to whom correspondence should be addressed.
Plants 2022, 11(23), 3249; https://doi.org/10.3390/plants11233249
Submission received: 22 October 2022 / Revised: 12 November 2022 / Accepted: 23 November 2022 / Published: 26 November 2022

Abstract

:
The combined effects of deficit irrigation and crop load level on sweet cherry (Prunus avium L.) physiological and agronomic response were evaluated during the 2019 season in a commercial orchard located in southeastern Spain. Two irrigation treatments were imposed: (i) control treatment (CTL) irrigated above crop water requirements at 110% of crop evapotranspiration (ETC) and (ii) a deficit irrigation treatment (DI) irrigated at 70% ETC. Within each irrigation treatment, crop load was adjusted to three levels: 100% (natural crop load—high), 66% (medium crop load), and 33% (low crop load). The water relations results were more affected by the irrigation strategies applied than by the crop load management. The deficit irrigation strategy applied reduced soil water availability for DI trees, which led to a continuous decrease in their gas exchange and stem water potential. At harvest, the fruit water potential and osmotic potential of cherries from the DI treatment resulted in significantly lower values than those measured in cherries from CTL trees. On the other hand, both the irrigation strategies imposed and the crop load management used impacted fruit quality. Trees with the lowest level of crop load had fruits of greater size, regardless of the irrigation treatment assayed, and in the DI treatment, cherries from the trees with the lowest crop load were darker and more acidic than those from the trees with the highest crop load. Our results emphasize the different effects that rainfall before harvest has on mature cherries. Thus, cracked cherries at harvest represented 27.1% of the total yield of CTL trees while they were 8.3% of the total yield in DI trees. Cherries from CTL trees also showed a greater cracking index than those from DI trees. Moreover, a linear relationship between crop load and fruit cracked at harvest was observed, particularly for the CTL treatment; thus, the lower the crop load, the greater the proportion of cracked cherries.

1. Introduction

Cracking in sweet cherries (Prunus avium L.) has been described as a main physiological problem for all cultivars and a factor limiting the further increase of cherry production in several regions where rain occurs during the harvest period [1]. Moreover, climate change is likely to worsen this situation, as water scarcity will be paired with extreme episodes of heavy storms that are expected to intensify in frequency. This situation may increase the chances of having rain and hailstorms during the weeks prior to harvest and subsequently cause significant economic losses to cherry growers, which threatens commercial production in vulnerable regions. Cracked cherries are not marketable because of their poor quality (which implies short storage and shelf life) and are associated with postharvest diseases (such as decay [2]).
Fruit cracking, although not completely elucidated, is described as a result of increasing turgor pressure, which provokes the bursting of the flesh cells (“Zipper model”). It is caused by water uptake (osmotically) first for the cells of the skin and then for those in the flesh, and it happens during or right after a rainfall episode when the cherries are in the final stage of fruit development. The main route of water uptake appears to be through the fruit surface, through microcracks in the cuticle [3].
The flow of water from the soil to the fruit in cherry trees is influenced by changes in the gradients between roots, stem, leaves, and fruit water potentials, and the environmental conditions such as vapor pressure deficit, as well as the developmental stage of the fruit. A relationship was observed by Measham et al. [4] between the incidence of rainfall and the direction of water flow (sap) to the fruits through the tree. On the other hand, a larger water absorption is thought to occur through the sweet cherry’s fruit surface when the fruit is wet, especially during and after rainfall [5]. However, although related, fruit cracking incidence in an orchard is not exclusively related to the volume of rainfall or to the duration of the rainfall episode [6]. Several factors apart from the quantity and distribution of rainfall during the ripening season [4] have been related to fruit cracking, such as genetically determined susceptibility of species and cultivars [7] and the soil type and soil moisture condition of the orchard [8]. Regarding the last point, there are different approaches; on the one hand, Measham et al. [9] suggest that avoiding water stress at late stages of fruit growth can improve resistance to cracking. On the other hand, Edin et al. [10] reported that low values of soil water content might help to decrease root water uptake and fruit cracking. Other authors highlight a relationship between major changes in soil water content prior to harvest and the development of cuticular fractures in the fruit, which might cause cherry cracking [11]. In other fruit crops, water deficit and irrigation strategies that involve water stress management in different phenological periods (such as regulated deficit irrigation (RDI)) have shown mixed effects on fruit cracking. On the one hand, Galindo et al. [12] and Goodwin et al. [13] reported in pomegranates and apples, respectively, that water stress increases the number of cracked fruits. On the other hand, Yan et al. [14] reported in plums that the cracking incidence was lower when the trees were under deficit irrigation. In cherries, tree management practices with the main purpose of reducing fruit cracking incidence have been widely studied. Thus, the use of physical barriers [15,16] or hydrophobic films [17,18] to reduce fruit wetting in the final stage of ripening or to modify fruit osmotic potential during the occurrence of rain [19] have successfully decreased cracking incidence, although they have also affected fruit quality. However, other management practices such as irrigation management might also play a key role in cracking incidence, particularly when combined with cultivation practices such as thinning, which increases fruit size and the concentration of soluble solids and consequently modifies the fruit’s osmotic and turgor potentials. Thus, this study was conducted to assess the impact of deficit irrigation and crop load management on the tree physiological response, fruit quality, and cracking incidence in sweet cherries.

2. Results

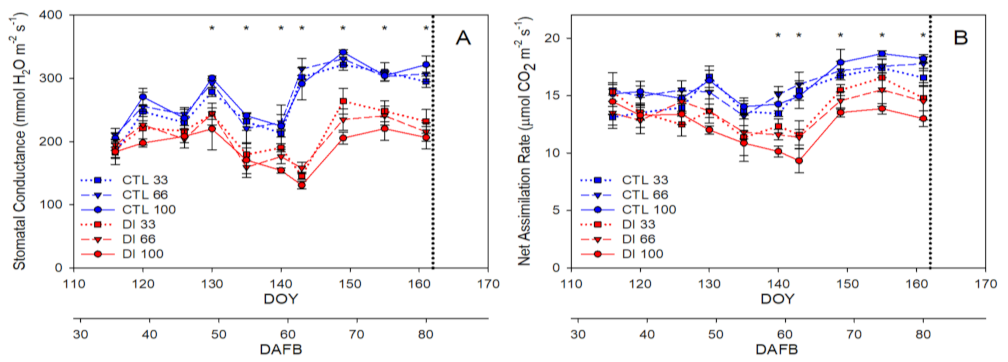
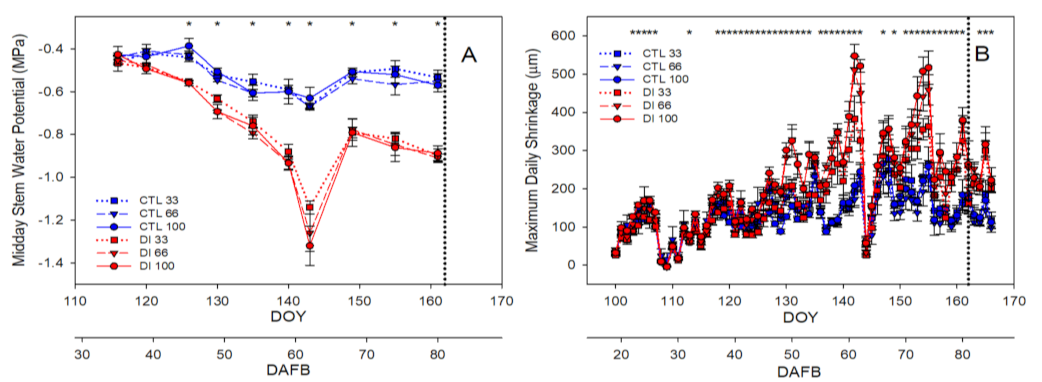
2.1. Soil-Plant-Atmosphere Water Status

Environmental conditions during the experiment varied greatly, with values that increased from air temperature and reference crop evapotranspiration (ET0) close to 10 °C and 2 mm d−1 at the beginning of the experiment to 22 °C and 6.5 mm d−1 at harvest, respectively. The accumulated amount of rainfall during the experiment was 206 mm, with the greatest rain episode in late April (149 mm in 5 days). However, it must be highlighted that two rain episodes happened in the three weeks prior to harvest, mid-May (35 mm) and early June (11 mm), the period when cherries are more likely to crack (Figure 1A). The accumulated ET0 during the experiment (the 2019 preharvest) was 311 mm and the irrigation water applied during the same period was 2031 and 1250 m3 ha−1 for the control (CTL) and deficit irrigated (DI) trees, respectively.
The soil matric potential (Ψm) values clearly identified the irrigation strategies assayed. As expected, the Ψm values for CTL trees were more stable than those for DI trees and higher than −90 kPa at both depths (25 and 50 cm). The soil water availability for DI trees showed a decreasing pattern during the experiment, with minimum values that fell below −400 kPa at 25 cm depth and −300 kPa at 50 cm depth (Figure 1B). Increments in Ψm for the DI treatment were caused by the rain and the environmental variability, which led to mismatches between the tree water requirements calculated according to the previous days’ environmental conditions and the actual water needs of the trees for that period.
Reductions in soil water availability for DI trees resulted in a decrease in gas exchange. So, while during the first stage of fruit growth there were no significant differences between trees from the two irrigation treatments, after the Ψm dropped to values below −200 kPa, significant reductions in the stomatal conductance (gs) and net assimilation rate (Pn) values of DI trees were detected until the end of the experiment. The mean gs and Pn values for the last part of fruit development (stage III) for the CTL trees were similar to 320 mmol m−2 s−1 and 17 µmol m−2 s−1, with the highest values present for the trees with the highest crop load. Meanwhile, for DI trees for the same period of time, the gs and Pn values were 200 mmol m−2 s−1 and 13 µmol m−2 s−1, respectively, with the highest values present for the trees with the lowest crop load (Figure 2).
Midday stem water potential (Ψstem) identified the water deficit applied to the DI trees earlier than gs and Pn, and consistently showed significant differences between the two irrigation treatments imposed from DOY 126 onwards (45 DAFB; Figure 3A). Moreover, a trend in the deficit irrigation treatment was observed, particularly in those measurements below −0.90 MPa, that the trees with the lowest crop load presented higher values of stem water potential (Figure 3A). On the other hand, no clear effect of the crop load on the water status of the CTL trees was found.
The maximum daily shrinkage (MDS) was also affected by the irrigation treatments assayed and at a lower level by crop load, with values twice as high (500 µm) for those trees with a high crop load and that were deficit irrigated than those irrigated as CTL (240 µm; Figure 3B). Both indicators, the Ψstem and the MDS, were able to identify the changes produced by the 30 mm rainfall (144 DOY; 63 DAFB) in the tree water status of the DI trees. Thus, Ψstem values gradually decreased as MDS values increased in DI trees throughout the experiment until the day prior to the rainfall, with Ψstem and MDS values similar to −1.15 MPa and 350 µm for those trees with a low crop load and −1.30 MPa and 500 µm for those with a medium and high crop load. After the rain episode, the MDS values of the DI trees fell below those recorded in the CTL trees for three days, and even one week after the rain, Ψstem mean values for all DI trees were similar to −0.80 MPa (Figure 3).

2.2. Fruit Water Relations

The fruit water potential (Ψfruit) values of both CTL and DI trees were always lower than the stem water potential values measured in the corresponding tree. Moreover, unlike Ψstem, Ψfruit did not distinguish between irrigation treatments until the fruit reached maturity, when the fruit from DI trees had lower values than that from CTL trees, −5.0 and − 4.1 MPa, respectively; no trend regarding crop load was observed in any of the irrigation treatments assayed (Figure 4A). As expected, fruit osmotic potential (Ψπf) was strongly related to Ψfruit with mean values that, at the green, straw and maturity stages, were lower by 29, 12, and 2%, respectively, than those of Ψfruit (Figure 4B). Both Ψfruit and Ψπf only showed significant differences between irrigation treatments at the maturity stage (Figure 4A,B).
The estimated fruit turgor potential (Ψρ) showed a different evolution pattern than Ψπf and Ψfruit. It was the highest at the fruit green stage and, while it was stable at the straw stage for CTL fruits (with values of 0.28 MPa), it decreased to values that were close to 0.20 MPa for fruits from DI treatment; moreover, in the DI treatment, it was noted that the fruit from the trees with the highest crop load was that with the lowest values of Ψρ (Figure 4C). These differences continued and increased at the fruit maturity stage when a trend related to the crop load was found for the Ψρ values of DI fruits. Thus, when the Ψρ for the fruit of the CTL and DI treatments was compared, we found that for the fruit from trees with low, medium, and high crop load, Ψρ of the fruit from CTL trees was twice, seven, and twelve times higher, respectively, than that of the fruit from DI trees. It must be highlighted that, although the mean value of the estimated Ψρ of all treatments, irrigation, and crop load resulted in values above zero at the maturity stage, the estimated Ψρ in some fruits from trees with high and medium crop load and deficit irrigation was negative as a consequence of the water deficit and the crop load.
At fruit maturity, the osmotic potential of the skin of the fruit (Ψπs) was measured and compared with that of the flesh. A similar trend was detected with significant differences between irrigation treatments but with higher values than those reported by Ψπf (Figure 4). The skin of the cherries from the CTL trees had values of osmotic potential (Ψπs = −1.6 MPa) that were 38% of that reported by the flesh (Ψπf = −4.1 MPa), while the DI cherries had values of Ψπs (−2.8 MPa) that were 56% of that reported by the Ψπf (−5.0 MPa). When the gradients of the osmotic potential between skin and flesh were compared, no differences were detected, neither between irrigation treatments nor between crop loads, with values that ranged between 2.1 and 2.6 MPa. However, it was observed that the differences between the skin and flesh osmotic potentials showed a trend toward greater values in cherries from CTL compared to DI (Figure 4D).

2.3. Fruit Yield and Quality

The average trunk cross-sectional area (TCSA) of the trees considered in this study ranged from 289 to 336 cm2, without significant differences among the different crop levels. Tree crop load was adjusted to three levels (low, medium, and high), which corresponded to 2.4, 5.7, and 8.2 fruit cm−2 TCSA, respectively (the mean values of both irrigation treatments, Table 1). The fruit yield and the average number of fruits produced per tree increased along with the crop load, with mean values relevant to each crop level of 8.5, 19.1, and 26.4 kg tree−1 and 640, 1548, and 2148 cherries per tree, respectively (the mean values of both irrigation treatments, Table 1). The occurrence of double fruit, which was below 1.5% in all the treatments, was not influenced by the crop load. In the same vein, the proportion of cracked fruit at harvest and the cracking index were not significantly influenced by the crop load. However, in the CTL treatment, trees with low crop loads had a higher proportion of cracked fruit than trees with the natural crop load.
When the fruit yield between both irrigation treatments was compared, considering all the crop levels, there were no significant differences between both irrigation strategies regarding fruit yield, which was similar to 18 kg tree−1. However, significant differences emerged between irrigation treatments when the proportion of cracked fruit was compared. CTL trees had three times more cracked fruit (27.1%) than DI trees (8.3%). In a lower proportion, this trend was also observed in the determination of the cracking index carried out in the lab. As expected, the water productivity of those trees irrigated with the DI strategy was significantly higher than that of those irrigated with the CTL strategy (Table 1).
Regarding fruit quality, it was noticed that the unitary size was the most sensitive quality parameter to crop load adjustment. In both irrigation treatments, fruit equatorial diameter increased with decreasing crop load. Moreover, crop load had a different effect on fruit depending on the irrigation strategy. Thus, the quality of the fruit produced by those trees irrigated as CTL did not significantly differ among crop load levels (except for the equatorial diameter, which resulted in the lowest value for the cherries from the trees with the highest crop load). On the other hand, fruit quality was more affected by the crop load in the DI treatment. DI cherries with the lowest crop load had a similar size as those from the CTL treatment (31 mm of diameter and 13 g of unitary mass) and were darker and more acidic than those from the highest crop load within the same irrigation treatment (Table 2).
There were no significant differences in fruit fresh mass between the medium and high crop load levels, but it was significantly increased by 11% in the level with the lowest crop load (11.8 g vs. 13.1 g, respectively). The irrigation treatments assayed had a greater impact on the fruit quality than did the crop load (Figure 5). Thus, when the PCA was performed on the fruit quality parameters measured, the data could be classified by the irrigation treatment imposed easier than by the crop load. The PCA explained 80% of the variability of the data. Fruit quality parameters such as fruit unitary mass and equatorial diameter were located on the side of the CTL treatment and the lowest crop load level, while soluble solids concentration (SSC) was on the DI side, indicating that fruit from CTL trees had a greater size than those cherries from DI trees, which were sweeter.

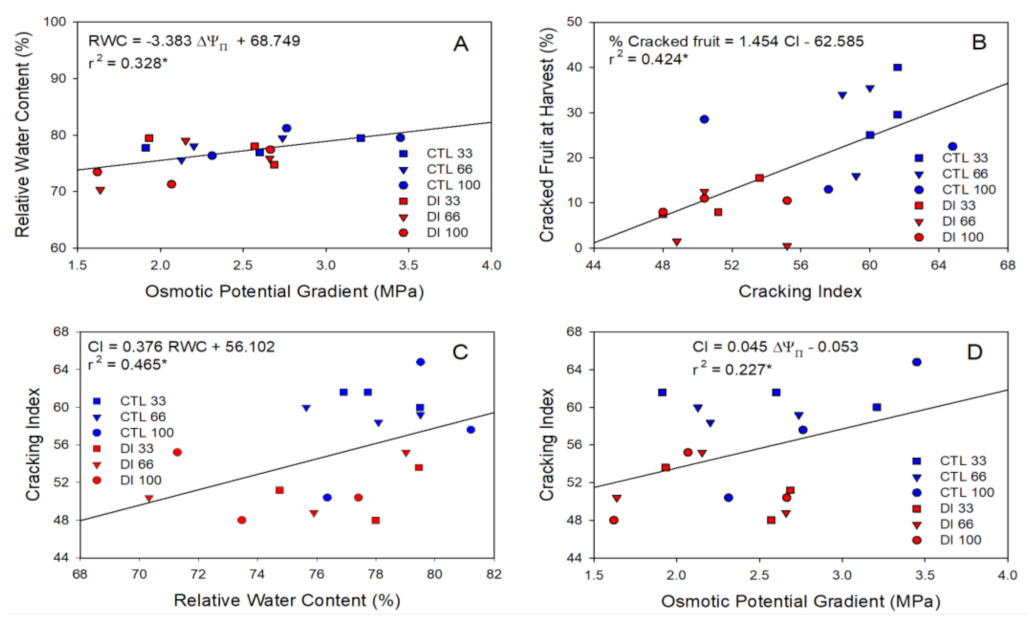
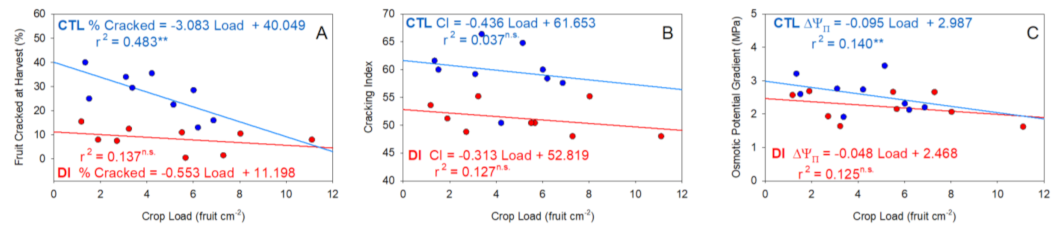
2.4. Cracking Susceptibility

The relationship between the cracked fruit and the different physiological and quality values measured was calculated. The proportion of cracked cherries was positively related to the unitary mass of the cherry but negatively related to the titratable acidity (TA) (Figure 6). When the proportion of cracked cherries at harvest was compared with the relative water content and the osmotic water potential gradient, no relationships were found.
On the other hand, the cracking index was significantly related to both parameters, particularly the relative water content (R2 = 0.47). When the proportion of cracked fruit at harvest per block and the cracking index measured in the laboratory were compared, a significant and positive relationship was obtained. Thus, those blocks with more than 25% cracked fruit at harvest had a cracking index value higher than 60 (Figure 7).
Within each irrigation treatment, a negative linear relationship was found between crop load and both the proportion of cracked fruits at harvest and the cracking index (Figure 8). Trees with lower crop loads showed higher levels of cracking, which highlights the influence of the crop load on the trend of the fruits to crack. The trend toward a higher proportion of cracked cherries at harvest for those trees with a light crop load (<four fruit cm−2 TCSA) was stronger for CTL trees compared with DI trees. When both linear regression lines were compared, the linear regression line of CTL trees had an intercept and slope four and six times higher, respectively, than those of DI trees.

3. Discussion

The plant water status indicators considered in this study clearly identified the two irrigation strategies assayed. Among them, MDS was the indicator that first detected early water stress, followed closely by Ψstem and distantly by gs and Pn. However, when both MDS and Ψstem were compared, it was observed that MDS was more affected by the different environmental conditions (particularly by the rainfall) than Ψstem. The relationships between soil and plant water status indicators in sweet cherry trees were widely studied and reported in Blanco et al. [20]. In relation to the crop load, the tree water status was more affected by the crop load level in those trees under deficit irrigation than in those irrigated to fulfill their water requirements. Likewise, Conejero et al. [21] reported in well-watered peach trees that different crop loads did not affect tree water status. In our experiment, the plant water status indicators identified that those trees with the highest crop load were under stronger water deficit conditions than those with a low crop load. Similarly, Intrigliolo and Castel [22] reported that the MDS was more affected by the crop load in the deficit irrigation treatment than in the control treatment.
Regarding the fruit water indicators, Ψfruit was not as sensitive as Ψstem and could not distinguish between irrigation treatments until harvest. In a previous experiment on sweet cherry trees [23], Ψfruit did not show significant differences between CTL trees, trees irrigated at 110% ETC, and trees under a slight water deficit (90% ETC). However, in this study, as the water deficit applied to the DI trees was more severe (70% ETC), Ψfruit exhibited significant differences between irrigation treatments at harvest. Ψfruit has been described as a reliable tree water status indicator for fruit trees such as pomegranate [12] and medium–late maturing peach [24]. For sweet cherry trees, as fruit development lasts for a shorter period of time, Ψfruit can only be considered a reliable water stress indicator if the deficit irrigation is moderate or severe and is applied during the last part of stage III of fruit growth. The effect of crop load on Ψfruit in peach trees was discussed by McFadyen et al. [25], who reported significant differences in the Ψfruit of fruits from trees with different levels of crop load, with more negative values in those trees with a high crop load level. In our study, Ψfruit was not significantly affected by the different levels of crop load assayed, neither in fruits from CTL trees nor in fruits from DI trees, despite the differences in fruit mass and SSC. However, a trend was detected in the DI treatment with the lowest values of Ψfruit in the cherries from the trees with the lowest level of crop load. We hypothesized that this trend to low values would be caused by the combination of the effect of the lowest level of crop load and the deficit irrigation. Mpelasoka et al. [26] reported that ‘Braeburn’ apples from trees under deficit irrigation ripened earlier than those from trees that were irrigated to satisfy their water requirements. Furthermore, for the same apple cultivar, Kelner et al. [27] reported that a low level of crop load hastened fruit maturity. In that sense, the water stress applied to DI trees promoted a slightly faster development of the cherries by increasing the soluble solids concentration, decreasing the Ψπf, and finally decreasing Ψfruit, which was more noticeable in the fruit from the low level of crop load. As expected, Ψπf was strongly related to Ψfruit, with values slightly more negative than those reported by Moing et al. [28] in the sweet cherry cracking resistant cultivar ‘Fermina’ but following the same trend, with values that decrease as the fruit develops and the SSC increases. Winkler et al. [29] reported that, in sweet cherries, the content of the soluble sugars (glucose, fructose, and sorbitol) determines Ψπf, as it represents 86% of the total osmolarity, while the organic acids and the minerals represent 7% each. Regarding the estimated turgor potential (Ψρ), cherries from the DI treatment had lower Ψρ values than those from the CTL treatment from the straw stage to maturity. Significant lower Ψρ values during stage III of fruit development indicated that the lower fruit size of DI fruit was more related to the effect of water deficit on the cell enlargement stage than on the first stage of cell division, as cell enlargement requires turgor to allow fruit growth [30]. The sharp fall in Ψρ values for the mature DI cherries from trees with medium and high crop load levels showed a fruit turgor loss, which emphasized the inability of sweet cherry trees to cope with or tolerate water stress. This is in line with the slow response of the gs, as it took more than a month since the water deficit was applied to induce a significant stomata closure in order to reduce water losses and postpone water deficit effects. These results agree with Blaya-Ros et al. [31], who described the extreme anisohydric behavior of cherry trees. When the osmotic potential of the flesh and the skin were compared, the values measured in the flesh were more negative than those measured in the skin. For both osmotic potentials, DI fruits had significantly lower values than CTL fruits. Grimm and Knoche [32] reported that the Ψπ of the flesh in sweet cherries is markedly more negative than that of the skin. Moreover, the same authors stated that the more negative the osmotic potential in the flesh, the more extensible and less likely to crack the skin will be, as a result of dehydration of the skin caused by the flesh. Consequently, large osmotic potential gradients between the skin and the flesh might cause the skin to not act as a buffer to allow the water uptake into the flesh and can trigger fruit microcracks. In this sense, the fruit from CTL trees did not result in significant differences compared to the fruit from DI trees; however, a trend toward a larger skin–flesh osmotic potential gradient was noticed in CTL fruits, which might be related to the greater cracking incidence measured in the CTL treatment at harvest. These results are in line with those reported by Correia et al. [33], who stated that irrigation techniques and strategies that decrease root water uptake have a positive impact on decreasing cracking incidence.
Cracking incidence was positively related to the fruit mass and negatively related to SSC and TA (principal components of the Ψπf, [29]). Furthermore, a negative relationship between the cracked fruit and the crop load was obtained, which implies that the fruit from both irrigation treatments with the lowest level of crop load was the most susceptible to cracking. Measham et al. [34] reported a negative relationship between the cracking incidence and the crop load in the ‘Simone’ sweet cherry; however, the relationship widely varied over multiple years. The cracking index measured in the lab was significantly related to the results of cracked fruit at harvest. Both measures clearly identify that cherries from the CTL treatment were more prompt to crack than those from the DI treatment. Another complementary mechanism that should be taken into consideration to explain the significantly lower susceptibility to crack of fruit from trees under water deficit is the modification of the cuticular wax. Several authors have highlighted that fruits from plants under drought stress increase cuticle wax load as a mechanism to reduce transpiration rates [35,36]. The larger amount of wax reported in fruits from deficit irrigated trees compared to that naturally present in those fruits from trees under no water restrictions might have played a role as a thick physical barrier that protects the fruit by keeping the rainwater from directly contacting the skin of the fruit.
As with cracking, fruit quality was also affected by both water deficit and crop load. The fruit characteristics of both CTL and DI trees at harvest were consistent with those values reported as optimal for ‘Prime Giant’ sweet cherries, with unitary mass values higher than 10 g, a mahogany color, and more than 17% SSC [37]. Similar results, increments of the unitary mass, and the SSC values of the cherries from trees with low crop load have been previously reported in the sweet cherry [38,39]. On the other hand, a decrease in the fruit unitary mass has been reported in sweet cherries as a result of a high fruit yield or a low leaf-to-fruit ratio [40,41]. The combination of a low or medium crop load and deficit irrigation did not negatively affect fruit size, color, SSC, or TA, and furthermore, it was not as affected by cracking at harvest as CTL fruit was. Thus, both combinations stand out as good options for growers facing water scarcity while producing high-quality fruit.

4. Materials and Methods

4.1. Experimental Site, Plant Material and Treatments

The study was conducted in a 0.5 ha commercial orchard located in Jumilla (Murcia, Spain, 38°8’ N; 1°22’ W) during the 2019 growing season. The climate is typically Mediterranean, with low rainfall distributed in autumn and spring, hot dry summers, and mild winters. The average annual reference evapotranspiration (ET0) for the period from 2015 to 2018 was 1219 mm, and the average annual rainfall was 313 mm. The soil has a sandy loam texture and is moderately stony, with 0.32 meq 100 g−1 potassium, 108.67 mg kg−1 available phosphorus, and 2.7% active limestone. The irrigation water had 0.8 dS m−1 of electrical conductivity.
The plant material consisted of nineteen-year-old ‘Prime Giant’ sweet cherry trees grafted on ‘SL64′ rootstock, and ‘Early Lory’ and ‘Brooks’ used as pollinizers, spaced at 5 m × 3 m. Trees were drip-irrigated using a single drip line for each tree row, with three pressure-compensated emitters per tree, each with a discharge rate of 4 L h−1.
The different irrigation treatments were initiated each season before flowering and suspended at the end of November. Full bloom was on 22 March (day of year (DOY) 81) and fruit was harvested on 11 June (DOY 162: 81 days after full bloom (DAFB)). The horticultural practices used (e.g., fertilization, weed control, and pruning) were the same for the trees of all treatments. Fertilization was applied through the irrigation system with the water and was the same in all treatments regardless of the amount of water applied. The fertilization program consisted of 63 kg ha−1 of N, 30 kg ha−1 of P2O5, 107 kg ha−1 of K2O, and 8 kg ha−1 of CaO.
Two irrigation treatments were applied: a control (CTL) irrigated at 110% of crop evapotranspiration (ETC) to maintain non-limiting soil water conditions and a deficit irrigation treatment (DI) irrigated at 70% of ETC. Within each irrigation treatment, three crop loads were adjusted at bloom (high—100% natural crop load; medium—66%; low—33%).
Crop water requirements under drip irrigation were calculated using the following equation: ETC = ET0 × Kc × Kr. The reference evapotranspiration (ET0) was calculated using the FAO-Penman–Monteith equation [42], where Kc is a crop coefficient for sweet cherry reported by Marsal [43] and Kr is a localization factor [44] related to the percentage of ground covered by the crop.
The experimental design was completely randomized in a 2 × 3 factorial scheme (irrigation × crop load level) with three replicates per treatment (three trees per treatment).

4.2. Soil, Tree, and Fruit Water Status Measurements

The plant water status was measured weekly by measuring midday stem water potential (Ψstem) at solar noon following the methodology proposed by McCutchan and Shackel [45] with a Scholander pressure chamber (Model 3000, Soil Moisture Equipment, CA, USA) in healthy and mature leaves located close to the trunk, two leaves per tree, six leaves per treatment. The fruit water potential (Ψfruit) was measured at three fruit stages (green, straw, and maturity) on cut slices of the pitless fruits, six fruit per treatment, using a WP4C Dewpoint Potentiometer (Decagon Devices, Inc., Pullman, WA, USA) following the procedure of Léchaudel [46]. Fruit osmotic potential, flesh, and skin, (Ψᴫf) were measured in the same picked fruit used to measure Ψfruit using a vapor pressure osmometer (Wescor Vapro 5600, Logan, UT, USA) for the same three stages for the flesh (but measuring only the maturity stage for the skin). The estimated fruit turgor potential (Ψρ) was estimated as the difference between osmotic and fruit water potential according to Milad and Shackel [47].
The stomatal conductance (gs) and net assimilation rate (Pn) were measured at solar midday every 7 days using a portable photosynthesis system CIRAS-2 (PP System, Amesbury, MA, USA) with a PLC6(U) cuvette at a photosynthetic photon flux density (PPFD) ≈ 1500 μmol m−2 s−1; leaf temperature was held at 25 °C and CO2 reference concentration at 380 μmol mol−1 on two sun-exposed leaves per tree, six leaves per treatment, on the same three trees per treatment that were used for the Ψstem measurement.
Branch diameter fluctuations were recorded using three dendrometers (LVDT sensors, model DF ± 2.5 mm, accuracy ± 10 μm, Solartron Metrology, Bognor Regis, UK) per treatment, each on a main tree branch away from direct sunlight. The sensors were installed on aluminum and invar holders to prevent thermal expansion. The maximum daily branch shrinkage (MDS) was calculated as the daily difference between the maximum and the minimum branch diameter. The soil matric potential (Ψm) was measured by means of two thermal compensation capacitive sensors per replicate (MPS-6, Decagon Devices, Inc., Pullman, WA, USA) at 0.25 and 0.50 m depth and at a distance of 0.23 m from the emitter and 1.5 m from the trunk, under the canopy projection. Continuous measurements of branch diameter fluctuations and matric potential were recorded every 30 s, and the datalogger was programmed to report the means every 10 min (Campbell Scientific, Logan, UT, USA). Daily agrometeorological data were recorded by a weather station near the experimental orchard owned by the Spanish Agroclimatic Information Service (SIAR; http://crea.uclm.es/siar/datmeteo/, accessed on 7 August 2019).

4.3. Fruit Yield and Quality

At harvest, all the fruit produced per tree were harvested from the three trees considered per treatment and weighed in order to obtain fruit yield. To estimate fruit load, the weight of 100 fruits per tree was registered on 18 trees, 9 trees per irrigation treatment (CTL and DI), and 6 trees per crop load (high, medium, and low), to determine fruit unitary weight; consequently, fruit load (number of fruits per tree) was calculated from the yield (kg tree−1) and fruit unitary weight (g) measured in the field. Similarly, the fruit efficiency (FE) was calculated as the number of fruits per cm2 of the trunk cross sectional area (TCSA), and the water productivity (WP) was calculated as the kilograms of fruit produced by each tree per m3 of water applied. In order to evaluate the thinning and irrigation effects on fruit quality at harvest, 40 representative sweet cherries were picked per replicate (tree), 120 fruits per treatment. Of those, 20 fruits were used for the quality determinations and the other 20 were used to assess the cracking incidence. The quality parameters studied were equatorial diameter, fresh and dry weight, fruit color, soluble solids concentration, and titratable acidity. The equatorial diameter (mm) was measured with a digital caliper (model 17-262, Acha, Eibar, Spain). Fresh unitary mass (g) was estimated as the average of the unitary mass of 10 fruits from the same replicate weighed on an electronic balance (model AX623, Sartorius, Gottingen, Germany). Dry mass (g) was measured from the same fruits, which were dried at 60 °C until they were at a constant weight in a ventilated oven (model Digitheat, JP Selecta, Barcelona, Spain). Relative water content (RWC, %) was calculated by subtracting the dry weight from the fresh weight and referring it to the fresh weight. Fruit color was recorded using a colorimeter (CR-400, Minolta, Tokyo, Japan). Lightness and hue angle (hue°) were obtained from the L*, a*, and b* values of the CIE Lab scale system used. The soluble solids concentration (SSC, %) was determined with a digital hand−held refractometer (model N1, Atago, Tokyo, Japan) at 20 °C from the juice of the remaining 10 fruits per replicate, obtained with a hand press squeezer. Titratable acidity (TA, %) was measured with a titration (model 716 DMS Titrino, Metrohm, Herisau, Switzerland) and calculated from the volume of NaOH (0.1 M) needed to reach a pH of 8.1.
With the aim of assessing whether the interaction between irrigation and crop load management can affect fruit susceptibility to crack, the cracking index was measured in 20 fruits per replicate and 3 replicates following the procedure described by Christensen [48]. Cherries were immersed in 2 L distilled water (pH 7) at 20 °C, and crack presence on the fruit was evaluated after 2, 4, and 6 h. At each instance, cracked cherries were removed and recorded. The cracking index was calculated as:
Cracking index = 100 × [5a + 3b + c] × (5N)−1
In this Equation (1), a, b, and c represent the number of cracked fruits at 2, 4, and 6 h of immersion, respectively, and N is the total number of fruits measured (N = 20).

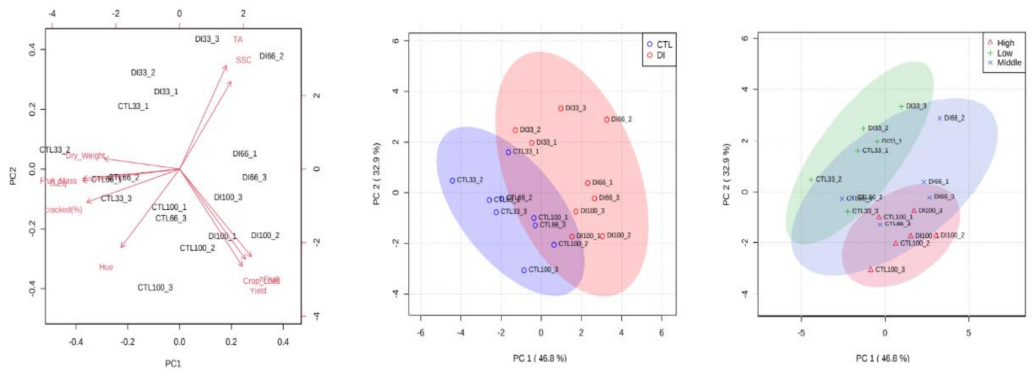
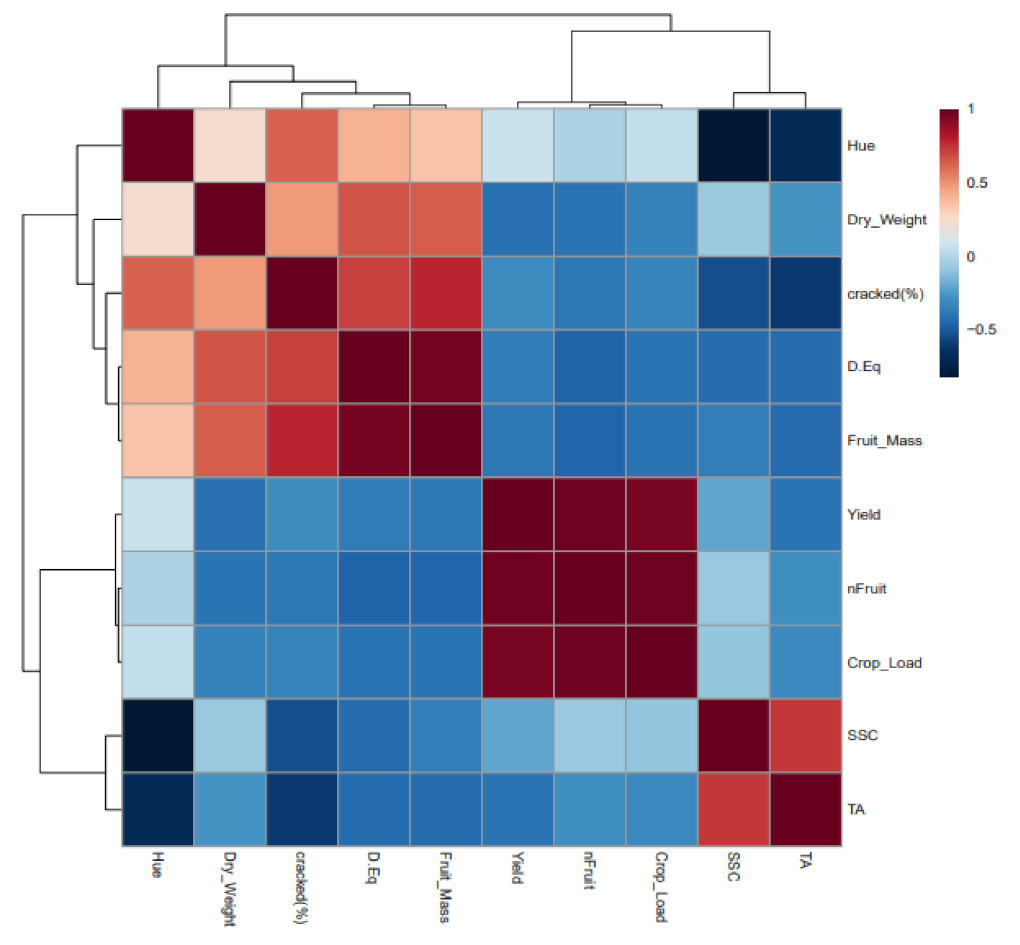
4.4. Statistical Analysis

At harvest, analysis of variance (ANOVA) and multivariate analysis of variance (MANOVA) were carried out to determine significant (p = 0.05) differences between the treatments. The degree of agreement between the independent variables (crop load) and the dependent variables (fruit cracked at harvest, cracking index, osmotic potential) was assessed using regression analysis. Statistical analyses were carried out using IBM SPSS Statistics v24 (Armonk, NY, USA). Principal component analysis (PCA) was carried out in RStudio package (RStudio Inc., Boston, MA, USA).

5. Conclusions

This study suggests that irrigation and crop load management affect sweet cherry tree and fruit water relations, fruit quality, and susceptibility to rain-induced fruit cracking. The cherries from trees submitted to deficit irrigation resulted in higher soluble solids concentration, lower fruit and osmotic potential of the flesh and skin at harvest, lower turgor potential, and lower unitary mass. On the other hand, the combination of high fruit turgor potential and a large gradient between the skin and flesh osmotic potentials in cherries from the CTL treatment resulted in a higher incidence of rain-induced cracking at harvest. The crop load also influenced the cracking incidence as well as the fruit quality. Thus, cherries from trees with low crop loads resulted in large size and high turgor potential and were more prompt to crack than those from trees with medium and high crop loads.

Author Contributions

Conceptualization, V.B., P.J.B.-R., R.T.-S. and R.D.; methodology, V.B., P.J.B.-R., R.T.-S. and R.D.; validation, V.B., P.J.B.-R., R.T.-S. and R.D.; formal analysis, V.B., P.J.B.-R.; investigation, V.B., P.J.B.-R., R.T.-S. and R.D.; data curation, V.B. and P.J.B.-R.; writing—original draft preparation, V.B. and P.J.B.-R.; writing—review and editing, R.D. and R.T.-S.; supervision, R.D.; project administration, R.D. and R.T.-S.; funding acquisition, R.D. and R.T.-S. All authors have read and agreed to the published version of the manuscript.

Funding

This research was funded by the Spanish Economy and Competitiveness Ministry (MINECO) and the European Agricultural Funds for Rural Development. References: AGL2013-49047-C2-1-R, AGL2016-77282-C33-R and PID2019-106226RB-C22/AEI/10.13039/501100011033. Pedro José Blaya-Ros acknowledges the research initiation grant received from the Universidad Politécnica de Cartagena (UPCT). Victor Blanco acknowledges the financial support received for postdoctoral training (Postdoctoral Fellowship 21261/PD/19) from the Fundación Séneca, Comuni-dad Autónoma de la Región de Murcia (Spain).

Institutional Review Board Statement

Not applicable.

Informed Consent Statement

Not applicable.

Acknowledgments

The authors are grateful to Pedro and Agustín Carrión-Guardiola, “Finca Toli” farm owners, for letting them use their facilities to carry out the tests.

Conflicts of Interest

The authors declare no conflict of interest.

References

  1. Michailidis, M.; Karagiannis, E.; Tanou, G.; Sarrou, E.; Karamanoli, K.; Lazaridou, A.; Martens, S.; Molassiotis, A. Sweet Cherry Fruit Cracking: Follow-up Testing Methods and Cultivar-Metabolic Screening. Plant Methods 2020, 16, 51. [Google Scholar] [CrossRef] [PubMed] [Green Version]
  2. Vangdal, E.; Hovland, K.L.; Børve, J.; Sekse, L.; Slimestad, R. Foliar Application of Calcium Reduces Postharvest Decay in Sweet Cherry Fruit by Various Mechanisms. Acta Hortic. 2008, 768, 143–148. [Google Scholar] [CrossRef]
  3. Knoche, M.; Peschel, S.; Hinz, M.; Bukovac, M.J. Studies on Water Transport through the Sweet Cherry Fruit Surface: Characterizing Conductance of the Cuticular Membrane Using Pericarp Segments. Planta 2000, 212, 127–135. [Google Scholar] [CrossRef] [PubMed]
  4. Measham, P.F.; Wilson, S.J.; Gracie, A.J.; Bound, S.A. Tree Water Relations: Flow and Fruit. Agric. Water Manag. 2014, 137, 59–67. [Google Scholar] [CrossRef]
  5. Peschel, S.; Beyer, M.; Knoche, M. Surface Characteristics of Sweet Cherry Fruit: Stomata-Number, Distribution, Functionality and Surface Wetting. Sci. Hortic. 2003, 97, 265–278. [Google Scholar] [CrossRef]
  6. Measham, P.; Bound, S.; Gracie, A.; Wilson, S. Incidence and Type of Cracking in Sweet Cherry (Prunus avium L.) Are Affected by Genotype and Season. Crop Pasture Sci. 2009, 60, 1002–1008. [Google Scholar] [CrossRef]
  7. Quero-García, J.; Letourmy, P.; Campoy, J.A.; Branchereau, C.; Malchev, S.; Barreneche, T.; Dirlewanger, E. Multi-Year Analyses on Three Populations Reveal the First Stable QTLs for Tolerance to Rain-Induced Fruit Cracking in Sweet Cherry (Prunus avium L.). Hortic. Res. 2021, 8, 136. [Google Scholar] [CrossRef]
  8. Wermund, U.; Holland, A.; Reardon, S. Cracking Susceptibility of Sweet Cherries in the United Kingdom in Relation to Calcium Application and Cover Systems. Acta Hortic. 2005, 667, 475–482. [Google Scholar] [CrossRef]
  9. Measham, P.F.; Bound, S.A.; Gracie, A.J.; Wilson, S.J. Crop Load Manipulation and Fruit Cracking in Sweet Cherry (Prunus avium L.). Adv. Hortic. Sci. 2012, 26, 25–31. [Google Scholar] [CrossRef]
  10. Edin, M.; Lichou, J.; Saunier, R.; Garcin, A. Cerise, les Variétés et Leur Conduite; CTIFL, Ed.; CTIFL: Paris, France, 1997; ISBN 978-2-87911-084-4. [Google Scholar]
  11. Sekse, L. Fruit Cracking Mechanisms in Sweet Cherries (Prunus avium L.)—A Review. Acta Hortic. 1998, 468, 637–648. [Google Scholar] [CrossRef]
  12. Galindo, A.; Rodríguez, P.; Collado-González, J.; Cruz, Z.N.; Torrecillas, E.; Ondoño, S.; Corell, M.; Moriana, A.; Torrecillas, A. Rainfall Intensifies Fruit Peel Cracking in Water Stressed Pomegranate Trees. Agric. For. Meteorol. 2014, 194, 29–35. [Google Scholar] [CrossRef]
  13. Goodwin, I.; McClymont, L.; Green, S. The Effects of Water Deficits on Fruit Cracking and Sunburn Damage in ‘Cripps Pink’ Apple. Acta Hortic. 2022, 1335, 421–428. [Google Scholar] [CrossRef]
  14. Yan, G.; Youting, Y.; Ling, L.; Xin, Z.; Yuhui, B.; Huiqiong, M.; Lixinyi, W.; Bo, X. Study on the Effect Difference of Two Kinds of Control Techniques on Cracking Fruit of Qingcui Plum. IOP Conf. Ser. Earth Environ. Sci. 2021, 792, 012042. [Google Scholar] [CrossRef]
  15. Lang, G.A.; Sage, L.; Wilkinson, T. Ten Years of Studies on Systems to Modify Sweet Cherry Production Environments: Retractable Roofs, High Tunnels, and Rain-Shelters. Acta Hortic. 2016, 1130, 83–90. [Google Scholar] [CrossRef]
  16. Blanco, V.; Zoffoli, J.P.; Ayala, M. Influence of High Tunnel Microclimate on Fruit Quality and Calcium Concentration in ‘Santina’ Sweet Cherries in a Mediterranean Climate. Agronomy 2021, 11, 1186. [Google Scholar] [CrossRef]
  17. Balbontín, C.; Ayala, H.; Bastías, M.R.; Tapia, G.; Ellena, M.; Torres, C.; Yuri, J.A.; Quero-García, J.; Ríos, J.C.; Silva, H. Cracking in Sweet Cherries: A Comprehensive Review from a Physiological, Molecular, and Genomic Perspective. Chil. J. Agric. Res. 2013, 73, 66–72. [Google Scholar] [CrossRef] [Green Version]
  18. Yang, S.; Zhang, S.; Qu, Z.; Xiu, T.; Hu, Y.; Chen, C.; Lv, N. Reducing Cherry Rain-Cracking: Development and Characterization of Cold-Water Fish Gelatin Films Reinforced by Dual Rod-Spherical Nanoscale Structures Formed under Magnetic Fields. Food Hydrocoll. 2022, 128, 107579. [Google Scholar] [CrossRef]
  19. Heacox, L. Curb Cherry Cracking. Fruit Grow. 2001, 121, 16. [Google Scholar]
  20. Blanco, V.; Domingo, R.; Pérez-Pastor, A.; Blaya-Ros, P.J.; Torres-Sánchez, R. Soil and Plant Water Indicators for Deficit Irrigation Management of Field-Grown Sweet Cherry Trees. Agric. Water Manag. 2018, 208, 83–94. [Google Scholar] [CrossRef]
  21. Conejero, W.; Ortuño, M.F.; Mellisho, C.D.; Torrecillas, A. Influence of Crop Load on Maximum Daily Trunk Shrinkage Reference Equations for Irrigation Scheduling of Early Maturing Peach Trees. Agric. Water Manag. 2010, 97, 333–338. [Google Scholar] [CrossRef]
  22. Intrigliolo, D.S.; Castel, J.R. Crop Load Affects Maximum Daily Trunk Shrinkage of Plum Trees. Tree Physiol. 2007, 27, 89–96. [Google Scholar] [CrossRef] [PubMed]
  23. Blanco, V.; Martínez-Hernández, G.B.; Artés-Hernández, F.; Blaya-Ros, P.J.; Torres-Sánchez, R.; Domingo, R. Water Relations and Quality Changes throughout Fruit Development and Shelf Life of Sweet Cherry Grown under Regulated Deficit Irrigation. Agric. Water Manag. 2019, 217, 243–254. [Google Scholar] [CrossRef]
  24. Gelly, M.; Marsal, J.; Mata, M.; Arbonès, A.; Rufat, J.; Girona, J. Fruit Water Potential: A Comparison Study to Other Water Potential Parameters. Acta Hortic. 2004, 646, 35–40. [Google Scholar] [CrossRef]
  25. McFadyen, L.M.; Hutton, R.J.; Barlow, E.W.R. Effects of Crop Load on Fruit Water Relations and Fruit Growth in Peach. J. Hortic. Sci. 1996, 71, 469–480. [Google Scholar] [CrossRef]
  26. Mpelasoka, B.S.; Behboudian, M.H.; Dixon, J.; Neal, S.M.; Caspari, H.W. Improvement of Fruit Quality and Storage Potential of ‘Braeburn’ Apple through Deficit Irrigation. J. Hortic. Sci. Biotechnol. 2000, 75, 615–621. [Google Scholar] [CrossRef]
  27. Kelner, J.-J.; Regnard, J.-L.; Lauri, P.-É. Crop Load and Rootstock Effects on Maturation Rate and Harvest Quality of cv. Braeburn Apples. Fruits 2000, 55, 73–81. [Google Scholar]
  28. Moing, A.; Renaud, C.; Christmann, H.; Fouilhaux, L.; Tauzin, Y.; Zanetto, A.; Gaudillère, M.; Laigret, F.; Claverie, J. Is There a Relation between Changes in Osmolarity of Cherry Fruit Flesh or Skin and Fruit Cracking Susceptibility? J. Am. Soc. Hortic. Sci. 2004, 129, 635–641. [Google Scholar] [CrossRef] [Green Version]
  29. Winkler, A.; Riedel, D.; Neuwald, D.A.; Knoche, M. Water Influx through the Wetted Surface of a Sweet Cherry Fruit: Evidence for an Associated Solute Efflux. Plants 2020, 9, 440. [Google Scholar] [CrossRef] [Green Version]
  30. Matthews, M.A.; Shackel, K.A. Growth and Water Transport in Fleshy Fruit. In Vascular Transport in Plants; Elsevier: Amsterdam, The Netherlands, 2005; pp. 181–197. ISBN 978-0-12-088457-5. [Google Scholar]
  31. Blaya-Ros, P.J.; Blanco, V.; Torres-Sánchez, R.; Domingo, R. Drought-Adaptive Mechanisms of Young Sweet Cherry Trees in Response to Withholding and Resuming Irrigation Cycles. Agronomy 2021, 11, 1812. [Google Scholar] [CrossRef]
  32. Grimm, E.; Knoche, M. Sweet Cherry Skin Has a Less Negative Osmotic Potential than the Flesh. J. Am. Soc. Hortic. Sci. 2015, 140, 472–479. [Google Scholar] [CrossRef]
  33. Correia, S.; Schouten, R.; Silva, A.P.; Gonçalves, B. Sweet Cherry Fruit Cracking Mechanisms and Prevention Strategies: A Review. Sci. Hortic. 2018, 240, 369–377. [Google Scholar] [CrossRef]
  34. Measham, P.F.; Gracie, A.J.; Wilson, S.J.; Bound, S.A. An Alternative View of Rain-Induced Cracking of Sweet Cherries (Prunus avium L.). Acta Hortic. 2014, 1020, 217–222. [Google Scholar] [CrossRef]
  35. Dimopoulos, N.; Tindjau, R.; Wong, D.C.J.; Matzat, T.; Haslam, T.; Song, C.; Gambetta, G.A.; Kunst, L.; Castellarin, S.D. Drought Stress Modulates Cuticular Wax Composition of the Grape Berry. J. Exp. Bot. 2020, 71, 3126–3141. [Google Scholar] [CrossRef]
  36. Zhang, C.-L.; Hu, X.; Zhang, Y.-L.; Liu, Y.; Wang, G.-L.; You, C.-X.; Li, Y.-Y.; Hao, Y.-J. An Apple Long-Chain Acyl-CoA Synthetase 2 Gene Enhances Plant Resistance to Abiotic Stress by Regulating the Accumulation of Cuticular Wax. Tree Physiol. 2020, 40, 1450–1465. [Google Scholar] [CrossRef]
  37. Quero-García, J.; Schuster, M.; López-Ortega, G.; Charlot, G. Sweet Cherries Varieties and Improvement. In Cherries: Botany, Production and Uses; Quero-García, J., Iezzoni, A., Pulawska, J., Lang, G., Eds.; CABI: Boston, MA, USA, 2017; ISBN 978-1-78064-837-8. [Google Scholar]
  38. Neilsen, G.H.; Neilsen, D.; Kappel, F.; Forge, T. Interaction of Irrigation and Soil Management on Sweet Cherry Productivity and Fruit Quality at Different Crop Loads That Simulate Those Occurring by Environmental Extremes. HortScience 2014, 49, 215–220. [Google Scholar] [CrossRef] [Green Version]
  39. Bound, S.A.; Close, D.C.; Quentin, A.G.; Measham, P.F.; Whiting, M.D. Crop Load and Time of Thinning Interact to Affect Fruit Quality in Sweet Cherry. J. Agric. Sci. 2013, 5, 216–230. [Google Scholar] [CrossRef] [Green Version]
  40. Marsal, J.; Lopez, G.; del Campo, J.; Mata, M.; Arbones, A.; Girona, J. Postharvest Regulated Deficit Irrigation in ‘Summit’ Sweet Cherry: Fruit Yield and Quality in the Following Season. Irrig. Sci. 2010, 28, 181–189. [Google Scholar] [CrossRef]
  41. Blanco, V.; Blaya-Ros, P.J.; Torres-Sánchez, R.; Domingo, R. Influence of Regulated Deficit Irrigation and Environmental Conditions on Reproductive Response of Sweet Cherry Trees. Plants 2020, 9, 94. [Google Scholar] [CrossRef] [PubMed] [Green Version]
  42. Allen, R.G.; Pereira, L.S.; Raes, D.; Smith, M. FAO Irrigation and drainage paper. In Crop Evapotranspiration-Guidelines for Computing Crop. Water Requirements; Food and Agriculture Organization: Rome, Italy, 1998; ISBN 9253042192. [Google Scholar]
  43. Marsal, J. Sweet Cherry. In Crop Yield Response Water; FAO Irrigation and Drainage; FAO: Rome, Italy, 2012; pp. 449–457. [Google Scholar]
  44. Fereres, E.; Martinich, D.A.; Aldrich, T.M.; Castel, J.; Holzapfel, E.; Schulbach, H. Drip Irrigation Saves Money in Young Almond Orchards. Calif. Agric. 1982, 36, 12–13. [Google Scholar]
  45. McCutchan, H.; Shackel, K.A. Stem-Water Potential as a Sensitive Indicator of Water Stress in Prune Trees (Prunus domestica L. cv. French). J. Am. Soc. Hortic. Sci. 1992, 117, 607–611. [Google Scholar] [CrossRef] [Green Version]
  46. Lechaudel, M. Croissance et Qualité Organoleptique de La Mangue (Mangifera indica): Analyse Expérimentale et Modélisation de L’effet de La Disponibilité Hydrique et Carbonée. Ph.D. Dissertation, Institut National Agronomique Paris-Grignon, Paris, France, 2004. [Google Scholar]
  47. Milad, R.E.; Shackel, K.A. Water Relations of Fruit End Cracking in French Prune (Prunus domestica L. cv. French). J. Am. Soc. Hortic. Sci. 1992, 117, 824–828. [Google Scholar] [CrossRef]
  48. Christensen, J.V. Cracking in Cherries: III. Determination of Cracking Susceptibility. Acta Agric. Scand. 1972, 22, 128–136. [Google Scholar] [CrossRef]
Figure 1. Seasonal evolution of environmental conditions (A): daily air temperature (green solid line), reference evapotranspiration (black dashed line) and rainfall (blue bars), and soil matric potential (B) at 0.25 m (solid line) and 0.50 m (dash line) depth for the two irrigation treatments, CTL (full irrigated treatment; blue) and DI (deficit irrigation treatment; red). The vertical dotted line indicates the harvest day (day of year, DOY 162; days after full bloom, 81 DAFB). Full bloom: 22 March 2019; harvest day: 11 June 2019.
Plants 11 03249 g001
Figure 2. Seasonal evolution of stomatal conductance (A) and net assimilation rate (B) for the two irrigation treatments: CTL (full irrigated treatment; blue) and DI (deficit irrigation treatment; red), and the three levels of crop load: low (33%, squares), medium (66%, triangle), and high (100%, circle). Each point is the mean ± SD of three trees. Asterisks indicate significant differences between CTL and DI, according to ANOVA (p < 0.05). The vertical dotted line indicates the harvest day (day of year, DOY 162; days after full bloom, 81 DAFB). Full bloom: 22 March 2019; harvest day: 11 June 2019.
Plants 11 03249 g002
Figure 3. Seasonal evolution of midday stem water potential (A) and maximum daily branch shrinkage (B) for the two irrigation treatments: CTL (full irrigated treatment; blue) and DI (deficit irrigation treatment; red), and the three levels of crop load: low (33%, squares), medium (66%, triangle), and high (100%, circle). Each point is the mean ± SD of three trees. Asterisks indicate significant differences between CTL and DI, according to ANOVA (p < 0.05). The vertical dotted line indicates the harvest day (day of year, DOY 162; days after full bloom, 81 DAFB). Full bloom: 22 March 2019; harvest day: 11 June 2019.
Plants 11 03249 g003
Figure 4. Fruit water potential (A), fruit osmotic potential (B), fruit turgor potential (C), and fruit osmotic potential gradient between skin and flesh at harvest (D) for the two irrigation treatments: CTL (full irrigated treatment; blue) and DI (deficit irrigation treatment; red), and the three levels of crop load: low (33%), medium (66%), and high (100%). Each bar is the mean ± SD of six fruits. Asterisks indicate significant differences between CTL and DI, according to ANOVA (p < 0.05).
Plants 11 03249 g004
Figure 5. Principal component analysis (PCA) biplot of the fruit quality characteristics, expressed as vectors, of fruit from the two irrigation treatments, CTL (full irrigated treatment) and DI (deficit irrigation treatment), and the three levels of crop load: low (33%), medium (66%), and high (100%). The two principal components of the PCA explained 79.7% of the variation in the measured data.
Plants 11 03249 g005
Figure 6. Correlation heat map of the quality parameters analyzed.
Plants 11 03249 g006
Figure 7. Linear regression between the fruit osmotic potential gradient (∆Ψπ) and the fruit relative water content (RWC) (A), the cracking index (CI) assessed in the laboratory and the proportion of fruit cracked at harvest (B), the fruit relative water content and the cracking index (C), and the osmotic potential gradient and the cracking index (D) for the two irrigation treatments: CTL (full irrigated treatment; blue) and DI (deficit irrigation treatment; red), and the three levels of crop load: low (33% square), medium (66% triangle), and high (100% circle). Each point represents one replicate (tree). * indicates a significant relationship between the studied variables at p < 0.05.
Plants 11 03249 g007
Figure 8. Linear regression between crop load and fruit cracked at harvest (A), cracking index (B), and osmotic potential gradient (C) for the two irrigation treatments: CTL (full irrigated treatment; blue) and DI (deficit irrigation treatment; red). ** indicates a significant relationship between the studied variables at p < 0.01 and n.s. indicates no significant relationship (p > 0.05).
Plants 11 03249 g008
Table 1. Yield, number of fruits per tree, fruit efficiency (FE), double fruit, cracked fruit at harvest, cracking index, and water productivity (WP) of ‘Prime Giant’ sweet cherries under two irrigation treatments, control (CTL), and deficit irrigation (DI) and three levels of crop load (high—100%, medium—66%, low—33%).
Yield
(kg Tree−1)
n
Fruit(n Fruit Tree−1)
FE (n Fruit cm−2 Trunk)Double Fruit (%)Cracked Fruit (%)Cracking IndexWP
(kg m−3)
CTL338.13 b599 b2.35 b0.1731.5063.472.67 b
CTL6618.19 a1401 ab5.34 ab0.1728.5059.736.07 a
CTL10025.31 a1944 a7.04 a0.5021.3360.008.44 a
ANOVA0.0050.0060.0250.4920.4120.1530.004
DI338.91 b680 b2.40 b1.0010.3353.874.75 b
DI6620.06 ab1694 a6.09 ab0.834.8350.6710.70 ab
DI10027.52 a2351 a9.28 a1.339.8349.0714.68 a
ANOVA0.0070.0040.0190.9110.3540.0920.007
CTL17.2113044.910.2827.1161.075.73
DI18.8315985.921.068.3351.2010.05
ANOVA0.6950.4120.5500.0940.0010.0010.033
Each value is the mean of the three replicates. Different letters on the same parameter (column) denote significant differences among levels of crop load within the same irrigation treatment, according to Duncan’s multiple range test (p < 0.05). In the ANOVA row, the p-values of each parameter are included.
Table 2. Effect of the irrigation treatment (control (CTL) and deficit irrigation (DI)) and crop load level (high—100%, medium—66%, low—33%) on fruit quality characteristics of ‘Prime Giant’ sweet cherries.
Equatorial Diameter (mm)Fresh Mass (g)Dry Mass (g)Relative Water Content (%)Skin Color (hue°)Soluble Solids Concentration (%)Titratable Acidity (%)
CTL3331.73 a13.403.1477.5917.0521.570.99
CTL6631.48 a13.012.9478.4321.9820.500.94
CTL10030.48 b13.062.7578.7919.7818.930.91
ANOVA0.0350.2390.2970.7600.2260.2530.140
DI3331.05 a13.14 a3.1776.2110.33 b24.831.19 a
DI6629.32 b11.82 b2.7576.2614.17 ab22.971.08 ab
DI10029.15 b11.70 b3.0374.0516.60 a22.300.99 b
ANOVA0.0140.0160.4820.7060.0470.0890.045
CTL31.2313.172.9478.2719.6020.330.94
DI29.8412.212.9875.5113.7023.371.09
ANOVA0.0040.0040.8250.0430.0020.0020.003
Each value is the mean of the three replicates. Different letters on the same parameter (column) denote significant differences among levels of crop load within the same irrigation treatment, according to Duncan’s multiple range test (p < 0.05). In the ANOVA row, the p-values of each parameter are included.
Publisher’s Note: MDPI stays neutral with regard to jurisdictional claims in published maps and institutional affiliations.

