1. Introduction
Ammonium (NH
4+), a major form of inorganic N, when applied in excess, leads to NH
4+ toxicity, which culminates in decreased K
+ uptake, leaf chlorosis, and stunted plant growth [
1,
2,
3]). The adverse effects of NH
4+ toxicity could be mitigated with an additional supply of K
+ [
4]. As such, balancing NH
4+ and K
+ becomes a prerequisite to improving plant growth.
Another major factor that affects growth is the amount of assimilate synthesized and distributed among plant organs. Photoassimilate distribution is mainly influenced by several factors, including drought, temperature, and mineral nutrient deficit [
5]. Of these nutrient elements, potassium (K
+) [
6] and nitrogen (N) [
7] have been found to modulate photoassimilate partitioning between roots and shoots in a respective manner. Therefore, achieving a nutrient balance between K
+ and NH
4+ could be a tool for improving root-to-shoot biomass partitioning.
Root-to-shoot biomass partitioning is one of the inherent ways plants adapt to nutritional stress, which may subsequently influence plant growth [
8,
9]. Under optimal nutrient supply, root-to-shoot biomass partitioning is enhanced with resultant improvement in plant growth due to the diversion of a higher proportion of biomass to the leaves and stems, where sucrose is synthesised [
8]. Although the significance of a balanced photoassimilate distribution to plant growth have been reported in several literature [
10,
11], less is known about the impact of K
+ and NH
4+-induced ion imbalance onroot-to-shoot biomass partitioning.
Nutritional imbalances between K
+ and NH
4+ could negatively influence carbohydrate accumulation, distorting root-to-shoot biomass allocation. In N-deficient plants, more photosynthate (sucrose) is diverted towards the roots, resulting in an increasing root over shoot growth [
12]. As such, instead of reserving the unloaded assimilates for growth, plant roots forage for more N in the soil or nutrient solution, as this could serve as the main adaptive strategy for root growth under such condition [
13,
14]. Plants subjected to low N supply also exhibit significantly higher leaf starch content and reduced plant growth due to the shortage in the supply of amino acid pool needed to sustain protein synthesis essential for the formation of new tissues [
12]. On the contrary, excessive N-plants are mainly characterised by a wide range of NH
4+ toxicity effect; low carbon retention in the root and higher retention in the shoot, reducing the sink (flowers and fruits) yield [
15]. This adverse effect is ascribed to the flow of unassimilated NO
3− acropetally back to the shoot via xylem under excessive NH
4+ condition. Thus, a balanced sucrose distribution between the source and sink (flowers or fruit) may act as a major yield-determinant factor. In contrast to the findings regarding lower root-to-shoot ratio, a higher root-to-shoot ratio was observed under excessive NH
4+ in tobacco [
16] and cucumber [
17]. The aforementioned findings suggest that plant growth is disrupted when there is a shift in biomass partitioning between the source and sink, due to carbohydrate partitioning accrued from varying N application.
With respect to K
+, K
+-deficient plants are characterised with reduced plant growth and photosynthetic rate associated with sucrose deposited in the source leaf [
18] and a consequent distinct reduction in root sucrose and starch content. It is then deduced that changes in K
+ status alters these physiological traits. In a comprehensive review on plant utilisation of sucrose, Aluko et al. [
13] argued that changes in K
+ concentration adversely affect the phloem-loading of sucrose, leading to a reduction in the root sucrose content. In all, N and K
+ nutrition affects the photoassimilate export, and sugar accumulation in the leaves.
The concentration of soluble sugars is controlled by sucrose metabolic system, which are critical to proper photoassimilate distribution among the plant tissues. The sucrose metabolic system is regulated by key enzymes: sucrose-phosphate synthase (SPS), sucrose synthase (SS), and invertase (Inv.) [
19,
20]. As the main photosynthetic product, sucrose is synthesised by sucrose-phosphate synthase (SPS), a key enzyme for carbohydrate partitioning. Sucrose synthase (SS) and invertase (Inv.) hydrolyses sucrose at the sink tissue (root, seeds, and younger leaves) [
21], where the latter generate carbon and energy required for root (sink) growth. In addition, Inv. is involved in the distribution of sucrose within the sink organ. Therefore, Inv. is accessed as the master regulator of photoassimilate partitioning in response of plants to nutritional and environmental fluctuations [
19].
Numerous studies have elucidated the influence of photoassimilate distribution on growth of plants exposed to drought [
19,
20], nitrogen [
7], potassium [
6], and other environmental cues. Moreover, literature has explored the impact of N and K on plant growth [
3,
22]; however, less is known about the combined impact of NH
4+ and K
+ nutrition on the photoassimilate distribution among plant organs, and the resultant effect of such distribution on growth of tobacco seedlings, hence this study. Here, we hypothesise that: (1) Photoassimilate alters the growth of tobacco seedlings under varying K
+ and NH
4+ (in a combined form) supplies, and (2) enzymes involved in sucrose conversion may be functionally associated with changes in photoassimilate and biomass partitioning. This present study investigated: (1) the synergetic effect of NH
4+ and K
+ nutrition on photoassimilate distribution, and their resultant effect on growth of tobacco seedlings, and (2) the relationship among biomass distribution, carbohydrate partitioning, and enzyme activity.
2. Materials and Methods
2.1. Plant Materials and Growth Conditions
Tobacco seeds (Nicotiana tabacum) were sown in a potting soil mixture (soil/perlite, 3:1 v/v) under controlled climatic conditions (continuous light, temperature 24 °C). At the three-leaf stage, uniformly grown seedlings were transferred into hydroponic pots (48 cm × 22.5 cm × 3.5 cm) with 2 L of nutrient solution (one-fifth-strength Hoagland solution, 1/5 HS) for 6 days. The 1/5 HS, which was supplemented with 1 mM K+ (K2SO4 is the K+ source) had the following composition in mM: 0.35 MgSO4, 0.2 NaH2PO4, 0.0125 H3BO3, 0.001 MnSO4, 0.0005 CuSO4, 0.001 ZnSO4, 0.0001 Na2MoO4, 0.01 Fe-EDTA, 1.4 Ca (NO3)2, and 0.15 CaCl2. NH4+ and K+ were supplied as (NH4)2SO4 and K2SO4, respectively.The experiment consisted of three levels of NH4+ (low, moderate, and high) combined with three levels of K+ (low, moderate, and high), making a total of nine NH4+ and K+ treatments, as follows: low NH4+ with low K+ (0.1-0.1 mM), moderate NH4+ with low K+ (2-0.1 mM), high NH4+ and low K+ (20-0.2 mM), lowNH4+ with moderate K+ (0.1-2 mM), moderate NH4+ with moderate K+ (2-2 mM), high NH4+ with moderate K+ (20-2 mM), low NH4+ with high K+ (0.2-10 mM), moderate NH4+ with high K+ (2-10 mM), and high NH4+ with high K+ (20-10 mM). We designed different levels of NH4+ and K+ supply based on the dose-response in our preliminary study. Plants were harvested after 15 days of NH4+-K+ treatments. All the treated groups were compared with each other. Moderate NH4+ and moderate K+ nutrition was also presented as the control for comparison with other NH4+ and K+ treated groups. In this study, a hyphen sign (“-”) was used in between NH4+ and K+ concentration to indicate the combined form of both (NH4+ and K+) treatments.
2.2. Sampling, Leaf Area, Root-to-Shoot Ratio, and Dry Weight Determination
At harvest, uniformly grown seedlings from each treatment were fractioned into (i) leaves, (ii) stems, and (iii) roots. Photographs of different plant parts were taken with a camera. Subsequently, the leaf area was determined using the ImageJ software (
https://imagej.en.softonic.com/; accessed on 15 February 2022). Plant root was washed thoroughly once with 10 mM CaSO
4 and twice in double-distilled water, and then the plant tissue sample was weighed. The dry weights of the measured samples were taken after oven-drying at 110 °C for 30 min and then 80 °C to a constant weight. The dry samples were crushed into fine powders with the mortar and pestle for K
+ determination. Root to shoot ratio was calculated as root dry weight divided by the shoot dry weight (stem + leaf). The remaining part of the plant tissue (leaf, stem, and root) was collected, frozen, and stored in liquid nitrogen at −80 °C for enzymatic analysis.
2.3. Potassium and Ammonium Determination
Approximately 0.01 g of the grinded samples (leaves, stems, and roots) were weighed and digested in 8 mL of 0.5 M HCl for K
+ concentration measurement. The suspension was homogenised at 25 °C, 100–150 rpm for 1 h, and filtered into a new centrifuge tube. The aliquot of the filtrate was used for K
+ determination by flame photometry (6400 A). The readings obtained were used to calculate K
+ concentrations in plant tissue, as follows:
where
For NH
4+ concentration, the freshly harvested plant was partitioned into different plant parts (leaves, stems, and roots). The root was rinsed with 10 mM CaSO
4 to eliminate any extracellular NH
4+. Fresh plant tissue of ≤0.5 g was homogenised under liquid nitrogen, and 6 mL of 10 mM formic acid was added to extract NH
4+. The suspension was allowed to sit for 5 min and then centrifuged at 4 °C and 12,000 rpm for 10 min. The supernatant was centrifuged repeatedly for about 3 times. The supernatant obtained from the last centrifugation step was diluted with 2.5 mL o-phthalaldehyde (OPA) solution, as previously described by Shi et al. [
23]. The absorbance of the sample was measured at 410 nm using a spectrophotometer (UV-2550PC, AOE Instruments, Shimadzu Suzhou Instruments Mfg. Co, Ltd., Jiangsu, China). The reading obtained was used to calculate NH
4+ concentrations in plant tissue as follows:
where
2.4. Chlorophyll Content Measurement
After 15 days of NH
4+-K
+ treatment, chlorophyll content was measured according to the previous method [
24]. The fourth leaf of each treatment was weighed (0.2 g) and incubated in 95% ethyl alcohol until the leaf strands became completely pale (approximately 48 h). The absorbance of the extract was measured at 665 nm and 649 nm using a spectrophotometer.
2.5. Oxidation-Reduction Potential Indicator of the Root
Using triphenyl tetrazolium chloride (TTC) method, root activity was measured, as previously described by Liu et al. [
25] (with slight modifications. TTC method has been used to access the viability of metabolic active tissues, such as seeds’ and roots’ tissues [
25,
26]. The viability test relies on the reduction of water soluble TTC (with a standard oxidation potential of 80 mV) to an insoluble red 1,3,5-triphenyl formazan (TTF). This reduction could be ascribed to a TTC loss of electron, upon dehydrogenase activity in the root tissues. Thus, TTC, is used as a redox pigment for root activity measurement.
Approximately 0.5 g of the freshly weighed root was fully immersed in 5 mL of 0.4% TTC and phosphate buffer (adjusted to pH 7.0) and incubated at 37 °C for 3 h to accelerate the reduction of TTC to TTF. The resulting chemical reaction was halted by adding 2 mL of 1 mol L
−1 sulphuric acid to each tube. Subsequently, the roots were removed from the tubes, gently patted with tissue paper, and then crushed with 3–4 mL ethyl acetate. The red supernatant and the root residue were moved into a new tube and made up to 10 mL of ethyl acetate. The absorbance was measured at 485 nm wavelength using a spectrometer (UV-2550PC, AOE Instruments, Shimadzu Suzhou Instruments Mfg. Co, Ltd., Jiangsu, China). For TTC standard curve, 0.2 mL of 0.4% TTC solution was added to a little amount of sodium sulphate (Na
2SO
4) powder, and mixed thoroughly to generate the redness. Then, 0.25 mL, 0.50 mL, 1.00 mL, 1.50 mL, 2.00 mL of this solution was discretely pipetted into a 10 mL volumetric flask, and the volume was made up with ethyl acetate to generate a standard colorimetric series containing 25 μg, 50 μg, 100 μg, 150 μg, and 200 μg, respectively. The absorbance is measured at a wavelength of 485 nm with a blank as a reference.
The OD values were expressed as mg/g (fresh root weight)/h.
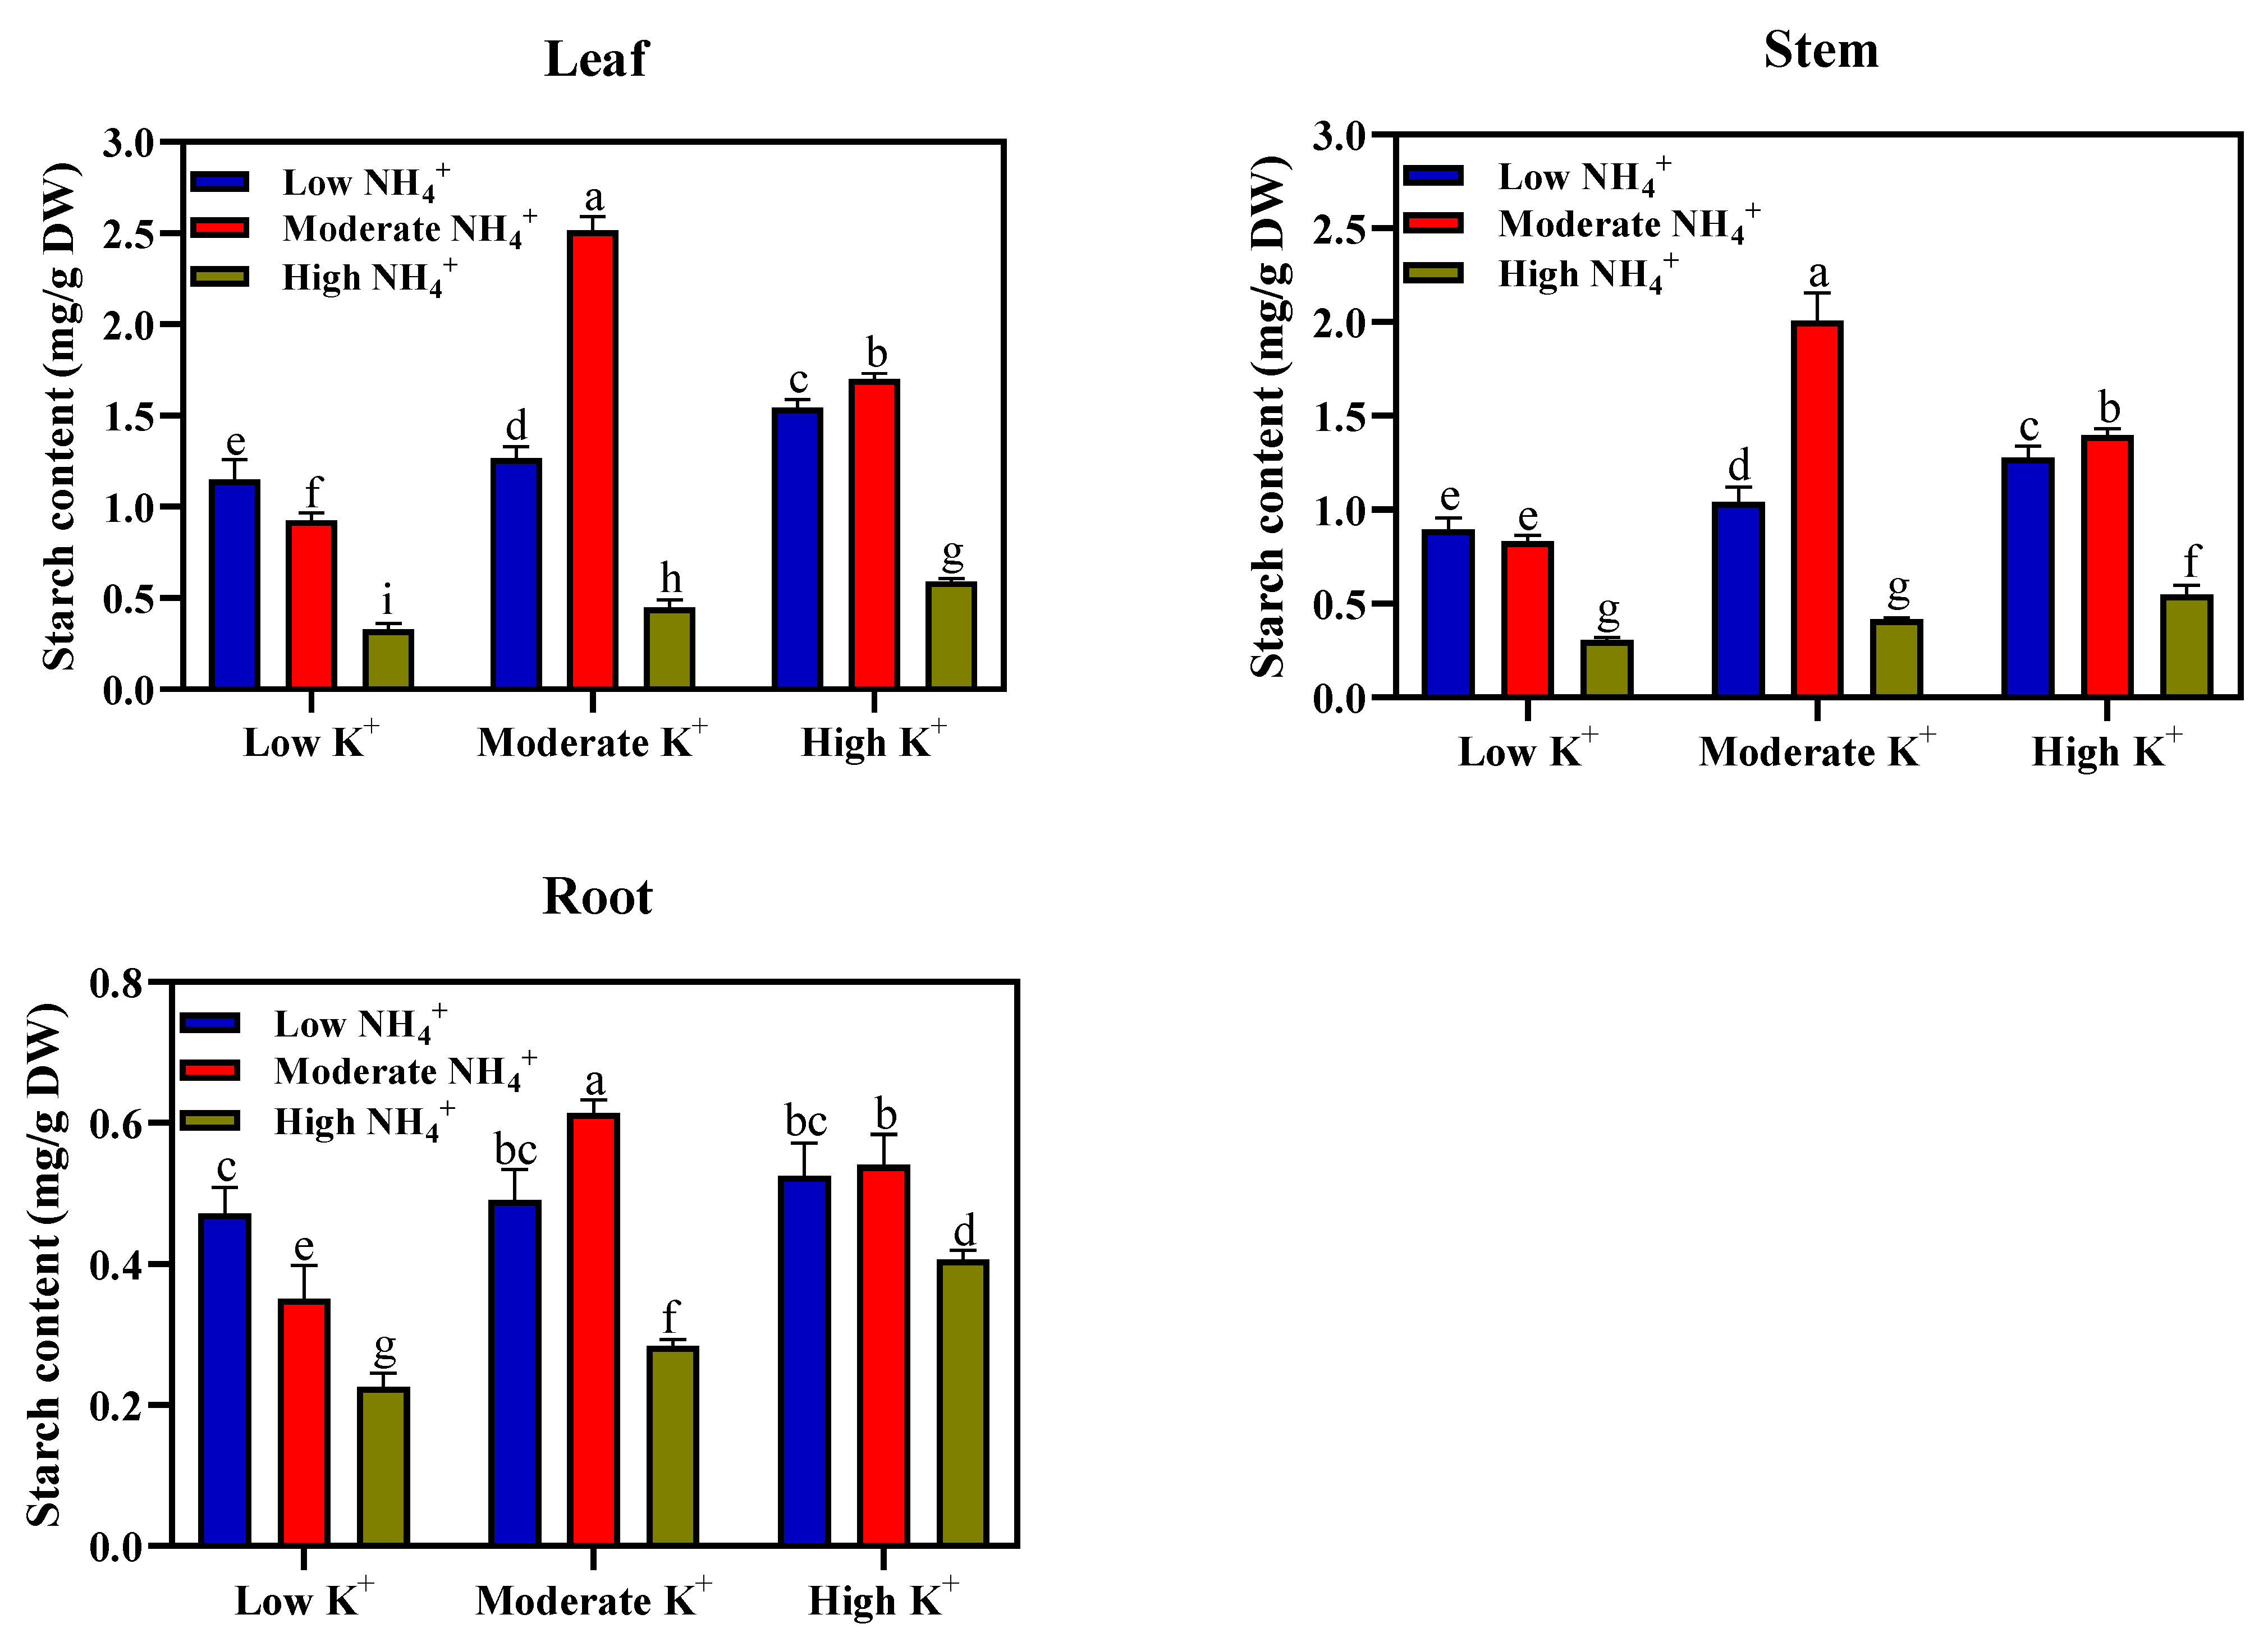
2.6. Soluble Sugar and Starch Contents’ Determination
Sample extraction was performed and modified for soluble sugars and starch content determination according to Du et al. [
20]. Approximately 0.02 g of ground leaf, stem, and root samples were homogenised with 80% (
v/
v) ethanol at 85 °C for 30 min. and centrifuged at 10,000×
g for 10 min. The precipitates were extracted two to three times using 80% ethanol. The supernatants were combined and made up to 25 mL with 80% ethanol. The soluble sugar content was determined spectrophotometrically at A
620 nm wavelength. The remaining ethanol-insoluble precipitates were used for starch extraction, as described by Kuai et al. [
27]. The ethanol was removed, and the samples were diluted with 2 mL of distilled water, then incubated at 100 °C for 15 min. After cooling, 2 mL of 9.2 M was used to hydrolyse the leaf starch, and then centrifuged at 4000 rpm for 10 min. The pellet in the centrifuged solution was extracted again by adding 2 mL 4.6 M HClO
4 to each of the samples. Thereafter, the supernatant was combined and made up to 25 mL volume of distilled water. The starch content was determined spectrophotometrically at a A
620 nm wavelength using an anthrone reagent. Soluble sugar and starch concentrations of the leaves, stems, and root tissues were calculated and expressed in terms of mgg
−1 DW. The proportion of sugar or starch in roots, leaves, and stems was calculated and expressed in a percentage.
2.7. Enzyme Extraction and Analysis
Plant samples were stored at −80 °C. Fresh plant tissue of ≤0.5 g was ground in a mortar with liquid nitrogen to analyse the sugar-related enzyme activity. The sugar-related enzymes (sucrose phosphatase synthase (SPS), sucrose synthase (SS), and acid invertase (Inv.)) were analysed using sucrose phosphorylase (SP) assay kit, Delphinose synthase (direction of synthesis; Ss-ii) kit, Soluble invertase (SAID/Vacuolar invertase) kit, and soluble acid invertase (S-AD)/Vacuolar invertase (G0517F) kit. Suzhou Greiss Biotechnology Co. Ltd., Suzhou, China. The manufacturer’s protocol was carefully followed.
2.8. Statistical Analysis
Data were analysed using the IBM SPSS Statistics 23 software. Variations among treatments were examined by one-way ANOVA using the LSD test at p < 0.05. Graphs and images were drawn using GraphPad Prism 6.0.


 ,
, 

