Article

QTL Analysis Revealed One Major Genetic Factor Inhibiting Lesion Elongation by Bacterial Blight (Xanthomonas oryzae pv. oryzae) from a japonica Cultivar Koshihikari in Rice

1
Graduate School of Agriculture Science Forestry and Fisheries, Kagoshima University, Kagoshima 890-0065, Japan
2
Faculty of Agriculture, Kagoshima University, Kagoshima 890-0065, Japan
3
The United Graduate School of Agriculture Sciences, Kagoshima University, Kagoshima 890-0065, Japan
4
Division of Gene Research, Kagoshima University, Kagoshima 890-0065, Japan
*
Author to whom correspondence should be addressed.
Plants 2022, 11(7), 867; https://doi.org/10.3390/plants11070867
Submission received: 10 February 2022 / Revised: 15 March 2022 / Accepted: 22 March 2022 / Published: 24 March 2022
(This article belongs to the Special Issue Genetic Breeding and Germplasm Enhancement of Rice)

Abstract

:
Xanthomonas oryzae pv. oryzae (Xoo) is a pathogen that has ravaged the rice industry as the causal agent of bacterial blight (BB) diseases in rice. Koshihikari (KO), an elite japonica cultivar, and ARC7013 (AR), an indica cultivar, are both susceptible to Xoo. Their phenotypic characteristics reveal that KO has shorter lesion length than that of AR. The F2 population from KO × AR results in continuous distribution of lesion length by inoculation of an Xoo race (T7147). Consequently, quantitative trait loci (QTL) mapping of the F2 population is conducted, covering 12 chromosomes with 107 simple sequence repeat (SSR) and insertion/deletion (InDel) genetic markers. Three QTLs are identified on chromosomes 2, 5, and 10. Of them, qXAR5 has the strongest resistance variance effect of 20.5%, whereas qXAR2 and qXAR10 have minor QTL effects on resistance variance, with 3.9% and 2.3%, respectively, for a total resistance variance of 26.7%. The QTLs we examine for this study differ from the loci of BB resistance genes from earlier studies. Our results can help to facilitate understanding of genetic and morphological fundamentals for use in rice breeding programs that are more durable against evolving Xoo pathogens and uncertain climatic temperature.

1. Introduction

Access to a healthy diet is humanity’s most important need. The United Nations sustainable development goals aim to eliminate hunger by 2030. However, this world is plagued with hunger. Reaching this important goal is further complicated by climate change, population increase, and increases in pests and diseases in both humans and crops. To provide food security, a greater need exists for modern technology and techniques. Rice (Oryza sativa L.) is one of the most consumed foods in the world apart from wheat and maize, with 508.7 million tons produced during 2010–2021 [1]. As a staple food, rice feeds more than half of the human population [2,3]. Apart from being used as food, rice has great traditional and cultural importance in Asian countries. In Japan, rice is regarded as the essence of culture. It is cultivated from Hokkaido, the most northern prefecture of Japan, to the most southern regions of Japan in Okinawa. Like economically developed countries, economically developing island states such as Fiji also depend on rice not merely for food security but also to stimulate the economy through exportation.
Biotic stressors such as pathogens strongly affect rice production. Xanthomonas oryzae pv. oryzae (Xoo), a pathogen that has ravaged the rice industry as the causal agent of bacterial blight disease (BB) in rice and grass species, can cause up to 50% annual yield loss [4,5]. Initially, BB was reported in 1884 in southern Japan [6]. To combat this pathogen, an integrated pest management strategy is needed. Currently cultural, chemical, biological, and molecular control methods have been devised. Cultural control methods include proper nursery drainage, removal of diseased plants, weeds and debris, and burning rice straw left from the prior season [7]. Chemical control is a temporary measure that causes environmental pollution and adverse degradation [8,9]. Bactericides such as bismerthiazole and streptomycin have been used widely to control the Xoo pathogen in parts of China, which has exacerbated the problem of antimicrobial resistance development [10,11]. Toxic residues left by chemical control in the soil’s rhizosphere can engender development of antibiotic and chemical resistance in other microorganisms, which is expected to be devastating if it were to become zoonotic, causing serious problems in the public health sector. Biological approaches are regarded as ecologically friendly and good long-term solutions [12,13]. According to Ji et al., Lysobacter antibioticus has the potential to be used for biocontrol because it suppresses Xoo pathogen growth [14]. Plant growth promoting rhizobacteria such as B. pumilus SE34 and B. subtilis GBO3 has been shown to induce systematic resistance against Xoo pathogens while helping to enhance nutrient uptake and yields as shown in in vitro studies [15]. In contrast, the most effective control method for BB is genetic selection for resistant rice cultivars [16,17,18]. To date, more than 40 known resistance genes (R genes) have shown resistance to different strains of Xoo pathogen in rice cultivars, wild relatives, and some mutation populations [19].
Plant resistance is generally categorized as vertical or horizontal. According to Acquaah [20], vertical resistance is characterized by several features: it is based on a hypersensitivity reaction; it is race specific or pathotype specific in its effects; its inheritance is based on a major gene; and its effects in agricultural applications are usually not durable. Horizontal resistance is also known as partial resistance, field resistance, or race-non-specific resistance. This resistance is typically not complete. It is effective against all genotypes of the pathogen species. Most reported R genes against Xoo confer vertical resistance. Xoo, similar to any other pathogen, can evolve and persist in the environment until it finds a suitable host. This capability makes it difficult to create a durable resistance because major R genes eventually “breakdown” [8,19], creating doubts for future food insecurities. For instance, the Xa4 gene has been used extensively in most elite rice cultivars, enabling it to provide defense against the Xoo pathogen. However, many cultivars that have been developed, which carry only the Xa4 gene, have become susceptible to new strains of Xoo. They no longer provide resistance [21,22].
Moreover, climate change and increased temperatures can be expected to promote further complications that will make general R genes more susceptible to the Xoo pathogen [23,24]. Durability of BB R genes such as Xa4 show decreased effectiveness in controlling BB disease at higher temperatures [25]. This important shortcoming has spurred further exploration of horizontal resistance. This form of resistance is associated with polygenic genes controlled by multiple loci [26]. Ramalingam et al. and Li et al. reported that quantitative resistance, when compared to qualitative resistance, is regarded as providing higher durability against evolving and stronger virulence pathogens [27,28].
A Japanese rice cultivar, Koshihikari (KO), is known to be susceptible to all Japanese Xoo races [29]. However, our field observations over many years have revealed that, although permitting invasion of Xoo races into leaves, KO inhibits the progression of lesion growth against different Xoo races. This characteristic of KO presents a clear contrast to very long lesion length by Xoo of an Indian cultivar ARC7013 (AR), which also lacks R genes. So, why does this phenomenon occur when both cultivars are susceptible? This research seeks to ascertain if this phenomenon is caused by horizontal resistance genes that are responsible for providing Koshihikari this innate protection against BB disease. Moreover, because both KO and AR lack major vertical resistance genes, they would be good genetic materials for analyzing horizontal resistance against Xoo in rice. If vertical resistance genes are segregating in the experimental population, these genes could mask the effect of horizontal genes. To our knowledge, there have been no reports of genetic analysis of Xoo resistance targeting only horizontal resistance using two susceptible cultivars. For this study, the difference in the reaction to Xoo between KO and AR was analyzed using QTL mapping.

2. Results

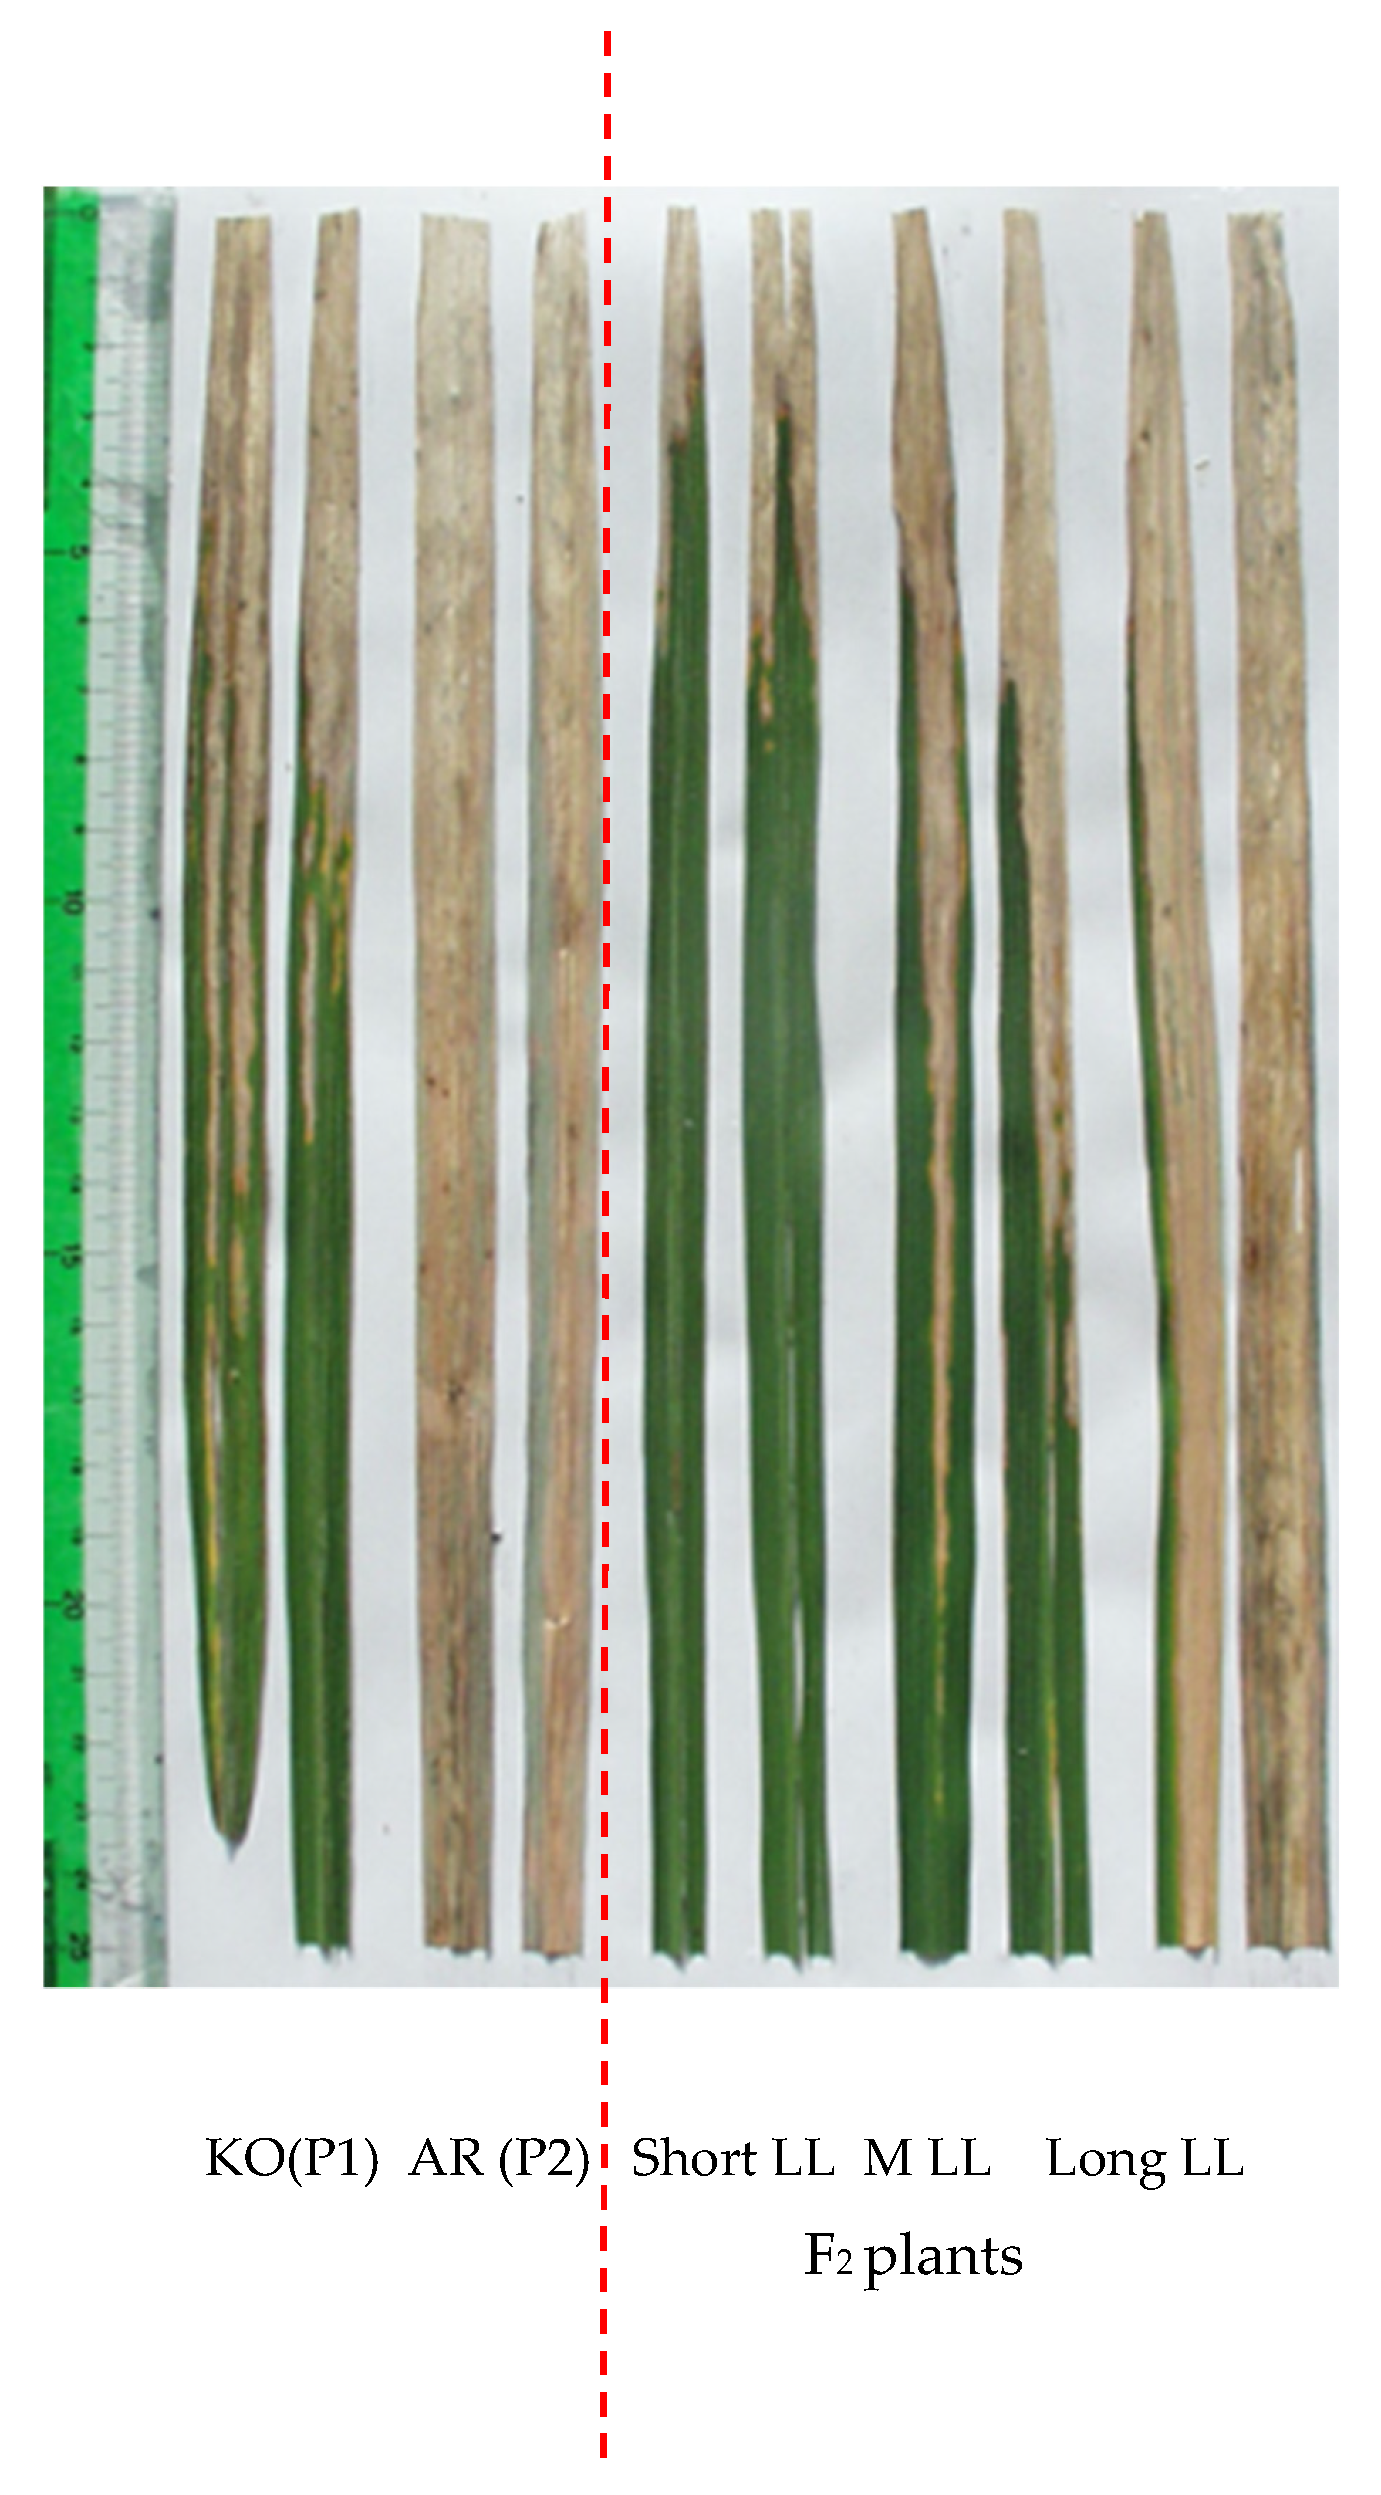
2.1. Phenotypic Evaluation of Parental Lines and F2 Population to Progression of Lesion Length to Xoo

We confirmed the reaction of KO and AR to five Japanese Xoo races (Table 1): KO displayed shorter lesion length after inoculation of all the Xoo races tested and eventually stopped the lesion progression after 10–18 cm, whereas AR displayed longer lesion length, exceeding 40–54 cm.
To dissect the quantitative difference in the reaction to Xoo genetically, the population from the cross between KO and AR was subjected to inoculation to Race II strain (Figure 1), which was frequently used in our earlier studies [19,30,31] as a tester Xoo in genetic analysis of Xoo resistance in rice. The F2 population derived from the cross between the two cultivars represented continuous distribution of 5.5–60 cm (Figure 2).

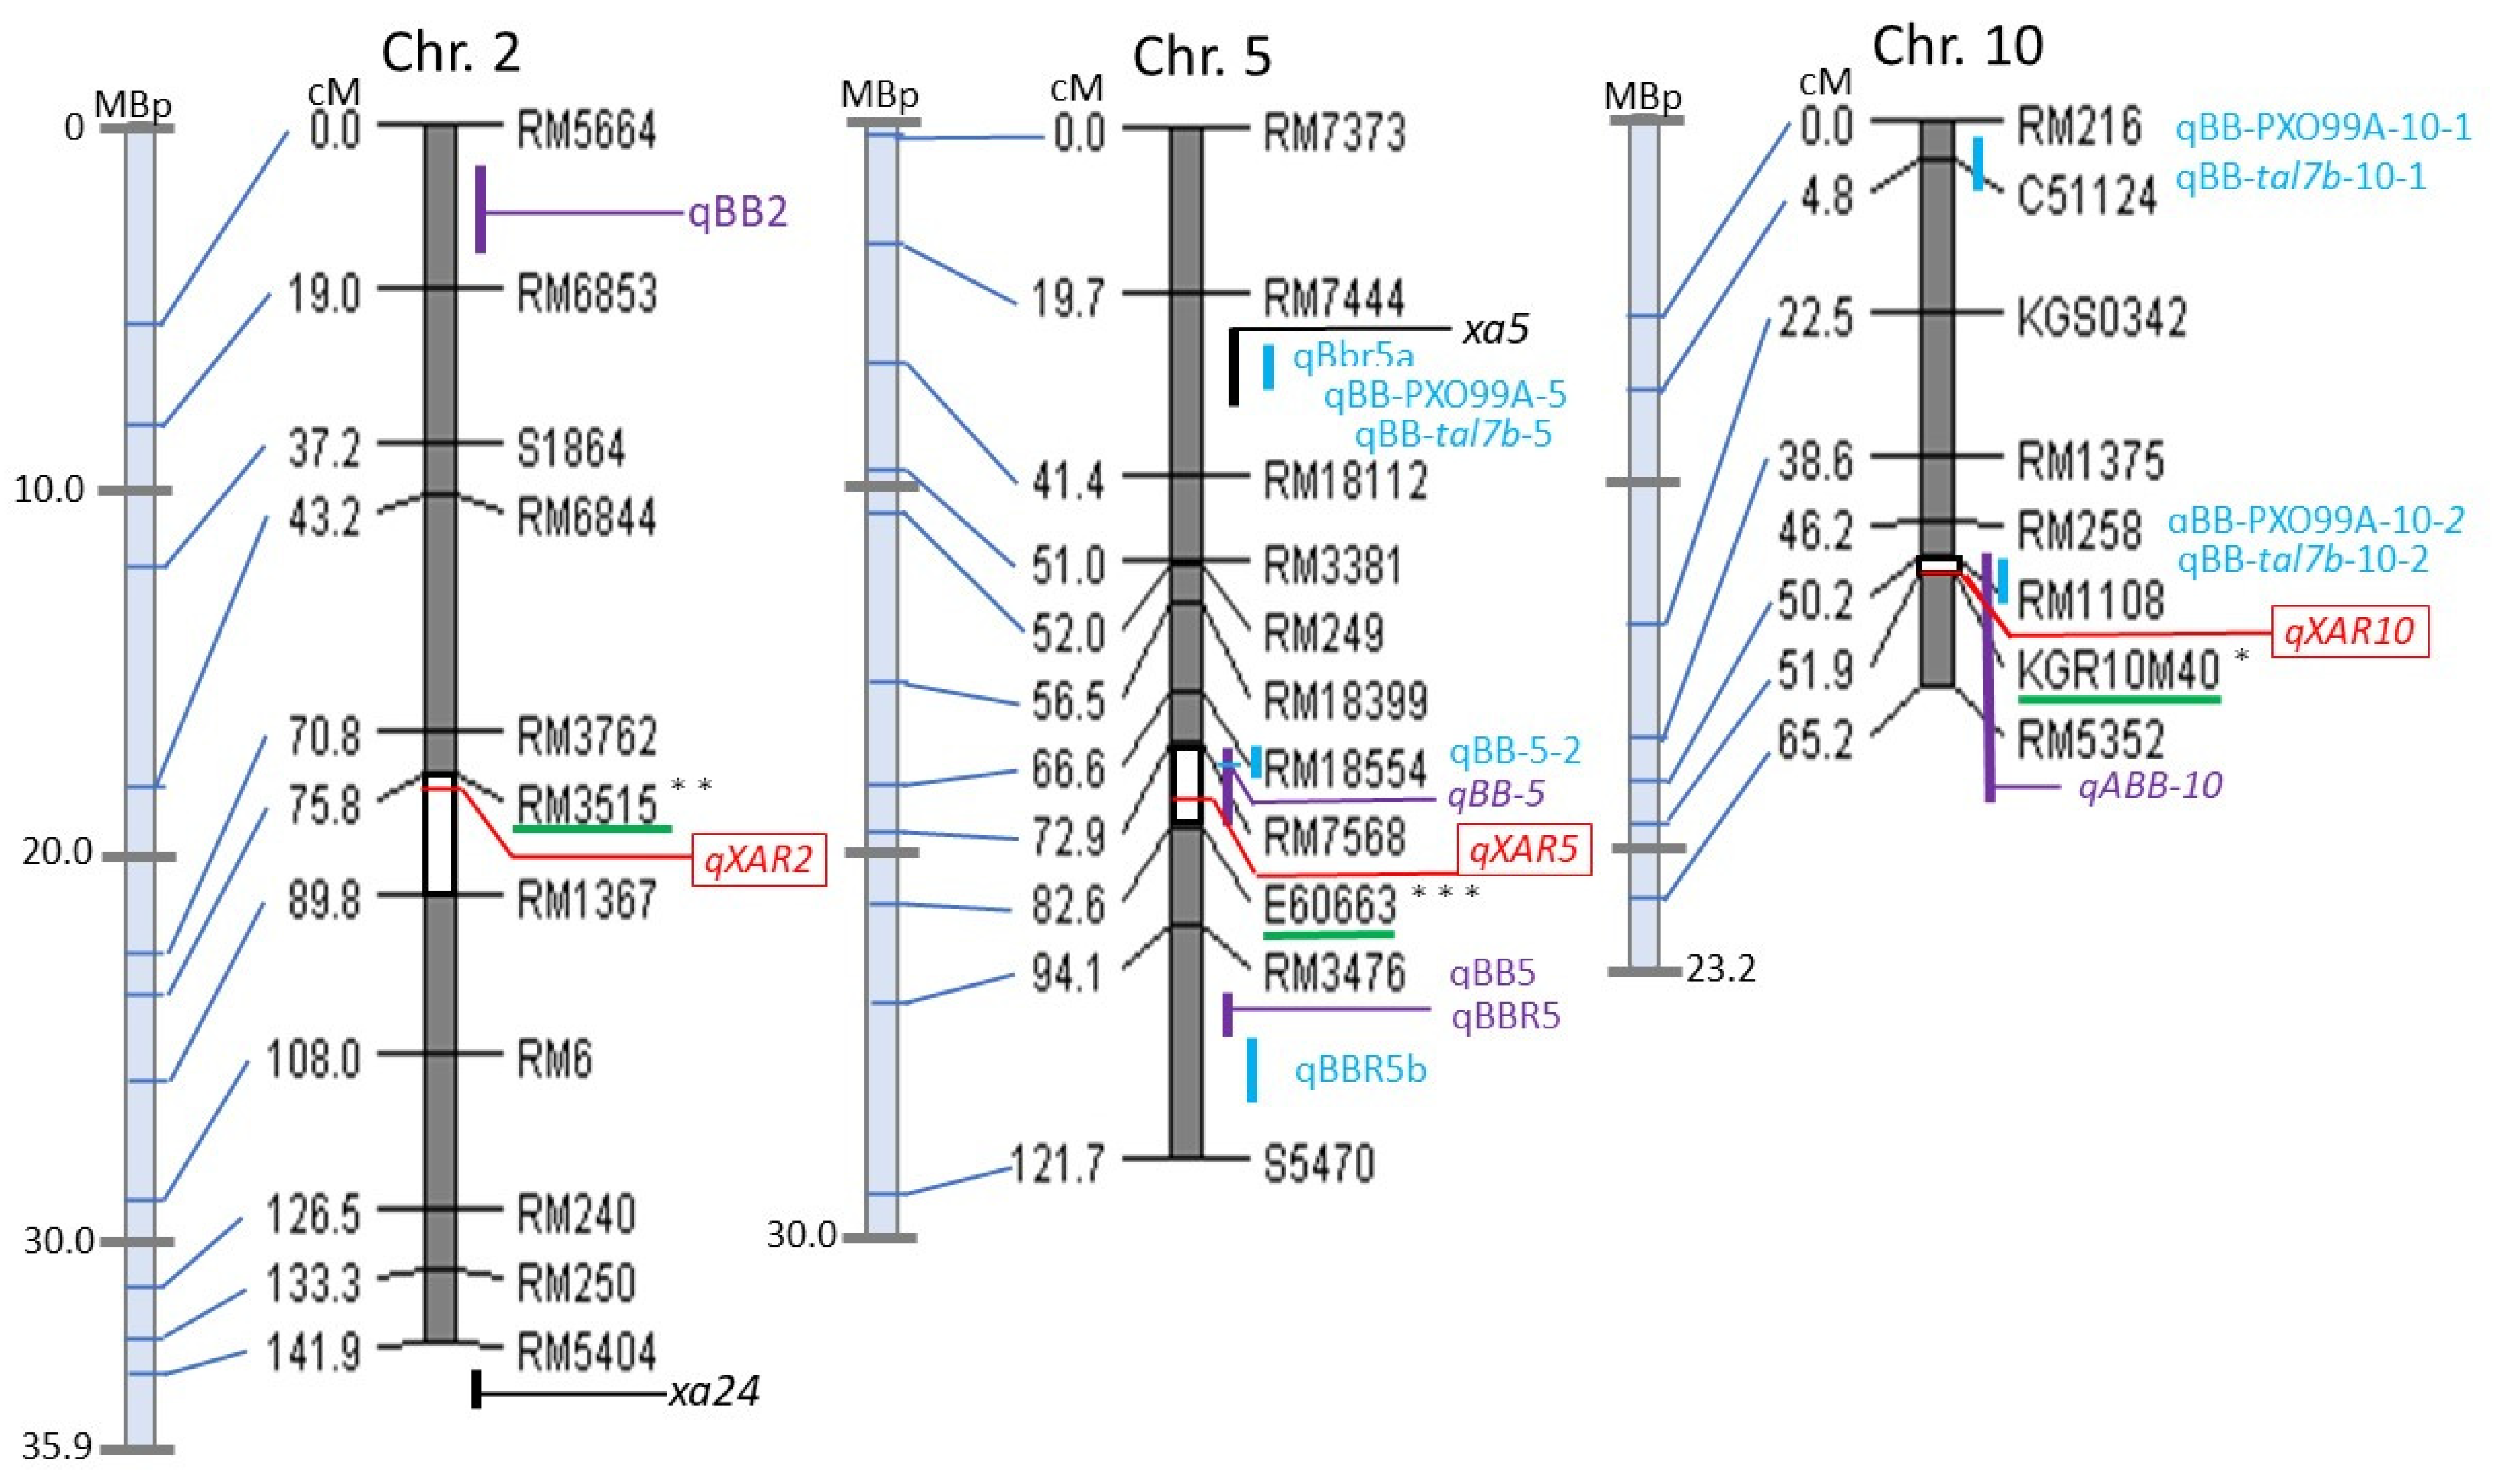
2.2. Putative Quantitative Trait Loci (QTL) Mapping for Resistance to Bacterial Blight (BB)

Out of more than 2000 genetic markers in our lab database, 113 DNA markers were tested, including SSR, STS, and InDel PCR-based markers which were pre-surveyed and screened for polymorphism first between japonica and indica cultivars that were evenly distributed on 12 chromosomes. From these, 80 markers that provided good results were selected while 27 markers were reselected from our stock because distinguishing between genotypes was difficult. This survey allowed us to select the best 107 DNA markers to carry out genetic analysis for KO and AR. Among them, 107 genetic markers covering all 12 chromosomes produced clear, reproducible polymorphic and co-dominant banding patterns and were selected for further study (Supplementary Materials: Table S1). Then, a linkage map covering all 12 chromosomes was constructed (Supplementary Materials: Figure S1). This linkage map was used for QTL analysis. QTL analysis of lesion length elongation with the obtained linkage of 107 DNA markers (Table S1) was applied to the F2 population described above using R/qtl by adopting simple interval mapping (SIM) based on maximum likelihood and composite interval mapping (CIM) approaches. Three QTLs controlling lesion length were detected on chromosomes 2, 5, and 10 (Figure 3) using both SIM and CIM, with a potential candidate on chromosome 8. Figure 4 illustrates the banding pattern displayed by the highest LOD score on chromosome 5 highlighted in Figure 3 from segregating the population on the flanked nearest genetic marker of E60663. These three QTLs were designated respectively as qXAR2 (QTL for Xoo resistance on chromosome 2), qXAR5, and qXAR10 (Figure 5) [32]. The first, qXAR2, was located between marker RM3515 and RM1367, flanked to the nearest marker RM3515. This QTL explained 3.9% of the phenotypic variance and had the logarithm of odds (LOD) score of 2.4 derived from the SIM method. Under the CIM approach, the LOD score was 3.1, located at the map region of 75.8 cM on chromosome 2. In fact, qXAR5 had the highest LOD score of 14.0 defined by the CIM approach and 11.6 from the SIM method, explaining approximately 20.5% of the total resistance variance. It was mapped close to 79.0 cM between markers RM7568 and E60663 on chromosome 5 flanked by the nearest marker of E60663. qXAR10 was mapped to a region of 55.0 cM flanked by markers RM1108 and KGR10M40 on chromosome 10 and the nearest marker was KGR10M40. The LOD scores of qXAR10 under the CIM and SIM approaches were 3.4 and 1.4, respectively, accounting for 2.3% of the phenotypic variance (Table 2).
A comparative genetic map was constructed by calculating the 99% confidence interval of putative QTLs (Figure 5). The largest confidence level was on qXAR2, which was approximately 14 cM, located in the region of RM3515–RM1367. Among the three identified QTLs, qXAR5 and qXAR10 had the short confidence intervals. qXAR5 and qXAR10 had an approximately 10 cM interval region in markers RM7568–E60663 and 1.7 cM in RM1108–KGR10M40.

2.3. Alleles Contributing to Short Lesion Length in the Targeted Regions

The expression level of the allelic effect at the nearest marker, RM3515, on chromosome 2 is −2.8, which results in the KO genotype being skewed towards shorter lesion length, whereas AR is distributed along the longer lesion length. This finding indicates that the KO homozygous qXAR2 might reduce the lesion length by 5.6 cm compared to AR homozygotes.
From chromosome 5, given the highest LOD score flanked by marker E60663 using both the SIM and CIM method at statistical significance level of p ≤ 0.01, we determined that the KO allele contributed towards shorter lesion length in the F2 population. The additive effect of qXAR5 is −7.0, indicating that KO homozygous might contribute to reducing the lesion length by 14.0 cm. The genotypic distribution on flanked marker E60663 on chromosome 5 also provided evidence that KO’s genotype was skewed clearly towards shorter lesion length when compared to AR, which was skewed more towards longer lesion length (Figure 6).
It is particularly interesting that compared to chromosomes 2 and 5, chromosome 10 had the opposite genotypic distribution: AR skewed towards the shorter lesion length; KO skewed towards the longer lesion length. The additive effect qXAR10 is 2.3, thereby indicating that the AR allele homozygote might reduce the lesion length by 4.6 cm, as shown in Table 2. Moreover, the dominance action and its interactions on the same locus at qXAR2 and qXAR5 indicate that the heterozygote genotypic value resembles that of AR homozygotes, whereas qXAR10 showed a smaller dominance effect.

3. Discussion

Bacterial leaf blight (BB) caused by the Xoo pathogen is regarded as a devastating and widespread disease affecting rice in parts of the world where rice is mostly cultivated. The approximately 42 resistance genes to BB which have been identified are increasingly being used in breeding programs [31,36,37]. Because these resistant genes have been used in elite cultivars for decades, they make the cultivars highly vulnerable to evolving Xoo pathotypes, thereby necessitating the reservoir of rice germplasm against them.
For this study, QTL analysis was performed using the F2 population derived from the cross between an elite japonica cultivar, KO [38], and an indica cultivar, AR. Neither has true resistance genes. Both are susceptible to BB disease, making this study and its findings even more vital. Moreover, previous research is mostly based on using one resistant and one susceptible material which does not provide a good reference point of true horizontal QTLs in most instances. F2 generation was initially used in our study, in order to first determine and ascertain statistical difference in early generation between two susceptible cultivars. As two susceptible cultivars were involved, it was important to discover that the observed phenotypic characteristics were actually due to polygenic gene interaction. This will also form the basis as a screen process to further develop our recombinant inbred line and chromosomal segment substitution line materials. This method will also serve as an early screening induction signal, when using purely susceptible cultivars, to better isolate planting material lines for future research. KO phenotypic characteristics when exposed to Xoo indicate that it has the potential to reduce the progression of the foliar lesion, which provides an understanding of the resistance against Xoo. The F2 population showed evidence of short lesion length against Japanese Race II (strain T7147) isolate. After analyzing the genotypic data and phenotypic characteristics of the F2 population, it was discovered that lesion elongation against BB disease was controlled by QTLs. Using composite interval mapping (CIM), qXAR2 on chromosome 2, qXAR5 on chromosome 5, and qXAR10 on chromosome 10 were detected, although only one qXAR5 reached the 99% significance threshold during simple interval mapping (SIM). In a CIM model, results calculated using the SIM fitqtl function [39] contributed further to significant phenotypic variance (2.3–20.5%) with 26.7% of the total resistance variance. Earlier reports have also described QTLs that have been discovered and mapped to chromosomes 1, 3, 4, 5, 7, 8, 9, 10, 11, and 12 [40,41], to chromosomes 1, 3, and 5 [8], to chromosomes 2, 3, 5, 7, and 8 [27], and to all chromosomes [28]. Among them, two studies, [8] and [40], used PCR-based DNA markers for which primer sequences were available, thereby enabling comparative analysis of this study and the two earlier studies [8,40].
As reported earlier, xa5 has been mapped at an interval of 0.5 cM between markers RS7 (411 kb region on chromosome 5 of Os-Nipponbare-Reference-IRGSP-1.0 [42]) and RM611 (488 kb region) [43]. Actually, the qXAR5 identified in this study is also mapped to chromosome 5, but its mapping region differed. qXAR5 was mapped physically between markers in RM7568 (19,490 kb; 72.9 cM) and E60663 (21,204 kb; 82.6 cM) regions, which provided the highest LOD score at the position interval of 79.0 cM in this study. Han et al. located one Xoo resistance QTL named qBBR5 between RM7081 (24,587 kb) and RM3616 (26,344 kb) on chromosome 5 [8]. This finding indicates that both qXAR5 and qBBR5 are located at different positions on chromosome 5. Additionally, the genetic background used in both studies is also a factor contributing to this difference. The allele from a wild rice species O. meyeriana has a strong effect on Xoo resistance among the three detected QTLs.
Djedatin et al. detected one QTL, named qBB-5, which was closely linked with a DNA marker RM440 (19,975 kb) [40], located between RM7568 and E60663. The 79.0 cM highest LOD score of qXAR5 is located near E60663. The tropical japonica cultivar Azucena carries a resistant allele against PXO86, a Xoo race from the Philippines. In addition, an indica cultivar IR64 carries a susceptible allele. Although their exact chromosomal locations have remained unknown, the results of rough mapping suggest that qXAR5, qBBR5, and qBB-5 mutually differ.
qXAR2 is located between RM3515 (24,022 kb) and RM1367 (27,065 kb). After Wu et al. conducted fine mapping of an Xoo resistance gene xa24, they reported that the xa24 gene is located between two DNA markers on the distal end of the long arm of chromosome 2: RM14220 (35,679 kb) and RM14226 (35,781 kb) [44]. The physical locations differ from one another: they are not allelic. No other report describes Xoo resistance genes or QTLs mapped on chromosome 2. If genetically dissected into a single gene, qXAR2 will be a new Xoo resistance gene.
qXAR10 is located between RM1108 (19,233 kb) and KGR10M40 (19,469 kb) on chromosome 10. No Mendelian Xoo resistance gene has been reported on chromosome 10. Djedatin et al. detected one QTL named qABB-10 as closely linked with a DNA marker RM294A [40]. Actually, the primer sequence information of RM294A indicates that it is located on chromosome 1 of the latest rice genome sequence [45]. RM294A is flanked by two markers: RM171 and RM228 [40]. RM171 and RM228 are located respectively at 19,120 kb and 22,314 kb on chromosome 10. The approximate locations of qXAR10 and qABB-10 are overlapping. However, their gene actions differ: results of the present study show that a japonica cultivar KO carries a susceptible allele against Japanese Xoo race II and that indica cultivar AR carries a resistant allele on qXAR10. In the case of qABB-10, the tropical japonica cultivar Azucena carries a resistant allele against NAI8 [40], a Xoo race from Niger, and an indica cultivar, IR64, carries a susceptible allele on qABB-10 [40]. These results suggest that qXAR10 and qABB-10 differ, although precise mapping of both genes will be necessary to reach a conclusion.
According to a review by Vikal et al., most Xoo resistance genes identified to date show hyper-sensitive response to pathogens and inhibit their intrusion by programmed cell death [36]. In fact, KO shows no hyper-sensitive response. Therefore, it is likely that the QTLs detected in this study exert resistance using different mechanisms. Recently, Xa4, a durable Xoo resistance gene, and pi21, a field resistance gene to rice blast, reportedly have atypical resistance mechanisms: Hu et al. reported that Xa4 encodes a cell-wall associated kinase, enhancing resistance to bacterial infection by strengthening the cell wall via promotion of cellulose synthesis and suppression of cell wall loosening [46]. Another atypical resistance mechanism is reported in pi21: the wild type (susceptible) allele Pi21 encodes a proline-rich protein that includes a putative heavy metal-binding domain and putative protein–protein interaction motifs [47]. This allele appears to slow the plant’s defense responses, which might support optimization of defense mechanisms. Deletion in its proline-rich motif in the resistant allele pi21 inhibits this slowing. Fonseca and Mysore [48] listed genes involved in nonhost disease resistance. These genes also might contribute to horizontal resistance.
Previous research is mostly based on using one resistant and one susceptible material which do not provide a good reference point of true horizontal QTLs in most instances. This study highlighted the existence of Xoo resistance genes without hyper-sensitive responses, which are mostly due to the QTL mapping population of which parental cultivars carry no major vertical resistance genes against Xoo. Therefore, we could detect three QTLs with 107 DNA markers, which is a relatively small number compared to what can be detected with next generation sequencer-based methods. To our knowledge, there have been no previous reports highlighting this aspect of study and this may be the first report of genetic analysis of Xoo resistance targeting only horizontal resistance. Furthermore, 107 markers could be enough for a starting point of further linkage analysis using near-isogenic lines as described below.
The three QTLs examined for this study might contribute to new mechanisms of resistance against Xoo. Among the three QTLs identified, the KO’s allele of qXAR5 confers the strongest resistance against Xoo. Therefore, we are undertaking further study of qXAR5. The development of near-isogenic lines of qXAR5 under the IR24 genetic background, of which many Xoo resistance genes have been introduced and induced by mutation [49,50], is undertaken to perform fine mapping of qXAR5 for comparison and to combine qXAR5 with other genes to assess their resistance against multiple Xoo races under the same genetic background. The present study revealed that even small or minor QTLs, such as qXAR2 and qXAR10, might eventually be able to defend against the Xoo pathogen. The minor QTLs can also be used in pyramiding resistance with R genes to breed more durable and resistant cultivars. This pyramiding has also been confirmed in an earlier study done by Hu et al., which described that although minor QTL genes are less efficient at controlling diseases than R genes are, pyramiding two or more minor QTL genes has some potential to help in breeding rice cultivars that are resistant to BB diseases [26]. Therefore, precise mapping of qXAR2 and qXAR10 is also undertaken.

4. Materials and Methods

4.1. Plant Materials and Bacterial Race Preparation

Koshihikari (KO) is a popular Japanese japonica rice cultivar. An indica rice cultivar from India is ARC 7013 (AR). Their reactions to Xoo were tested in 2008 (Table 1). Plants were inoculated in the manner described below for each cultivar. Then, a cross between KO and AR was conducted to create F1 plants. In 2008, an F2 population was produced for genetic analysis and for ascertaining the location of putative QTLs. The F2 segregating population from germinated seeds crossed between KO and AR was seeded in a seedling box containing sterilized soil left in a glasshouse for two weeks, half submerged in clean water. During the third week, 300 healthy seedlings were transferred outside of the glasshouse. About one month after the sowing date, they were transplanted by hand to a paddy field at the Kagoshima University Experimental Field. The field was filled with fresh clean water. Planting was done with spacing of 15 cm within rows and 30 cm between rows.
According to virulence and origin, Xoo are differentiated into many races. Five Japanese races were used for this study, designated as race I (strain T7174), race II (strain T7147), race III (strain T7133), race IV (strain H75373), and race V (strain H75304). The isolate race II was used for QTL analysis. The Xoo isolates were kept under −20 °C in skim milk medium (SMM). The SMM, which included 10% skim milk and 1.5% sodium glutamate, was sterilized at 121 °C for 20 min. A similar method, with minor modification to that reported by Wakimoto [51], was used to prepare potato semi-synthetic agar medium (PSA) media to culture the bacteria. Before field inoculation, a smear loop (5 mm diameter) was used to transfer two scoops of bacteria inoculum from the stock culture tube to the PSA media. The bacteria were cultured for 48 h at 28 °C. Two hours before inoculation was conducted in the rice field, the bacterial cells were suspended in distilled water. The suspension’s absorbance frequency was calibrated using the spectrophotometer: A = 0.05 or 620 nm, which had approximate concentration of 108 cfu/mL. Mapping population plants were inoculated at the booting stage with the suspension using leaf clipping method [52,53]. At 18 days after inoculation, each plant’s reaction to the Xoo pathogen was evaluated by lesion length: lesions (cm) of three leaves from each plant were measured using a ruler; their mean value was adopted as phenotypic data.

4.2. Genomic DNA Extraction and PCR Analysis Using DNA Markers

One week before inoculation, leaf samples from each F2 plant were collected for genomic DNA extraction. DNA was extracted using the method described by Dellaporta et al. with a few modifications [54]: each leaf tip of 2 cm long was collected in 2.0 mL micro centrifuge tube from a single plant and was stored at −20 °C. Later, each leaf was vacuum dried before DNA extraction began. Then in each tube, two 5-mm-diameter stainless steel balls were added in order to break the leaf cellulose tissues and grind the leave into powdery form to maximize DNA quantity. The tubes were then transferred to aluminum block with 2 mL deep well. They were covered with a hard lid and shaken hard in ShakeMaster (BioMedical Science Inc., Tokyo, Japan) for 2 min to completely grind the leaf samples. Then, 500 μL extraction buffer (1% SDS, 100 mM Tris-HCl (pH 8.0), 50 mM EDTA (pH 8.0), 500 mM NaCl) was added to the samples and thoroughly mixed. After mixing, the samples were incubated for 60 min at 60 °C. Next, 150 μL of 5 M potassium acetate was added after incubation period and mixed thoroughly by hand, then the samples were placed on ice for 30 min. Each sample tube was vortexed for approximately 5 s to remove any trapped air bubbles which may have been floating within the samples. Samples were centrifuged for 15 min at 4 °C at 4200 rpm (3600× g) using swing rotor centrifuge. Then, 300 μL supernatant was pipetted into the new 1.5 μL Eppendorf tube and the same amount of isopropanol was added to the samples and gently mixed. After which, samples were centrifuged for 10 min at room temperature. Then the supernatant was discarded, and tubes were placed invertedly on clean paper towel to dry. DNA pellet was rinsed with 500 μL of 70% ethanol and left to settle for 10 min, followed by centrifuge for another 5 min at room temperature at 4200 rpm. Supernatant was gently discarded and DNA pallets were dried. Later, 100 μL of TE–RNase were added into each tube of DNA pallets and dissolved by incubating the samples for 5 min at 60 °C. The DNA concentration was quantified using a spectrophotometer (Nanodrop 8000; Thermo Fisher Scientific Inc. Wilmington, DE, USA). For this study, 107 simple sequence repeat (SSR) and insertion/deletion (InDel) markers were acquired from earlier publications [31,55,56,57,58,59,60,61,62] (Supplementary Materials: Table S1). The polymerase chain reaction (PCR) cocktail mixture (4.5 µL) comprised genomic DNA 10 ng, dNTPs 200 µM, 10 × buffer containing MgCl2, individual DNA markers 0.2 µM, distilled H2O 1.6 µL, and Taq polymerase 0.25 U. The amplified PCR product was separated using gel electrophoresis (PAGE) on 10% polyacrylamide gels in 1 × TBE solution for 1 h followed by staining gels with ethidium bromide for 10 min and later gels were washed with distilled water for another 30 min. Genotype visualization photo recording was performed under UV light (GelDoc–It®® TS Imaging system; UVP LLC, Upland, CA, USA). DNA profiling of 216 segregating F2 populations derived from KO and AR was individually evaluated based on the band display pattern of the mapping population. Each line was scored by having the linkage marker pattern that corresponded to one of the parents, as shown in Figure 4. Moreover, the genotyping matrix was set up according to the displayed bands which was recorded as: Koshihikari homozygous–K, Heterozygous patterns from both parents–H, and ARC7013 homozygous–I (representing indica). K, H, and I were later matrixed to A, H, and B, respectively, during R/qtl coding stage.

4.3. Mapping Putative QTLs against Resistance to BB Disease

For this study, QTL analyses were conducted using R software programming language ver. 4.0.3 (https://rqtl.org/download/ (accessed on 12 June 2021)) with an add-on qtl library package [63] downloaded from comprehensive R archive network (https://cran.r-project.org/ (accessed on 12 June 2021)). An F2 intercross was conducted using R/qtl with 216 F2 individuals and 107 markers, declaring missing genotype data as (na.strings= “-”). In addition, for this study, to carry out precise location of the QTLs, simple interval mapping (SIM) and composite interval mapping (CIM) using stepwise scanning at 1 cM were used to discover QTLs via “hk” regression method and error probability assigned as 0.01. Then CIM was used to eliminate the probability of being able to detect “ghost QTLs” on a wide genome scan by Bayes 99% threshold via permutation test.
Before moving further, genotype data were assessed for problematic markers by inspecting the F2 segregation ratio having a 1:2:1 likely pattern. Main effects of QTL were estimated using the function logarithm of odds (LOD) having maximum likelihood estimation of all 12 autosomes. A permutation test set to 1000 iterations was applied to estimate the genome-wide significance level of LOD threshold equal to p ≤ 0.01 for the trait/chromosome combination (log-likelihood of odds (LOD) score of more than or equal to 3). R/qtl was used to calculate the 99% confidence estimate interval that had significant QTLs at highlighted chromosomes using Bayes credible interval approach, f (θ | data) = 10LOD(θ)θ10LOD(θ). A genetic map was developed using AntMap software. The linkage mapping distances were calculated using recombination frequency by utilizing Kosambi mapping function with 5000 iterations, with r = 0.005 [25,26].

5. Conclusions

Xanthomonas oryzae pv. oryzae (Xoo), an economically important pathogen, causes bacterial leaf blight disease in rice, an important cereal crop that supports and feeds about half of the Earth’s population. Global climatic conditions will continue to worsen in the coming years because of global warming. Continued increases in weather temperatures may provide favorable conditions for the Xoo pathogen to evolve into more virulent strains. Resistance genes might lead to future breakdown, leaving a higher incidence of elite rice cultivars becoming more prone to BB disease. Therefore, searching for new and durable resistant genes that are useful for breeding programs to develop elite cultivars with desirable agronomic traits is of paramount importance. From the cross between japonica KO and indica AR, findings from this study show that the F2 population exhibits continuous distribution to the Xoo (strain T7147). Three QTLs were discovered on chromosomes 2, 5, and 10, with LOD scores of 3.1, 14.0, and 3.4 using the CIM method and 2.4, 11.6, and 1.4 using the SIM method, respectively. The highest LOD is on chromosome 5, flanked by the nearest marker E60663 at position 79.0 cM. Additionally, chromosomes 2 and 5 show that the KO allele contributes to shorter lesion length. However, chromosome 10 provides an interesting differential of having AR as the shorter lesion length. This finding helps to elucidate the phenomenon of KO’s shorter lesion length than that of AR. The QTLs identified in this study can facilitate better understanding of the genetic and morphological fundamentals necessary to develop horizontal resistant rice varieties that can withstand evolving pathogens in the field. Further studies will be conducted with multiple strains of Xoo pathogens to extend this research and to test the field resistance in the KO cultivar.

Supplementary Materials

The following are available online at https://www.mdpi.com/article/10.3390/plants11070867/s1, Figure S1: An associative map comparing the QTLs against Xoo pathogen in this study. Table S1: DNA markers used for linkage analysis of F2 plants from the between Koshihikari and ARC7013.

Author Contributions

S.T. created the F2 population that was used in this research. S.T. and K.I. conceptualized and designed the methodology. S.T. and H.T. collected the phenotypic data. S.S. and S.T. conducted DNA extraction, genetic analysis of F2 population, and collected formal genotypic data. S.S. entered the genotypic dataset and conducted statistical analysis and QTL mapping. S.S. prepared the original draft manuscript, S.S. reviewed and edited. K.I. and S.T. supervised, checked, and reviewed the manuscript. All authors have read and agreed to the published version of the manuscript.

Funding

No external funding was used in this research.

Institutional Review Board Statement

Not applicable.

Informed Consent Statement

Not applicable.

Data Availability Statement

The dataset collected from this research and all genetical analyzed work together with the statistical software coding are available from the corresponding author upon reasonable request.

Acknowledgments

Akhtar Ali Shah (Fiji) was instrumental in providing mathematical support and knowledge while coding in R/qtl during the statistical analysis phase.

Conflicts of Interest

The authors declare that they have no conflict of interest.

References

  1. Food and Agriculture Organization of the United Nations; Trade and Markets Division. Food Outlook: Biannual Report on Global Food Markets, June 2020; Food and Agriculture Organization: Rome, Italy, 2020; Available online: https://www.fao.org/documents/card/en/c/ca9509en/ (accessed on 9 June 2021).
  2. Gnanamanickam, S.S. Rice and Its Importance to Human Life. In Biological Control of Rice Diseases; Springer: Dordrecht, The Netherlands, 2009; pp. 1–11. [Google Scholar] [CrossRef]
  3. Doni, F.; Suhaimi, N.S.M.; Mispan, M.S.; Fathurrahman, F.; Marzuki, B.M.; Kusmoro, J.; Uphoff, N. Microbial Contributions for Rice Production: From Conventional Crop Management to the Use of ‘Omics’ Technologies. Int. J. Mol. Sci. 2022, 23, 737. [Google Scholar] [CrossRef] [PubMed]
  4. Kottapalli, K.R.; Satoh, K.; Rakwal, R.; Shibato, J.; Doi, K.; Nagata, T.; Kikuchi, S. Combining In Silico Mapping and Arraying: An Approach to Identifying Common Candidate Genes for Submergence Tolerance and Resistance to Bacterial Leaf Blight in Rice. Mol. Cells 2007, 24, 394–408. [Google Scholar] [PubMed]
  5. Du, X.-X.; Park, J.-R.; Wang, X.-H.; Jan, R.; Lee, G.-S.; Kim, K.-M. Genotype and Phenotype Interaction between OsWKRYq6 and BLB after Xanthomonas oryzae pv. oryzae Inoculation in the Field. Plants 2022, 11, 287. [Google Scholar] [CrossRef] [PubMed]
  6. Ou, S. Bacterial Diseases. In Rice Diseases; Commonwealth Mycological Institute: Kew, UK, 1985; pp. 61–96. [Google Scholar]
  7. Niño-Liu, D.O.; Ronald, P.C.; Bogdanove, A.J. Xanthomonas oryzae pathovars: Model Pathogens of a Model Crop. Mol. Plant Pathol. 2006, 7, 303–324. [Google Scholar] [CrossRef]
  8. Han, X.; Yang, Y.; Wang, X.; Zhou, J.; Zhang, W.; Yu, C.; Cheng, C.; Cheng, Y.; Yan, C.; Chen, J. Quantitative Trait Loci Mapping for Bacterial Blight Resistance in Rice Using Bulked Segregant Analysis. Int. J. Mol. Sci. 2014, 15, 11847–11861. [Google Scholar] [CrossRef] [Green Version]
  9. Shobha, B.; Lakshmeesha, T.R.; Ansari, M.A.; Almatroudi, A.; Alzohairy, M.A.; Basavaraju, S.; Alurappa, R.; Niranjana, S.R.; Chowdappa, S. Mycosynthesis of ZnO Nanoparticles Using Trichoderma Spp. Isolated from Rhizosphere Soils and Its Synergistic Antibacterial Effect against Xanthomonas oryzae pv. oryzae. J. Fungi 2020, 6, 181. [Google Scholar] [CrossRef]
  10. Xu, Y.; Zhu, X.-F.; Zhou, M.-G.; Kuang, J.; Zhang, Y.; Shang, Y.; Wang, J.-X. Status of Streptomycin Resistance Development in Xanthomonas oryzae pv. oryzae and Xanthomonas oryzae pv. oryzicola in China and Their Resistance Characters. J. Phytopathol. 2010, 158, 601–608. [Google Scholar] [CrossRef]
  11. Zhu, X.-F.; Xu, Y.; Peng, D.; Zhang, Y.; Huang, T.-T.; Wang, J.-X.; Zhou, M.-G. Detection and Characterization of Bismerthiazol-Resistance of Xanthomonas oryzae pv. oryzae. Crop Prot. 2013, 47, 24–29. [Google Scholar] [CrossRef]
  12. Yasmin, S.; Hafeez, F.Y.; Mirza, M.S.; Rasul, M.; Arshad, H.M.I.; Zubair, M.; Iqbal, M. Biocontrol of Bacterial Leaf Blight of Rice and Profiling of Secondary Metabolites Produced by Rhizospheric Pseudomonas aeruginosa BRp3. Front. Microbiol. 2017, 8, 1895. [Google Scholar] [CrossRef] [Green Version]
  13. Jin, P.; Wang, Y.; Tan, Z.; Liu, W.; Miao, W. Antibacterial Activity and Rice-Induced Resistance, Mediated by C15surfactin A, in Controlling Rice Disease Caused by Xanthomonas oryzae pv. oryzae. Pestic. Biochem. Physiol. 2020, 169, 104669. [Google Scholar] [CrossRef]
  14. Ji, G.-H.; Wei, L.-F.; He, Y.-Q.; Wu, Y.-P.; Bai, X.-H. Biological Control of Rice Bacterial Blight by Lysobacter antibioticus Strain 13-1. Biol. Control 2008, 45, 288–296. [Google Scholar] [CrossRef]
  15. Chithrashree; Udayashankar, A.C.; Chandra Nayaka, S.; Reddy, M.S.; Srinivas, C. Plant Growth-Promoting Rhizobacteria Mediate Induced Systemic Resistance in Rice against Bacterial Leaf Blight Caused by Xanthomonas oryzae pv. oryzae. Biol. Control 2011, 59, 114–122. [Google Scholar] [CrossRef]
  16. Kim, S.-M.; Reinke, R.F. A Novel Resistance Gene for Bacterial Blight in Rice, Xa43(t) Identified by GWAS, Confirmed by QTL Mapping Using a Bi-Parental Population. PLoS ONE 2019, 14, e0211775. [Google Scholar] [CrossRef] [Green Version]
  17. Bakade, R.; Ingole, K.D.; Deshpande, S.; Pal, G.; Patil, S.S.; Bhattacharjee, S.; Prasannakumar, M.K.; Ramu, V.S. Comparative Transcriptome Analysis of Rice Resistant and Susceptible Genotypes to Xanthomonas oryzae pv. oryzae Identifies Novel Genes to Control Bacterial Leaf Blight. Mol. Biotechnol. 2021, 63, 719–731. [Google Scholar] [CrossRef] [PubMed]
  18. Cai, L.; Cao, Y.; Xu, Z.; Ma, W.; Zakria, M.; Zou, L.; Cheng, Z.; Chen, G. Transcription Activator-Like Effector Tal7 of Xanthomonas oryzae pv. oryzicola Activates Rice Gene Os09g29100 to Suppress Rice Immunity. Sci. Rep. 2017, 7, 5089. [Google Scholar] [CrossRef] [Green Version]
  19. Busungu, C.; Taura, S.; Sakagami, J.-I.; Anai, T.; Ichitani, K. High-Resolution Mapping and Characterization of xa42, a Resistance Gene against Multiple Xanthomonas oryzae pv. oryzae Races in Rice (Oryza sativa L.). Breed. Sci. 2018, 68, 188–199. [Google Scholar] [CrossRef] [Green Version]
  20. Acquaah, G. Principles of Plant Genetics and Breeding; Blackwell Pub.: Malden, MA, USA; Oxford, UK, 2007. [Google Scholar]
  21. Huang, N.; Angeles, E.R.; Domingo, J.; Magpantay, G.; Singh, S.; Zhang, G.; Kumaravadivel, N.; Bennett, J.; Khush, G.S. Pyramiding of Bacterial Blight Resistance Genes in Rice: Marker-Assisted Selection Using RFLP and PCR. Theor. Appl. Genet. 1997, 95, 313–320. [Google Scholar] [CrossRef]
  22. Wang, S.; Liu, W.; Lu, D.; Lu, Z.; Wang, X.; Xue, J.; He, X. Distribution of Bacterial Blight Resistance Genes in the Main Cultivars and Application of Xa23 in Rice Breeding. Front. Plant Sci. 2020, 11, 555228. [Google Scholar] [CrossRef]
  23. Mew, T.; Vera Cruz, C.; Medalla, E. Changes in Race Frequency of Xanthomonas oryzae pv. oryzae in Response to Rice Cultivars Planted in the Philippines. Plant Dis. 1992, 76, 1029–1032. [Google Scholar]
  24. Sahu, A.; Das, A.; Saikia, K.; Barah, P. Temperature Differentially Modulates the Transcriptome Response in Oryza sativa to Xanthomonas oryzae pv. oryzae Infection. Genomics 2020, 112, 4842–4852. [Google Scholar] [CrossRef]
  25. Webb, K.M.; Oña, I.; Bai, J.; Garrett, K.A.; Mew, T.; Vera Cruz, C.M.; Leach, J.E. A Benefit of High Temperature: Increased Effectiveness of a Rice Bacterial Blight Disease Resistance Gene. New Phytol. 2010, 185, 568–576. [Google Scholar] [CrossRef] [PubMed]
  26. Hu, K.-M.; Qiu, D.-Y.; Shen, X.-L.; Li, X.-H.; Wang, S.-P. Isolation and Manipulation of Quantitative Trait Loci for Disease Resistance in Rice Using a Candidate Gene Approach. Mol. Plant 2008, 1, 786–793. [Google Scholar] [CrossRef] [Green Version]
  27. Ramalingam, J.; Vera Cruz, C.M.; Kukreja, K.; Chittoor, J.M.; Wu, J.-L.; Lee, S.W.; Baraoidan, M.; George, M.L.; Cohen, M.B.; Hulbert, S.H.; et al. Candidate Defense Genes from Rice, Barley, and Maize and Their Association with Qualitative and Quantitative Resistance in Rice. Mol. Plant-Microbe Interact. 2003, 16, 14–24. [Google Scholar] [CrossRef] [Green Version]
  28. Li, Z.K.; Arif, M.; Zhong, D.B.; Fu, B.Y.; Xu, J.L.; Domingo-Rey, J.; Ali, J.; Vijayakumar, C.H.M.; Yu, S.B.; Khush, G.S. Complex Genetic Networks Underlying the Defensive System of Rice (Oryza sativa L.) to Xanthomonas oryzae pv. oryzae. Proc. Natl. Acad. Sci. USA 2006, 103, 7994–7999. [Google Scholar] [CrossRef] [PubMed] [Green Version]
  29. Noda, T.; Ohuchi, A. A New Pathogenic Race of Xanthomonas campestris pv. oryzae and Inheritance of Resistance of Differential Rice Variety, Te-Tep to It. Jpn. J. Phytopathol. 1989, 55, 201–207. [Google Scholar] [CrossRef] [Green Version]
  30. Busungu, C.; Taura, S.; Sakagami, J.-I.; Ichitani, K. Identification and Linkage Analysis of a New Rice Bacterial Blight Resistance Gene from XM14, a Mutant Line from IR24. Breed. Sci. 2016, 66, 636–645. [Google Scholar] [CrossRef] [Green Version]
  31. Msami, J.A.; Kawaguchi, Y.; Ichitani, K.; Taura, S. Linkage Analysis of Rice Bacterial Blight Resistance Gene xa20 in XM6, a Mutant Line from IR24. Breed. Sci. 2021, 71, 144–154. [Google Scholar] [CrossRef]
  32. McCouch, S.R.; Cho, Y.G.; Yano, M.; Paul, E.; Blinstrub, M.; Morishima, H.; Kinosita, T. Report on QTL Nomenclature. Rice Genet. Newsl. 1997, 14, 11–13. [Google Scholar]
  33. Yamazaki, Y.; Sakaniwa, S.; Tsuchiya, R.; Nonomura, K.-I.; Kurata, N. Oryzabase: An Integrated Information Resource for Rice Science. Breed. Sci. 2010, 60, 544–548. [Google Scholar] [CrossRef] [Green Version]
  34. Iwata, H.; Ninomiya, S. AntMap: Constructing Genetic Linkage Maps Using an Ant Colony Optimization Algorithm. Breed. Sci. 2006, 56, 371–377. [Google Scholar] [CrossRef] [Green Version]
  35. Kosambi, D.D. The Estimation of Map Distances from Recombination Values; Kosambi, D.D., Ramaswamy, R., Eds.; Springer: New Delhi, India, 2016. [Google Scholar] [CrossRef]
  36. Vikal, Y.; Bhatia, D. Genetics and Genomics of Bacterial Blight Resistance in Rice. In Advances in International Rice Research; Li, J., Ed.; IntechOpen: London, UK, 2017. [Google Scholar] [CrossRef] [Green Version]
  37. Chukwu, S.C.; Rafii, M.Y.; Ramlee, S.I.; Ismail, S.I.; Hasan, M.M.; Oladosu, Y.A.; Magaji, U.G.; Akos, I.; Olalekan, K.K. Bacterial Leaf Blight Resistance in Rice: A Review of Conventional Breeding to Molecular Approach. Mol. Biol. Rep. 2019, 46, 1519–1532. [Google Scholar] [CrossRef] [PubMed]
  38. Kobayashi, A.; Hori, K.; Yamamoto, T.; Yano, M. Koshihikari: A Premium Short-Grain Rice Cultivar—Its Expansion and Breeding in Japan. Rice 2018, 11, 15. [Google Scholar] [CrossRef] [PubMed] [Green Version]
  39. Broman, K.W.; Sen, S. A Guide to QTL Mapping with R/Qtl; Statistics for Biology and Health; Springer: New York, NY, USA, 2009. [Google Scholar]
  40. Djedatin, G.; Ndjiondjop, M.-N.; Sanni, A.; Lorieux, M.; Verdier, V.; Ghesquiere, A. Identification of Novel Major and Minor QTLs Associated with Xanthomonas oryzae pv. oryzae (African Strains) Resistance in Rice (Oryza sativa L.). Rice 2016, 9, 18. [Google Scholar] [CrossRef] [PubMed] [Green Version]
  41. Huerta, A.I.; Delorean, E.E.; Bossa-Castro, A.M.; Tonnessen, B.W.; Raghavan, C.; Corral, R.; Pérez-Quintero, Á.L.; Leung, H.; Verdier, V.; Leach, J.E. Resistance and Susceptibility QTL Identified in a Rice MAGIC Population by Screening with a Minor-effect Virulence Factor from Xanthomonas oryzae pv. oryzae. Plant Biotechnol. J. 2021, 19, 51–63. [Google Scholar] [CrossRef]
  42. Kawahara, Y.; de la Bastide, M.; Hamilton, J.P.; Kanamori, H.; McCombie, W.R.; Ouyang, S.; Schwartz, D.C.; Tanaka, T.; Wu, J.; Zhou, S.; et al. Improvement of the Oryza sativa Nipponbare Reference Genome Using Next Generation Sequence and Optical Map Data. Rice 2013, 6, 4. [Google Scholar] [CrossRef] [Green Version]
  43. Blair, M.W.; Garris, A.J.; Iyer, A.S.; Chapman, B.; Kresovich, S.; McCouch, S.R. High Resolution Genetic Mapping and Candidate Gene Identification at the xa5 Locus for Bacterial Blight Resistance in Rice (Oryza sativa L.). Theor. Appl. Genet. 2003, 107, 62–73. [Google Scholar] [CrossRef]
  44. Wu, X.; Li, X.; Xu, C.; Wang, S. Fine Genetic Mapping of xa24, a Recessive Gene for Resistance against Xanthomonas oryzae pv. oryzae in Rice. Theor. Appl. Genet. 2008, 118, 185–191. [Google Scholar] [CrossRef]
  45. Temnykh, S.; Park, W.D.; Ayres, N.; Cartinhour, S.; Hauck, N.; Lipovich, L.; Cho, Y.G.; Ishii, T.; McCouch, S.R. Mapping and Genome Organization of Microsatellite Sequences in Rice (Oryza sativa L.). Theor. Appl. Genet. 2000, 100, 697–712. [Google Scholar] [CrossRef]
  46. Hu, K.; Cao, J.; Zhang, J.; Xia, F.; Ke, Y.; Zhang, H.; Xie, W.; Liu, H.; Cui, Y.; Cao, Y.; et al. Improvement of Multiple Agronomic Traits by a Disease Resistance Gene via Cell Wall Reinforcement. Nat. Plants 2017, 3, 17009. [Google Scholar] [CrossRef]
  47. Fukuoka, S.; Saka, N.; Koga, H.; Ono, K.; Shimizu, T.; Ebana, K.; Hayashi, N.; Takahashi, A.; Hirochika, H.; Okuno, K.; et al. Loss of Function of a Proline-Containing Protein Confers Durable Disease Resistance in Rice. Science 2009, 325, 998–1001. [Google Scholar] [CrossRef]
  48. Fonseca, J.P.; Mysore, K.S. Genes Involved in Nonhost Disease Resistance as a Key to Engineer Durable Resistance in Crops. Plant Sci. 2019, 279, 108–116. [Google Scholar] [CrossRef] [PubMed]
  49. Taura, S.; Ogawa, T.; Yoshimura, A.; Omura, T. Induction of Mutants Resistant to Bacterial Blight in Rice. Jpn. J. Breed. 1991, 41, 279–288. [Google Scholar] [CrossRef] [Green Version]
  50. Ogawa, T.; Yamamoto, T.; Khush, G.S.; Mew, T.-W. Breeding of Near-Isogenic Lines of Rice with Single Genes for Resistance to Bacterial Blight Pathogen (Xanthomonas campestris pv. oryzae). Jpn. J. Breed. 1991, 41, 523–529. [Google Scholar] [CrossRef] [Green Version]
  51. Wakimoto, S. Classification of Strains of Xanthomonas oryzae on the Basis of Their Susceptibility against Bacteriophages. Jpn. J. Phytopathol. 1960, 25, 193–198. [Google Scholar] [CrossRef]
  52. Kauffman, H. An Improved Technique for Evaluating Resistance of Rice Varieties to Xanthomonas oryzae. Plant Rep. 1973, 57, 537–541. [Google Scholar]
  53. Kim, S.-M. Identification of Novel Recessive Gene Xa44(t) Conferring Resistance to Bacterial Blight Races in Rice by QTL Linkage Analysis Using an SNP Chip. Theor. Appl. Genet. 2018, 131, 2733–2743. [Google Scholar] [CrossRef] [Green Version]
  54. Dellaporta, S.L.; Wood, J.; Hicks, J.B. A Plant DNA Minipreparation: Version II. Plant Mol. Biol. Rep. 1983, 1, 19–21. [Google Scholar]
  55. Panaud, O.; Chen, X.; McCouch, S.R. Development of Microsatellite Markers and Characterization of Simple Sequence Length Polymorphism (SSLP) in Rice (Oryza sativa L.). Mol. Gen. Genet. 1996, 252, 597–607. [Google Scholar] [CrossRef]
  56. Chen, X.; Temnykh, S.; Xu, Y.; Cho, Y.G.; McCouch, S.R. Development of a Microsatellite Framework Map Providing Genome-Wide Coverage in Rice (Oryza sativa L.). Theor. Appl. Genet. 1997, 95, 553–567. [Google Scholar] [CrossRef]
  57. McCouch, S.R.; Teytelman, L.; Xu, Y.; Lobos, K.B.; Clare, K.; Walton, M.; Fu, B.; Maghirang, R.; Li, Z.; Xing, Y.; et al. Development and Mapping of 2240 New SSR Markers for Rice (Oryza sativa L.). DNA Res. Int. J. Rapid Publ. Rep. Genes Genomes 2002, 9, 199–207. [Google Scholar] [CrossRef]
  58. Ichitani, K.; Taura, S.; Tezuka, T.; Okiyama, Y.; Kuboyama, T. Chromosomal Location of HWA1 and HWA2, Complementary Hybrid Weakness Genes in Rice. Rice 2011, 4, 29–38. [Google Scholar] [CrossRef] [Green Version]
  59. Kuboyama, T.; Saito, T.; Matsumoto, T.; Wu, J.; Kanamori, H.; Taura, S.; Sato, M.; Marubashi, W.; Ichitani, K. Fine Mapping of HWC2, a Complementary Hybrid Weakness Gene, and Haplotype Analysis Around the Locus in Rice. Rice 2009, 2, 93–103. [Google Scholar] [CrossRef] [Green Version]
  60. Toyomoto, D.; Uemura, M.; Taura, S.; Sato, T.; Henry, R.; Ishikawa, R.; Ichitani, K. Segregation Distortion Observed in the Progeny of Crosses Between Oryza sativa and O. meridionalis Caused by Abortion During Seed Development. Plants 2019, 8, 398. [Google Scholar] [CrossRef] [Green Version]
  61. International Rice Genome Sequencing Project (IRGSP). The map-based sequence of the rice genome. Nature 2005, 436, 793–800. Available online: https://pubmed.ncbi.nlm.nih.gov/16100779/ (accessed on 9 March 2021).
  62. Rice Genome Research Program. Available online: https://rgp.dna.affrc.go.jp/E/publicdata/caps/index.html (accessed on 4 February 2021).
  63. Broman, K.W.; Wu, H.; Sen, S.; Churchill, G.A. R/Qtl: QTL Mapping in Experimental Crosses. Bioinformatics 2003, 19, 889–890. [Google Scholar] [CrossRef] [Green Version]
Figure 1. Morphology of lesion length at 18 days for KO (parent 1 (P1)) and AR (parent 2 (P2)) and its F2 progenies inoculated to Race II Xoo (strain T7147) showing short lesion length, moderate lesion length (MLL), and long lesion length.
Plants 11 00867 g001
Figure 2. Frequency distribution of lesion length after inoculating with Xoo Race II (strain T7147) using leaf-clipping method after 18 days in the F2 population (n =216) derived from the cross between KO and AR. Three leaf measurements from each plant were recorded. An average of three leaves was used as a phenotypic characteristic.
Plants 11 00867 g002
Figure 3. Plotting of LOD scores for QTL analysis at 99% tile threshold using “hk” regression method. The blue line data were calculated using simple interval mapping (SIM). The red line data show calculated LOD using a composite interval mapping (CIM) approach with stepwise covariate addition within the regression model.
Plants 11 00867 g003
Figure 4. Banding pattern of linked marker E60663 on chromosome 5 with the highest likelihood ratio of putative QTL under SIM and CIM. K represents Koshihikari banding profile; H is denoted as heterozygous while I banding pattern follows ARC7013 in F2 population. In the middle of the gel, a control ladder containing both parents is loaded and labelled as red.
Plants 11 00867 g004
Figure 5. An associative map comparing the QTLs against Xoo pathogen in this study with Xoo resistance genes published before. The left vertical categorized light blue thick lines represent the Nipponbare physical map [33] of chromosomes 2, 5, and 10 and are linked to the genetic map on the right showing DNA markers for QTLs controlling elongation of lesion length, which is constructed using AntMap [34] with the Kosambi function [35]. The chromosomes are represented as dark grey bars with SSR, InDel markers used in this work are presented on the right side. The genetic distance (cM) is indicated at the left of the bar. QTLs found in this study are shown as red boxes; the Bayesian 99% interval of QTLs is represented as filled-in white within the chromosome bars. The nearest genetic marker to QTLs discovered in this study is underlined with green. Markers that are significant at the 0.001, 0.01, and 0.05 probability level are marked with ***, **, *, respectively. The previously published QTL genes that are not fine mapped are labelled as vertical blue and purple lines indicating the confidence interval. R resistance genes associated with BB resistance are shown as black lines on chromosomes of interest for this study.
Plants 11 00867 g005
Figure 6. Frequency distribution of lesion length genotypic expression on chromosome 5 after PCR analysis of F2 progenies derived from KO × AR, which gave the maximum strength of evidence for the presence of QTL at this position using both SIM and CIM methods. The classified genotypes were assessed using E60663 as indicated: yellow, homozygous for KO; grey, heterozygous; blue, homozygous for AR.
Plants 11 00867 g006
Table 1. Average of lesion length (cm) reactions of rice accessions: Koshihikari and ARC7013 after inoculation with five Japanese races of Xanthomonas oryzae pv. oryzae.
Lesion Length (cm)
Rice AccessionRace I T7174Race II T7147Race III T7133Race IV H75373Race V H75304
Koshihikari Japan14.913.513.510.117.7
ARC7013 India40.548.543.343.354.0
Table 2. QTLs controlling lesion length after inoculation of Xoo race II.
QTLChr.Nearest MarkerLod Scores Using
(SIM) a & (CIM) b
QTL cM (CI) cR2%
SIM d
Additive Effect eDominance Effect fDPE g
qXAR22RM3515(2.4) a; (3.1) b75.8 (75.8–89.8)3.9−2.82.5KO **
qXAR55E60663(11.6) a; (14.0) b79.0 (72.9–82.9)20.5−7.01.8KO ***
qXAR1010KGR10M40(1.4) a; (3.4) b51.0 (50.2–51.9)2.32.30.4AR *
a Simple interval mapping for LOD score of putative QTLs; b Composite interval mapping for detecting multiple QTLs on a genome; c CI, Confidence interval, 99% confidence interval for detected QTLs location on the chromosome region; d The proportion of variance explained by the QTL; e Negative and positive standards indicate additive lesion length-inhibiting effect contributed by KO and AR alleles, respectively; f Positive values mean dominance toward AR alleles; g Direction of phenotypic effect where KO and AR indicate that the Koshihikari and ARC7013 alleles reduce lesion progression values, respectively. Markers that are significant at the 0.001, 0.01, and 0.05 probability level are denoted as ‘***’, ‘**’, and ‘*’, respectively.
Publisher’s Note: MDPI stays neutral with regard to jurisdictional claims in published maps and institutional affiliations.

