Article

Molecular Characterization, Evolutionary Analysis, and Expression Profiling of BOR Genes in Important Cereals

1
Department of Botany, Panjab University, Chandigarh 160014, India
2
Department of Bio-Technology, I.K. Gujral Punjab Technical University, Kapurthala 144603, India
3
National Institute of Plant Genome Research, Aruna Asaf Ali Marg, New Delhi 110067, India
4
Department of Biotechnology, SUSCET, Tangori, Mohali 140306, India
5
Centre for Infectious Disease and Vector Research, Department of Nematology, Institute for Integrative Genome Biology, University of California Riverside, Riverside, CA 92521, USA
6
Plant Molecular Biology and Genetic Engineering Department, CSIR-National Botanical Research Institute, Council of Scientific and Industrial Research, Lucknow 226001, India
7
Academy of Scientific and Innovative Research (AcSIR), Ghaziabad 201002, India
*
Author to whom correspondence should be addressed.
These authors contributed equally to this work.
Plants 2022, 11(7), 911; https://doi.org/10.3390/plants11070911
Submission received: 28 February 2022 / Revised: 27 March 2022 / Accepted: 27 March 2022 / Published: 29 March 2022
(This article belongs to the Section Plant Genetics, Genomics and Biotechnology)

Abstract

:
Boron (B) is an essential micronutrient of plants. Plants grapple with a narrow range of B between its toxicity and deficiency. B homeostasis mechanism is required to rescue plants from such a quagmire. B transporters are specialized proteins involved in the homeostasis of B. In the present study, a total of 29 BOR genes were identified in five major cereals, including three BORs in each Brachypodium distachyon and Sorghum bicolor, four in Oryza sativa, six in Zea mays, and 13 in Triticum aestivum. Multiple sequence alignments, domain structure analyses, and phylogenetic analysis indicated the conserved nature of the BOR protein family. Duplication events and Ka/Ks analysis of TaBORs showed the role of segmental duplication events and purifying selection in the expansion of the BOR family in T. aestivum. Furthermore, in silico expression and co-expression analyses under biotic and abiotic stress conditions depicted their involvement in combating such conditions. Moreover, qRT-PCR of TaBORs in B treatment suggested the roles of BOR genes in B stress management. The present study hints at the conserved nature of BOR proteins and their different aspects. The study will lay down a way for several crop improvement programs.

1. Introduction

Boron (B) is an essential nutrient for plants. It is known for its role in stabilizing the molecules with cis diol groups [1,2]. B plays a pivotal role in cell wall strengthening, as it binds apiose residues in rhamnogalacturonan (RG-II) to cross-link pectic polysaccharides [2,3,4]. Furthermore, B is involved in multiple biological processes, including nucleic acid metabolism, assimilate partitioning, reproductive growth, and membrane integrity [2,5]. B is generally present in the form of water-soluble molecules in soil and absorbed by plants in the form of boric acid (H3BO3) and borate (B(OH)4) [1,5].
B deficiency, as well as the toxicity of B, can cause various diseases in plants [6,7]. B deficiency is manageable using B fertilizers; however, the toxicity of B is difficult to manage. Thus, a homeostasis mechanism of B is required in plants. Plants have three different mechanisms of B uptake, including passive diffusion, facilitated diffusion with the help of B channels, and active transport using B transporters (BORs) [1]. The majority of B transporters are exporters (effluxers), as B is exported from pericycle or endodermal cells into the xylem vessels for supplying B to the shoots and other parts [1,8]. Moreover, BORs transport B from endodermal cells, where the Casparian strip is present, to the xylem vessels. These are generally polarly localized and transport B in the form of borate (an anionic form of boric acid). The first B transporter, BOR1, was reported in Arabidopsis thaliana in 2002 by Takano et al. [9]. A mutant of BOR1, i.e., A. thaliana mutant bor1-1, when grown on a low B medium, showed a reduction in the size of rosette leaves and seed production, whereas it resumed normal growth after the employment of adequate B [9]. Moreover, ubiquitination-mediated vacuolar trafficking checks the BOR1 activity in order to combat high B conditions [10,11]. Another transporter, AtBOR4, is involved in the tolerance of high B conditions and is important for directional B transport from roots to soil to avoid B overaccumulation [12]. Hitherto, seven BOR genes have been reported in A. thaliana [13]. Furthermore, a number of BOR genes have been reported in different plants, including Brassica napus, Citrus macrophylla, Hordeum vulgare, Oryza sativa, Populus trichocarpa, Triticum aestivum, and Vitis vinifera [14,15,16,17,18,19,20,21]. Moreover, multiple BOR genes have been found to be involved in plant growth and stress tolerance [22,23]. For instance, the SiBOR1 gene of foxtail millet is suggested to be involved in cell wall integrity, cellular homeostasis, and panicle development [23]. Another gene, HvBOR2, is known for B tolerance properties in barley [15]. However, the majority of these studies are focused on the analyses of some specific BOR genes.
In this study, we have identified and characterized the BOR gene family in five major cereals, including Brachypodium distachyon, Oryza sativa, Sorghum bicolor, Triticum aestivum, and Zea mays. These were studied for their characteristic features, such as gene structure, exon-intron architecture, protein structure, physicochemical properties of BOR proteins, and cis-regulatory elements. To explore the evolutionary features of the BOR gene family, phylogenetic analysis, duplication event (DE) analysis, and Ka/Ks substitutions analysis were performed. Further, expression analysis in each cereal was carried out for various tissues during their developmental stages to unveil the functional characteristics of BOR transporters. Expression studies were also carried out for T. aestivum BOR (TaBOR) genes during biotic (Puccinia striiformis (Pst) and Blumeria graminis (Bgt)) and abiotic stress [heat stress (HS), drought stress (DS), combined heat-drought stress (HD), and salt stress] conditions to identify their possible roles in stress response. The qRT-PCR experiments of TaBOR genes under B stress were performed to understand their response to B stress. Co-expression analysis was done in each cereal to study the interaction of BORs to other transcripts of respective cereals. This study will provide a helping hand to various functional studies and crop improvement programs.

2. Results

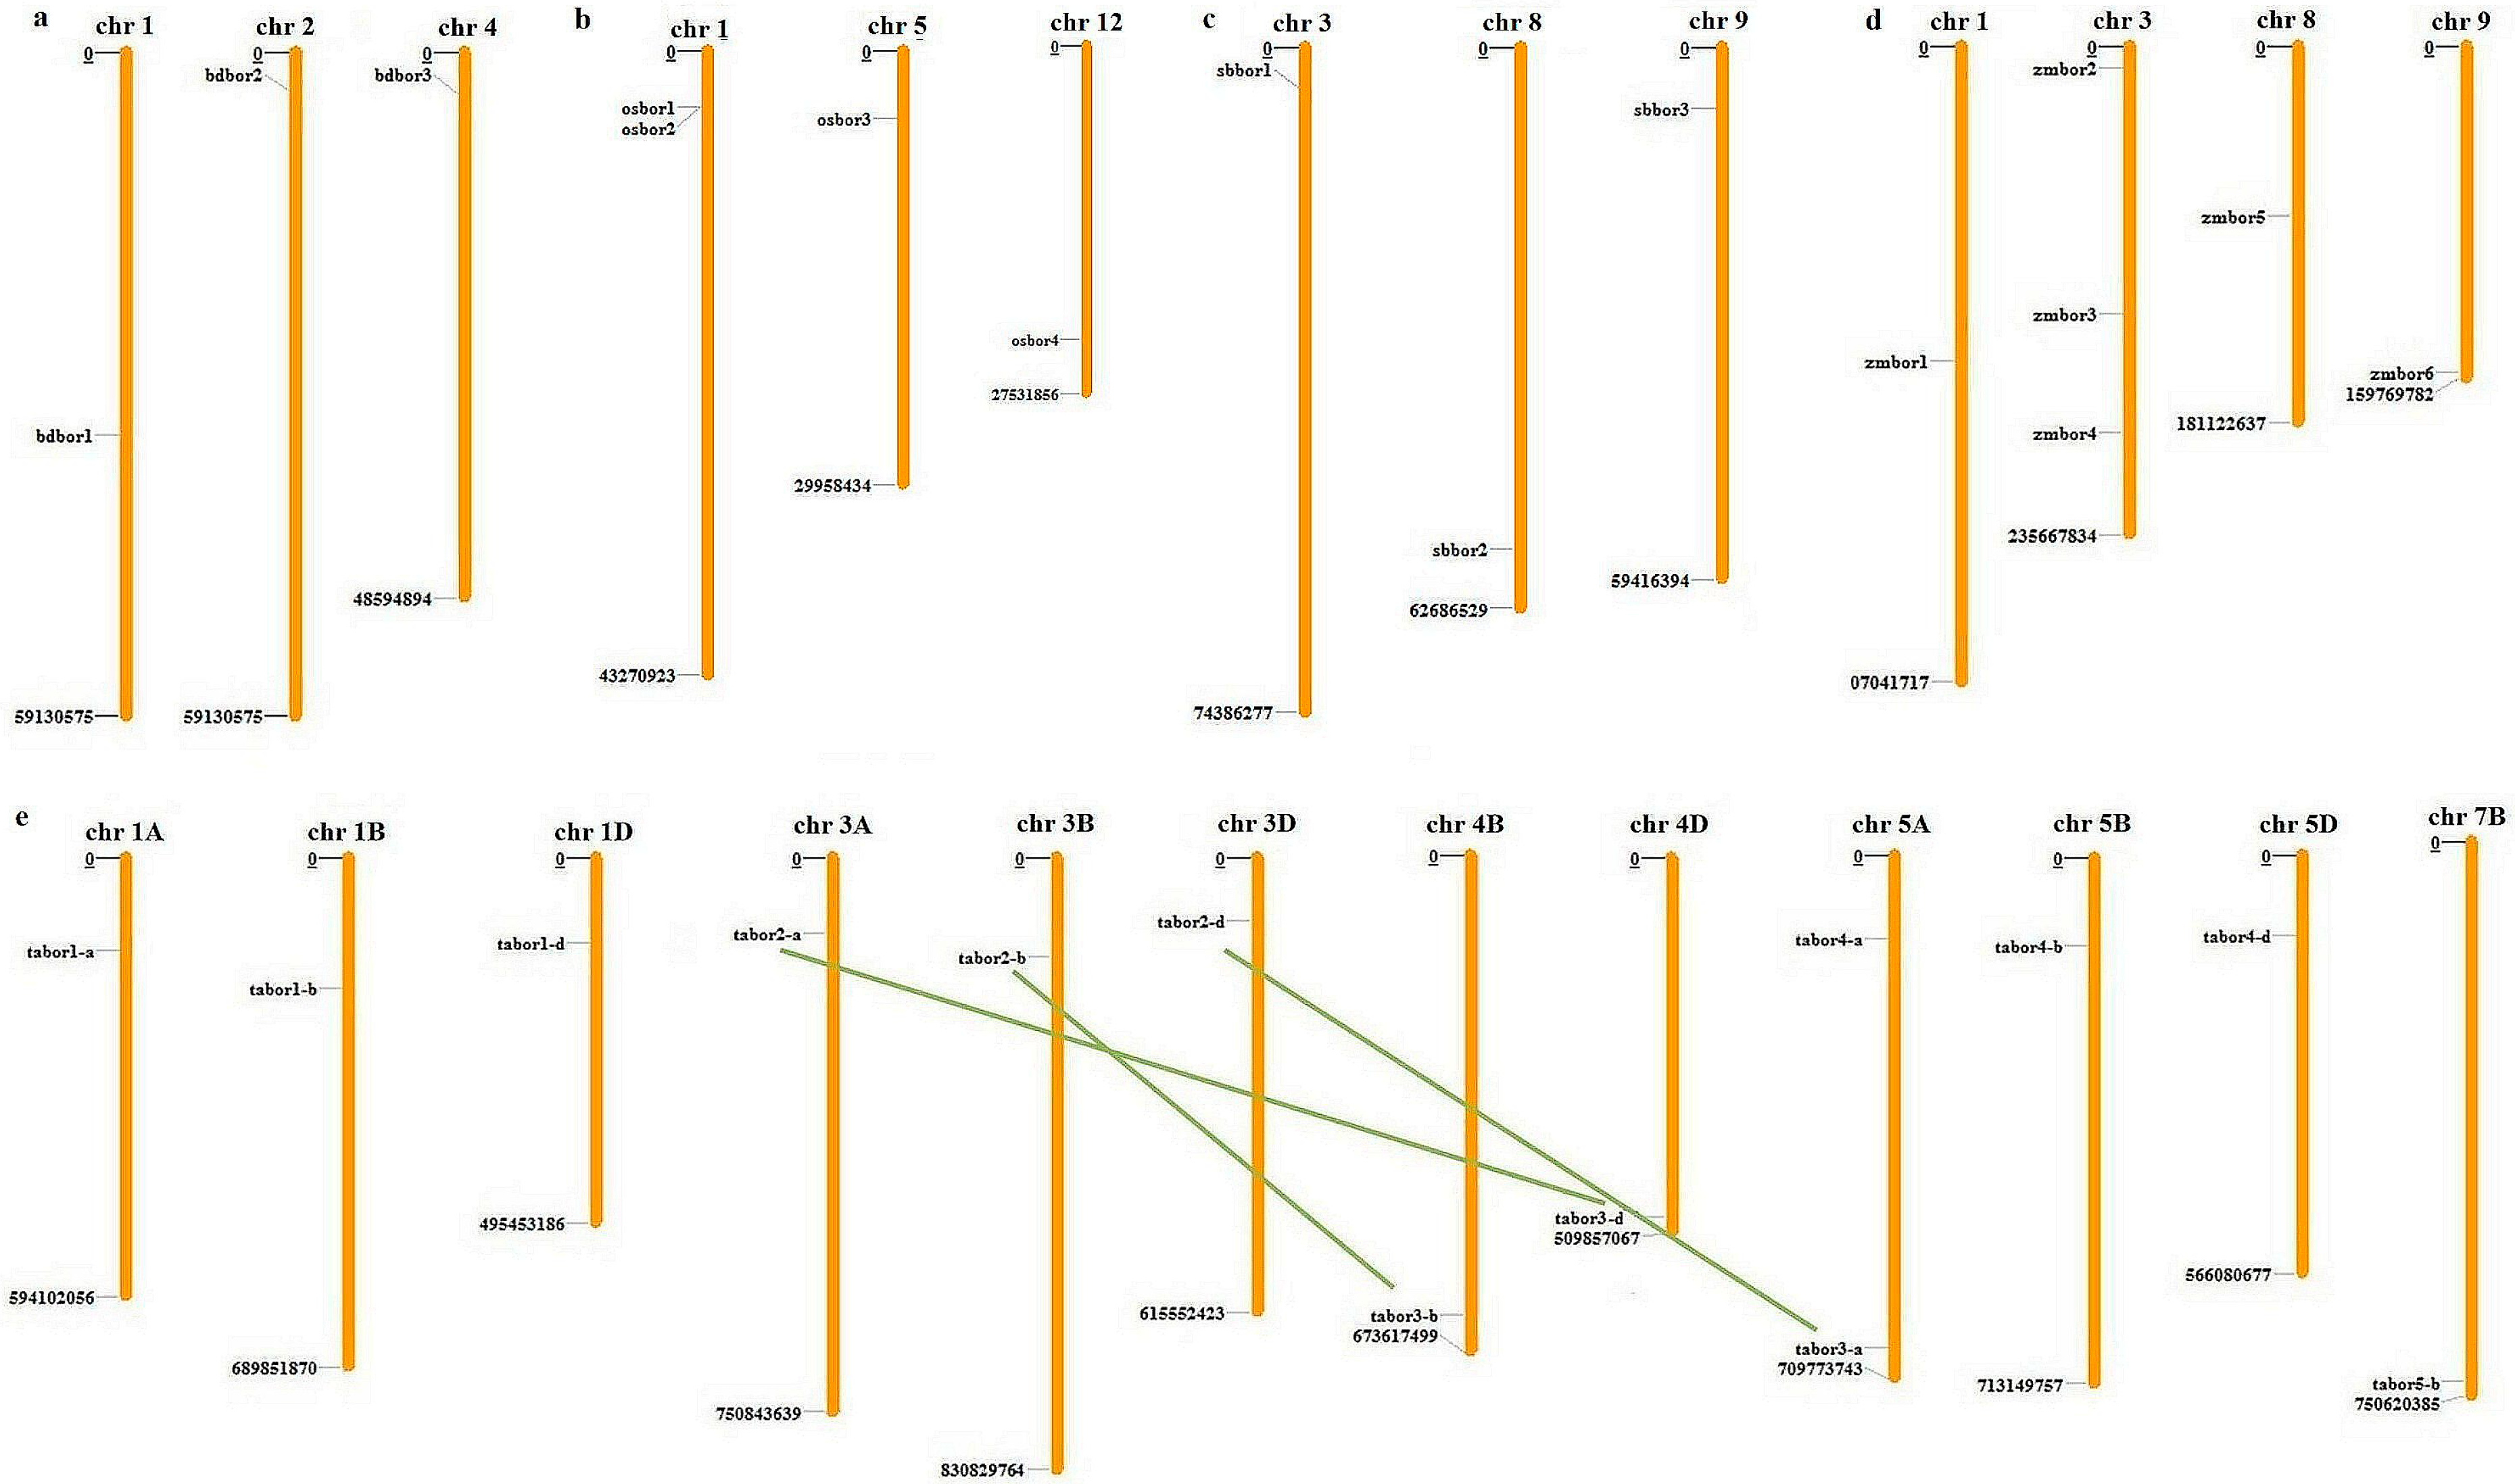
2.1. Identification, Distribution, and Paralogous Analysis of BOR Genes

Genome-wide identification of BORs in the five cereals resulted in a varied number of genes. (Figure 1a–e and Table S1). All the BOR proteins had a highly conserved anion exchanger bicarbonate (HCO3) domain. B. distachyon consisted of three BOR genes (BdBOR1, BdBOR2 and BdBOR3), which were present on chromosomes 1, 2, and 4, respectively (Figure 1a). In O. sativa, four BORs were located on three different chromosomes. OsBOR1 and OsBOR2 were present at chromosome 1, while OsBOR3 and OsBOR4 were present at chromosomes 5 and 12, respectively (Figure 1b). A total of three BORs were identified in S. bicolor. SbBOR1, SbBOR2, and SbBOR3 were distributed on the 3rd, 8th, and 9th chromosomes, respectively (Figure 1c). Six BORs were identified in Z. mays, where ZmBOR2, ZmBOR3, and ZmBOR4, were present on chromosome 3 and ZmBOR1, ZmBOR5, and ZmBOR6 were present on chromosomes 1, 8, and 9, respectively (Figure 1d). In the allohexaploid T. aestivum, a total of 13 BOR genes were identified. These genes were grouped into five different homeologous groups, including TaBOR1, 2, 3, 4, and 5 (Figure 1e). Most of the chromosomes possessed only one BOR gene each; however, chromosome 5A had two BOR genes. No BOR could be located on the 2nd and 6th chromosomes of all the subgenomes, on the 7th chromosome of the A and D subgenomes, and the 4th chromosome of the A subgenome. The subgenomic distribution analysis of TaBORs suggested nearly equal contribution of each A, B, and D subgenome, with 31%, 31%, and 38%, respectively. The paralogous analysis resulted in the prediction of three DEs in T. aestivum. All three DEs were found to be segmental duplication (Figure 1a–e and Table S2). None of the other cereals, including B. distachyon, O. sativa, S. bicolor, and Z. mays, showed any duplication event.

2.2. Multiple Sequence Alignment and Evolutionary Analysis

Multiple sequence alignment was performed to analyze the level of conservation among BOR proteins of selected cereals (Figure 2a,b and Figure S1). All the BOR-like sequences were found to be highly conserved. The sequences had some earlier reported motifs including “YxxM” and “FxxM” motifs [24] (Figure 2a). The conserved di-leucine motifs (E/DxxxLL/I) were exclusively present in AtBOR1, AtBOR2, TaBOR4-A, TaBOR4-B, TaBOR4-D, ZmBOR1, ZmBOR3, SbBOR2, and OsBOR4 (Figure 2a). Additionally, Lys590, which is also known to be a ubiquitination site, was conserved in these proteins along with AtBOR3 and AtBOR5 (Figure 2b).
Phylogenetic analysis of BOR proteins was carried out to understand their evolutionary relatedness. The phylogenetic tree remained tandem with the results of multiple sequence alignments. We could segregate the BOR proteins into two conventional groups, i.e., BOR1-like and BOR4-like proteins in the phylogenetic tree (Figure 2c). The identified homeologous and paralogous BORs were found to be tightly clustered in the same clade. Proteins including the TaBOR4 group, BdBOR3, OsBOR4, ZmBOR1, 3, SbBOR2 were present in the BOR1-like group, along with AtBOR1, AtBOR2 and AtBOR3 proteins. Proteins with di-leucine motifs and ubiquitination sites were exclusive to the BOR1-like group. All the other proteins, such as ZmBOR2, SbBOR1, TaBOR1 group, OsBOR2, and BdBOR1, were categorized in a BOR4-like group along with AtBOR4, AtBOR5, AtBOR6, and AtBOR7 of A. thaliana (Figure 2c).

2.3. Gene Structure Analysis

The gene structure analysis provided insights into the architecture of BOR genes. The results were arranged according to the phylogenetic relationship among the BOR genes (Figure 3a). The average number of exons in B. distachyon and S. bicolor was 12.7 in both cereals, separately. O. sativa and Z. mays had 12.5 and 12.2 average exons, respectively. The highest numbers of exons were present in T. aestivum, with an average of 13.2. The maximum and minimum numbers of exons were 15 and 6 in ZmBOR6 and ZmBOR5, respectively (Table S3). Intron analysis suggested that the majority of introns were present in phase 0, followed by phase 2 and phase 1, respectively. The average percentage shares of phases 0, 1, and 2 in all the cereals were 57%, 17%, and 26%, respectively, which again supported their conserved nature (Figure 3b).

2.4. Divergence Analysis

Divergence analysis was performed to find out various evolutionary aspects of the BOR genes. The values of Ka and Ks and their ratio were estimated for all three paralogous TaBORs (TaBOR2-A-TaBOR3-D, TaBOR2-B-TaBOR3-B, and TaBOR2-D-TaBOR3-A) to analyze the evolutionary discretion among the duplicated TaBOR genes. The negative Ka/Ks value of all three pairs, i.e., value < 1, suggested negative or purifying selection pressure during the evolution (Table 1). The range of divergence time of paralogous TaBORs, calculated using Ks value, was 23.7 to 25.2 million years ago (MYA) (Table 1). The Tajima’s relative rate test showed insignificant χ2 value for TaBOR2-A-TaBOR3-D, TaBOR2-B-TaBOR3-B, and TaBOR2-D-TaBOR3-A gene pairs at p-value > 0.05, thus following the molecular clock hypothesis, which states the equal rate of evolution among the gene pairs (Table 2) [25].

2.5. Protein Characterization

Protein characterization was performed to look more deeply into the various physicochemical aspects of BOR proteins (Table 3 and Table S3). The average lengths of BOR proteins of B. distachyon, O. sativa, S. bicolor, T. aestivum, and Z. mays were 683, 683, 684, 691, and 717 AA residues, respectively. The average MWs were 76.6, 76.7, 76.5, 77.2, and 80.2 kDa for BdBOR, OsBOR, SbBOR, TaBOR, and ZmBOR, respectively. Signal peptides were absent in the BOR proteins of all five cereals. The average pI values of both BdBOR and SbBOR, separately, were found to be eight, whereas 7.8, 7.6, and 8.2 were the average pI values for OsBOR, TaBOR, and ZmBOR proteins, respectively. The average GRAVY values of BdBOR, OsBOR, SbBOR, and TaBOR were found to be approximately 0.2 for each. However, the average GRAVY value for ZmBOR was 0.16. The bioinformatics’ tools, including CELLO, ngLOC, WoLFPSORT, and PROTCOMP, predicted the presence of all the BOR proteins in the plasma membrane (Table S4). In addition, ngLOC predicted localization of SbBOR2, BdBOR3, OsBOR4, ZmBOR1, ZmBOR3, and TaBOR4 in the plasma membrane or vacuole (Table S4).
A variety of tools were used to predict the transmembrane regions of BOR proteins. Around 9–12 transmembrane regions were predicted in BdBOR, OsBOR, and TaBOR proteins by Phobius and Protter; however, 8–10 and 5–12 TM regions were predicted in SbBORs and ZmBORs, respectively. TMHMM predicted 10–11 TM regions in BdBOR and TaBORs. Furthermore, 9–10, 9–11, and 5–10 TMs were predicted in OsBORs, SbBORs and ZmBORs, respectively. A minimum of 5 TMs were found in ZmBOR6, whereas a maximum of 12 TMs were predicted in BdBOR3, OsBOR3, ZmBOR1, TaBOR3-A, and TaBOR4 (Table 3 and Table S5). The majority of BOR proteins were bearing more than 10 transmembrane domains.
The domain architecture was explored to identify the domain structures present in BOR proteins. The domain analysis suggested the consistent presence of an anion exchanger bicarbonate (HCO3) domain in all the identified BOR proteins (Table S6). Interestingly, ZmBOR6 had another domain, i.e., the ANTH domain in addition to the HCO3 domain (Figure 4a). Furthermore, the MEME tool was used to analyze the 15 most conserved motifs in BOR proteins. A majority of the motifs were present in all the BOR proteins, including motifs 1, 2, 4, 5, 6, 11, 13, and 14. ZmBOR6 protein was void of motifs 3, 7, 8, 9, 10, and 15. Furthermore, motif 15 was found to be exclusive in SbBOR2, BdBOR3, OsBOR4, ZmBOR1, ZmBOR3, and TaBOR4 groups. Additionally, these proteins, along with SbBOR1, were found to be lacking motif 12 (Figure 4b).

2.6. Cis-Regulatory Elements

Promoter regions of BORs were analyzed for the presence of a diverse range of cis-regulatory elements. The regulatory elements were classified into four categories, including light-responsive, stress-responsive, hormone-responsive, and those involved in growth and development (Figure 4c and Table S7). AE-box, ATCT, BOX4, G-BOX, TCCC, as-1 motifs, etc., were some light-responsive elements. The stress-responsive elements found in BORs included A-box, ARE, LTR, MYB, MBS, STRE, WUN-motif, and W-box. Further, ABRE, AuxRR, ERE, GARE, P-box, TCA, etc., were found to be hormone-responsive elements. CAT box, CCGTCC, GCN4, RY element, O2-site, etc., were involved in the growth and development processes.

2.7. Expression Analysis of BOR Genes during Tissue Developmental Stages

Expression profiling of BOR genes was carried out to identify their putative involvement in tissue development. Expression analysis in B. distachyon showed discrete expression during the development stages of plants. The highest expression was observed during anther and pistil development (Figure 5a). BdBOR1 and BdBOR3 showed varied expression during almost all the stages. The least expression was seen in BdBOR2 during the tissue developmental stages of B. distachyon. The BdBOR3 gene showed the highest expression in the anther tissue. In O. sativa, OsBOR4 showed the highest expression in most of the tissue developmental stages. OsBOR3 showed the least expression among them. Overall, the highest expression was observed by the majority of genes in the reproductive organ stages (Figure 5b). Expression analysis of SbBORs revealed the noticeable expression of these genes in the anther, pistil, and flower development stages. SbBOR2 was the most-expressing gene during most of the tissue development stages (Figure 5c). The Z. mays BOR genes showed assorted expression during various developmental stages. ZmBOR1, ZmBOR2, ZmBOR3, and ZmBOR5 showed their highest expression during the development of female spikelet, embryo, and root tissues, and pollen tissues, respectively (Figure 5d). In the case of T. aestivum, a majority of the TaBORs were found to be downregulated or remained neutral during tissue development stages (Figure 5e). However, TaBOR4-A, B, and D showed differential expression during the majority of the developmental stages, with the highest expression in spike tissue. In addition, TaBOR5-B showed modulated expression during the root (z13 and z39) and stem (z30) development stages. Interestingly, the TaBOR1 and TaBOR2 group genes were significantly upregulated in spike and grain tissues. Moreover, the expression patterns of duplicated pairs (TaBOR2-A-TaBOR3-D, TaBOR2-B-TaBOR3-B, and TaBOR2-D-TaBOR3-A) were also compared to decipher the functional similarities among them (Figure 5i–k). One of the genes in each paralogous pair was high-expressing in certain developmental stages, especially in spike tissue, while the other gene in each pair was very low-expressing. The results revealed pseudo-functionalization of duplicated genes during the course of evolution.

2.8. Expression Analysis of TaBORs in Different Stress Conditions

To understand the possible roles of TaBOR genes in combating different biotic and abiotic stresses, the expression profiling of these genes was carried out using high throughput RNA-seq data. In addition, a qRT-PCR experiment was also performed to find the roles of TaBOR genes under B stress conditions. Under biotic stresses, expression analysis after the infestation of Bgt showed significant expression of TaBOR1-A and TaBOR1-D during all the stages of infestation. Among them, the highest expression was observed after 48 h of Bgt stress conditions (Figure 5f). In addition, TaBOR4-B was moderately upregulated and TaBOR2-D, TaBOR3-B, and TaBOR3-D were downregulated after the infestation of Bgt. During Pst infestation, TaBOR2-D showed high expression after 48 h and 72 h. A moderate expression was observed in TaBOR1-D, TaBOR3-B, and TaBOR4-B, D during the Pst infestation. In DS conditions, TaBOR2-A and TaBOR2-D were starkly upregulated during the first hour of treatment. However, all other genes showed either moderated or downregulated expression. In HS treatments, TaBOR2-A and TaBOR4-B were upregulated after 6 h of treatment. TaBOR1-B showed moderate expression under the HD conditions (Figure 5g). Under 1M NaCl stress, only TaBOR4-A, B, D and TaBOR5-B genes were upregulated. These genes showed modulated expression during the initial stages, i.e., 6 h and 12 h of salt stress, which was gradually reduced in later stages (Figure 5h). The highest upregulation was observed in TaBOR4-A after 12 h of salt stress treatment. This pattern suggested the role of TaBORs in saline stress.
The qRT-PCR experiment was performed to analyze the expression of TaBOR genes under very high B stress (20 mM boric acid) conditions (Figure 6a–i). Representatives of all five groups of TaBORs were randomly selected and studied using gene-specific primers (Table S8). TaBOR1-B showed higher expression during the later stages of stress. Furthermore, maximum upregulation was observed after 48 h and 24 h in shoots and roots, respectively (Figure 6a,b). In TaBOR2-A, the expression in roots was gradually increased in the later stages of B stress (Figure 6c). In shoots, the gene was upregulated in the initial stages of stress and downregulated at 24 and 48 h (Figure 6d). In the TaBOR3-D gene, downregulation was seen in the initial stages of the expression and upregulation was observed in the later stages of B stress in both roots and shoots (Figure 6e,f). The highest expression was observed in the roots after 24 h B stress. In TaBOR4-A, maximum upregulation was observed at 12 h of B stress in both roots and shoots (Figure 6g,h). In TaBOR5-B, upregulation was evident throughout the B stress in roots with maximum expression at 48 h of stress (Figure 6i). The qRT data for shoots of TaBOR5 was undetermined for all the B stress conditions, which might be due to their low expression in shoot tissues. The ANOVA test found significant changes between the treatment conditions in most of the genes.

2.9. Co-Expression Analysis

To analyze the interaction of BOR genes with other genes of respective cereal, co-expression analysis was performed for each cereal (Figure 7a–h and Table S9). In B. distachyon, BdBOR1 and BdBOR3 were interacting with a total of 44 transcripts (Figure 7a and Table S9). For example, AVLA5 (avenin-like a5), PXG (probable peroxygenase 5), SBT (subtilisin-like protease), HOX12 (homeobox-leucine zipper HOX12), and TLP7 (thaumatin TLP7). Furthermore, the gene ontology mapping suggested their involvement in the discrete process; for instance, hydrolase activity (GO:0016788), glutathione transferase activity (GO:0004364), biotic stress-responsive activity (GO:0042742, GO:0050832), and nutrient reservoir activity (GO:0045735). A total of 67 transcripts of O. sativa genome were co-expressing with OsBOR genes (Figure 7b and Table S9). OsBOR1 and OsBOR2 were expressed with the majority of the transcripts, suggesting their diverse functions. As per gene ontology, these genes might also be involved in nutrient reservoir activity (GO:0045735), manganese ion-binding (GO:0030145), chitinase activity (GO:0004568), iron-binding (GO:0005506), nucleic acid-binding (GO:0003676), etc. In S. bicolor, SbBOR2, and SbBOR3 interacted with 55 transcripts, including ERI2 (ERI1 exoribonuclease 2), DTF2 (factor of DNA methylation 2-like isoform X1), OMT (flavonoid O-methyltransferase), and LRR (leucine-rich repeat receptor kinase), and GSDL (GDSL esterase lipase), PRR4 (proline-rich 4), ADC (acyl-[acyl-carrier- ] desaturase chloroplastic-like), respectively (Figure 7c and Table S9). Gene ontology study suggested the roles of SbBORs in important cellular processes, including nitric oxide biosynthetic processes (GO:0006809), oxidoreductase activity (GO:0016491), fatty acid metabolic process (GO:0006631), and peroxidase activity (GO:0004601). In Zea mays, ZmBOR6 interacted with a majority of transcripts encoding various important proteins, including HMA (heave metal-associated), CHT (chitinase), and DFRA (dihydroflavonol 4-reductase) (Figure 7d and Table S9). ZmBORs are predicted to be involved in peroxidase activity (GO:0004601), defense response (GO:0006952), lipid transport (GO:0006869), hydrolase activity (GO:0016787), protein phosphatase inhibitor activity (GO:0004864), oxidoreductase activity (GO:0016491), etc. by GO mapping. In the case of T. aestivum, TaBOR genes were co-expressing with 504 other genes of T. aestivum (Figure 7e and Table S9). Interestingly, group 1 TaBOR genes showed interaction with the majority of co-expressed genes. For instance, TaBOR1-A gene was expressed along with more than 200 other genes, such as PLIM2B (LIM domain-containing PLIM2b-like), PMEI (pectinesterase inhibitor-like), CSLD3 (cellulose synthase D3), and RALF (rapid alkalinization factor-like). The TaBOR2 and TaBOR3 groups did not show the co-expressing trends with other genes. TaBOR5-B showed interaction with disease-resistance genes, including RPM1 and PIK2 genes (Figure 7e and Table S9).

3. Discussion

The BOR proteins were identified in B. distachyon, O. sativa, S. bicolor, T. aestivum, and Z. mays using extensive BLAST searches. All the identified proteins shared high homology with already-known seven BOR proteins (AtBORs) of A. thaliana, containing a conserved bicarbonate (HCO3) domain [1,14]. In a previous study, 20 BOR transporters homologous to AtBORs were identified in B. napus [20]. Furthermore, a recent study identified a similar number of BOR genes in B. distachyon, O. sativa, and S. bicolor [26], whereas a higher number of BOR genes were identified in Z. mays in the present study. The highest number of genes belonged to the genome of T. aestivum, which could be due to its bigger genome size (~17 Gb) and the allohexaploid (AABBDD) nature of its genome [27]. The number of identified genes in some of the other cereals was found to be consistent with the earlier studies [1,20,22,28]. Furthermore, the analysis of paralogous genes suggested the exclusive occurrence of segmental DEs in T. aestivum. The segmental DEs are known to play important roles in the expansion of various gene families, which might also be responsible for the higher number of BOR genes in T. aestivum [29,30]. Further, the Ka/Ks analysis calculated a divergence time of 23.7 to 25.2 MYA among the paralogous TaBOR genes, suggesting the occurrence of DEs before the hybridization events of A B and D subgenomes [27]. The expression analyses of paralogous TaBOR genes revealed the negligible expression of one gene as compared to the other in each duplicated gene pair, suggesting pseudo-functionalization.
Multiple sequence alignments (MSA) provide deep insights into protein architecture. In our study, MSA suggested the conserved nature of BORs in various plant species. Myriad studies have shown the level of conservation in tandem with our study [9,20,24]. Most of the earlier reported conserved regions in these studies were present in the newly identified BOR proteins. For instance, Takano et al. showed that A. thaliana BOR1 is an efflux type B transporter for xylem loading [9]. In their study, they replaced two conserved amino acids (also found to be conserved in our sequences) S and G with P and E, respectively. The presence of the same amino acid residues highlights the trueness of the multiple sequence alignment and the conservational trend. Interestingly, tyrosine-based and phenylalanine-based motifs were also present in the identified BORs and are known to be responsible for signaling processes [24]. The presence of an acidic di-leucine motif in the same loop region as the tyrosine-based motifs in the BOR1-like proteins was also previously reported [24]. The di-leucine motif is responsible for polarity and B-dependent vacuolar sorting of AtBOR1 under low B conditions, which can be conserved in the clade; thus, it can be a possible function of other proteins present in the BOR1-like group [24]. The BOR1-like proteins had a ubiquitination site at K590 residue, which was reported to be essential for degradation and vacuolar sorting of AtBOR1 in response to high B supply [11].
Phylogenetic analysis was performed to explore the evolutionary relatedness of these proteins. The phylogenetic tree was categorized into two broad conventional groups (BOR1-like and BOR4-like) based on their similarity with AtBOR1 and AtBOR4 proteins, and earlier reported studies. The proteins present in the BOR-1 like group shared similarities, such as an exclusive presence of the di-leucine motif. A few of these proteins were characterized independently in earlier studies. For instance, TaBOR1.1, TaBOR1.2, and TaBOR1.3 are reported to be efflux type B-transporters, which were renamed as TaBOR4-A, TaBOR4-B, and TaBOR4-D in our study and belong to the BOR1-like group [18]. Furthermore, the OsBOR1 protein (OsBOR4 in our study) was present closer to the TaBOR1 (TaBOR4 in our study) and AtBOR1 and shared similar clade and functions [1,14,24]. Based on these analyses and phylogenetic clustering, we could predict the possible functions of other protein members of this clade, including BdBOR3, ZmBOR1, ZmBOR3, and SbBOR2, which might function as efflux type B-transporters. However, further validation of these results is required for a concrete statement. In the BOR4-like proteins, the OsBOR3 (OsBOR4 in previous studies) is known to be a pollen-specific B efflux transporter [19]. Two O. sativa proteins, OsBOR1 and OsBOR2, were present in the vicinity of the majority proteins of T. aestivum as well as BdBOR2 of B. distachyon (Figure 2c). These OsBOR1 and OsBOR2 are reported to be efflux type B-transporters [1,14,15,19]. Furthermore, Reid et al. (2007) found that the TaBOR2 (accession no. EU220225) was closer to the O. sativa BOR proteins of this clade and was found to be responsible for B efflux from root cells under high B conditions [15]. The other proteins of the same clade in our study might also have similar functions and can be studied further for more clarity.
The genome architecture was explored in terms of exons and introns. The exons and introns were distributed almost uniformly in all the identified BOR genes. It was seen that the variation among the introns indicates the evolutionary trend of the genes [31]. However, the uniformity of introns in BORs suggested the conserved nature among them during the evolutionary process. Further, the majority of introns were present in phase 0 in each cereal (Figure 3b), which also evinced the evolutionary conservation of BOR genes. Similar gene architecture of BOR genes has also been carried out in other plant species [20,21]. For instance, an average of 11.6 exons were present in B. napus [20]. Furthermore, 10 to 12 introns were found in 9 BORs of poplar [21]. These studies reflect the conservative nature of BORs.
Physicochemical characterization, including peptide length, MW, pI, GRAVY, subcellular location, and transmembrane regions, was performed to analyze various characteristic features of BOR proteins. Additionally, the domain architecture and motif distribution were studied. Similar genome-wide studies have been performed in various other plants, which suggest results consistent with our study. For instance, the lengths of B. napus BORs were in the range of 660 AA to 738 AA and MW ranging from 74.67 kDa to 81.24 kDa [20]. In P. trichocarpa BORs, protein sizes ranged from 666 AA to 731 AA, with an average MW of 77.8 [21]. Furthermore, the GRAVY value of identified BOR proteins suggested the hydrophilic property of BOR proteins; however, a negative GRAVY value of ZmBOR6 suggested its possible hydrophobic nature. Except for ZmBOR6, all other BOR proteins had GRAVY values similar to those of BnBOR proteins [20]. The disparity might be attributed to the difference in the architecture of ZmBOR6 from all the other members.
The presence of BOR proteins in the plasma membrane was earlier reported in numerous studies [1,14,18]. Leaungthitikanchana et al. (2013) reported the presence of TaBOR1 proteins in the plasma membrane [18]. The SiBOR1 of Setaria italica was also found to encode a plasma membrane protein [23]. In the case of B. napus, the in silico tool WoLF PSORT suggested the localization of BORs in the plasma membrane, similar to our results. We used various tools to predict the localization of BOR proteins; a majority of them suggested the presence of BOR proteins in the plasma membrane. The membrane localization of these proteins further supports their role as transporters. Furthermore, in our study we found the similar pattern of the presence of transmembrane (TM) domains, as compared with different relevant studies. For instance, a majority of BORs in our study had more than 10 TMs. In P. trichocarpa, the number of TM domains was in the range of 10–12 [21]. AtBOR1 and OsBOR1 had 10 TM domains [14]. The domain architecture of BOR proteins revealed the similarity in the domain distribution among BORs. The signature HCO3 domain was uniformly distributed in all the studied BOR proteins. ZmBOR6, however, showed a distinct pattern, as it had an additional ANTH domain. This protein might be involved in pollen germination processes, as the ANTH domain is associated with pollen germination [32]. Motif analysis was performed to study the functional similarity pattern of BOR genes. The presence of common motifs in most of the BOR proteins of different plant species supports their functional conservation. In a previous study, Ozyigit et al. (2020) identified the five most conserved motifs in 18 different plant species. They suggested that these motifs can also be used as a signature in identifying BOR proteins in unidentified plant species [26]. Overall, the protein characterization study provided us an opportunity to examine the disparities and similarities among various characteristic features of these proteins.
The promoter region of each BOR was analyzed for the presence of cis-regulatory elements to obtain hints about their possible involvement in different processes. Several light-responsive, stress-responsive, hormone-responsive, and growth- and development-responsive elements were identified. The results suggested the assorted roles of BOR genes in various regulatory phenomena of plants. In a similar study, Chen et al. identified some cis-regulatory elements involved in the regulation of BOR genes in B. napus such as GATA and I-box. [20]. Furthermore, in a study on B. napus, WRKY transcription factors that bind to W-box were reported to be involved in response to B stress conditions [33].
The expression analyses of BOR genes were performed in tissue developmental stages and different biotic and abiotic stress conditions. The majority of these genes showed perceptible expression in various developmental stages, especially in reproductive organ development. The higher expression of BOR genes of all cereals in reproductive organs suggested their key roles in plant reproduction. In 2013, Tanaka et al. reported that the OsBOR4 was highly expressed in floral tissues. In another study, the BOR gene was reported to be involved in the developmental process of grapes [16]. Moreover, SiBOR1 was reported to be involved in the developmental processes of foxtail millet [23]. Furthermore, in our study, numerous genes, including OsBOR4, SbBOR2, TaBOR4 group, TaBOR5-B, ZmBOR1, and ZmBOR3, showed modulated expression in the roots; those genes are probably involved in B homeostasis in the root tissue. In a similar report, Chen et al. (2018) suggested the expression of BOR genes of B. napus in the root tissue [20]. Ostensibly, BOR genes might play roles in the development of reproductive tissues in almost all these studied plant species, which can be further validated in future studies. Expression trends of the paralogous gene pairs were also compared and analyzed in various tissue and development stages. All three pairs showed pseudo-functionalization. The nature of pseudo-functionalization rather than of neo-functionalization suggests their conserved function; however, that needs to be validated in future studies.
The expression profiling of TaBOR genes under different biotic and abiotic stress conditions provided important results. The modulated expression of a few TaBOR genes during fungal (Bgt and Pst) infestation and various abiotic stresses (HS, DS, HD, and salt) indicated their role in these stress conditions. Hitherto, we could not find any similar study that examined these aspects of BOR genes. Most of the studies were confined to exploring the expressional trends under B stress conditions. However, our study provides additional insight into their role in combating these biotic and abiotic stress conditions.
To study their differential expression pattern in boron stress, a qRT-PCR experiment was performed for five randomly selected TaBOR genes. The results provided intriguing patterns of expression of these genes during high B stress conditions. In an earlier study, Hua et al. (2017) reported the upregulation and downregulation of BOR genes under toxicity, as well as the deficiency of B in B. napus. The overall expression profiling revealed that BnaBORs were preferentially expressed in the roots of B. napus [34]. In another study, a research group performed a qRT-PCR analysis of TaBOR4-A, TaBOR4-B, and TaBOR4-D (named TaBOR1.1, TaBOR1.2, and TaBOR1.3, respectively, in the earlier study) under 1 mM B conditions [18]. The comparative study suggested the highest expression of TaBOR4-B under excess stress, albeit the expressions of the other two genes were perceptible. In our study, the TaBOR4-A gene was explored. It showed initial expression under very high B treatment, thereby indicating its possible role in combating B stress conditions. In another study, Nakagawa et al. (2007) reported the significant upregulation of OsBOR1, closest to the TaBOR5-B in the evolutionary tree, in roots [14]. In our analysis, it was observed that TaBOR5-B showed significant expression in roots. The results indicated that some of these genes are directly associated with the B homeostasis, which needs to be further validated individually in subsequent studies.
The co-expression analysis of BOR genes in each cereal was performed. In earlier studies, co-expression analysis has been used to determine brief indications about the involvement of genes in a variety of functions [35]. The interaction of BOR genes with other genes, such as LRRK, CPK, ACR, STY, and other kinases, suggests their roles in signaling processes. Furthermore, the genes interacting with TLP, LEA, chitinases, etc., indicate their involvement in the defense mechanisms. Moreover, the interaction of genes, such as peroxidases and ascorbate oxidases, evinces their roles in antioxidation pathways. The interactions of BORs with expansin genes indicate their involvement in cell-wall synthesis and integrity. Regulation of various hydrolytic enzymes and antioxidants was also reported earlier in the BOR genes of B. napus [34]. In addition, various co-expressing genes hint at the numerous indirect roles of BOR genes in regulations of different processes, and growth and development. The co-expression findings were also well supported by the analysis of cis-regulatory elements present in the BOR genes, where several elements important for hormone-responsive, stress-responsive, light-responsive, and growth- and development-responsive processes were discussed. However, the diverse roles of BOR genes should be validated individually in future studies.

4. Materials and Methods

4.1. Identification and Nomenclature of BOR Genes

The identification of BOR proteins in the genomes of B. distachyon, O. sativa, S. bicolor, T. aestivum, and Z. mays was done using standard methods [35,36]. BLASTp searches at e-value e−10 were performed against the genome of each cereal, separately, using known A. thaliana BOR sequences as the query sequences at the Ensembl Plants portal (https://plants.ensembl.org, accessed on 21 May 2020) [37]. The sequences with ≥90% query cover with significant similarity were considered for further study. HMMER and the Pfam BLAST searches [38] were performed to detect the presence of the conserved anion exchanger bicarbonate (HCO3) domain (PF00955). An NCBI conserved domain database BLAST search was also performed. All the BOR genes were named according to their chromosomal distribution except T. aestivum, the nomenclature of which was done according to standard international rules (http://wheat.pw.usda.gov/ggpages/wgc/98/Intro.html, accessed on 7 July 2020).

4.2. Chromosomal Mapping and Duplication Events

The chromosomal and sub-genomic positions of the genes of each cereal were retrieved from the Ensembl Plants portal. The identification of homeologous TaBOR genes was performed using the bidirectional BLAST search (e-value 10−10) with a sequence similarity of ≥90% and on the basis of localization on the homeologous chromosomes group of A, B, and D subgenomes [39]. The identified BOR genes were mapped to their respective chromosomes using MapInspect (http://www.plantbreeding.wur.nl/uk/software_mapinspect.html.2012, accessed on 30 June 2020). Duplication events (DEs) were identified using the bidirectional BLAST hit approach with sequence similarity ≥80%. The differentiation of segmental and tandem DEs was carried out on the basis of distance [40,41].

4.3. Multiple Sequence Alignment and Evolutionary Analysis

Multiple sequence alignment was performed using the MultAlin (http://multalin.toulouse.inra.fr/multalin/, accessed on 2 September 2020) and MUSCLE programs [42,43]. Full-length BOR protein sequences of A. thaliana, B. distachyon, O. sativa, S. bicolor, T. aestivum, and Z. mays were used for the construction of the phylogenetic tree. The MUSCLE program was used for the sequence alignment and an evolutionary tree was constructed using the MEGA X program with the neighbor-joining (NJ) method at the bootstrap value of 1000 [44].

4.4. Ka/Ks Substitutions

The ClustalOmega server was used to align protein and nucleotide sequences of duplicated genes [45]. Synonymous substitution per synonymous site (Ks) and non-synonymous substitution per non-synonymous site (Ka) and their ratio, i.e., Ka/Ks, were calculated using the PAL2NAL server [46,47]. The divergence time was calculated using the formula “T = Ks/2r,” where T represents the divergence time and r represents the divergence rate, which was assumed to be 6.5 × 10⁻⁹ for cereals [48].

4.5. Gene Structure Analysis

The genomic and coding sequences were aligned and analyzed for the exon-intron organization of the putative BOR genes. The number of exons and introns were retrieved from the Ensembl Plants portal for these genes. Pictorial representation was developed using the Gene Structure Display Server (GSDS 2.0) [49].

4.6. Promoter Analysis

An upstream region of around 1500 bp of each BOR gene was analyzed for the presence of various cis-regulatory elements. The PlantCARE [50] server was used to determine the different types of regulatory elements.

4.7. Protein Characterization

The Expasy tool and sequence manipulation suite (SMS) were used to compute the theoretical molecular weight (MW), isoelectric point (pI), and GRAVY value of identified BOR proteins of five cereals [51,52]. Transmembrane (TM) regions were predicted using Phobius, Protter, and TMHMM v.2.0 [53,54,55]. Subcellular localization was predicted using CELLO, WoLF PSORT, PROTCOMP, and ngLOC [56,57,58,59]. The SignalP was used for the prediction of signal peptides [60]. The SMART server was used for domain analysis, and the IBS server was used for pictorial representation [61]. Motifs of BOR proteins were computed using the Maximization for Motif Elicitation (MEME) version 4.11.4 [62].

4.8. Expression Profiling Studies

High throughput RNA-seq data were retrieved from the URGI database (urgi.versailles.inra.fr/files/RNASeqWheat/, 25 February 2019) and Expression ATLAS [63,64,65] for expression analysis. For T. aestivum, the expression data generated in replicates for various tissue development stages and under various abiotic and biotic stresses were used [66,67,68]. To analyze the tissue-specific expression in wheat, high throughput RNA-seq data (ERP004714) for the three developmental stages of root, stem, leaf, spike and grain tissues were used. RNA-seq data in duplicates (SRP045409) for one and six hours (h) treatments of heat (40 °C), drought (20% PEG 6000) and the combination of both heat and drought stresses were used for the analysis of TaBOR genes under abiotic stress conditions [67]. RNA-seq data for roots generated by Zhang et al. in triplicate for salt stress at 6, 12, 24, and 48 h were used for expression profiling of TaBOR genes under saline stress [68]. For expression analysis of TaBORs under biotic stresses, triplicate RNA-seq data (PRJNA243835) after the inoculation of Blumeria graminis f. sp. tritici (Bgt) and Puccinia striiformis f. sp. tritici (Pst) for one, two, and three days in seven-day-old seedlings were used [67]. The WheatExp server was used to validate the RNA-seq datasets [69]. Expression value was calculated in terms of FPKM value using the Trinity package [70]. Genes having fold values >2 in any of the stages were included for further analysis. Heat maps of expressed genes of cereals were generated using Hierarchical Clustering Explorer 3.5, clustered with the Euclidean distance method [71].

4.9. Co-Expression Analysis

Co-expression analysis of BOR genes was performed using the whole expression data of each cereal. CoExpress v.1.5 was used for co-expression analysis with the threshold value ≥ 0.9, correlation power 1 with 100 bootstraps [72]. Functional annotations of co-expressed BOR genes were carried out using Blast2GO [73]. Gephi 0.9.1 was used for the pictorial representation of interacting genes [74].

4.10. Plant Growth, Treatments, and qRT-PCR Experiment

T. aestivum (cv. Chinese spring) seeds were surface-sterilized using sodium hypochlorite (1.2%) in 10% ethanol. Sterilized seeds were washed with double autoclaved water and germinated on moist Whatman filter papers for 3–5 days. After transferring germinated seedlings to fresh phytaboxes, they were grown in a plant growth chamber. Seven-day-old seedlings were subjected to B stress (20 mM) for 6, 12, 24, and 48 h, separately. Seedlings grown in normal conditions were used as a control. The samples (roots and shoots) were collected, frozen in liquid nitrogen, and stored at −80 °C until further use. The samples were used for the isolation of total RNA using the SpectrumTM Plant Total RNA Kit (Sigma, Saint Louis, MI, USA). The contamination of genomic DNA was removed using the TURBO DNA-free™ Kit (Invitrogen, Carlsbad, CA, USA). Agarose gel electrophoresis and nanodrop quantification were used for qualitative and quantitative analysis of RNA, respectively. The cDNA was synthesized with one microgram of total RNA using the Superscript III First-Strand Synthesis Super-mix (Invitrogen, Carlsbad, CA, USA). Gene-specific primers of selected genes were used for the qRT-PCR experiment that was performed using the 7900 HT Fast Real-Time PCR System (Applied Biosystems) with SYBR Green [29]. The results were analyzed in the form of fold expression change by the delta-delta CT method (2−ΔΔCT) [75]. The expression of the ADP-ribosylation factor (TaARF1) was used as an internal control [76,77]. All the experiments were performed in three biological replicates and expressed as mean ± SD. The analysis of variance (ANOVA) at the 5% probability level was used to statistically analyze the data. A post hoc Tukey’s test was used to find the significant difference among the treatments (p < 0.05).

5. Conclusions

B is an essential micronutrient for plants. However, both the toxicity and the deficiency of B may lead to complications for the growth and development of plants. BOR transporters are specialized proteins entailed in the B uptake and homeostasis. The present study vets the BOR transporters present in the genome of five cereals, including B. distachyon, O. sativa, S. bicolor, T. aestivum, and Z. mays. A total of 29 genes identified in the studied cereals had a common bicarbonate domain (HCO3), which acted as a signature domain. Further, multiple sequence alignments provided a terse indication of high conservation among the BOR proteins. Evolutionary analyses indicated the role of DEs and purifying selection in the expansion of BOR gene family. Moreover, gene structure, protein structure, domain, and motif analyses showed the conserved architecture of BORs. To foresee functional aspects of BOR genes, several investigations, including cis-regulatory elements analysis, expression analysis, and co-expression analysis using high throughput RNA-seq data, were performed. These analyses suggested the possible role of BOR genes in different growth and developmental processes and stress-responsive activities apart from the B homeostasis. The qRT-PCR experiment performed under B-treated T. aestivum plants ascertained the involvement of the TaBOR genes in response to B stress conditions. However, further research is required to look more deeply into the BOR genes. The study will be ancillary for research into the BOR genes in different plants. The results will be helpful in various crop improvement programs.

Supplementary Materials

The following supporting information can be downloaded at: https://www.mdpi.com/article/10.3390/plants11070911/s1, Table S1: Nomenclature of BOR genes in B. distachyon, O. sativa, S. bicolor, T. aestivum, and Z. mays. Table S2: List of paralogous TaBOR genes. Table S3: Characterization of BOR genes and proteins in B. distachyon, O. sativa, S. bicolor, T. aestivum, and Z. mays. Table S4: Subcellular localization of BORs of B. distachyon, O. sativa, S. bicolor, T. aestivum, and Z. mays predicted by various tools. Table S5: Transmembrane regions of BORs of B. distachyon, O. sativa, S. bicolor, T. aestivum, and Z. mays predicted by different tools. Table S6: Domain analysis of BOR proteins of B. distachyon, O. sativa, S. bicolor, T. aestivum, and Z. mays. Table S7: Cis-regulatory elements in S. bicolor, B. distachyon, O. sativa, Z. mays, and T. aestivum, respectively. Brown, blue, green, and orange colors represent the light-responsive, hormone-responsive, stress-responsive and growth- and development-related cis-regulated elements, respectively. Table S8: qRT-PCR primers of TaBOR genes and TaARF gene. Table S9: Annotation and abbreviation of co-expressed genes of T. aestivum during various tissue developmental stages. Figure S1: Multiple sequence alignments of BOR proteins of B. distachyon, O. sativa, S. bicolor, T. aestivum, and Z. mays.

Author Contributions

Conceptualization, S.K.U.; methodology, H.S., A.S. and R.R.; software, H.S. and A.S.; validation, S.K.U., H.S. and A.S.; formal analysis, H.S. and A.S.; investigation, H.S. and A.S.; resources, S.K.U. and A.P.; data curation, H.S., A.S. and P.C.V.; writing—original draft preparation, H.S. and A.S.; writing—review and editing, H.S., A.S., R.R., S.S., A.P., H.D., P.C.V. and S.K.U.; visualization, H.S. and A.S.; supervision, S.K.U.; project administration, S.K.U.; funding acquisition, S.K.U. All authors have read and agreed to the published version of the manuscript.

Funding

This research received no external funding.

Institutional Review Board Statement

Not applicable.

Informed Consent Statement

Not applicable.

Data Availability Statement

All the data used in this study are freely available in the databases /repositories. Link and accession numbers have been mentioned in the manuscript.

Acknowledgments

The authors are grateful to the Panjab University, Chandigarh, and the National Institute of Plant Genome Research, New Delhi, India, for the facility. H.S. and A.S. are grateful to CSIR for their senior research fellowships. H.S. is also thankful to IKGPTU, Jalandhar, India, for Ph.D. registration.

Conflicts of Interest

The authors declare no conflict of interest.

References

  1. Reid, R. Understanding the boron transport network in plants. Plant Soil 2014, 385, 1–13. [Google Scholar] [CrossRef]
  2. Tanaka, M.; Fujiwara, T. Physiological roles and transport mechanisms of boron: Perspectives from plants. Pflugers Arch. Eur. J. Physiol. 2008, 456, 671–677. [Google Scholar] [CrossRef] [PubMed]
  3. Kobayashi, M.; Matoh, T.; Azuma, J.I. Two chains of rhamnogalacturonan II are cross-linked by borate-diol ester bonds in higher plant cell walls. Plant Physiol. 1996, 110, 1017–1020. [Google Scholar] [CrossRef] [PubMed] [Green Version]
  4. O’Neill, M.A.; Eberhard, S.; Albersheim, P.; Darvill, A.G. Requirement of borate cross-linking of cell wall rhamnogalacturonan II for A. thaliana growth. Science 2001, 294, 846–849. [Google Scholar] [CrossRef] [PubMed]
  5. Farooq, M.; Rashid, A.; Nadeem, F.; Stuerz, S.; Asch, F.; Bell, R.W.; Siddique, K.H.M. Boron nutrition of rice in different production systems. Agron. Sustain. Dev. 2018, 38, 25. [Google Scholar] [CrossRef] [Green Version]
  6. Brown, P.H.; Shelp, B.J. Boron mobility in plants. Plant Soil 1997, 193, 85–101. [Google Scholar] [CrossRef]
  7. Gupta, U.C. Boron nutrition of crops. Adv. Agron. 1980, 31, 273–307. [Google Scholar] [CrossRef]
  8. Takano, J.; Miwa, K.; Fujiwara, T. Boron transport mechanisms: Collaboration of channels and transporters. Trends Plant Sci. 2008, 13, 451–457. [Google Scholar] [CrossRef]
  9. Takano, J.; Noguchi, K.; Yasumori, M.; Kobayashi, M.; Gajdos, Z.; Miwa, K.; Hayashi, H.; Yoneyama, T.; Fujiwara, T. A. thaliana boron transporter for xylem loading. Nature 2002, 420, 337–340. [Google Scholar] [CrossRef]
  10. Takano, J.; Tanaka, M.; Toyoda, A.; Miwa, K.; Kasai, K.; Fuji, K.; Onouchi, H.; Naito, S.; Fujiwara, T. Polar localization and degradation of A. thaliana boron transporters through distinct trafficking pathways. Proc. Natl. Acad. Sci. USA 2010, 107, 5220–5225. [Google Scholar] [CrossRef] [Green Version]
  11. Kasai, K.; Takano, J.; Miwa, K.; Toyoda, A.; Fujiwara, T. High boron-induced ubiquitination regulates vacuolar sorting of the bor1 borate transporter in Arabidopsis thaliana. J. Biol. Chem. 2011, 286, 6175. [Google Scholar] [CrossRef] [PubMed] [Green Version]
  12. Miwa, K.; Takano, J.; Omori, H.; Seki, M.; Shinozaki, K.; Fujiwara, T. Plants tolerant of high boron levels. Science 2007, 318, 1417. [Google Scholar] [CrossRef] [PubMed]
  13. Parker, M.D.; Boron, W.F. The divergence, actions, roles, and relatives of sodium-coupled bicarbonate transporters. Physiol. Rev. 2013, 93, 803–959. [Google Scholar] [CrossRef] [PubMed] [Green Version]
  14. Nakagawa, Y.; Hanaoka, H.; Kobayashi, M.; Miyoshi, K.; Miwa, K.; Fujiwara, T. Cell-type specificity of the expression of OsBOR1, a rice efflux boron transporter gene, is regulated in response to boron availability for efficient boron uptake and xylem loading. Plant Cell 2007, 19, 2634–2635. [Google Scholar] [CrossRef] [PubMed] [Green Version]
  15. Reid, R. Identification of Boron Transporter Genes Likely to be Responsible for Tolerance to Boron Toxicity in Wheat and Barley. Plant Cell Physiol. 2007, 48, 1673–1678. [Google Scholar] [CrossRef]
  16. Pérez-Castro, R.; Kasai, K.; Gainza-Cortés, F.; Ruiz-Lara, S.; Casaretto, J.A.; Peña-Cortés, H.; Tapia, J.; Fujiwara, T.; González, E. VvBOR1, the Grapevine Ortholog of AtBOR1, Encodes an Efflux Boron Transporter That is Differentially Expressed Throughout Reproductive Development of Vitis vinifera L. Plant Cell Physiol. 2012, 53, 485–494. [Google Scholar] [CrossRef] [Green Version]
  17. Cañon, P.; Aquea, F.; Rodríguez-Hoces de la Guardia, A.; Arce-Johnson, P. Functional characterization of Citrus macrophylla BOR1 as a boron transporter. Physiol. Plant 2013, 149, 329–339. [Google Scholar] [CrossRef]
  18. Leaungthitikanchana, S.; Fujibe, T.; Tanaka, M.; Wang, S.; Sotta, N.; Takano, J.; Fujiwara, T. Differential Expression of Three BOR1 Genes Corresponding to Different Genomes in Response to Boron Conditions in Hexaploid Wheat (Triticum aestivum L.). Plant Cell Physiol. 2013, 54, 1056–1063. [Google Scholar] [CrossRef] [Green Version]
  19. Tanaka, N.; Uraguchi, S.; Saito, A.; Kajikawa, M.; Kasai, K.; Sato, Y.; Nagamura, Y.; Fujiwara, T. Roles of Pollen-Specific Boron Efflux Transporter, OsBOR4, in the Rice Fertilization Process. Plant Cell Physiol. 2013, 54, 2011–2019. [Google Scholar] [CrossRef] [Green Version]
  20. Chen, H.; Zhang, Q.; He, M.; Wang, S.; Shi, L.; Xu, F. Molecular characterization of the genome-wide BOR transporter gene family and genetic analysis of BnaC04.BOR1;1c in Brassica napus. BMC Plant Biol. 2018, 18, 193. [Google Scholar] [CrossRef] [PubMed]
  21. Luo, J.; Liang, Z.; Wu, M.; Mei, L. Genome-wide identification of BOR genes in poplar and their roles in response to various environmental stimuli. Environ. Exp. Bot. 2019, 164, 101–113. [Google Scholar] [CrossRef]
  22. Onuh, A.F.; Miwa, O. Regulation, diversity and evolution of boron transporters in plants. Plant Cell Physiol. 2021, 62, 590–599. [Google Scholar] [CrossRef] [PubMed]
  23. Wang, H.; Tang, S.; Zhi, H.; Xing, L.; Zhang, H.; Tang, C.; Wang, E.; Zhao, M.; Jia, G.; Feng, B.; et al. The boron transporter SiBOR1 functions in cell wall integrity, cellular homeostasis, and panicle development in foxtail millet. Crop J. 2021, 10, 342–353. [Google Scholar] [CrossRef]
  24. Wakuta, S.; Mineta, K.; Amano, T.; Toyoda, A.; Fujiwara, T.; Naito, S.; Takano, J. Evolutionary Divergence of Plant Borate Exporters and Critical Amino Acid Residues for the Polar Localization and Boron-Dependent Vacuolar Sorting of AtBOR1. Plant Cell Physiol. 2015, 56, 852–862. [Google Scholar] [CrossRef] [PubMed] [Green Version]
  25. Tajima, F. Simple methods for testing the molecular evolutionary clock hypothesis. Genetics 1993, 135, 599–607. [Google Scholar] [CrossRef] [PubMed]
  26. Ozyigit, I.I.; Filiz, E.; Saracoglu, I.A.; Karadeniz, S. Exploration of two major boron transport genes BOR1 and NIP5;1 in the genomes of different plants. Biotechnol. Biotechnol. Equip. 2020, 34, 455–468. [Google Scholar] [CrossRef]
  27. Marcussen, T.; Sandve, S.R.; Heier, L.; Spannagl, M.; Pfeifer, M.; International Wheat Genome Sequencing Consortium; Jackobsen, K.S.; Wulff, B.B.H.; Steuernagel, B.; Mayer, K.F.; et al. Ancient hybridizations among the ancestral genomes of bread wheat. Science 2014, 345, 1250092. [Google Scholar] [CrossRef]
  28. Sharma, H.; Sharma, A.; Yashvika; Sidhu, S.; Upadhyay, S.K. A glimpse of boron transport in plants. In Cation Transporters in Plants; Upadhyay, S.K., Ed.; Academic Press: Cambridge, MA, USA, 2022; pp. 281–306. [Google Scholar] [CrossRef]
  29. Bowers, J.E.; Chapman, B.A.; Rong, J.; Paterson, A.H. Unravelling angiosperm genome evolution by phylogenetic analysis of chromosomal duplication events. Nature 2003, 422, 433–438. [Google Scholar] [CrossRef]
  30. IWGSC; Appels, R.; Eversole, K.; Stein, N.; Feuillet, C.; Keller, B.; Rogers, J.; Pozniak, C.J.; Choulet, F.; Distelfeld, A.; et al. Shifting the limits in wheat research and breeding using a fully annotated reference genome. Science 2018, 361, eaar7191. [Google Scholar] [CrossRef] [Green Version]
  31. Ayaz, A.; Saqib, S.; Huang, H.; Zaman, W.; Lü, S.; Zhao, H. Genome-wide comparative analysis of long-chain acyl-CoA synthetases (LACSs) gene family: A focus on identification, evolution and expression profiling related to lipid synthesis. Plant Physiol. Biochem. 2021, 161, 1–11. [Google Scholar] [CrossRef]
  32. Lee, S.K.; Hong, W.-J.; Silva, J.; Kim, E.-J.; Park, S.K.; Jung, K.-H.; Kim, Y.-J. Global Identification of ANTH Genes Involved in Rice Pollen Germination and Functional Characterization of a Key Member, OsANTH3. Front. Plant Sci. 2021, 12, 609473. [Google Scholar] [CrossRef]
  33. Feng, Y.; Cui, R.; Wang, S.; He, M.; Hua, Y.; Shi, L.; Ye, X.; Xu, F. Transcription factor BnaA9.WRKY47 contributes to the adaptation of Brassica napus to low boron stress by up-regulating the boric acid channel gene BnaA3.NIP5;1. Plant Biotechnol. J. 2020, 18, 1241–1254. [Google Scholar] [CrossRef] [PubMed] [Green Version]
  34. Hua, Y.; Feng, Y.; Zhou, T.; Xu, F. Genome-scale mRNA transcriptomic insights into the responses of oilseed rape (Brassica napus L.) to varying boron availabilities. Plant Soil 2017, 416, 205–225. [Google Scholar] [CrossRef]
  35. Sharma, A.; Tyagi, S.; Alok, A.; Singh, K.; Upadhyay, S.K. Thaumatin-like protein kinases: Molecular characterization and transcriptional profiling in five cereal crops. Plant Sci. 2020, 290, 110317. [Google Scholar] [CrossRef] [PubMed]
  36. Sharma, H.; Taneja, M.; Upadhyay, S.K. Identification, characterization and expression profiling of cation-proton antiporter superfamily in Triticum aestivum L. and functional analysis of TaNHX4-B. Genomics 2020, 112, 356–370. [Google Scholar] [CrossRef] [PubMed]
  37. Howe, K.L.; Contreras-Moreira, B.; De Silva, N.; Maslen, G.; Akanni, W.; Allen, J.; Alvarez-Jarreta, J.; Barba, M.; Bolser, D.M.; Cambell, L. Ensembl Genomes 2020-enabling non-vertebrate genomic research. Nucleic Acids Res. 2020, 48, D689–D695. [Google Scholar] [CrossRef] [PubMed] [Green Version]
  38. Mistry, J.; Chuguransky, S.; Williams, L.; Qureshi, M.; Salazar, G.A.; Sonnhammer, E.; Tosatto, S.; Paladin, L.; Raj, S.; Richardson, L.J.; et al. Pfam: The protein families database in 2021. Nucleic Acids Res. 2021, 49, D412–D419. [Google Scholar] [CrossRef]
  39. Tyagi, S.; Shumayla; Madhu; Singh, K.; Upadhyay, S.K. Molecular characterization revealed the role of catalases under abiotic and arsenic stress in bread wheat (Triticum aestivum L.). J. Hazard. Mater. 2021, 403, 123585. [Google Scholar] [CrossRef]
  40. Shumayla; Tyagi, S.; Sharma, A.; Singh, K.; Upadhyay, S.K. Genomic dissection and transcriptional profiling of Cysteine-rich receptor-like kinases in five cereals and functional characterization of TaCRK68-A. Int. J. Biol. Macromol. 2019, 134, 316–329. [Google Scholar] [CrossRef]
  41. Sharma, A.; Sharma, H.; Rajput, R.; Pandey, A.; Upadhyay, S.K. Molecular Characterization Revealed the Role of Thaumatin-Like Proteins of Bread Wheat in Stress Response. Front Plant Sci. 2022, 12, 807448. [Google Scholar] [CrossRef]
  42. Corpet, F. Multiple sequence alignment with hierarchical clustering. Nucleic Acids Res. 1988, 16, 10881–10890. [Google Scholar] [CrossRef] [PubMed]
  43. Edgar, R.C. MUSCLE: Multiple sequence alignment with high accuracy and high throughput. Nucleic Acids Res. 2004, 32, 1792–1797. [Google Scholar] [CrossRef] [PubMed] [Green Version]
  44. Kumar, S.; Stecher, G.; Li, M.; Knyaz, C.; Tamura, K. MEGA X: Molecular Evolutionary Genetics Analysis across Computing Platforms. Mol. Biol. Evol. 2018, 35, 1547–1549. [Google Scholar] [CrossRef] [PubMed]
  45. Madeira, F.; Park, Y.M.; Lee, J.; Buso, N.; Gur, T.; Madhusoodanan, N.; Basutkar, P.; Tivey, A.R.N.; Potter, S.C.; Finn, R.D.; et al. The EMBL-EBI search and sequence analysis tools APIs in 2019. Nucleic Acids Res. 2019, 47, W636–W641. [Google Scholar] [CrossRef] [Green Version]
  46. Suyama, M.; Torrents, D.; Bork, P. PAL2NAL: Robust conversion of protein sequence alignments into the corresponding codon alignments. Nucleic Acids Res. 2006, 34, W609–W612. [Google Scholar] [CrossRef] [Green Version]
  47. Kaur, A.; Taneja, M.; Tyagi, S.; Sharma, A.; Singh, K.; Upadhyay, S. Genome-wide characterization and expression analysis suggested diverse functions of the mechanosensitive channel of small conductance-like (MSL) genes in cereal crops. Sci. Rep. 2020, 10, 16583. [Google Scholar] [CrossRef]
  48. Gaut, B.S.; Morton, B.R.; McCaig, B.C.; Clegg, M.T. Substitution rate comparisons between grasses and palms: Synonymous rate differences at the nuclear gene Adh parallel rate differences at the plastid gene rbcL. Proc. Natl. Acad. Sci. USA 1996, 93, 10274. [Google Scholar] [CrossRef] [Green Version]
  49. Hu, B.; Jin, J.; Guo, A.-Y.; Zhang, H.; Luo, J.; Gao, G. GSDS 2.0: An upgraded gene feature visualization server. Bioinformatics 2015, 31, 1296–1297. [Google Scholar] [CrossRef] [Green Version]
  50. Lescot, M.; Déhais, P.; Thijs, G.; Marchal, K.; Moreau, Y.; Peer, Y.V.; Rouzé, P.; Rombauts, S. PlantCARE, a database of plant cis-acting regulatory elements and a portal to tools for in silico analysis of promoter sequences. Nucleic Acids Res. 2002, 30, 325–327. [Google Scholar] [CrossRef]
  51. Gasteiger, E.; Hoogland, C.; Gattiker, A.; Duvaud, S.; Wilkins, M.R.; Appel, R.D.; Bairoch, A. Protein Identification and Analysis Tools on the ExPASy Server. In The Proteomics Protocols Handbook; Walker, J.M., Ed.; Springer Protocols Handbooks; Humana Press: Totowa, NJ, USA, 2005; pp. 571–607. [Google Scholar] [CrossRef]
  52. Stothard, P. The sequence manipulation suite: JavaScript programs for analyzing and formatting protein and DNA sequences. Biotechniques 2000, 28, 1102–1104. [Google Scholar] [CrossRef] [Green Version]
  53. Käll, L.; Krogh, A.; Sonnhammer, E.L. A combined transmembrane topology and signal peptide prediction method. J. Mol. Biol. 2004, 338, 1027–1036. [Google Scholar] [CrossRef] [PubMed]
  54. Omasits, U.; Ahrens, C.H.; Müller, S.; Wollscheid, B. Protter: Interactive protein feature visualization and integration with experimental proteomic data. Bioinformatics 2014, 30, 884–886. [Google Scholar] [CrossRef] [Green Version]
  55. Krogh, A.; Larsson, B.; von Heijne, G.; Sonnhammer, E.L. Predicting transmembrane protein topology with a hidden Markov model: Application to complete genomes. J. Mol. Biol. 2001, 305, 567–580. [Google Scholar] [CrossRef] [PubMed] [Green Version]
  56. Emanuelsson, O.; Nielsen, H.; Brunak, S.; Von Heijne, G. Predicting subcellular localization of proteins based on their N-terminal amino acid sequence. J. Mol. Biol. 2000, 300, 1005–1016. [Google Scholar] [CrossRef] [Green Version]
  57. Horton, P.; Park, K.-J.; Obayashi, T.; Fujita, N.; Harada, H.; Adams-Collier, C.J.; Nakai, K. WoLF PSORT: Protein localization predictor. Nucleic Acids Res. 2007, 35, W585–W587. [Google Scholar] [CrossRef] [PubMed] [Green Version]
  58. Yu, C.-S.; Chen, Y.-C.; Lu, C.-H.; Hwang, J.-K. Prediction of protein subcellular localization. Proteins Struct. Funct. Bioinform. 2006, 64, 643–651. [Google Scholar] [CrossRef]
  59. King, B.R.; Guda, C. ngLOC: An n-gram-based Bayesian method for estimating the subcellular proteomes of eukaryotes. Genome Biol. 2007, 8, R68. [Google Scholar] [CrossRef] [Green Version]
  60. Petersen, T.N.; Brunak, S.; Heijne, G.V.; Nielsen, H. SignalP 4.0: Discriminating signal peptides from transmembrane regions. Nat. Methods 2011, 8, 785–786. [Google Scholar] [CrossRef]
  61. Letunic, I.; Doerks, T.; Bork, P. SMART: Recent updates, new developments and status in 2015. Nucleic Acids Res. 2015, 43, D257–D260. [Google Scholar] [CrossRef]
  62. Bailey, T.L.; Boden, M.; Buske, F.A.; Frith, M.; Grant, C.E.; Clementi, L.; Ren, J.; Li, W.W.; Noble, W.S. MEME SUITE: Tools for motif discovery and searching. Nucleic Acids Res. 2009, 37, W202–W208. [Google Scholar] [CrossRef]
  63. Choulet, F.; Alberti, A.; Theil, S.; Glover, N.M.; Barbe, V.; Daron, J.; Pingault, L.; Sourdille, P.; Couloux, A.; Paux, E. Structural and Functional Partitioning of Bread Wheat Chromosome 3B. Science 2014, 345, 1249721. [Google Scholar] [CrossRef] [PubMed]
  64. Pingault, L.; Choulet, F.; Alberti, A.; Glover, N.; Wincker, P.; Feuillet, C.; Paux, E. Deep transcriptome sequencing provides new insights into the structural and functional organization of the wheat genome. Genome Biol. 2015, 16, 29. [Google Scholar] [CrossRef] [PubMed] [Green Version]
  65. Papatheodorou, I.; Fonseca, N.A.; Keays, M.; Tang, Y.A.; Barrera, E.; Bazant, W.; Burke, M.; Füllgrabe, A.; Fuentes, A.M.-P.; George, N.; et al. Expression Atlas: Gene and protein expression across multiple studies and organisms. Nucleic Acids Res. 2018, 46, D246–D251. [Google Scholar] [CrossRef]
  66. Zhang, H.; Yang, Y.; Wang, C.; Liu, M.; Li, H.; Fu, Y.; Wang, Y.; Nie, Y.; Liu, X.; Ji, W. Large-scale transcriptome comparison reveals distinct gene activations in wheat responding to stripe rust and powdery mildew. BMC Genom. 2014, 15, 898. [Google Scholar] [CrossRef] [Green Version]
  67. Liu, Z.; Xin, M.; Qin, J.; Peng, H.; Ni, Z.; Yao, Y.; Sun, Q. Temporal transcriptome profiling reveals expression partitioning of homeologous genes contributing to heat and drought acclimation in wheat (Triticum aestivum L.). BMC Plant Biol. 2015, 15, 152. [Google Scholar] [CrossRef] [Green Version]
  68. Zhang, Y.; Liu, Z.; Khan, A.A.; Lin, Q.; Han, Y.; Mu, P.; Liu, Y.; Zhang, H.; Li, L.; Meng, X.; et al. Expression partitioning of homeologs and tandem duplications contribute to salt tolerance in wheat (Triticum aestivum L.). Sci. Rep. 2016, 6, 21476. [Google Scholar] [CrossRef]
  69. Pearce, S.; Vazquez-Gross, H.; Herin, S.Y.; Hane, D.; Wang, Y.; Gu, Y.Q.; Dubcovsky, J. WheatExp: An RNA-seq expression database for polyploid wheat. BMC Plant Biol. 2015, 15, 299. [Google Scholar] [CrossRef] [Green Version]
  70. Haas, B.J.; Papanicolaou, A.; Yassour, M.; Grabhher, M.; Blood, P.D.; Bowden, J.; Couger, M.B.; Eccles, D.; Li, B.; Lieber, M.; et al. De novo transcript sequence reconstruction from RNA-seq using the Trinity platform for reference generation and analysis. Nat. Protoc. 2013, 8, 1494–1512. [Google Scholar] [CrossRef]
  71. Seo, J.; Gordish-Dressman, H.; Hoffman, E.P. An interactive power analysis tool for microarray hypothesis testing and generation. Bioinformatics 2006, 22, 808–814. [Google Scholar] [CrossRef]
  72. Nazarov, P.V.; Muller, A.; Khutko, V. Co-expression analysis of large microarray data sets using CoExpress software tool. In Proceedings of the Conference: WCSB, Luxemborg, 16–18 June 2010. [Google Scholar]
  73. Conesa, A.; Götz, S. Blast2GO: A comprehensive suite for functional analysis in plant genomics. Int. J. Plant Genom. 2008, 2008, 619832. [Google Scholar] [CrossRef]
  74. Bastian, M.; Heymann, S.; Jacomy, M. Gephi: An Open Source Software for Exploring and Manipulating Networks Visualization and Exploration of Large Graphs. In Proceedings of the International AAAI Conference on Web and Social Media, San Jose, CA, USA, 17–20 May 2009. [Google Scholar]
  75. Livak, K.J.; Schmittgen, T.D. Analysis of Relative Gene Expression Data Using Real-Time Quantitative PCR and the 2−ΔΔCT Method. Methods 2001, 25, 402–408. [Google Scholar] [CrossRef]
  76. Shumayla; Madhu; Singh, K.; Upadhyay, S.K. LysM domain-containing proteins modulate stress response and signalling in Triticum aestivum L. Environ. Exp. Bot. 2021, 189, 104558. [Google Scholar] [CrossRef]
  77. Madhu; Kaur, A.; Tyagi, S.; Shumayla; Singh, K.; Upadhyay, S.K. Exploration of glutathione reductase for abiotic stress response in bread wheat (Triticum aestivum L.). Plant Cell Rep. 2021, 1–16. [Google Scholar] [CrossRef] [PubMed]
Figure 1. Chromosomal localization and duplication events analyses of BOR genes in five cereals. The scattered distribution of BOR genes of (a) B. distachyon, (b) O. sativa, (c) S. bicolor, (d) Z. mays, and (e) T. aestivum at their respective chromosomes is depicted by the image. The green lines indicate the three segmental duplication events identified in T. aestivum.
Plants 11 00911 g001
Figure 2. Analyses of multiple sequence alignments and phylogeny of BOR proteins. Highlighted motifs and regions are known to be essential for polarity and vacuolar sorting. (a,b) show important conserved regions present in BOR proteins. (a) Tyrosine-based motifs (YxxΦ), acidic di-leucine motifs ([D/E]xxxL[L/I]) and (b) ubiquitination site (K590) are found conserved in the studied BOR sequences. (c) shows the phylogenetic tree constructed using amino acid sequences of A. thaliana, B. distachyon, O. sativa, S. bicolor, T. aestivum, and Z. mays with MEGA X by the neighbor-joining method at the bootstrap value of 1000. The conventional division of B transporters into two groups i.e., BOR1-like and BOR4-like proteins, were observed. BOR4-like proteins were devoid of di-leucine motifs.
Plants 11 00911 g002
Figure 3. Gene architecture and intron phase distribution of BOR genes. (a) depicts the exon/intron organization of BOR genes in B. distachyon, O. sativa, S. bicolor, T. aestivum, and Z. mays. On average, around 13 exons were found in all five studied cereals. (b) shows the percentage distribution of intron phases in BOR genes. The majority of introns were found in phase 0, followed by phases 2 and 1.
Plants 11 00911 g003
Figure 4. Domain, motif, and promoter analyses. (a) shows the domain distribution in the BOR proteins. HCO3 domain (shown in blue color) was present in all of the BOR proteins. Orange color represents another domain, i.e., the ANTH domain, which was exclusively present in ZmBOR6 protein; (b) shows the 15 conserved motifs present in the BOR proteins of B. distachyon, O. sativa, S. bicolor, T. aestivum, and Z. mays; (c) shows the cis-regulatory elements present in the promoter regions of BOR genes of all five cereals. Brown, blue, green, and orange colors represent the light-responsive, hormone-responsive, stress-responsive, and growth- and development-related cis-regulated elements, respectively.
Plants 11 00911 g004
Figure 5. Expression analysis of BOR genes under various tissue developmental stages and abiotic and biotic stress conditions and comparative expression profiling of paralogous genes. (ae) show the heat maps of BOR genes of B. distachyon, O. sativa, S. bicolor, Z. mays, and T. aestivum, respectively, during various tissue developmental stages. The expression of BOR genes of T. aestivum after the onset of Bgt and Pst infections is shown in the heatmap in (f). The expression profiling of TaBOR genes under heat, drought, and combined heat and drought stress are represented by (g). (h) shows the expression pattern of TaBOR genes during salt stress conditions. (ik) represent the comparative expression trends of TaBOR2-A-TaBOR3-D, TaBOR2-B-TaBOR3-B, and TaBOR2-D-TaBOR3-A, respectively, under various tissue developmental stages of T. aestivum.
Plants 11 00911 g005
Figure 6. qRT-PCR analysis of five TaBOR genes. Five TaBOR genes were randomly selected for qRT PCR analysis. The expression pattern of TaBOR1-B, TaBOR2-A, TaBOR3-D, TaBOR4-A, and TaBOR5-B genes were analyzed under 20 mM B stress conditions. (a,b) show the expression of TaBOR1-B in roots and shoots, respectively. The expression pattern of TaBOR2-A in roots and shoots is shown in (c,d). (e,f) show the expression of TaBOR3-D in roots and shoots, respectively. TaBOR4-A’s expression pattern is depicted by (g,h) in roots and shoots, respectively. (i) shows the expression of TaBOR5-B gene in roots under B stress conditions. The analysis of variance (ANOVA) at 5% probability level was used to statistically analyze the data. The post hoc Tukey’s test was used to find the significant difference among the treatments (p < 0.05). p-value > 0.05, ≤0.05, ≤0.01, ≤0.001 is represented by symbols ns, *, **, and ***, respectively. The maroon-colored connecting lines show the significance among the treatments. GraphPad Prism 9 software was used to obtain graphs and statistical analyses for this data.
Plants 11 00911 g006
Figure 7. Co-expression analysis of BOR genes. (ae) show the interaction network based on co-expression of BOR genes of (a) B. distachyon, (b) O. sativa, (c) S. bicolor, (d) Z. mays, and (e) T. aestivum during different tissue development stages.
Plants 11 00911 g007
Table 1. The Ka/Ks ratio and divergence time of TaBOR paralogous genes.
Gene AGene BKaKsKa/KsSelection PressureT = Ks/2r
TaBOR2-ATaBOR3-D0.05810.32060.1814Purifying24.7
TaBOR2-BTaBOR3-B0.05700.32750.1741Purifying25.2
TaBOR2-DTaBOR3-A0.06140.30810.1992Purifying23.7
Ka: non-synonymous substitutions per non-synonymous site; Ks: synonymous substitutions per synonymous site; T: divergence time.
Table 2. Tajima’s relative rate test of duplicated gene pairs.
Group AGroup BOut GroupNtNaNbχ2P
TaBOR2-ATaBOR3-DTaBOR4-A114964832.460.11709
TaBOR2-BTaBOR3-BTaBOR4-A115679770.030.87278
TaBOR2-DTaBOR3-ATaBOR4-A114573770.110.74397
Nt: identical sites in all three sequences; Na: unique differences in Sequence A; Nb: unique differences in Sequence B.
Table 3. Characteristic features of BOR proteins of B. distachyon, O. sativa, S. bicolor, T. aestivum, and Z. mays.
B. distachyonO. sativaS. bicolorT. aestivumZ. mays
Average length (aa) 683683684691717
Average MW (kDa) 76.676.776.577.280.2
Signal peptides 00000
Average pI value 87.887.68.2
Average GRAVY 0.20.20.20.20.16
Sub-cellular localization PMPMPMPMPM
Transmemberane regions (TMs) 9–129–128–109–125–12
Publisher’s Note: MDPI stays neutral with regard to jurisdictional claims in published maps and institutional affiliations.

