
Forage Yield, Canopy Characteristics, and Radiation Interception of Ten Alfalfa Varieties in an Arid Environment


Abstract
:1. Introduction
2. Results
2.1. Climatic Conditions
2.2. Forage Yield
2.3. Plant Height
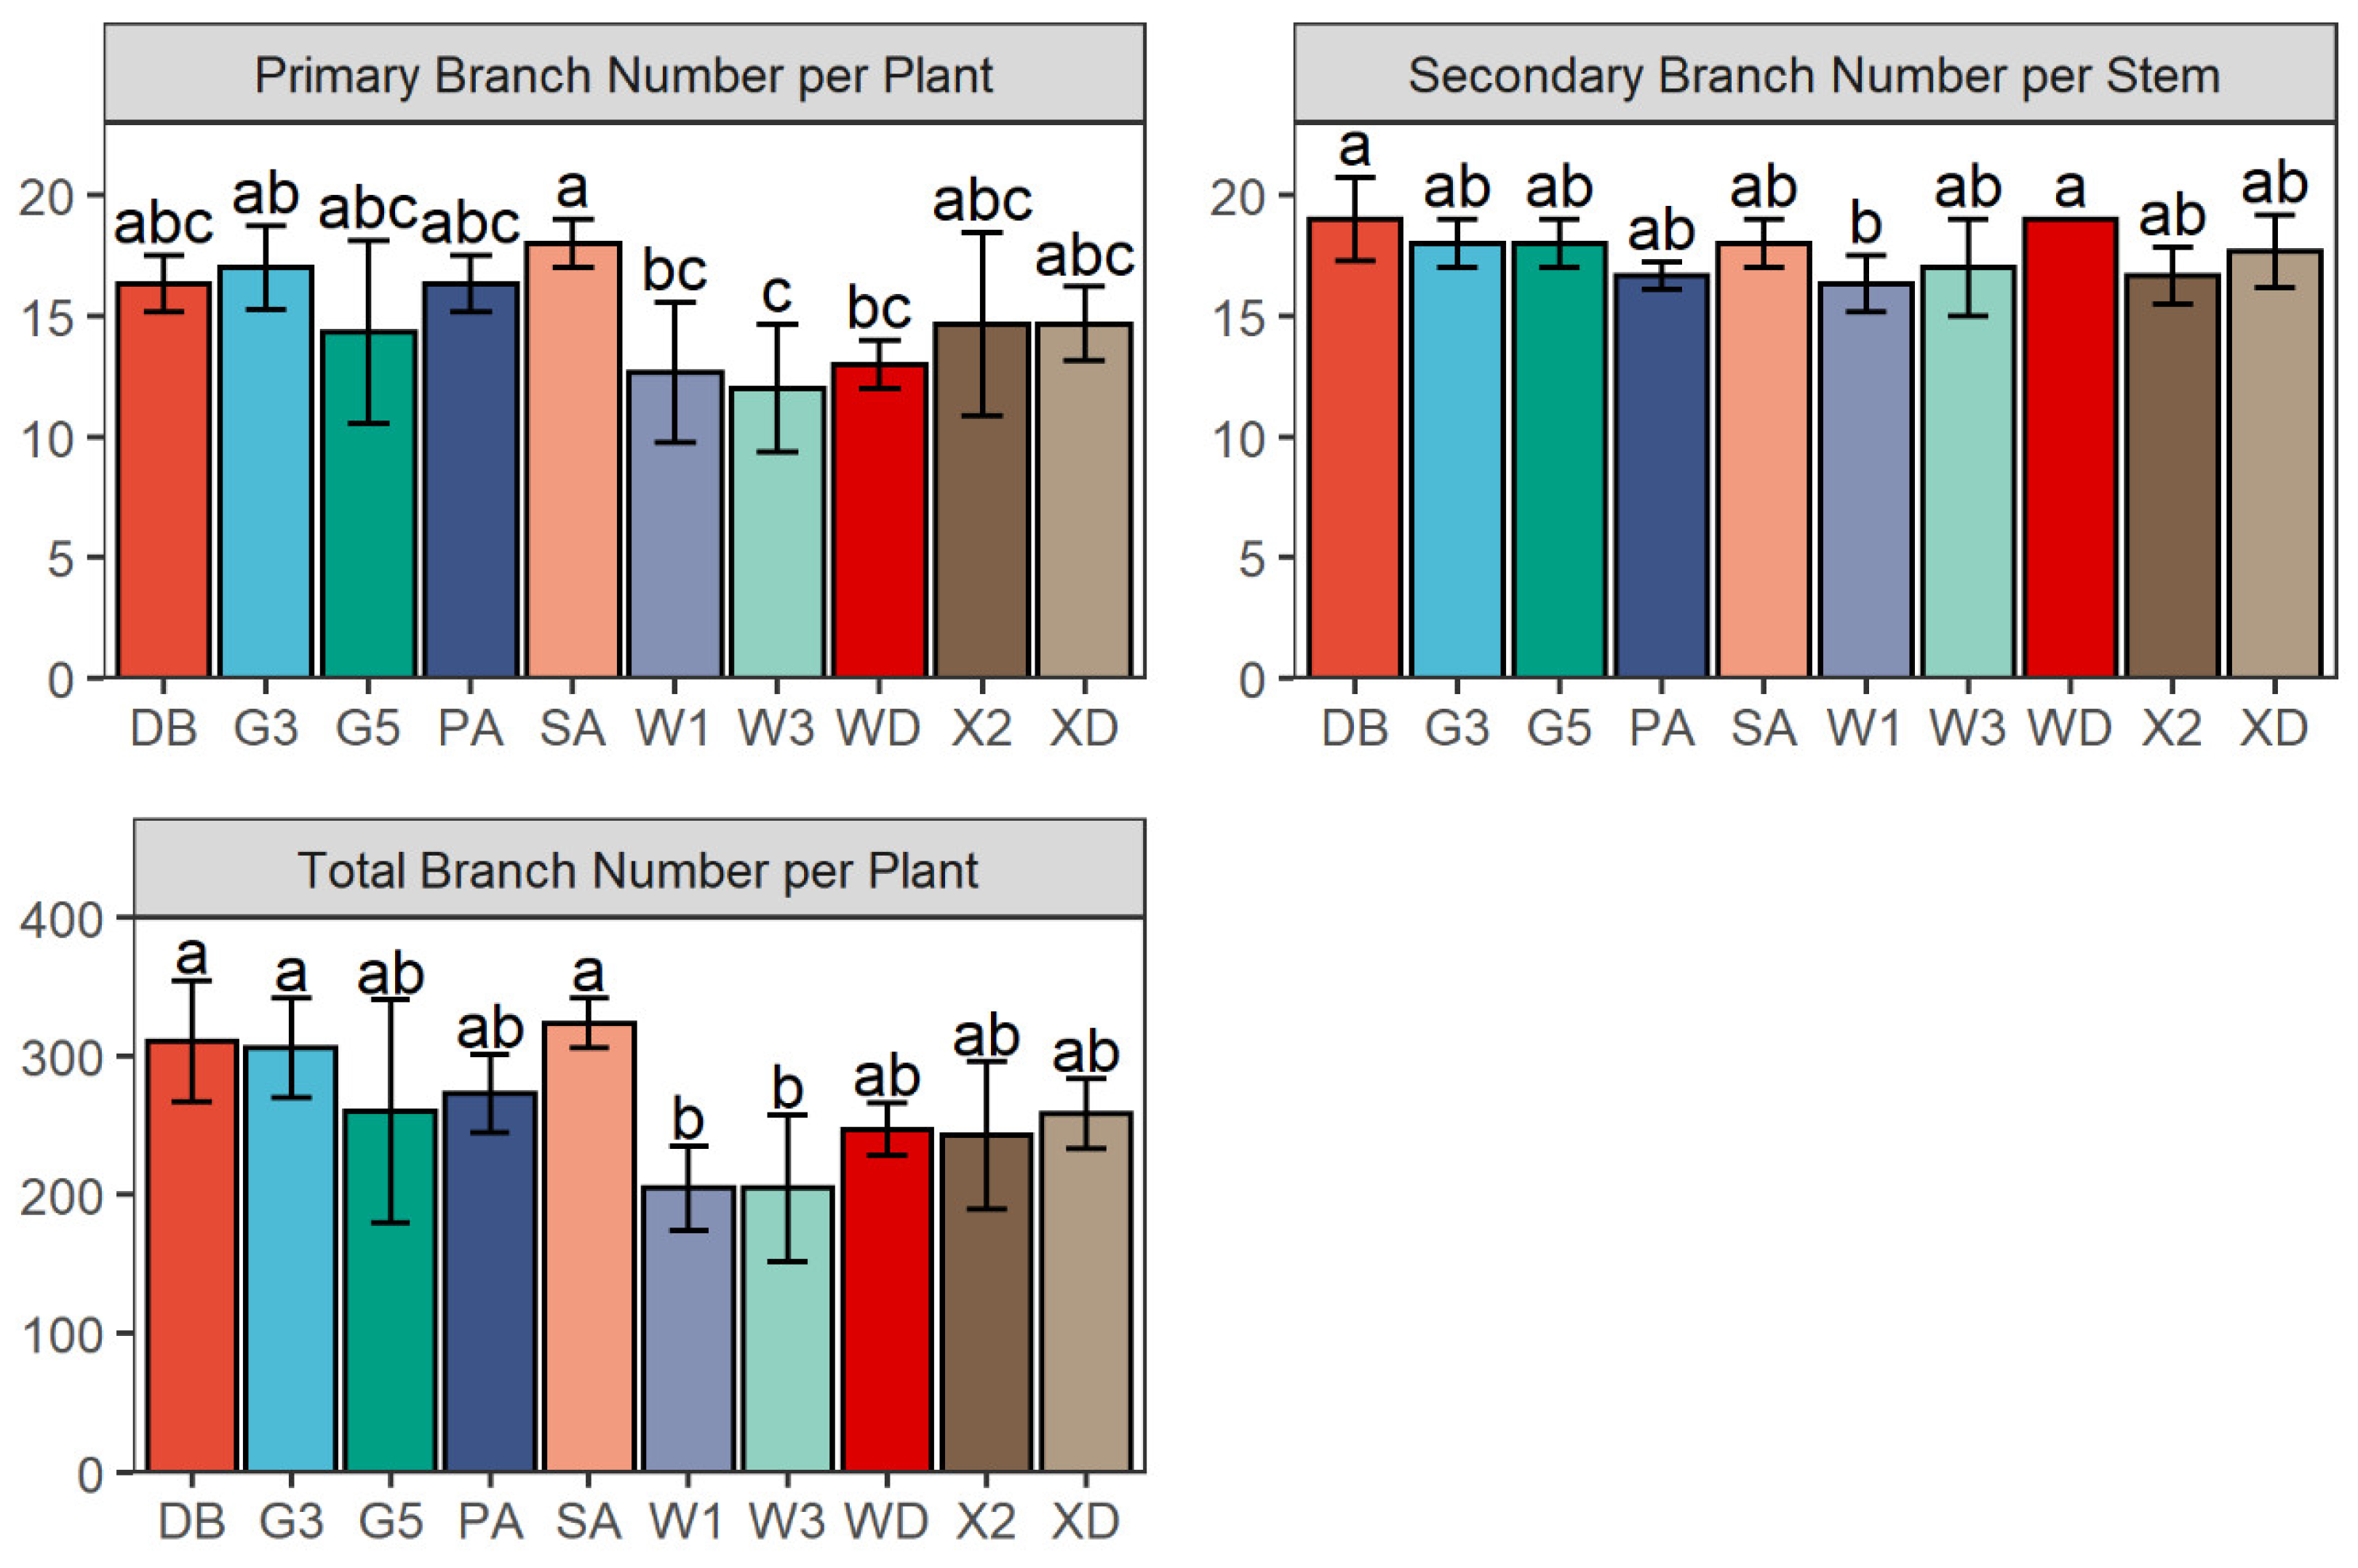
2.4. Branch Number
2.5. Leaf Area Index and Light Interception
2.6. Stem to Leaf Ratio
2.7. The Central Leaflet Length, Width, and Area
2.8. Correlation Analysis for First Cutting Yield
3. Discussion
4. Materials and Methods
4.1. Site Description
4.2. Experimental Design and Agronomic Management
4.3. Measurements
4.3.1. Meteorological Data
4.3.2. Plant Height
4.3.3. Branch Number
4.3.4. Leaf Area Index and Light Interception
4.3.5. Forage Yield and Stem to Leaf Ratio
4.3.6. The Central Leaflet Length, Width, and Area
4.4. Statistical Analysis
Supplementary Materials
Author Contributions
Funding
Institutional Review Board Statement
Informed Consent Statement
Data Availability Statement
Acknowledgments
Conflicts of Interest
References
- Salinger, J.; Sivakumar, M.V.; Motha, R.P. Increasing Climate Variability and Change: Reducing the Vulnerability of Agriculture and Forestry; Springer Science & Business Media: Berlin/Heidelberg, Germany, 2005; Volume 70, pp. 1–3. [Google Scholar]
- Yin, Y.; Ma, D.; Wu, S. Enlargement of the semi-arid region in China from 1961 to 2010. Clim. Dyn. 2019, 52, 509–521. [Google Scholar] [CrossRef]
- Dixon, J.A.; James, D.E.; Sherman, P.B. Economics of Dryland Management; Routledge: London, UK, 2013; Volume 2, p. 27. [Google Scholar]
- Blum, A. Effective use of water (EUW) and not water-use efficiency (WUE) is the target of crop yield improvement under drought stress. Field Crops Res. 2009, 112, 119–123. [Google Scholar] [CrossRef]
- Arshad, M.; Feyissa, B.A.; Amyot, L.; Aung, B.; Hannoufa, A. MicroRNA156 improves drought stress tolerance in alfalfa (Medicago sativa) by silencing SPL13. Plant Sci. 2017, 258, 122–136. [Google Scholar] [CrossRef] [PubMed]
- Avci, M.A.; Ozkose, A.; Tamkoc, A. Determination of yield and quality characteristics of alfalfa (Medicago sativa L.) varieties grown in different locations. J. Anim. Vet. Adv. 2013, 12, 487–490. [Google Scholar] [CrossRef]
- Hakl, J.; Kunzová, E.; Tocauerová, Š.; Menšík, L.; Mrázková, M.; Pozdíšek, J. Impact of long-term manure and mineral fertilization on yield and nutritive value of lucerne (Medicago sativa) in relation to changes in canopy structure. Eur. J. Agron. 2021, 123, 126219. [Google Scholar] [CrossRef]
- Ta, H.T.; Teixeira, E.I.; Brown, H.E.; Moot, D.J. Yield and quality changes in lucerne of different fall dormancy ratings under three defoliation regimes. Eur. J. Agron. 2020, 115, 126012. [Google Scholar] [CrossRef]
- Payero, J.; Neale, C.; Wright, J. Comparison of eleven vegetation indices for estimating plant height of alfalfa and grass. Appl. Eng. Agric. 2004, 20, 385. [Google Scholar] [CrossRef] [Green Version]
- Chen, B.; Xu, K.; Li, J.; Li, F.; Qiao, J.; Li, H.; Gao, G.; Yan, G.; Wu, X. Evaluation of yield and agronomic traits and their genetic variation in 488 global collections of Brassica napus L. Genet. Resour. Crop Evol. 2014, 61, 979–999. [Google Scholar] [CrossRef]
- Li, F.; Chen, B.; Xu, K.; Gao, G.; Yan, G.; Qiao, J.; Li, J.; Li, H.; Li, L.; Xiao, X.; et al. A genome-wide association study of plant height and primary branch number in rapeseed (Brassica napus). Plant Sci. 2016, 242, 169–177. [Google Scholar] [CrossRef]
- Agudamu; Yoshihira, T.; Shiraiwa, T. Branch development responses to planting density and yield stability in soybean cultivars. Plant Prod. Sci. 2016, 19, 331–339. [Google Scholar] [CrossRef] [Green Version]
- Ramesh, R.; Ramprasad, E. Effect of plant growth regulators on morphological, physiological and biochemical parameters of soybean (Glycine max L. Merrill). In Biotechnology and Bioforensics; Springer: New York, NY, USA, 2015; Volume 7, pp. 61–71. [Google Scholar]
- Wang, X.; Li, L.; Yang, Z.; Zheng, X.; Yu, S.; Xu, C.; Hu, Z. Predicting rice hybrid performance using univariate and multivariate GBLUP models based on North Carolina mating design II. Heredity 2016, 118, 302–310. [Google Scholar] [CrossRef] [PubMed] [Green Version]
- Pembleton, K.G.; Rawnsley, R.P.; Donaghy, D.J.; Volenec, J.J. Water deficit alters canopy structure but not photosynthesis during the regrowth of alfalfa. Crop Sci. 2009, 49, 722–731. [Google Scholar] [CrossRef]
- Volenec, J.J.; Cherney, J.H.; Johnson, K.D. Yield components, plant morphology, and forage quality of alfalfa as influenced by plant population. Crop Sci. 1987, 27, 321–326. [Google Scholar] [CrossRef]
- Ray, I.M.; Townsend, M.S.; Muncy, C.M.; Henning, J.A. Heritabilities of water-use efficiency traits and correlations with agronomic traits in water-stressed alfalfa. Crop Sci. 1999, 39, 494–498. [Google Scholar] [CrossRef]
- Kephart, K.D.; Buxton, D.R.; Hill, R.R. Digestibility and cell-wall components of alfalfa following selection for divergent herbage lignin concentration. Crop Sci. 1990, 30, 207–212. [Google Scholar] [CrossRef]
- Annicchiarico, P. Alfalfa forage yield and leaf/stem ratio: Narrow-sense heritability, genetic correlation, and parent selection procedures. Euphytica 2015, 205, 409–420. [Google Scholar] [CrossRef]
- Julier, B.; Huyghe, C.; Ecalle, C. Within- and among-cultivar genetic variation in alfalfa: Forage quality, morphology, and yield. Crop Sci. 2000, 40, 365–369. [Google Scholar] [CrossRef] [Green Version]
- Brisson, N.; Gary, C.; Justes, E.; Roche, R.; Mary, B.; Ripoche, D.; Zimmer, D.; Sierra, J.; Bertuzzi, P.; Burger, P. An overview of the crop model STICS. Eur. J. Agron. 2003, 18, 309–332. [Google Scholar] [CrossRef]
- Steduto, P.; Hsiao, T.C.; Raes, D.; Fereres, E. AquaCrop—The FAO crop model to simulate yield response to water: I. Concepts and underlying principles. Agron. J. 2009, 101, 426–437. [Google Scholar] [CrossRef] [Green Version]
- Fang, H.; Liang, S.; Hoogenboom, G. Integration of MODIS LAI and vegetation index products with the CSM–CERES–Maize model for corn yield estimation. Int. J. Remote Sens. 2011, 32, 1039–1065. [Google Scholar] [CrossRef]
- Bolton, D.K.; Friedl, M.A. Forecasting crop yield using remotely sensed vegetation indices and crop phenology metrics. Agric. For. Meteorol. 2013, 173, 74–84. [Google Scholar] [CrossRef]
- Kross, A.; McNairn, H.; Lapen, D.; Sunohara, M.; Champagne, C. Assessment of RapidEye vegetation indices for estimation of leaf area index and biomass in corn and soybean crops. Int. J. Appl. Earth Obs. Geoinf. 2015, 34, 235–248. [Google Scholar] [CrossRef] [Green Version]
- Mattera, J.; Romero, L.A.; Cuatrín, A.L.; Cornaglia, P.S.; Grimoldi, A.A. Yield components, light interception and radiation use efficiency of lucerne (Medicago sativa L.) in response to row spacing. Eur. J. Agron. 2013, 45, 87–95. [Google Scholar] [CrossRef]
- Monteith, J.L. Climate and the efficiency of crop production in Britain. Philos. Trans. R. Soc. Lond. B 1977, 281, 277–294. [Google Scholar] [CrossRef]
- Bouizgaren, A.; Farissi, M.; Ghoulam, C.; Kallida, R.; Faghire, M.; Barakate, M.; Al Feddy, M.N. Assessment of summer drought tolerance variability in Mediterranean alfalfa (Medicago sativa L.) cultivars under Moroccan fields conditions. Arch. Agron. Soil Sci. 2013, 59, 147–160. [Google Scholar] [CrossRef]
- Carter, P.R.; Sheaffer, C.C.; Voorhees, W.B. Root growth, herbage yield, and plant water status of alfalfa cultivars. Crop Sci. 1982, 22, 425–427. [Google Scholar] [CrossRef]
- Erice, G.; Louahlia, S.; Irigoyen, J.J.; Sanchez Diaz, M.; Avice, J.C. Biomass partitioning, morphology and water status of four alfalfa genotypes submitted to progressive drought and subsequent recovery. J. Plant Physiol. 2010, 167, 114–120. [Google Scholar] [CrossRef] [PubMed]
- Ni, Y.; Guo, Y.; Han, L.; Tang, H.; Conyers, M. Leaf cuticular waxes and physiological parameters in alfalfa leaves as influenced by drought. Photosynthetica 2012, 50, 458–466. [Google Scholar] [CrossRef]
- Quan, W.; Liu, X.; Wang, H.; Chan, Z. Comparative physiological and transcriptional analyses of two contrasting drought tolerant alfalfa varieties. Front. Plant Sci. 2016, 6, 1256. [Google Scholar] [CrossRef] [Green Version]
- Wang, W.; Kim, Y.; Lee, H.; Kim, K.; Deng, X.; Kwak, S. Analysis of antioxidant enzyme activity during germination of alfalfa under salt and drought stresses. Plant Physiol. Biochem. 2009, 47, 570–577. [Google Scholar] [CrossRef]
- Li, X.; Tong, L.; Niu, J.; Kang, S.; Du, T.; Li, S.; Ding, R. Spatio-temporal distribution of irrigation water productivity and its driving factors for cereal crops in Hexi Corridor, Northwest China. Agric. Water Manag. 2017, 179, 55–63. [Google Scholar] [CrossRef]
- Bao, C.; Fang, C. Water resources constraint force on urbanization in water deficient regions: A case study of the Hexi Corridor, arid area of NW China. Ecol. Econ. 2007, 62, 508–517. [Google Scholar] [CrossRef]
- Wen, Z.; Duan, T.; Christensen, M.J.; Nan, Z. Microdochium tabacinum, confirmed as a pathogen of alfalfa in Gansu province, China. Plant Dis. 2015, 99, 87–92. [Google Scholar] [CrossRef] [PubMed] [Green Version]
- Luo, Y.; Li, G. The effect of water stress on growth and biomass of Medicago sativa cv. Xinjiangdaye. Acta Pratacult. Sin. 2014, 23, 213–219. [Google Scholar] [CrossRef]
- Avola, G.; Riggi, E.; Gresta, F.; Sortino, O.; Onofri, A. Random effects models, BLUPs and redundancy analyses for grain legume crops in semi-arid environments. Eur. J. Agron. 2018, 93, 18–26. [Google Scholar] [CrossRef]
- Keating, B.A.; Carberry, P.S. Resource capture and use in intercropping: Solar radiation. Field Crops Res. 1993, 34, 273–301. [Google Scholar] [CrossRef]
- Monirifar, H. Path analysis of yield and quality traits in alfalfa. Not. Bot. Horti Agrobot. Cluj-Na. 2011, 39, 190–195. [Google Scholar] [CrossRef] [Green Version]
- Zhang, F.; Kang, J.; Long, R.; Yu, L.-X.; Wang, Z.; Zhao, Z.; Zhang, T.; Yang, Q. High-density linkage map construction and mapping QTL for yield and yield components in autotetraploid alfalfa using RAD-seq. BMC Plant Biol. 2019, 19, 165. [Google Scholar] [CrossRef] [Green Version]
- Avci, M.; Hatipoglu, R.; Çinar, S.; Kiliçalp, N. Assessment of yield and quality characteristics of alfalfa (Medicago sativa L.) cultivars with different fall dormancy rating. Legume Res. 2017, 41, 369–373. [Google Scholar] [CrossRef] [Green Version]
- Baldissera, T.C.; Frak, E.; Carvalho, P.C.; Louarn, G. Plant development controls leaf area expansion in alfalfa plants competing for light. Ann. Bot. 2014, 113, 145–157. [Google Scholar] [CrossRef] [Green Version]
- Theron, J.F.; Snyman, H.A. Productivity evaluation of Medicago sativa cultivars under irrigation in a semi-arid climate. Afr. J. Range Forage Sci. 2015, 32, 161–171. [Google Scholar] [CrossRef]
- Albrecht, K.A.; Wedin, W.F.; Buxton, D.R. Cell-wall composition and digestibility of alfalfa stems and leaves. Crop Sci. 1987, 27, 735–741. [Google Scholar] [CrossRef]
- Marten, G.; Buxton, D.; Barnes, R. Feeding value (forage quality). In Alfalfa and Alfalfa Improvement; Amer Society of Agronomy: Madison, WI, USA, 1988; Volume 14, pp. 463–491. [Google Scholar]
- Castonguay, Y.; Laberge, S.; Brummer, E.C.; Volenec, J.J. Alfalfa Winter Hardiness: A Research Retrospective and Integrated Perspective. In Advances in Agronomy; Academic Press: Cambridge, MA, USA, 2006; Volume 90, pp. 203–265. [Google Scholar]
- Su, P.; Liu, X.; Zhang, L.; Zhao, A.; Li, W.; Chen, H. Comparison of δ 13C values and gas exchange of assimilating shoots of desert plants Haloxylon ammodendron and Calligonum mongolicum with other plants. Isr. J. Plant Sci. 2004, 52, 87–97. [Google Scholar] [CrossRef]
- Su, Y.; Wang, J.; Yang, R.; Yang, X.; Fan, G. Soil texture controls vegetation biomass and organic carbon storage in arid desert grassland in the middle of Hexi Corridor region in Northwest China. Soil Res. 2015, 53, 366–376. [Google Scholar] [CrossRef]
- Linze Farming Ecosystem Experimental Station. Linze Inland River Basin Research Station, Gansu Province. National Science & Technology Infrastructure. Available online: http://lzd.cern.ac.cn/meta/metaData (accessed on 1 February 2021).
- Hanson, A.A.; Barnes, D.K.; Hill, R.R.; Fick, G.W.; Holt, D.A.; Lugg, D.G. Environmental physiology and crop growth. In Alfalfa and Alfalfa Improvement; Amer Society of Agronomy: Madison, WI, USA, 1988; Volume 5, pp. 163–194. [Google Scholar]
- Purcell, L.C. Soybean canopy coverage and light interception measurements using digital imagery. Crop Sci. 2000, 40, 834–837. [Google Scholar] [CrossRef]
- Wickham, H. ggplot2: Create Elegant Data Visualisations Using the Grammar of Graphics. Version 3.3.5. 25 June. 2021. Available online: https://cran.r-project.org/web/packages/ggplot2/index.html (accessed on 17 February 2022).
- Kassambara, A.; Mundt, F. Factoextra: Extract and Visualize the Results of Multivariate Data Analyses. Version 1.0.7. 1 April. 2020. Available online: https://cran.r-project.org/web/packages/factoextra/index.html (accessed on 17 February 2022).
- Wania, A.; Kühn, I.; Klotz, S. Plant richness patterns in agricultural and urban landscapes in Central Germany—Spatial gradients of species richness. Landsc. Urban Plan. 2006, 75, 97–110. [Google Scholar] [CrossRef]


| DF | PHS | PHF | 1st Yield | 2nd Yield | 3rd Yield | 4th Yield | Annual Yield | |
|---|---|---|---|---|---|---|---|---|
| Year | 1 | 0.224 | 0.125 | <0.001 | <0.001 | <0.001 | <0.001 | <0.001 |
| Variety | 9 | <0.001 | <0.001 | <0.001 | <0.001 | <0.001 | <0.001 | <0.001 |
| Year × variety | 9 | <0.001 | <0.001 | <0.001 | <0.001 | <0.001 | <0.001 | <0.001 |
| PHS | PHF | PB | SB | LAI | LI | S/L | Y1C1 | Y1T | YT | |
|---|---|---|---|---|---|---|---|---|---|---|
| PHS | 1 | |||||||||
| PH | 0.577 *** | 1 | ||||||||
| PB | 0.018 | 0.300 | 1 | |||||||
| SB | 0.125 | −0.011 | 0.100 | 1 | ||||||
| LAI | 0.386 | 0.242 | −0.213 | −0.343 | 1 | |||||
| LI | 0.425 | 0.206 | −0.119 | −0.157 | 0.875 *** | 1 | ||||
| S/L | 0.295 | 0.574 *** | 0.403 * | 0.129 | −0.023 | −0.039 | 1 | |||
| Y1C1 | 0.493 ** | 0.548 ** | 0.55 ** | 0.273 | −0.07 | 0.018 | 0.462 | 1 | ||
| Y1T | 0.648 *** | 0.495 ** | 0.332 | 0.251 | 0.067 | 0.137 | 0.652 *** | 0.702 *** | 1 | |
| YT | 0.587 *** | 0.45 | −0.092 | −0.192 | 0.552 ** | 0.576 *** | 0.111 | 0.32 | 0.455 | 1 |
| Name | Type | Country of Origin | Institution-Provided Seed |
|---|---|---|---|
| Derby | Cultivar | United Kingdom | Lanzhou University |
| Gannong No. 3 | Cultivar | China | Gansu Agriculture University |
| Gannong No. 5 | Cultivar | China | Gansu Agriculture University |
| Phabulous | Cultivar | United States | USDA-NPGS |
| Sanditi | Cultivar | France | Lanzhou University |
| WL168HQ | Cultivar | United States | USDA-NPGS |
| WL343HQ | Cultivar | United States | USDA-NPGS |
| Wudi | Land race | China | Lanzhou University |
| Xinjiang Daye | Land race | China | Lanzhou University |
| Xinmu No. 2 | Cultivar | China | Lanzhou University |
Publisher’s Note: MDPI stays neutral with regard to jurisdictional claims in published maps and institutional affiliations. |
© 2022 by the authors. Licensee MDPI, Basel, Switzerland. This article is an open access article distributed under the terms and conditions of the Creative Commons Attribution (CC BY) license (https://creativecommons.org/licenses/by/4.0/).
Share and Cite
Jia, X.; Zhang, Z.; Wang, Y. Forage Yield, Canopy Characteristics, and Radiation Interception of Ten Alfalfa Varieties in an Arid Environment. Plants 2022, 11, 1112. https://doi.org/10.3390/plants11091112
Jia X, Zhang Z, Wang Y. Forage Yield, Canopy Characteristics, and Radiation Interception of Ten Alfalfa Varieties in an Arid Environment. Plants. 2022; 11(9):1112. https://doi.org/10.3390/plants11091112
Chicago/Turabian StyleJia, Xitao, Zhixin Zhang, and Yanrong Wang. 2022. "Forage Yield, Canopy Characteristics, and Radiation Interception of Ten Alfalfa Varieties in an Arid Environment" Plants 11, no. 9: 1112. https://doi.org/10.3390/plants11091112
APA StyleJia, X., Zhang, Z., & Wang, Y. (2022). Forage Yield, Canopy Characteristics, and Radiation Interception of Ten Alfalfa Varieties in an Arid Environment. Plants, 11(9), 1112. https://doi.org/10.3390/plants11091112