1. Introduction
Tryptophan is a non-polar aromatic amino acid synthesized in plants [
1]. It is also known as a precursor of indole-3-acetic acid (IAA), the most common naturally occurring auxin [
1]. IAA promotes cell division and plays an important role in the induction of lateral root formation [
2,
3,
4]. The synthesis of IAA from tryptophan occurs not only in plants but also in rhizosphere microorganisms. In plants, it involves two steps that are mediated by tryptophan aminotransferase and YUC flavin-containing monooxygenases [
5,
6,
7]. By contrast, rhizosphere microorganisms have different IAA synthesis pathways, such as the indole-3-acetamide-mediated pathway by
Pseudomonas syringae and the indole-3-pyruvic acid-mediated pathway by
Agrobacterium tumefaciens [
8,
9,
10].
Because tryptophan is a precursor of IAA that promotes root development, growth-promoting effects of tryptophan application have been investigated in several crops. In a greenhouse experiment, Adou Dahab et al. [
11] reported that foliar spray application of tryptophan at 100 mg L
−1 increased plant height by 46%, leaf number by 57%, and leaf area by 34% in blushing philodendron (
Philodendron erubescens). Sudadi et al. [
12] also reported that foliar spray application of tryptophan at 1 mg L
−1 increased yield of soybean by up to 102% (
Glycine max) in a greenhouse experiment. In addition, Mustafa et al. [
13] found that soil application of tryptophan at 40 mg kg
−1 increased plant height by 58% and fruit length by 27% in okra (
Abelmoschus esculentus) in a greenhouse experiment. However, these previous studies evaluated only above-ground growth and yield, and the efficacy of tryptophan as a root growth-promoting agent is still unclear.
Investigation of root morphological traits is challenging because of the laborious process and difficulties in obtaining valid root samples without excessive damage. Traditional root investigation methods include root excavation and soil core sampling [
14]. By contrast, recent root research often uses rhizotron systems and image analysis procedures that allow non-destructive and repeated root morphological analysis. Several image processing and analysis programs are available for root measurements, including WinRHIZO Tron, RootSnap, ImageJ, and RootNav 2.0. Recently, Seethepalli et al. [
15] introduced RhizoVision Analyzer, which is open-source software developed for high-throughput root crown phenotyping. These new root analysis methods have been employed in many studies. Adu et al. [
16] evaluated root morphological traits of
Brassica rapa genotypes using a scanner-based rhizotron system. Davies et al. [
17] also used a scanner-based rhizotron system and evaluated root responses of beech (
Fagus sylvatica) to indole-3-butyric acid (IBA, a naturally occurring auxin) treatment. Nagel et al. [
18] analyzed root geometry and temporal growth responses in Arabidopsis (
Arabidopsis thaliana L. Heynh) and barley (
Hordeum vulgare) using an automatic phenotyping system developed for rhizotrons.
We developed a scanner-based rhizotron system suitable for non-destructive root evaluation of soybean seedlings [
19]. In this rhizotron system, soybean root projected area showed a significant linear correlation between two image analysis programs, ImageJ and WinRHIZO Tron, throughout the evaluation period [
19]. Furthermore, there was a significant correlation in root projected area measured undestructively by ImageJ and destructively by WinRHIZO. ImageJ is an open-source image processing program used in diverse scientific fields. By contrast, WinRHIZO and WinRHIZO Tron are commercial programs developed specifically for root image analysis. WinRHIZO allows automatic and interactive root measurements for washed root images, whereas WinRHIZO Tron performs manual root measurements for rhizotron or in situ root images.
Using the rhizotron system and root image analysis protocols developed in our previous study, the objectives of this study were to characterize root morphological responses of soybean seedlings to exogenous tryptophan and to evaluate its potential as a biostimulant.
2. Results
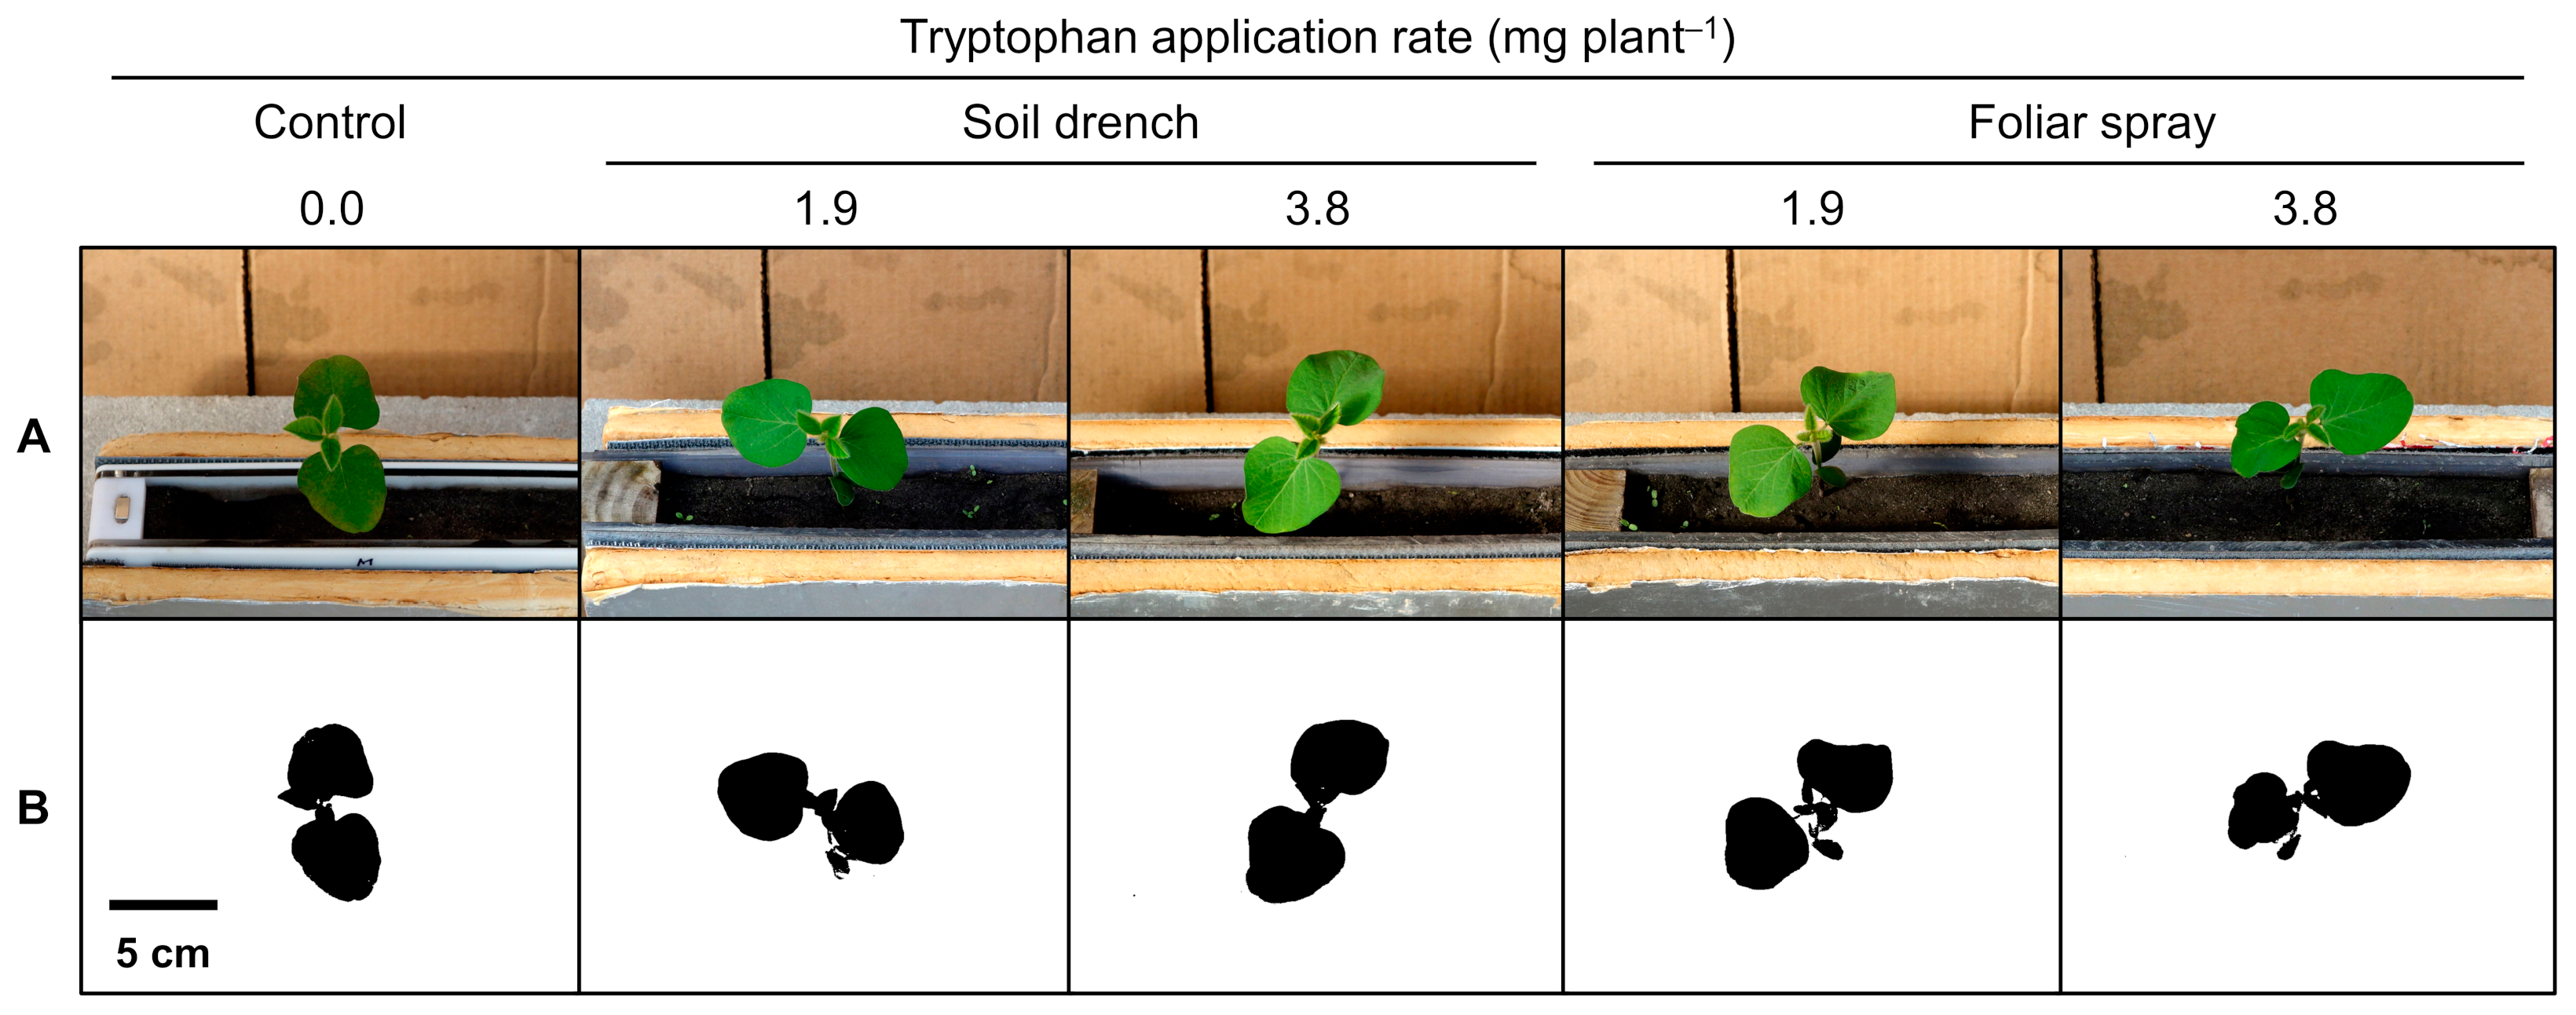
2.1. Canopy Projected Area
Overhead canopy images acquired at 18 days after sowing (DAS) are presented in
Figure 1. Canopy projected area data are presented in
Table 1. In the control, canopy projected area increased steadily by 116% from 11 to 18 DAS (11.7 vs. 25.3 cm
2 plant
−1). Both multiple comparisons and contrast analysis detected significant differences between the control and tryptophan treatments only at 18 DAS. The tryptophan soil drench treatment at 1.9 mg plant
−1 had 27% greater canopy projected area than the control (25.3 vs. 32.2 cm
2 plant
−1,
p < 0.05). The pooled soil drench treatments had 20% greater canopy projected area than the control (25.3 vs. 30.3 cm
2 plant
−1,
p = 0.0218). When pooling all tryptophan treatments, the pooled treatments had 14% greater canopy projected area than the control (25.3 vs. 28.9 cm
2 plant
−1,
p = 0.0672).
Contrast analysis also detected significant differences between the two tryptophan application methods. The pooled soil drench treatments had 19% and 11% greater canopy projected area than the pooled foliar spray treatments at 11 (11.2 vs. 13.3 cm2 plant−1, p = 0.0998) and 18 DAS (27.4 vs. 30.3 cm2 plant−1, p = 0.0985), respectively.
When tryptophan was applied through foliar spray, it had no significant effect on canopy projected area throughout the experiment.
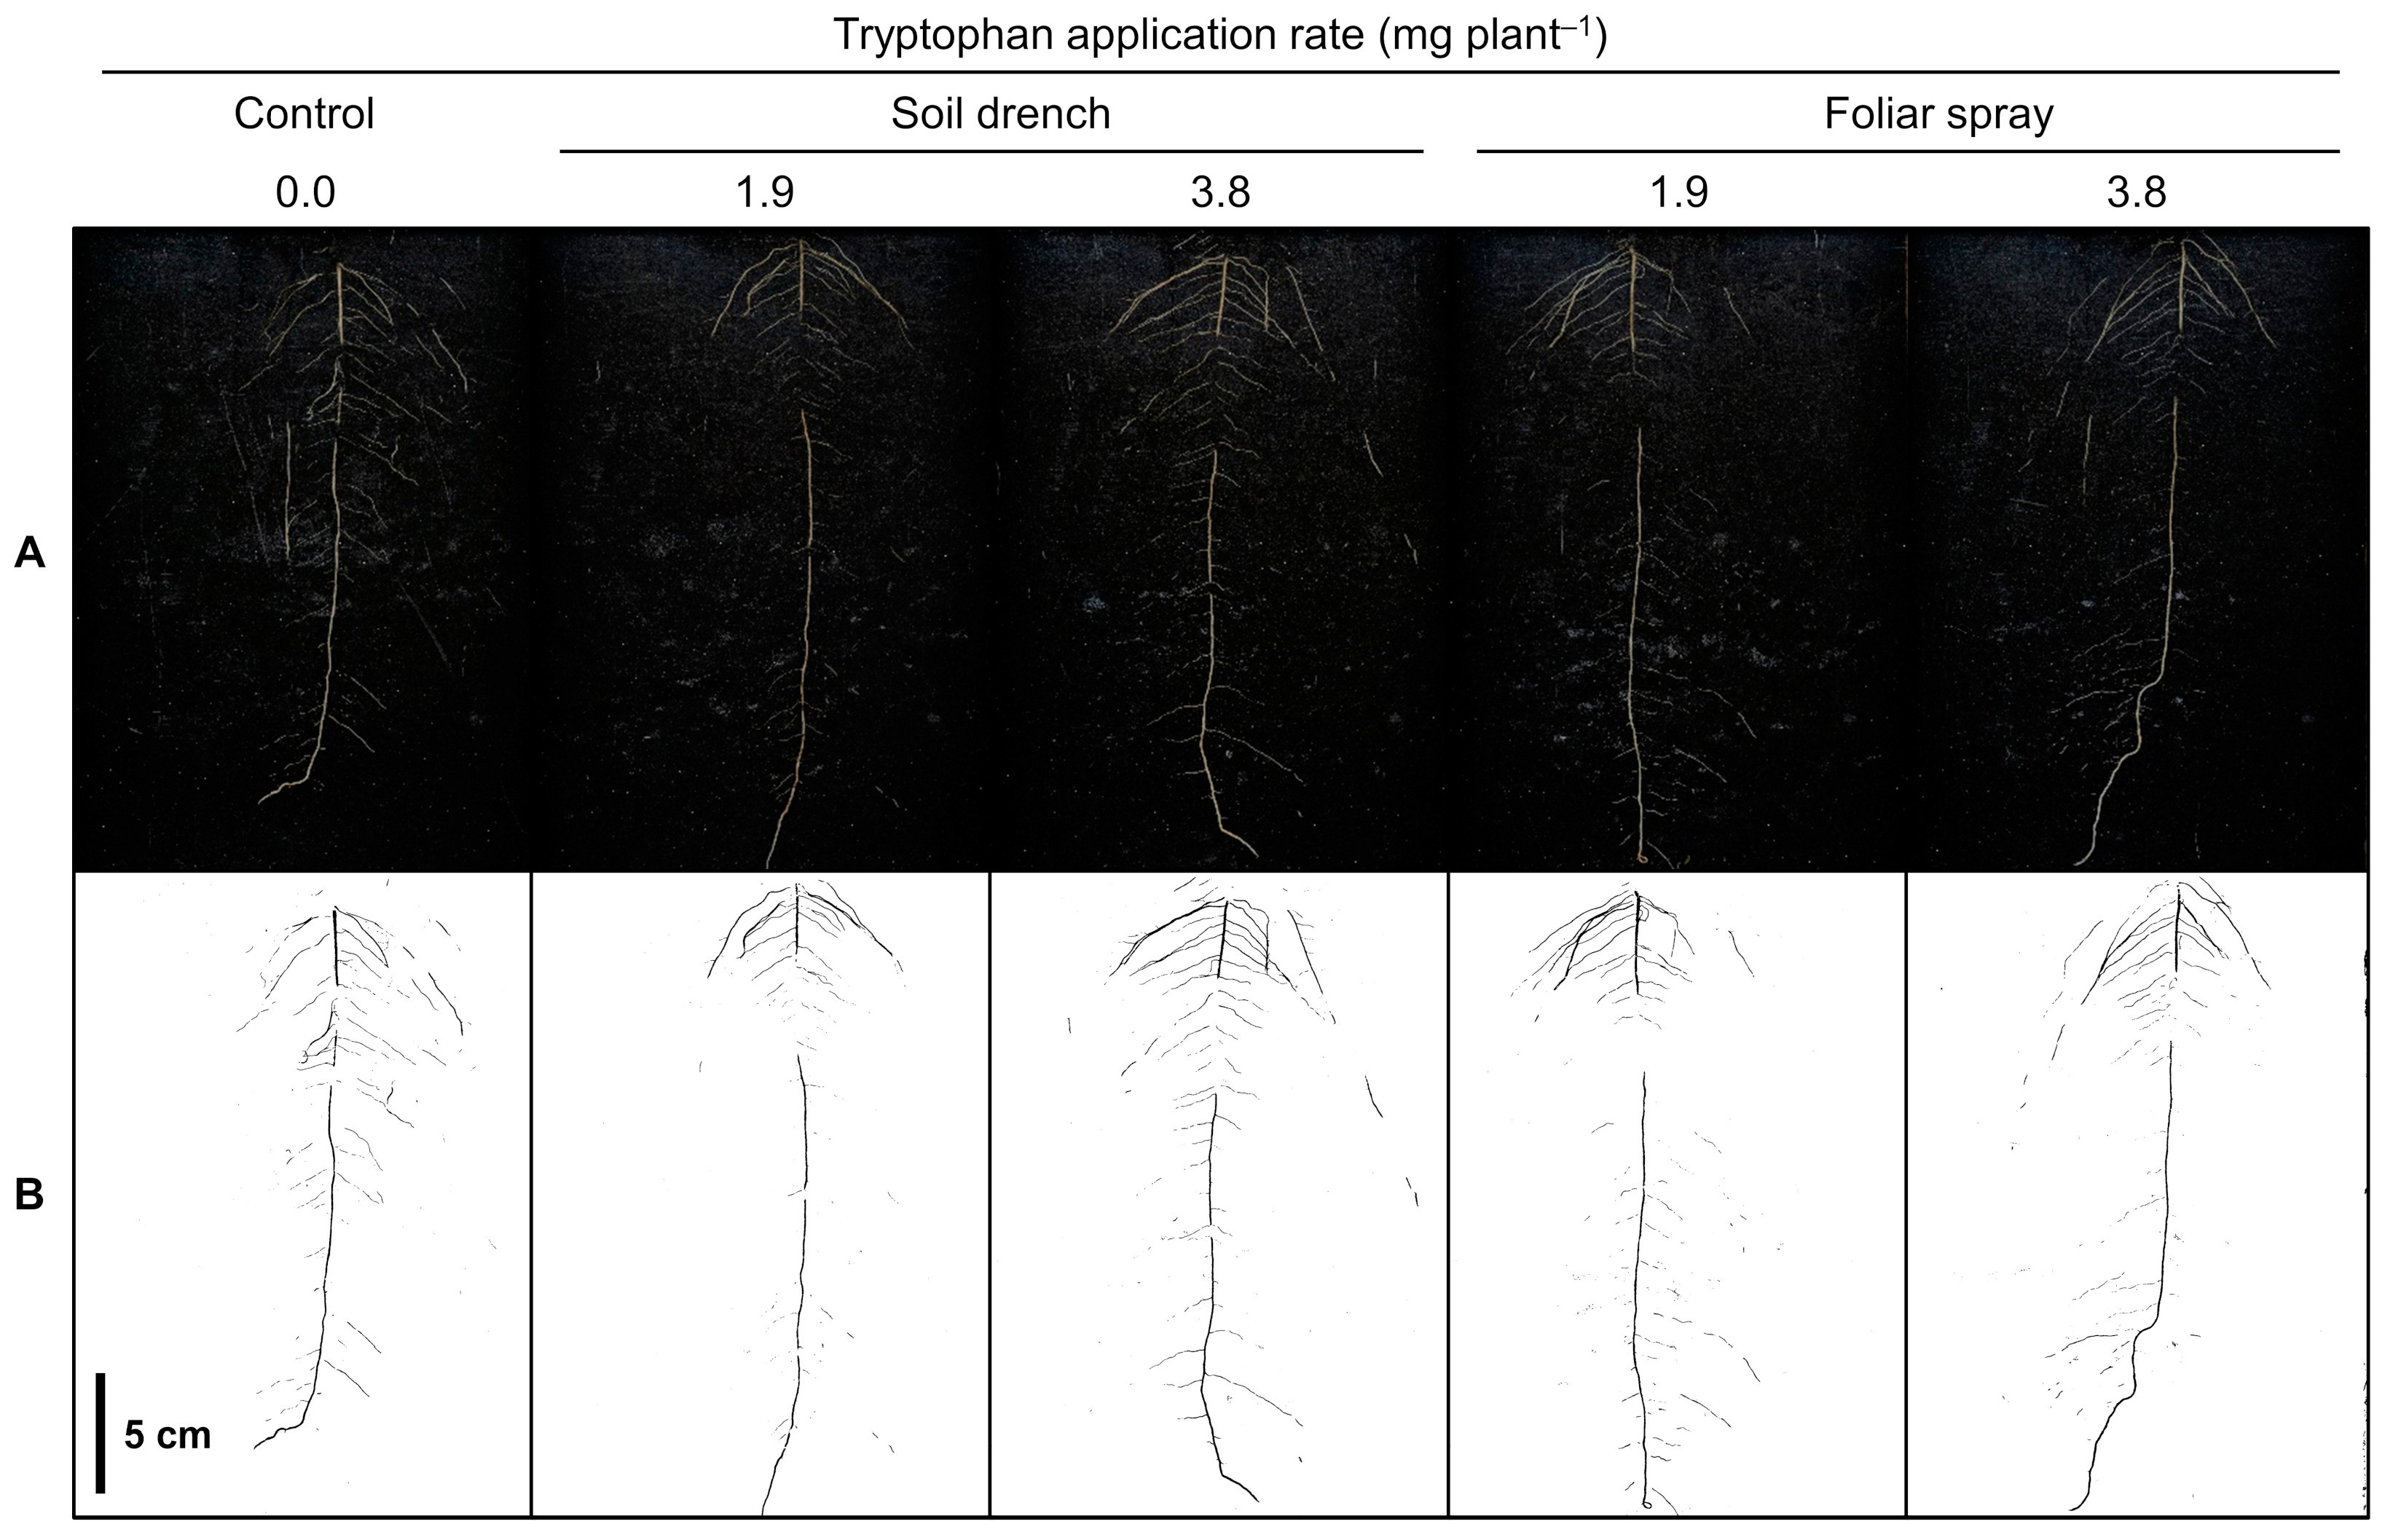
2.2. Root Projected Area (Rhizotron Image Analysis)
Rhizotron root images acquired at 18 DAS are presented in
Figure 2B. Root projected area data are presented in
Table 2. In the control, root projected area increased steadily by 513% from 5 to 18 DAS (1.21 vs. 7.42 cm
2 plant
−1). Both multiple comparisons and contrast analysis detected significant differences only at 18 DAS. The tryptophan soil drench treatment at 3.8 mg plant
−1 had 29% greater root projected area than the control (7.42 vs. 9.60 cm
2 plant
−1,
p < 0.10). The pooled soil drench treatments had 11% greater root projected area than the control (7.42 vs. 8.27 cm
2 plant
−1,
p = 0.0936). The pooled foliar spray treatments had 14% greater root projected area than the control (7.42 vs. 8.47 cm
2 plant
−1,
p = 0.0717). When pooling all tryptophan treatments, the pooled treatments had 13% greater root projected area than the control (7.42 vs. 8.37 cm
2 plant
−1,
p = 0.0670).
No significant difference was detected between soil drench and foliar spray treatments throughout the experiment.
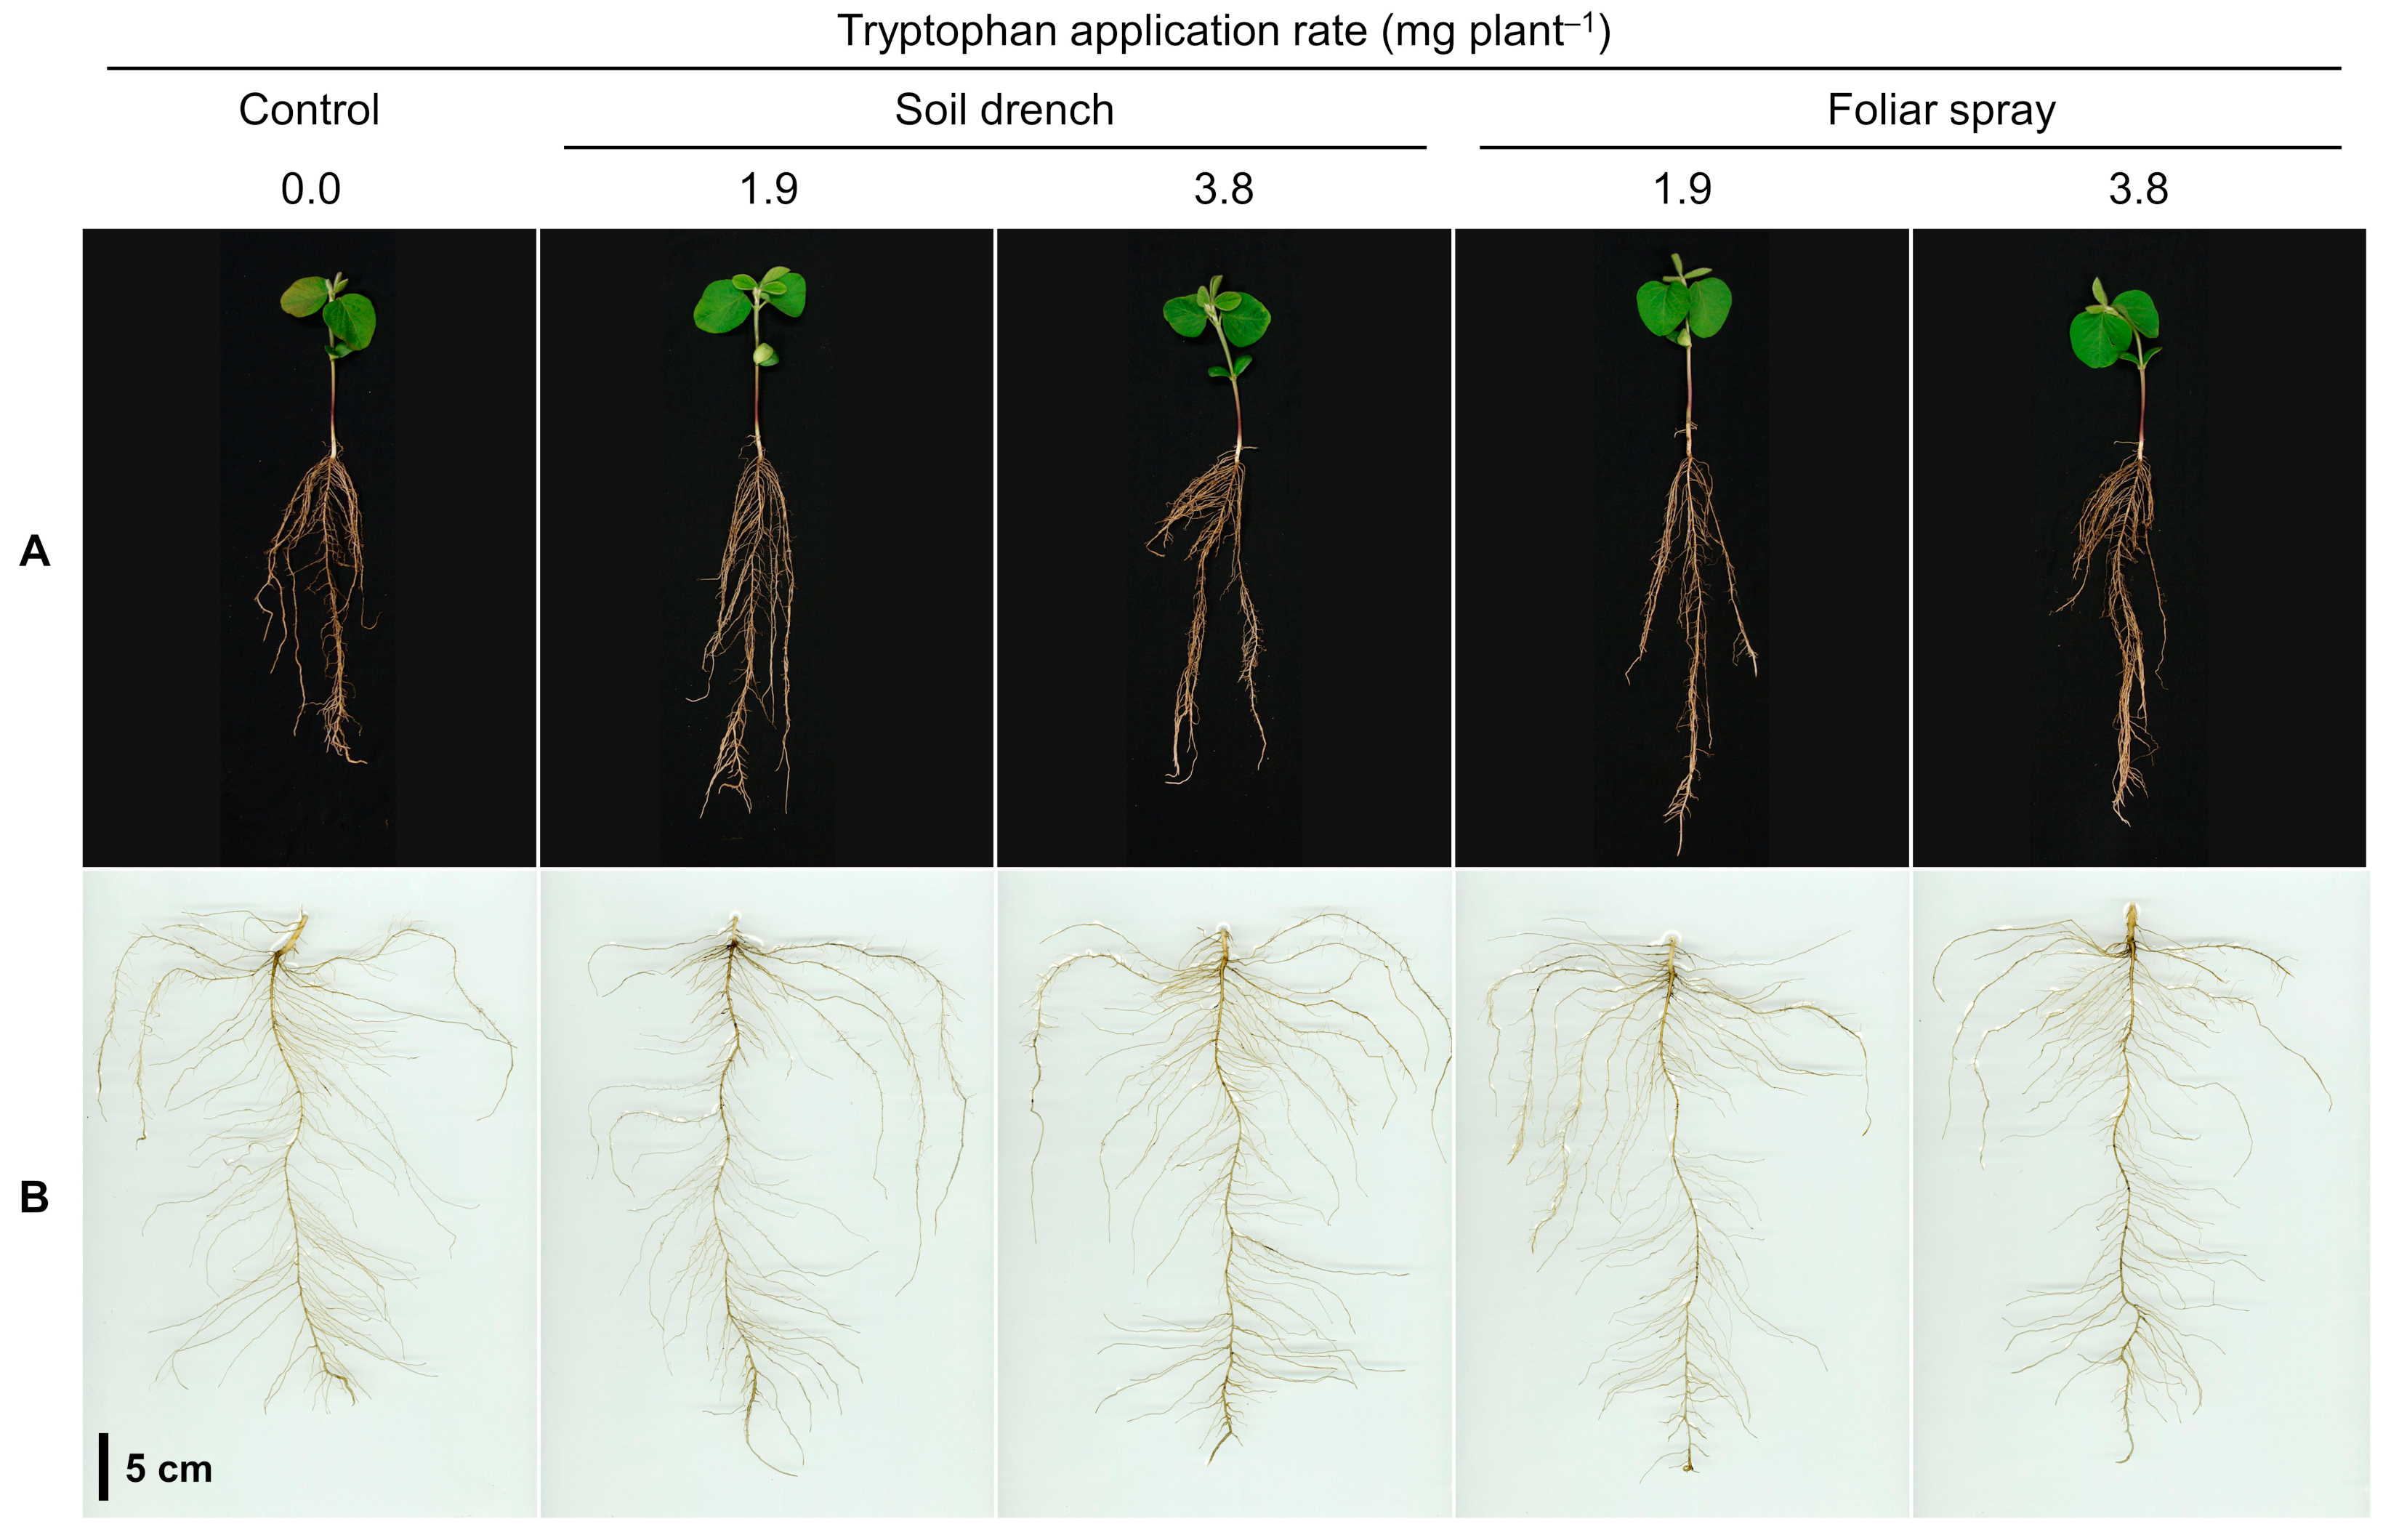
2.3. Root Diameter and Lateral Root Number (WinRHIZO Image Analysis)
Seedlings sampled at 18 DAS are shown in
Figure 3A, and their washed roots are shown in
Figure 3B. Root diameter and lateral root number measured after destructive sampling at 18 DAS are presented in
Table 3. The average root diameter ranged from 400 and 424 µm was unaffected by tryptophan treatments.
Secondary root number showed significant treatment effects, according to both multiple comparisons and contrast analysis. The tryptophan soil drench treatment at 1.9 mg plant−1 and foliar spray treatments at 1.9 and 3.8 mg plant−1 had 13% to 18% greater secondary root number than the control (120 vs. 135–142 plant−1, p < 0.10). The pooled soil drench treatments had 10% greater secondary root number than the control (120 vs. 132 plant−1, p = 0.0841). The pooled foliar spray treatments had 16% greater secondary root number than the control (120 vs. 139 plant−1, p = 0.0066). When pooling across all tryptophan treatments, the pooled treatments had 13% greater secondary root number than the control (120 vs. 136 plant−1, p = 0.0594).
Tertiary root number ranged from 1475 to 1844 plant−1 and was unaffected by tryptophan treatments.
2.4. Root Length (WinRHIZO Image Analysis)
Root length data collected after destructive sampling at 18 DAS are presented in
Table 4. Responses of primary root length to tryptophan varied between the two application methods. The tryptophan foliar spray treatment at 1.9 mg plant
−1 had 10% longer primary root length than the control (28.8 vs. 31.7 cm plant
−1,
p < 0.10). The tryptophan foliar spray treatments at 1.9 and 3.8 mg plant
−1 had 15% and 13% longer primary root length than the tryptophan soil drench treatment at 3.8 mg plant
−1, respectively (27.5 vs. 31.2–31.7 cm plant
−1,
p < 0.10). The pooled foliar spray treatments had 9% longer primary root length than the control and the pooled soil drench treatments (28.8–28.9 vs. 31.4 cm plant
−1,
p = 0.0384).
Secondary root length (≥0.2 mm diameter) ranged from 497 to 580 cm plant−1 and was unaffected by tryptophan treatments.
Tertiary root length (<0.2 mm diameter) showed significant treatment effects, according to contrast analysis. The pooled soil drench treatments had 25% greater tertiary root length than the control and the pooled foliar spray treatments (205 vs. 250 cm plant−1, p = 0.0428–0.0522). No significant difference was detected between the control and the pooled foliar spray treatments.
The pooled soil drench treatments had 16% greater total lateral root length (secondary + tertiary roots) than the control (702 vs. 812 cm plant−1, p = 0.0860). Similarly, the pooled soil drench treatments had 16% greater total root length (primary + lateral) than the control (731 vs. 851 cm plant−1, p = 0.0858). No other significant differences were detected in these root length variables.
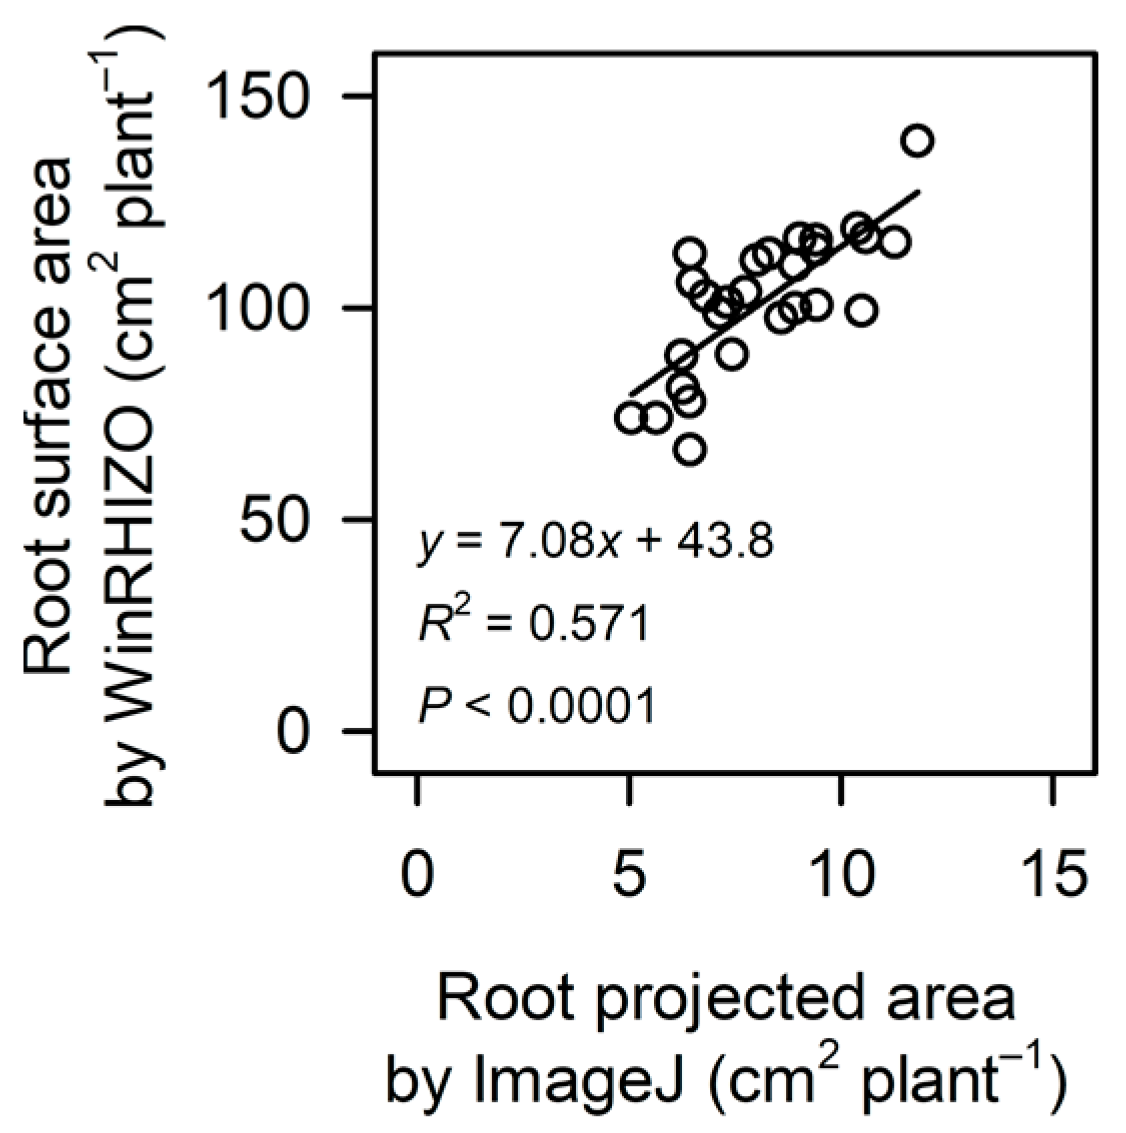
2.5. Root Surface Area (WinRHIZO Image Analysis)
Root surface area data collected after destructive sampling at 18 DAS are presented in
Table 5. According to contrast analysis, primary root surface area was 7% greater in the pooled foliar spray treatments than in the pooled soil drench treatments (13.5 to 14.4 cm
2 plant
−1,
p = 0.0848).
Secondary root surface area (≥0.2 mm diameter) ranged from 66.6 to 80.5 cm2 plant−1 and was unaffected by tryptophan treatments.
Tertiary root surface area (<0.2 mm diameter) showed significant treatment effects, according to contrast analysis. The pooled soil drench treatments had 21% to 22% greater tertiary root surface area than the control and the pooled foliar spray treatments (9.1–9.2 vs. 11.1 cm2 plant−1, p = 0.0509–0.0770). No significant difference was detected between the control and the pooled foliar spray treatments.
The pooled soil drench treatments had 13% greater total lateral root surface area (secondary + tertiary roots) than the pooled foliar spray treatments (77.8 vs. 88.0 cm2 plant−1, p = 0.0905). No other significant differences were detected.
Total root surface area (primary + lateral roots) was unaffected by tryptophan treatments, according to both multiple comparisons and contrast analysis. There was a significant correlation between root projected area measured non-destructively on rhizotron images with ImageJ software and root surface area measured destructively on washed-root images with WinRHIZO software in soybean seedlings (
Figure 4).
2.6. Shoot and Root Growth (Plant Sampling)
Shoot ad root growth data collected after destructive plant sampling at 18 DAS are presented in
Table 6. Stem diameter showed significant treatment effects, according to multiple comparisons. The tryptophan soil drench treatment at 3.8 mg plant
−1 had 8% larger stem diameter than the soil drench treatment at 1.9 mg plant
−1 and the foliar spray treatment at 3.8 mg plant
−1 (2.45 vs. 2.65 mm,
p < 0.05).
Leaf area showed significant treatment effects, according to both multiple comparisons and contrast analysis. The tryptophan soil drench treatment at 3.8 mg plant−1 had 15% and 30% greater leaf area than the foliar spray treatments at 1.9 and 3.8 mg plant−1, respectively (32.0–36.3 vs. 41.6 cm2 plant−1, p < 0.10). The pooled soil drench treatments had 16% greater leaf area than the pooled foliar spray treatments (34.2 vs. 39.8 cm2 plant−1, p = 0.0139).
Shoot dry weight ranged from 183 to 213 g plant−1 and was unaffected by tryptophan treatments. By contrast, root dry weight showed significant treatment effects, according to both multiple comparisons and contrast analysis. The tryptophan soil drench treatment at 3.8 mg plant−1 and foliar spray treatment at 1.9 mg plant−1 had 43% and 25% greater root dry weight than the control, respectively (60.5 vs. 75.7–86.3 g plant−1, p < 0.05). Increasing the tryptophan application rate for soil drenching from 1.9 to 3.8 mg plant−1 increased root dry weight by 19% (72.3 vs. 86.3 g plant−1, p < 0.05). The pooled soil drench and foliar spray treatments had 31% and 20% greater root dry weight than the control, respectively (60.5 vs. 72.8–79.3 g plant−1, p = 0.0013–0.0261). When pooling all tryptophan treatments, the pooled treatments had 26% greater root dry weight than the control (60.5 vs. 76.0 g plant−1, p = 0.0046).
Root:shoot ratio also showed significant treatment effects. According to multiple comparisons, all tryptophan treatments had 20% to 29% greater root:shoot ratio than the control (0.315 vs. 0.379–0.406, p < 0.05), and there was no significant difference among tryptophan treatments. The pooled soil drench and foliar spray treatments had 22% and 26% greater root:shoot ratio than the control, respectively (0.315 vs. 0.384–0.397, p = 0.0005–0.0027). When pooling all tryptophan treatments, the pooled treatments had 24% greater root:shoot ratio than the control (0.315 vs. 0.390, p = 0.0005).
4. Materials and Methods
4.1. Tryptophan Treatments
There were five treatments: water control, soil drench application of tryptophan at 1.9 and 3.8 mg plant−1, and foliar spray application of tryptophan at 1.9 and 3.8 mg plant−1. Tryptophan was applied at 1.9 and 3.8 mg plant−1 by both methods but with different concentrations and volumes: 19 and 38 mg L−1 at 100 mL plant−1 for soil drenching and 1900 and 3800 mg L−1 at 1 mL plant−1 for foliar spray. Soil drench treatments were performed immediately after emergence (5 DAS), whereas foliar spray treatments were performed at the unifoliate leaf stage (10 DAS). Deionized water was used to prepare all tryptophan solutions. The control plants were sprayed with deionized water (1 mL plant−1) at 10 DAS. All treatments were performed between 10:00 and 11:00 a.m.
4.2. Rhizotron Experiment
A greenhouse experiment was conducted at the University of Florida’s Gulf Coast Research and Education Center in Balm, Florida, United States (latitude 27°76′, longitude 82°23′W; elevation 39 m) using a scanner-based rhizotron system described by Agehara and Sanada [
19]. The soil at this study site is classified as Myakka fine sand (sandy, siliceous, Hyper-thermic Oxyaquic Alorthods). Granular fertilizers were incorporated into the soil at a depth of 15 cm to supply 56, 49, and 93 kg of nitrogen, phosphorous, and potassium per hectare, respectively. The surface (15 cm depth) soil was collected and sieved through 5 mm mesh to remove large organic residues and other debris. The soil had pH of 6.7 and organic matter content of 10 g kg
−1. Each rhizotron was packed with the soil at 2655 cm
3 using the same bulk density as in the field (1.67 g cm
–3). Rhizotrons were inclined at 30° on a rack to maximize the root contact on the lower scanning window (
Figure 5). Three seeds were sown 2 cm deep along the lower scanning window in each rhizotron. After emergence, two seedlings were thinned to keep only one uniform plant per rhizotron. Plants were grown in rhizotrons until 18 DAS.
4.3. Canopy Image Analysis
Overhead canopy images were acquired using a digital camera (Cyber-shot DSC-RX100; Sony, Tokyo, Japan) at about 1 m above the plant canopy at 11, 14, and 18 DAS. All images were saved in JPEG format. Images were processed using ImageJ software (
http://rsb.info.nih.gov/ij/, accessed on 4 August 2022) following the methods described by Agehara [
36].
4.4. Rhizotron Root Image Analysis
Rhizotron root images were acquired using a flat-bed scanner (perfection V800; Epson, Nagano, Japan) at 5, 8, 11, 14, and 18 DAS. All images were saved in JPEG format at 300 dots per inch (dpi). Root scanning was performed only on the lower rhizotron window throughout the experiment because no roots were visible on the upper rhizotron window.
Root images were processed and analyzed using ImageJ software. After converting images from 24-bit color to 8-bit grayscale, thresholding was performed to distinguish root pixels from all background pixels. The optimal threshold values were selected to remove background pixels with minimum changes in root diameter. After thresholding, images were converted to a binary format in which root and background pixels were displayed in black and white, respectively. The total area of black pixels was measured and recorded as root projected area.
4.5. Plant Sampling and Growth Measurements
At the end of the experiment (18 DAS), plants were sampled from rhizotrons by gently washing roots to remove soil. Stem diameter was measured immediately below the cotyledonary node using a digital caliper (Absolute Digimatic Caliper Series 500; Mitutoyo, Kanagawa, Japan). Leaf area was measured using an optical area meter (LI-3100; LI-COR, Lincoln, NE, USA). Roots were separated from the shoot at the root–shoot junction. Shoots were dried at 65 °C for 48 h to determine dry weight. Roots were washed thoroughly and stored in 60% ethanol solution until root scanning. After root scanning, roots were dried at 65 °C for 48 h to determine dry weight. Root scanning and image analysis procedures are described below.
4.6. Image Analysis of Washed Roots
Washed roots were placed in an acrylic tray filled with water and carefully spread to minimize the overlapping of roots. Roots were then scanned using a flat-bed scanner (EPSON 10000 XL, Epson, Nagano, Japan). All images were saved in JPEG format at 400 dpi. Root images were analyzed using WinRHIZO software (WinRHIZO Arabidopsis 2019a; Regent Instruments, Quebec, Canada). Root images were first converted into binary images using the threshold setting that optimized the segmentation of roots. Images were then analyzed to determine several root traits, including root diameter, number of tips (root number), root length, and root surface area. Two diameter classes were used for >0.2 mm and ≤0.2 mm.
Primary roots were visually determined, and primary root length and surface area were measured using SmartRoot, a plugin for ImageJ. Secondary root length and surface area were calculated by subtracting the primary root data from the WinRHIZO data of roots with a thickness of >0.2 mm. Tertiary root length and surface area were determined by WinRHIZO with a diameter threshold of ≤0.2 mm.
4.7. Experiment Design and Statistical Analysis
Treatments were arranged in a randomized complete block design. Each treatment had six replicates (rhizotrons).
All data were analyzed using the generalized linear mixed model procedure (PROC GLIMMIX) in SAS statistical software (SAS 9.4; SAS Institute, Cary, NC, USA). The best model was selected based on the smallest corrected Akaike information criterion. Continuous data (all data except for root number) were modeled with the lognormal distribution (DIST = LOGNORMAL). For model parameter estimation, boundary constraints on covariance were removed (NOBOUND), and degrees of freedom for the fixed effects were adjusted by the Kenward–Roger degrees of freedom approximation (DDFM = KR). Count data (root number) were modeled with the negative binomial distribution (DIST = NEGBIN). Model parameters were estimated by using maximum likelihood estimation with quadrature approximation (METHOD = QUAD) and default bias-corrected sandwich estimators (EMPIRICAL = MBN)
Multiple comparisons of least squares means were performed using the Fisher’s LSD method. In addition, contrast analysis was used to test specific hypotheses. First, we hypothesized that all tryptophan treatments have equivalent growth modulating effects, thereby comparing the control with the pooled tryptophan treatments. Second, we hypothesized that tryptophan has different growth modulating effects depending on the application method, thereby comparing the control with the pooled soil drench treatments or with the pooled foliar spray treatments. We also compared the pooled soil drench treatments and the pooled foliar spray treatments. For all data analyzed, p values less than 0.05 or 0.10 were considered to be statistically significant.
Continuous data were back-transformed by exponentiating the sum of the least square mean and the correction factor. Count data were rescaled to the original scale by using the inverse link option (ILINK) in the LSMEANS statement. Back-transformed or rescaled data are reported in this study.


