
Development and Complex Application of Methods for the Identification of Mutations in the FAD3A and FAD3B Genes Resulting in the Reduced Content of Linolenic Acid in Flax Oil
 , , , , , and
Abstract
:
1. Introduction
2. Results
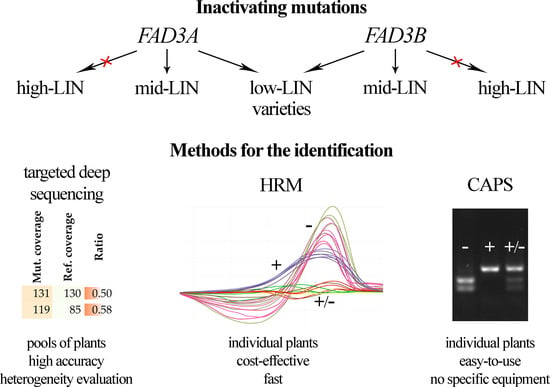
2.1. Selected Mutations of FAD3 Genes
2.2. Targeted Deep Sequencing
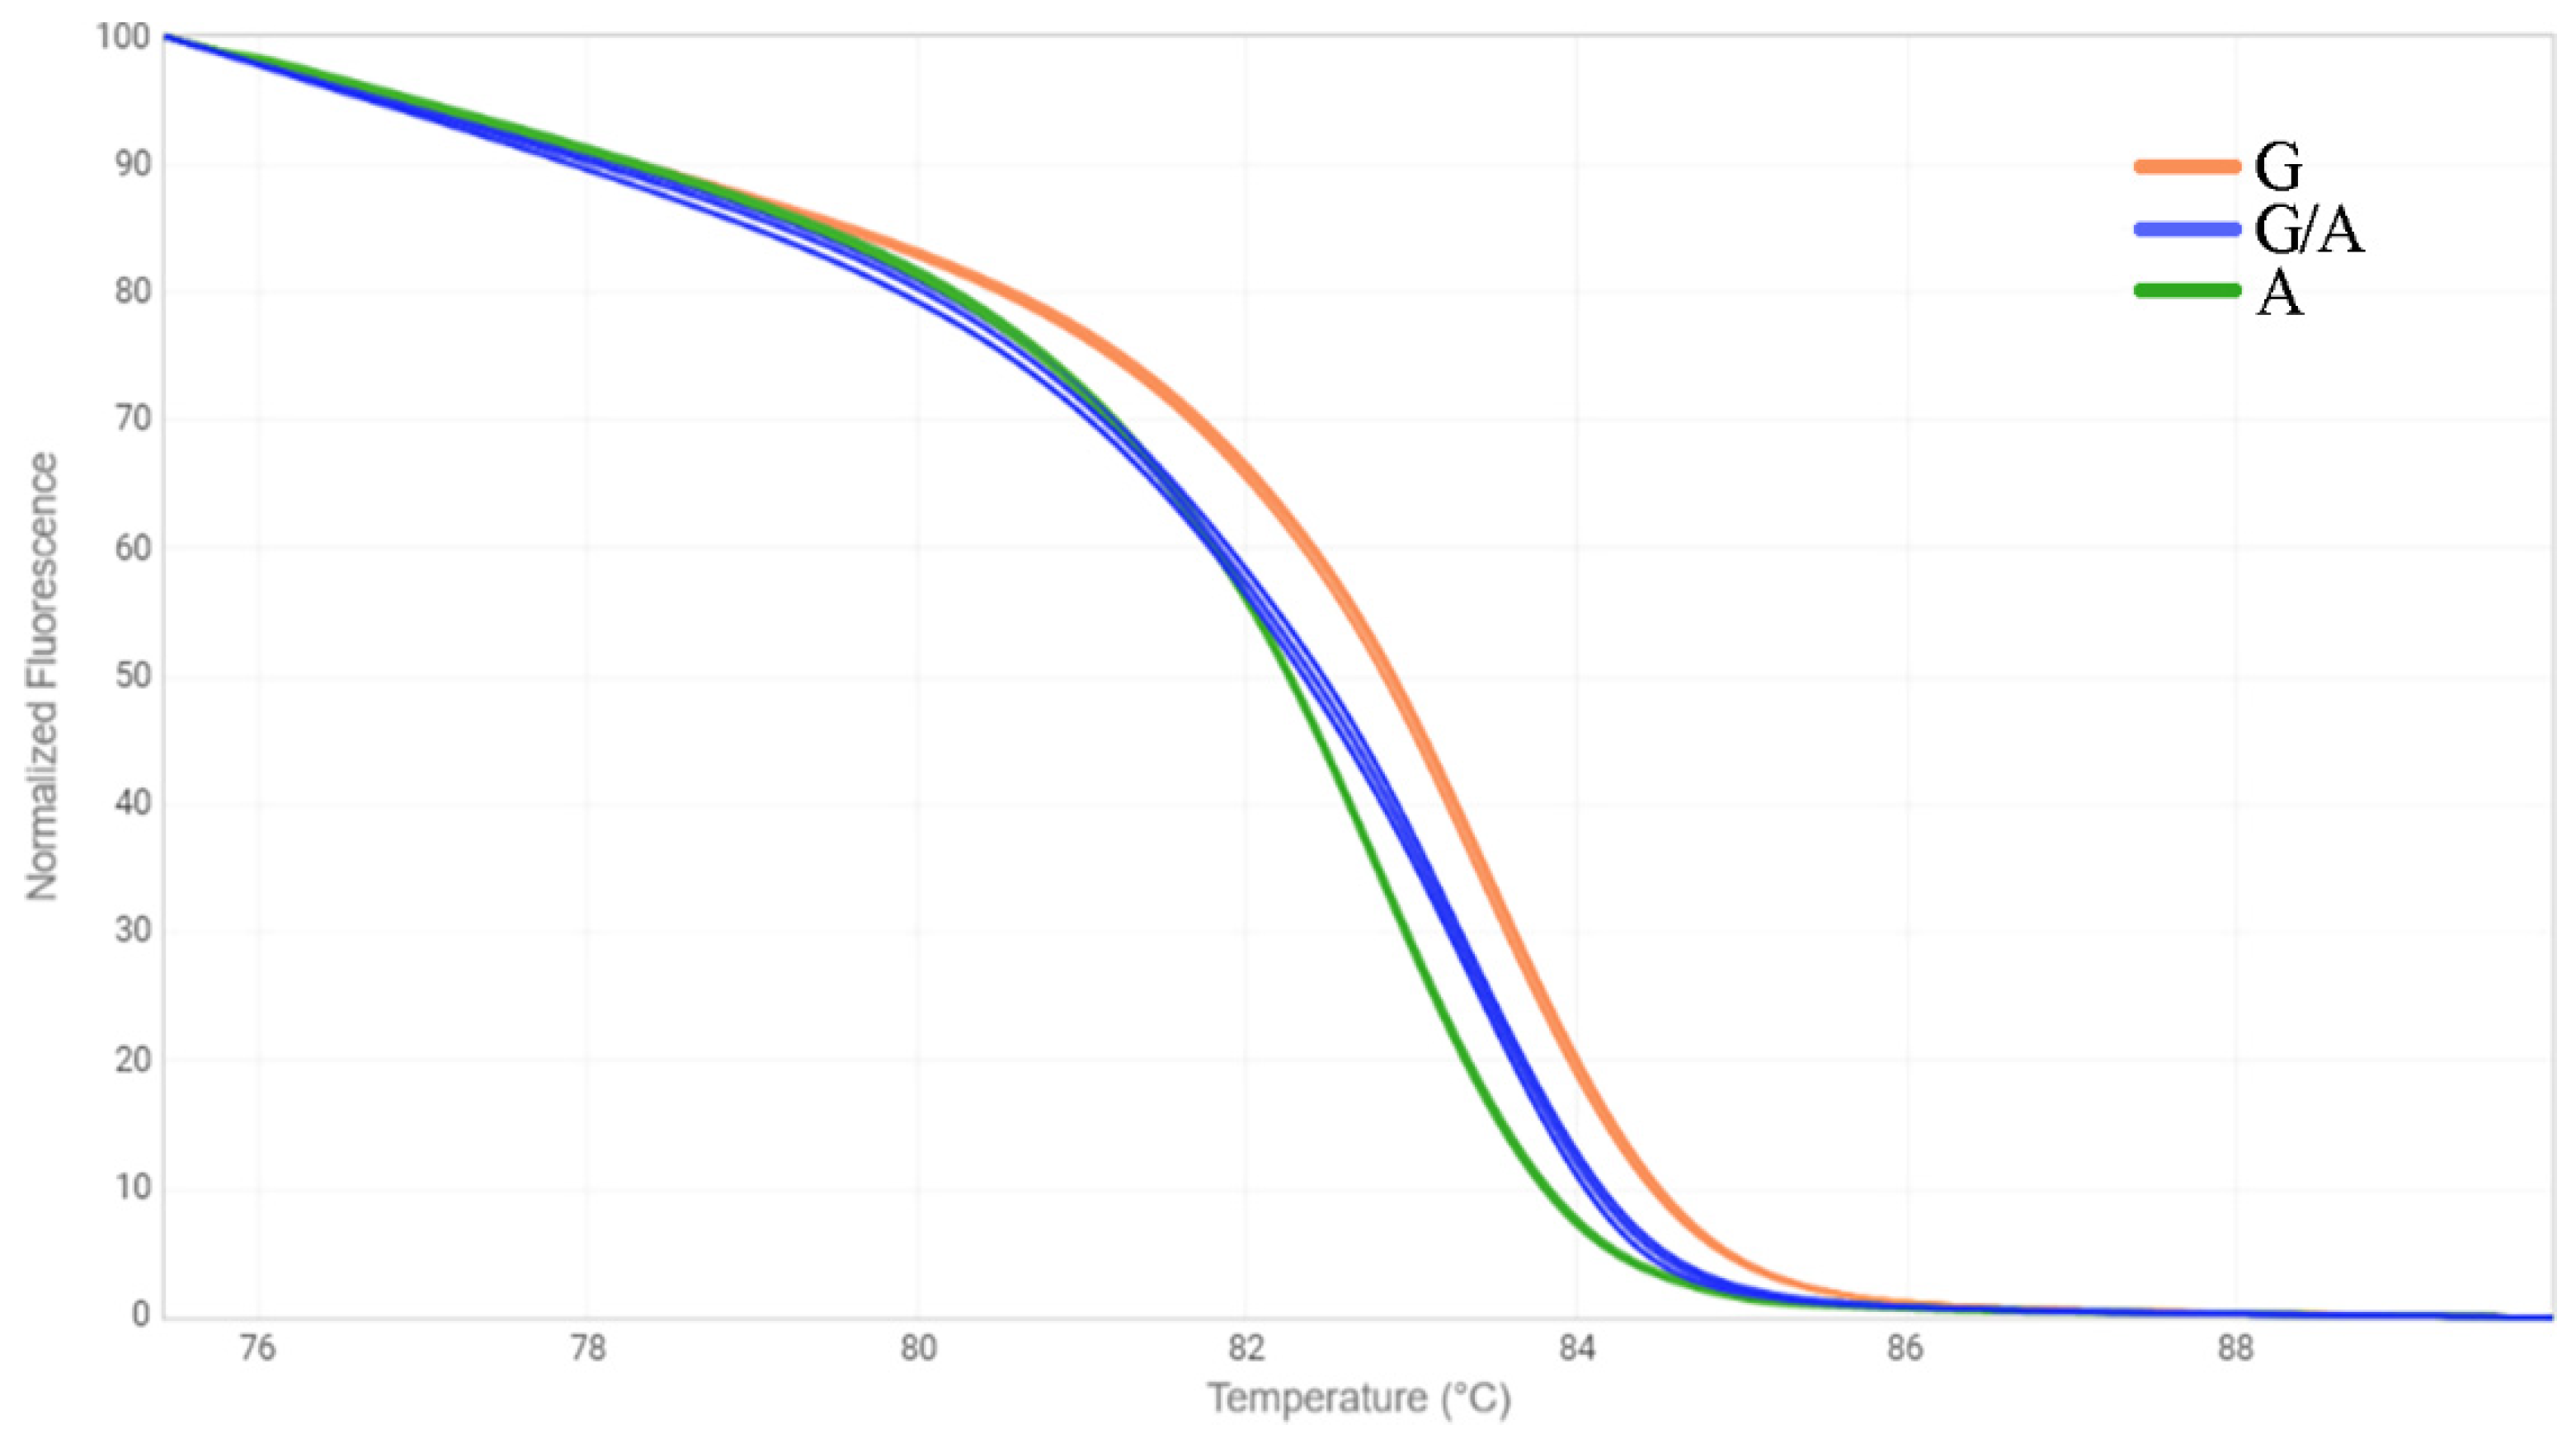
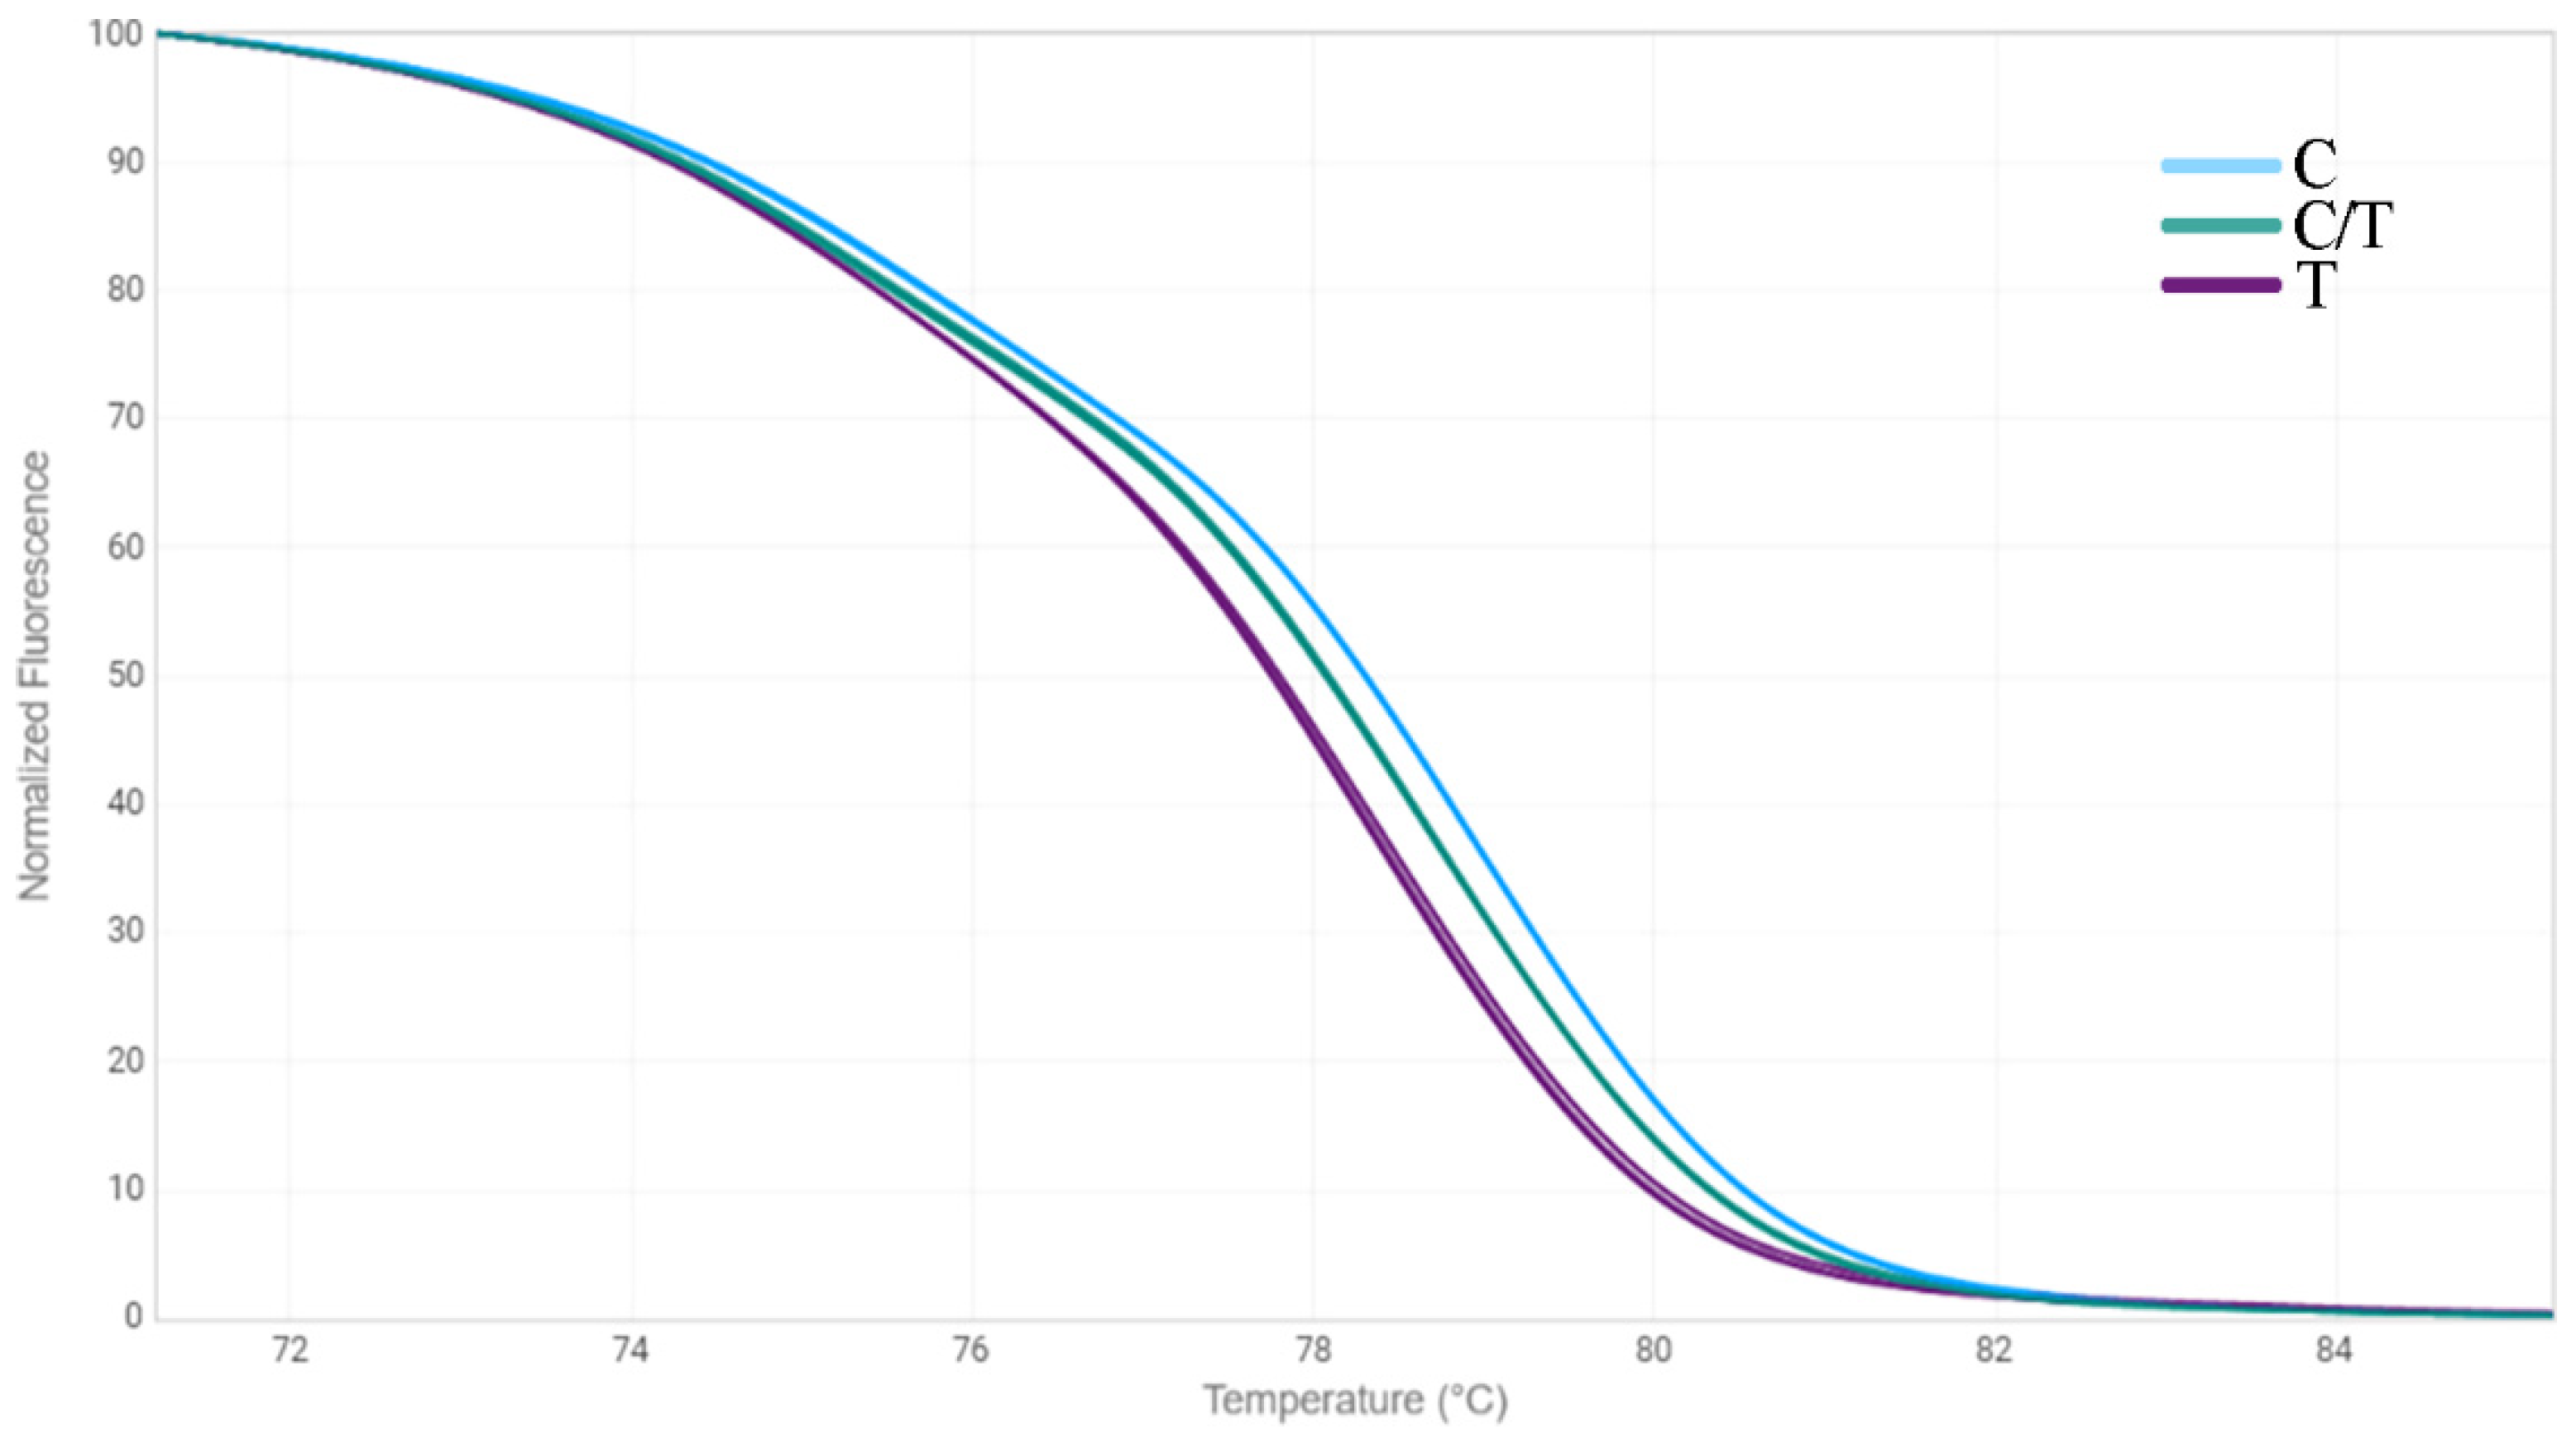
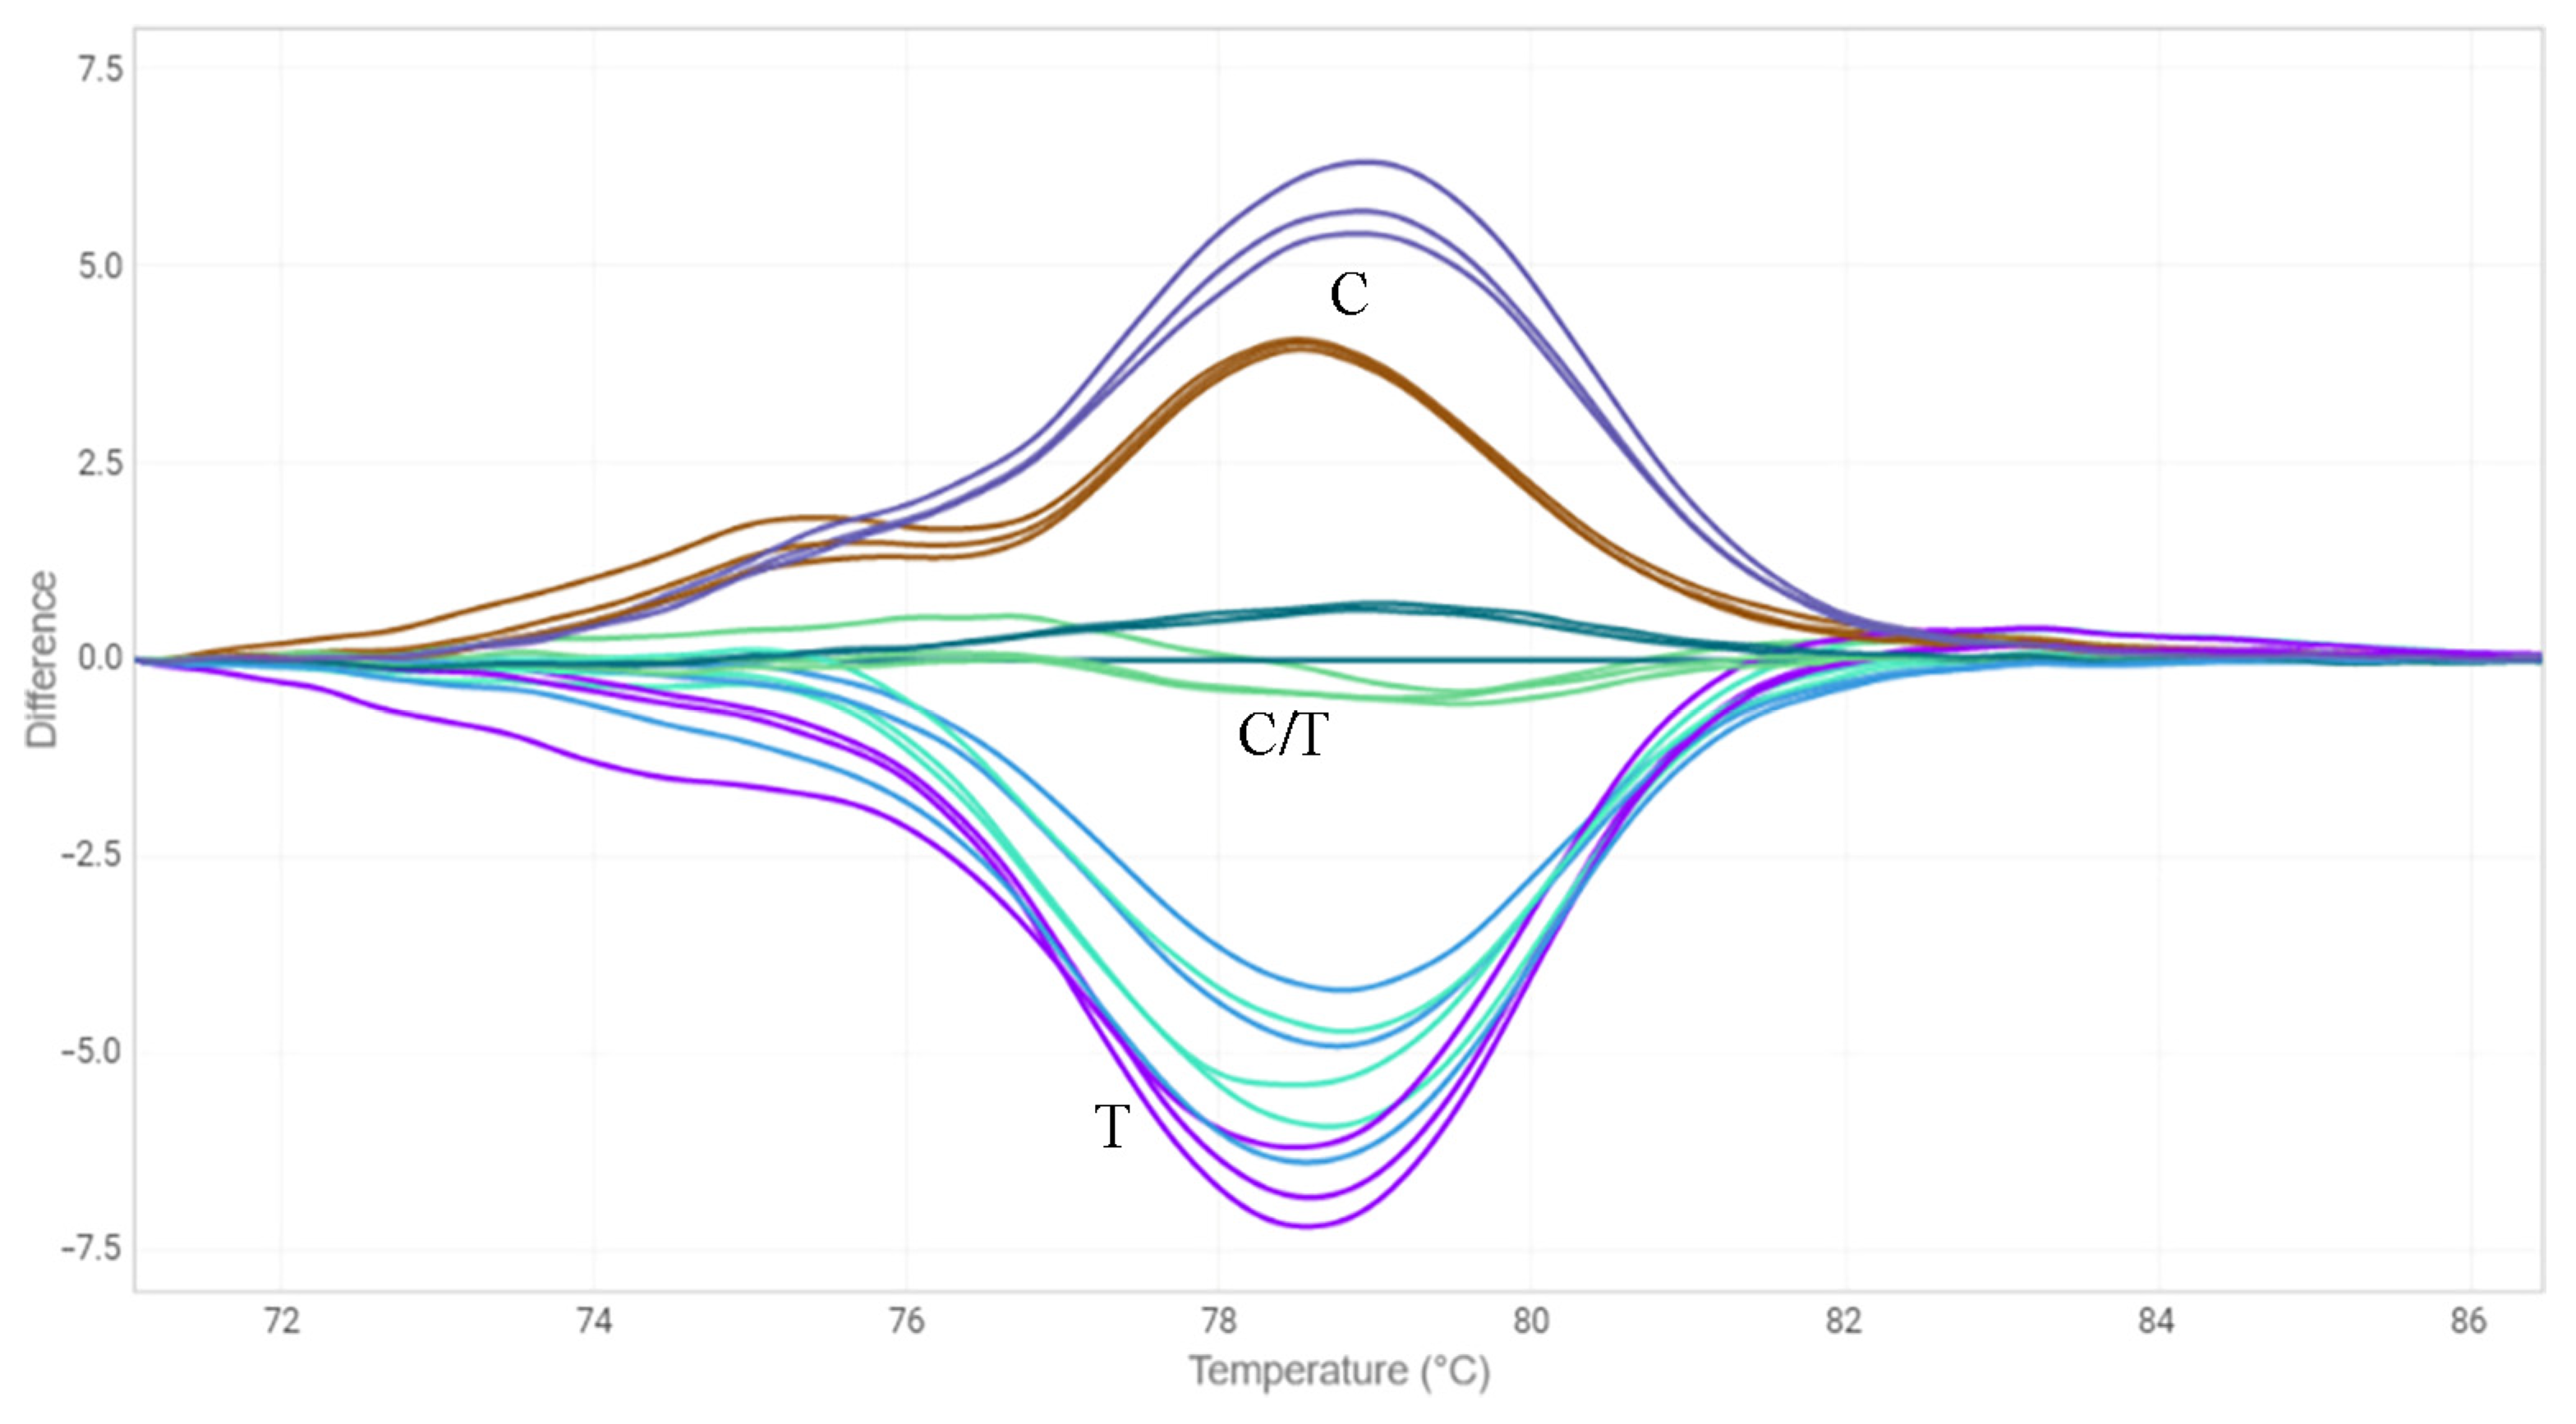
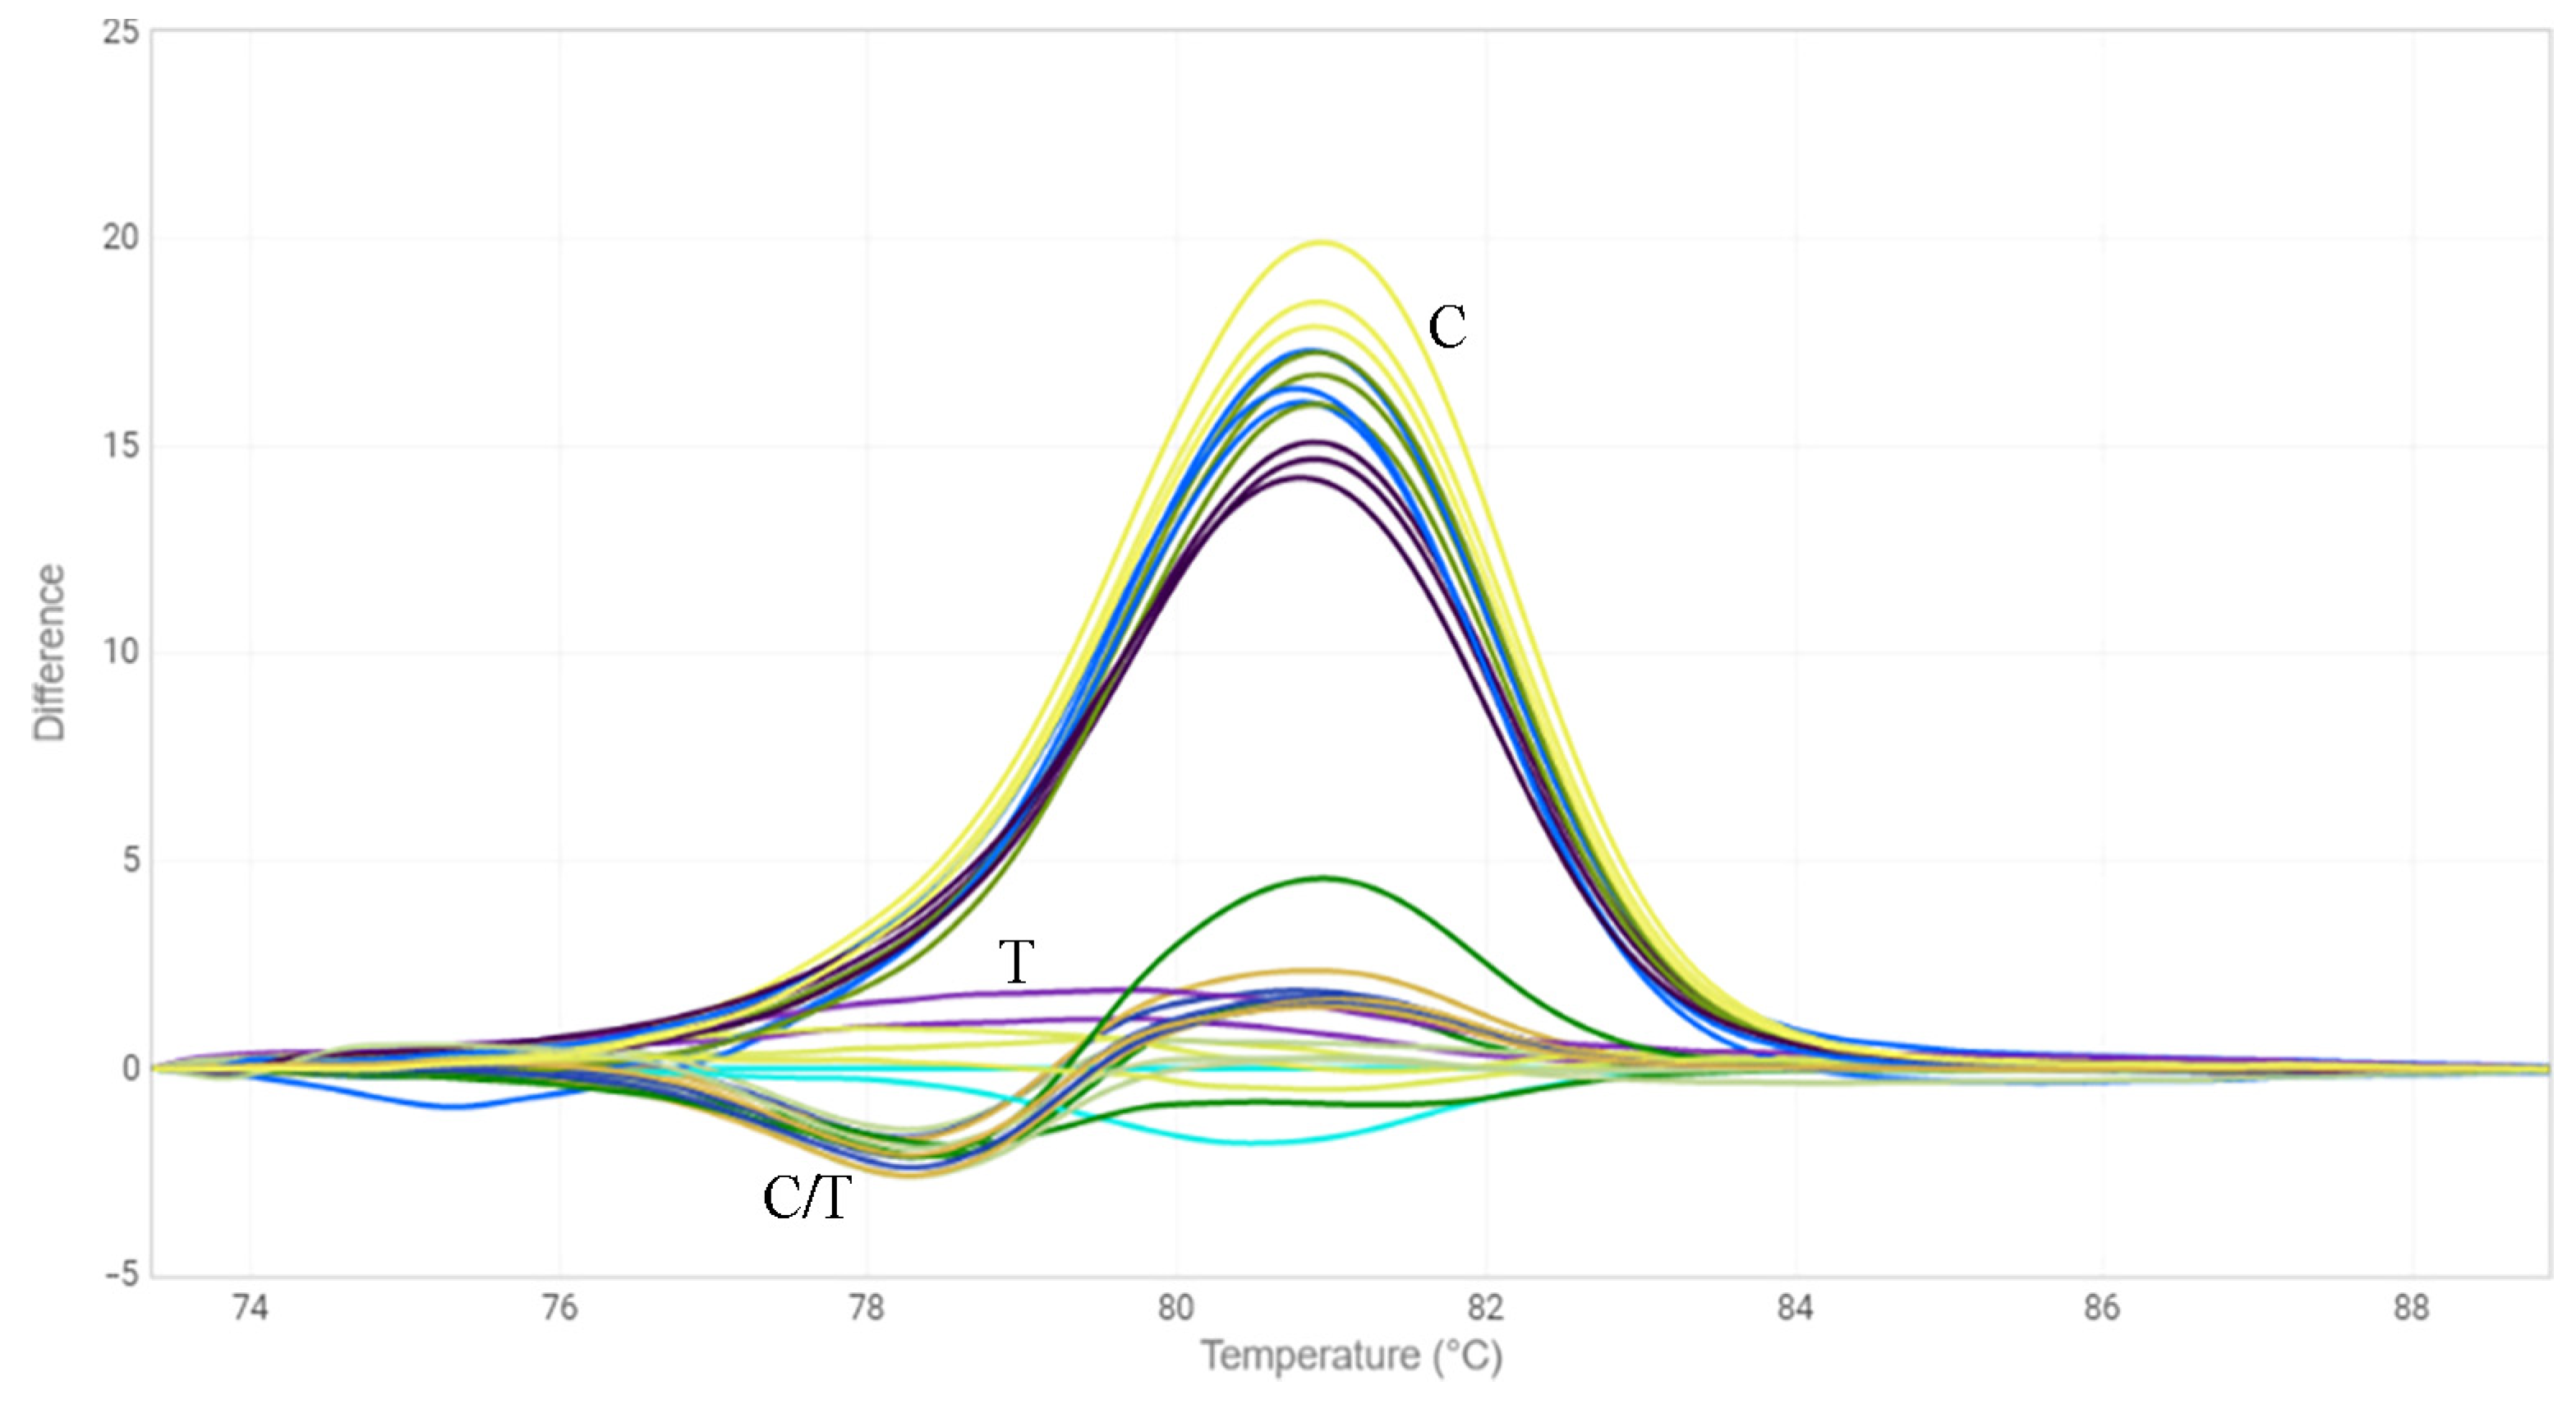
2.3. HRM Analysis
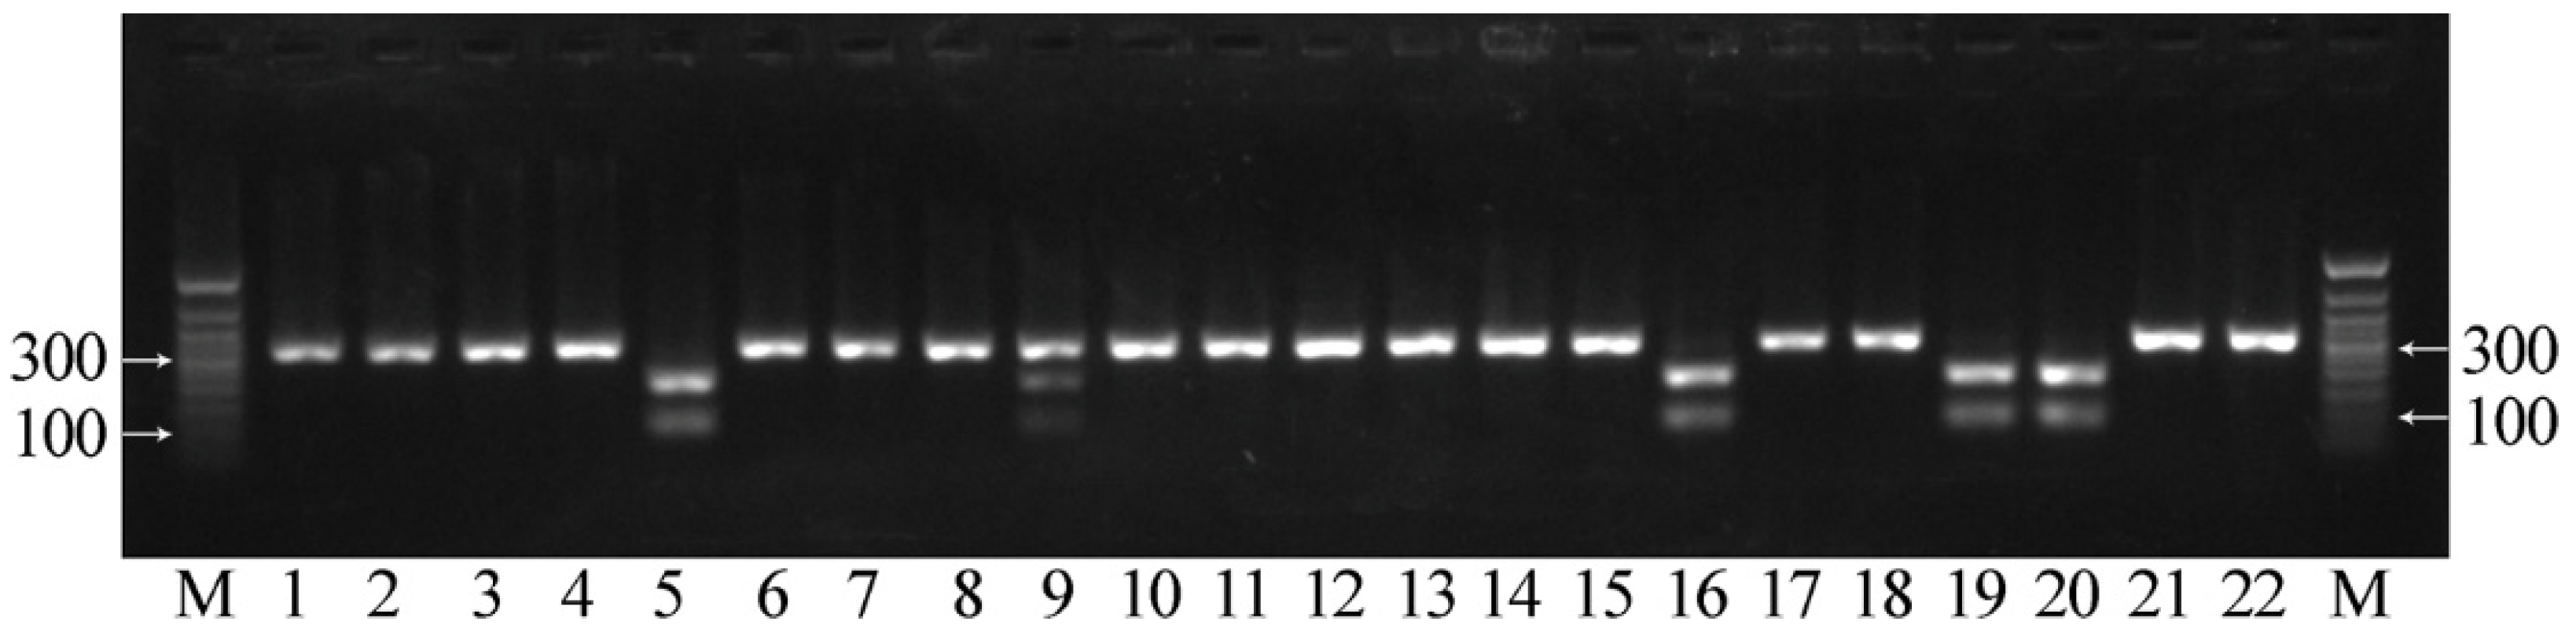
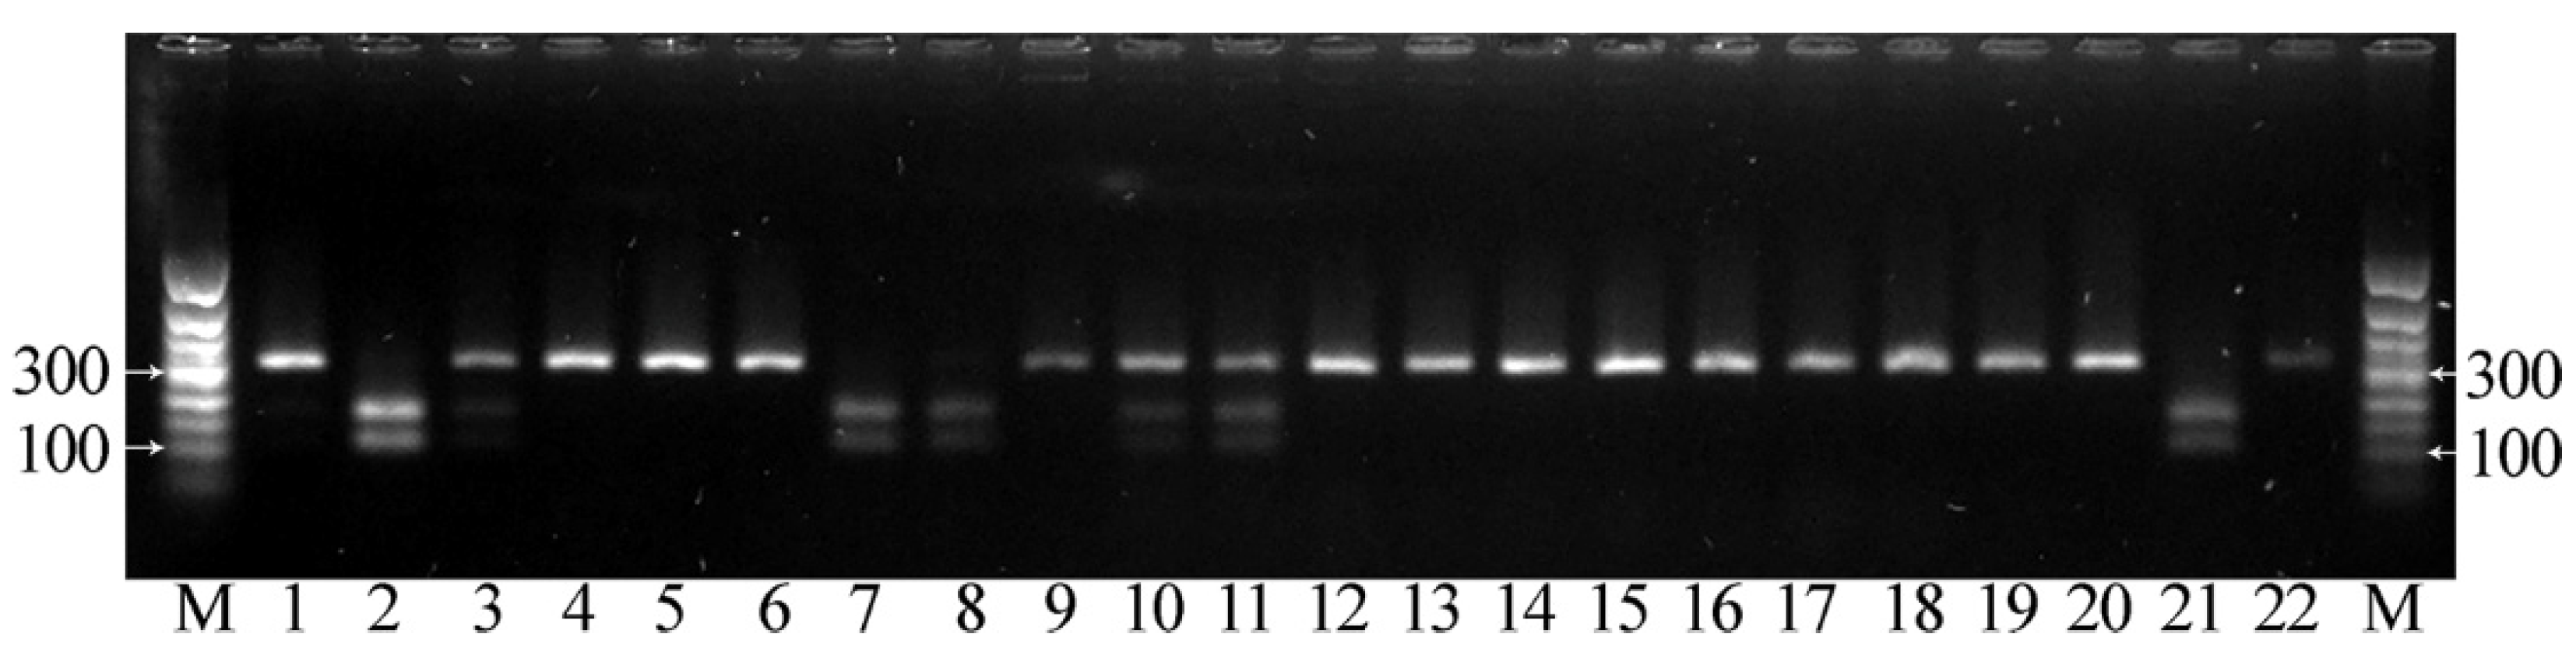
2.4. CAPS Markers
3. Discussion
4. Materials and Methods
4.1. Plant Material
- A total of 24 lines (g.579, g.580, g.582, g.586, g.587, g.588, g.591, g.592, g.594, g.595, g.597, g.598, g.602, g.603, g.604, g.605, g.610, g.614, g.615, g.616, g.618, g.619, g.620, g.621) obtained from crossing flax varieties differing in the fatty acid composition of the oil and 19 varieties promising for use in breeding, including those with a slightly reduced LIN content (45–55%): Hi de France, L.8709-5-10, N 3860, B-15, N 3895, K-74, Moolzyzan, Cki 10, NP RR, Soletsky kr, S Yanyshina A.A., T Yanyshina A.A., N 3810, N 3841, Stormont Motley, N 3809, Istok, Honkie 49, Focus. For each sample, material was obtained from pools of 50 or more plants;
- Families of F3 hybrids of flax obtained from crosses Raciol × AGT 427/10 (94 F3 families) and LM 98 × AGT 427/10 (87 F3 families) with a contrast ratio of LIN and LIO in linseed oil and different allelic variants of the FAD3A and FAD3B genes. For each F3 family, material was obtained from a pool of at least 20 plants;
- Varieties AGT 1535/07 (185 individual plants) and AGT 987/02 (162 individual plants) for which high heterogeneity was revealed for sites of low-LIN mutations [18]. Material was obtained from each individual plant;
- Varieties Lola, AGT 981/05, and AGT 1535/07 (200 samples for each variety), which we used for transcriptomic studies of the mechanisms of linseed oil synthesis and for which some heterogeneity was revealed for sites of the low-LIN mutations [18]. Material was obtained from each individual plant.
4.2. DNA Isolation
4.3. Targeted Deep Sequencing
4.4. HRM Analysis
4.5. CAPS Markers
Supplementary Materials
Author Contributions
Funding
Institutional Review Board Statement
Informed Consent Statement
Data Availability Statement
Acknowledgments
Conflicts of Interest
References
- Weiss, E.; Zohary, D.; Hopf, M. Domestication of Plants in the Old World—The Origin and Spread of Domesticated Plants in South-West Asia, Europe, and the Mediterranean Basin; Oxford University Press: Oxford, UK, 2012. [Google Scholar]
- Muir, A.D.; Westcott, N.D. Flax: The Genus Linum; CRC Press: Boca Raton, FL, USA, 2003. [Google Scholar]
- Goyal, A.; Sharma, V.; Upadhyay, N.; Gill, S.; Sihag, M. Flax and flaxseed oil: An ancient medicine & modern functional food. J. Food Sci. Technol. 2014, 51, 1633–1653. [Google Scholar] [CrossRef] [PubMed] [Green Version]
- Imran, M.; Ahmad, N.; Anjum, F.M.; Khan, M.K.; Mushtaq, Z.; Nadeem, M.; Hussain, S. Potential protective properties of flax lignan secoisolariciresinol diglucoside. Nutr. J. 2015, 14, 71. [Google Scholar] [CrossRef] [Green Version]
- Abdelhamid, A.S.; Martin, N.; Bridges, C.; Brainard, J.S.; Wang, X.; Brown, T.J.; Hanson, S.; Jimoh, O.F.; Ajabnoor, S.M.; Deane, K.H.; et al. Polyunsaturated fatty acids for the primary and secondary prevention of cardiovascular disease. Cochrane Database Syst. Rev. 2018, 7, CD012345. [Google Scholar] [CrossRef] [PubMed]
- Campos, J.R.; Severino, P.; Ferreira, C.S.; Zielinska, A.; Santini, A.; Souto, S.B.; Souto, E.B. Linseed Essential Oil-Source of Lipids as Active Ingredients for Pharmaceuticals and Nutraceuticals. Curr. Med. Chem. 2019, 26, 4537–4558. [Google Scholar] [CrossRef] [PubMed] [Green Version]
- Kezimana, P.; Dmitriev, A.A.; Kudryavtseva, A.V.; Romanova, E.V.; Melnikova, N.V. Secoisolariciresinol Diglucoside of Flaxseed and Its Metabolites: Biosynthesis and Potential for Nutraceuticals. Front. Genet. 2018, 9, 641. [Google Scholar] [CrossRef] [Green Version]
- Locke, A.; Schneiderhan, J.; Zick, S.M. Diets for Health: Goals and Guidelines. Am. Fam. Physician 2018, 97, 721–728. [Google Scholar]
- Parikh, M.; Netticadan, T.; Pierce, G.N. Flaxseed: Its bioactive components and their cardiovascular benefits. Am. J. Physiol. Heart Circ. Physiol. 2018, 314, H146–H159. [Google Scholar] [CrossRef]
- Cullis, C.A. Genetics and Genomics of Linum; Springer International Publishing: Berlin/Heidelberg, Germany, 2019. [Google Scholar]
- Mali, A.V.; Padhye, S.B.; Anant, S.; Hegde, M.V.; Kadam, S.S. Anticancer and antimetastatic potential of enterolactone: Clinical, preclinical and mechanistic perspectives. Eur. J. Pharmacol. 2019, 852, 107–124. [Google Scholar] [CrossRef]
- Kouba, M.; Mourot, J. A review of nutritional effects on fat composition of animal products with special emphasis on n-3 polyunsaturated fatty acids. Biochimie 2011, 93, 13–17. [Google Scholar] [CrossRef]
- Singh, K.K.; Mridula, D.; Rehal, J.; Barnwal, P. Flaxseed: A Potential Source of Food, Feed and Fiber. Crit. Rev. Food Sci. Nutr. 2011, 51, 210–222. [Google Scholar] [CrossRef]
- Corino, C.; Rossi, R.; Cannata, S.; Ratti, S. Effect of dietary linseed on the nutritional value and quality of pork and pork products: Systematic review and meta-analysis. Meat Sci. 2014, 98, 679–688. [Google Scholar] [CrossRef] [PubMed]
- Fombuena, V.; Petrucci, R.; Dominici, F.; Jorda-Vilaplana, A.; Montanes, N.; Torre, L. Maleinized Linseed Oil as Epoxy Resin Hardener for Composites with High Bio Content Obtained from Linen Byproducts. Polymers 2019, 11, 301. [Google Scholar] [CrossRef] [PubMed] [Green Version]
- Banik, M.; Duguid, S.; Cloutier, S. Transcript profiling and gene characterization of three fatty acid desaturase genes in high, moderate, and low linolenic acid genotypes of flax (Linum usitatissimum L.) and their role in linolenic acid accumulation. Genome 2011, 54, 471–483. [Google Scholar] [CrossRef] [PubMed]
- Cloutier, S.; Ragupathy, R.; Niu, Z.; Duguid, S. SSR-based linkage map of flax (Linum usitatissimum L.) and mapping of QTLs underlying fatty acid composition traits. Mol. Breed. 2011, 28, 437–451. [Google Scholar] [CrossRef]
- Dmitriev, A.A.; Kezimana, P.; Rozhmina, T.A.; Zhuchenko, A.A.; Povkhova, L.V.; Pushkova, E.N.; Novakovskiy, R.O.; Pavelek, M.; Vladimirov, G.N.; Nikolaev, E.N.; et al. Genetic diversity of SAD and FAD genes responsible for the fatty acid composition in flax cultivars and lines. BMC Plant Biol. 2020, 20, 301. [Google Scholar] [CrossRef] [PubMed]
- Chen, Y.; Zhou, X.-R.; Zhang, Z.-J.; Dribnenki, P.; Singh, S.; Green, A. Development of high oleic oil crop platform in flax through RNAi-mediated multiple FAD2 gene silencing. Plant Cell Rep. 2015, 34, 643–653. [Google Scholar] [CrossRef]
- Brutch, N.; Porokhoviniva, E.; Shelenga, T. Perspectives of the creation of oil flax varieties for the specialized purpose. Agrar. Report. South-East 2016, 1–2, 50–52. [Google Scholar]
- Green, A.G.; Marshall, D.R. Isolation of induced mutants in linseed (Linum usitatissimum) having reduced linolenic acid content. Euphytica 1984, 33, 321–328. [Google Scholar] [CrossRef]
- Rowland, G. An EMS-induced low-linolenic-acid mutant in McGregor flax (Linum usitatissimum L.). Can. J. Plant Sci. 1991, 71, 393–396. [Google Scholar] [CrossRef] [Green Version]
- Green, A.G. Genetic control of polyunsaturated fatty acid biosynthesis in flax (Linum usitatissimum) seed oil. Theor. Appl. Genet. 1986, 72, 654–661. [Google Scholar] [CrossRef]
- Shanklin, J.; Cahoon, E.B. Desaturation and Related Modifications of Fatty Acids1. Annu. Rev. Plant Physiol. Plant Mol. Biol. 1998, 49, 611–641. [Google Scholar] [CrossRef] [PubMed] [Green Version]
- Fulco, A.J. Metabolic alterations of fatty acids. Annu. Rev. Biochem. 1974, 43, 215–241. [Google Scholar] [CrossRef] [PubMed]
- Vrinten, P.; Hu, Z.; Munchinsky, M.A.; Rowland, G.; Qiu, X. Two FAD3 desaturase genes control the level of linolenic acid in flax seed. Plant Physiol. 2005, 139, 79–87. [Google Scholar] [CrossRef] [PubMed] [Green Version]
- Rajwade, A.V.; Joshi, R.S.; Kadoo, N.Y.; Gupta, V.S. Sequence characterization and in silico structure prediction of fatty acid desaturases in linseed varieties with differential fatty acid composition. J. Sci. Food Agric. 2016, 96, 4896–4906. [Google Scholar] [CrossRef]
- Thambugala, D.; Duguid, S.; Loewen, E.; Rowland, G.; Booker, H.; You, F.M.; Cloutier, S. Genetic variation of six desaturase genes in flax and their impact on fatty acid composition. Theor. Appl. Genet. 2013, 126, 2627–2641. [Google Scholar] [CrossRef] [Green Version]
- Porokhovinova, E.A.; Shelenga, T.V.; Matveeva, T.V.; Pavlov, A.V.; Grigorieva, E.A.; Brutch, N.B. Polymorphism of genes controlling low level of linolenic acid in lines from VIR flax genetic collection. Ecol. Genet. 2019, 17, 5–19. [Google Scholar] [CrossRef] [Green Version]
- Kezimana, P.; Rozhmina, T.A.; Krasnov, G.S.; Povkhova, L.V.; Novakovskiy, R.O.; Pushkova, E.N.; Zhuchenko, A.A.; Bjelkova, M.; Pavelek, M.; Dmitriev, A.A.; et al. Evaluation of polymorphism of SAD and FAD genes in flax (Linum usitatissimum L.) cultivars and lines using deep sequencing. In Theory and Practice of Adaptive Plant Breeding, Proceedings of the International Scientific and Practical Conference, Krasnodar, Russia, 25 September 2020; Kuban State Agrarian University: Krasnodar, Russia, 2020; pp. 49–52. [Google Scholar]
- Sonkar, P.; Sharma, V.; Kumar, H.; Kumar, M.; Negi, H.; Kiran, U.; Abdin, M.; Choubey, A. Marker-Assisted Selection for Value Addition in Crop Plants. In Technologies in Plant Biotechnology and Breeding of Field Crops; Springer: Berlin/Heidelberg, Germany, 2022; pp. 23–39. [Google Scholar]
- Hasan, N.; Choudhary, S.; Naaz, N.; Sharma, N.; Laskar, R.A. Recent advancements in molecular marker-assisted selection and applications in plant breeding programmes. J. Genet. Eng. Biotechnol. 2021, 19, 128. [Google Scholar] [CrossRef]
- Reed, G.H.; Kent, J.O.; Wittwer, C.T. High-resolution DNA melting analysis for simple and efficient molecular diagnostics. Pharmacogenomics 2007, 8, 597–608. [Google Scholar] [CrossRef] [Green Version]
- Konieczny, A.; Ausubel, F.M. A procedure for mapping Arabidopsis mutations using co-dominant ecotype-specific PCR-based markers. Plant J. Cell Mol. Biol. 1993, 4, 403–410. [Google Scholar] [CrossRef]
- Bjelkova, M.; Nozkova, J.; Fatrcova-Sramkova, K.; Tejklova, E. Comparison of linseed (Linum usitatissimum L.) genotypes with respect to the content of polyunsaturated fatty acids. Chem. Pap. 2012, 66, 972–976. [Google Scholar] [CrossRef]
- Matuszczak, M.; Spasibionek, S.; Gacek, K.; Bartkowiak-Broda, I. Cleaved amplified polymorphic sequences (CAPS) marker for identification of two mutant alleles of the rapeseed BnaA. FAD2 gene. Mol. Biol. Rep. 2020, 47, 7607–7621. [Google Scholar] [CrossRef] [PubMed]
- Shavrukov, Y. CAPS markers in plant biology. Russ. J. Genet. Appl. Res. 2016, 6, 279–287. [Google Scholar] [CrossRef]
- Shavrukov, Y. Cleaved Amplified Polymorphic Sequences (CAPS) Markers in Plant Biology; Nova Science Publishers, Inc.: Hauppauge, NY, USA, 2014. [Google Scholar]
- Walkowiak, M.; Matuszczak, M.; Spasibionek, S.; Liersch, A.; Mikołajczyk, K. Cleaved Amplified Polymorphic Sequences (CAPS) Markers for Characterization of the LuFAD3A Gene from Various Flax (Linum usitatissimum L.) Cultivars. Agronomy 2022, 12, 1432. [Google Scholar] [CrossRef]
- Simko, I. High-Resolution DNA Melting Analysis in Plant Research. Trends Plant Sci. 2016, 21, 528–537. [Google Scholar] [CrossRef]
- Tamburro, M.; Ripabelli, G. High Resolution Melting as a rapid, reliable, accurate and cost-effective emerging tool for genotyping pathogenic bacteria and enhancing molecular epidemiological surveillance: A comprehensive review of the literature. Ann. Ig. Med. Prev. Comunita 2017, 29, 293–316. [Google Scholar] [CrossRef]
- Druml, B.; Cichna-Markl, M. High resolution melting (HRM) analysis of DNA--its role and potential in food analysis. Food Chem. 2014, 158, 245–254. [Google Scholar] [CrossRef]
- Montgomery, J.L.; Sanford, L.N.; Wittwer, C.T. High-resolution DNA melting analysis in clinical research and diagnostics. Expert Rev. Mol. Diagn. 2010, 10, 219–240. [Google Scholar] [CrossRef]
- Broccanello, C.; Chiodi, C.; Funk, A.; McGrath, J.M.; Panella, L.; Stevanato, P. Comparison of three PCR-based assays for SNP genotyping in plants. Plant Methods 2018, 14, 28. [Google Scholar] [CrossRef] [Green Version]
- Ayalew, H.; Tsang, P.W.; Chu, C.; Wang, J.; Liu, S.; Chen, C.; Ma, X.F. Comparison of TaqMan, KASP and rhAmp SNP genotyping platforms in hexaploid wheat. PLoS ONE 2019, 14, e0217222. [Google Scholar] [CrossRef] [Green Version]
- Semagn, K.; Babu, R.; Hearne, S.; Olsen, M. Single nucleotide polymorphism genotyping using Kompetitive Allele Specific PCR (KASP): Overview of the technology and its application in crop improvement. Mol. Breed. 2014, 33, 1–14. [Google Scholar] [CrossRef]
- Shavrukov, Y. Comparison of SNP and CAPS markers application in genetic research in wheat and barley. BMC Plant Biol. 2016, 16 (Suppl. S1), 11. [Google Scholar] [CrossRef] [PubMed] [Green Version]
- Ali, A.; Altaf, M.T.; Nadeem, M.A.; Karakoy, T.; Shah, A.N.; Azeem, H.; Baloch, F.S.; Baran, N.; Hussain, T.; Duangpan, S.; et al. Recent advancement in OMICS approaches to enhance abiotic stress tolerance in legumes. Front. Plant Sci. 2022, 13, 952759. [Google Scholar] [CrossRef]
- Sahin, Z.N.; Sahin, E.C.; Aydin, Y.; Uncuoglu, A.A. Molecular sexual determinants in Pistacia genus by KASP assay. Mol. Biol. Rep. 2022, 49, 5473–5482. [Google Scholar] [CrossRef]
- Makhoul, M.; Obermeier, C. Development of Breeder-Friendly KASP Markers from Genome-Wide Association Studies Results. Methods Mol. Biol. 2022, 2481, 287–310. [Google Scholar] [CrossRef] [PubMed]
- Chou, L.; Huang, S.J.; Hsieh, C.; Lu, M.T.; Song, C.W.; Hsu, F.C. A High Resolution Melting Analysis-Based Genotyping Toolkit for the Peach (Prunus persica) Chilling Requirement. Int. J. Mol. Sci. 2020, 21, 1543. [Google Scholar] [CrossRef] [PubMed] [Green Version]
- McCormack, J.E.; Faircloth, B.C. Next-generation phylogenetics takes root. Mol. Ecol. 2013, 22, 19–20. [Google Scholar] [CrossRef] [Green Version]
- Unamba, C.I.; Nag, A.; Sharma, R.K. Next Generation Sequencing Technologies: The Doorway to the Unexplored Genomics of Non-Model Plants. Front. Plant Sci. 2015, 6, 1074. [Google Scholar] [CrossRef] [Green Version]
- He, J.; Zhao, X.; Laroche, A.; Lu, Z.X.; Liu, H.; Li, Z. Genotyping-by-sequencing (GBS), an ultimate marker-assisted selection (MAS) tool to accelerate plant breeding. Front. Plant Sci. 2014, 5, 484. [Google Scholar] [CrossRef] [Green Version]
- Sarwat, M.; Yamdagni, M.M. DNA barcoding, microarrays and next generation sequencing: Recent tools for genetic diversity estimation and authentication of medicinal plants. Crit. Rev. Biotechnol. 2016, 36, 191–203. [Google Scholar] [CrossRef]
- Bohra, A.; Jha, U.C.; Kishor, P.B.; Pandey, S.; Singh, N.P. Genomics and molecular breeding in lesser explored pulse crops: Current trends and future opportunities. Biotechnol. Adv. 2014, 32, 1410–1428. [Google Scholar] [CrossRef]
- Kilian, B.; Graner, A. NGS technologies for analyzing germplasm diversity in genebanks. Brief. Funct. Genom. 2012, 11, 38–50. [Google Scholar] [CrossRef] [PubMed] [Green Version]
- Fu, Y.B.; Peterson, G.W. Developing genomic resources in two Linum species via 454 pyrosequencing and genomic reduction. Mol. Ecol. Resour. 2012, 12, 492–500. [Google Scholar] [CrossRef] [PubMed]
- Kumar, S.; You, F.M.; Cloutier, S. Genome wide SNP discovery in flax through next generation sequencing of reduced representation libraries. BMC Genom. 2012, 13, 684. [Google Scholar] [CrossRef] [PubMed] [Green Version]
- Wang, Z.; Hobson, N.; Galindo, L.; Zhu, S.; Shi, D.; McDill, J.; Yang, L.; Hawkins, S.; Neutelings, G.; Datla, R.; et al. The genome of flax (Linum usitatissimum) assembled de novo from short shotgun sequence reads. Plant J. Cell Mol. Biol. 2012, 72, 461–473. [Google Scholar] [CrossRef] [Green Version]
- Yu, Y.; Huang, W.; Chen, H.; Wu, G.; Yuan, H.; Song, X.; Kang, Q.; Zhao, D.; Jiang, W.; Liu, Y.; et al. Identification of differentially expressed genes in flax (Linum usitatissimum L.) under saline-alkaline stress by digital gene expression. Gene 2014, 549, 113–122. [Google Scholar] [CrossRef]
- Galindo-Gonzalez, L.; Pinzon-Latorre, D.; Bergen, E.A.; Jensen, D.C.; Deyholos, M.K. Ion Torrent sequencing as a tool for mutation discovery in the flax (Linum usitatissimum L.) genome. Plant Methods 2015, 11, 19. [Google Scholar] [CrossRef] [Green Version]
- Melnikova, N.V.; Dmitriev, A.A.; Belenikin, M.S.; Speranskaya, A.S.; Krinitsina, A.A.; Rachinskaia, O.A.; Lakunina, V.A.; Krasnov, G.S.; Snezhkina, A.V.; Sadritdinova, A.F.; et al. Excess fertilizer responsive miRNAs revealed in Linum usitatissimum L. Biochimie 2015, 109, 36–41. [Google Scholar] [CrossRef]
- Dmitriev, A.A.; Krasnov, G.S.; Rozhmina, T.A.; Kishlyan, N.V.; Zyablitsin, A.V.; Sadritdinova, A.F.; Snezhkina, A.V.; Fedorova, M.S.; Yurkevich, O.Y.; Muravenko, O.V.; et al. Glutathione S-transferases and UDP-glycosyltransferases Are Involved in Response to Aluminum Stress in Flax. Front. Plant Sci. 2016, 7, 1920. [Google Scholar] [CrossRef] [Green Version]
- Dmitriev, A.A.; Kudryavtseva, A.V.; Krasnov, G.S.; Koroban, N.V.; Speranskaya, A.S.; Krinitsina, A.A.; Belenikin, M.S.; Snezhkina, A.V.; Sadritdinova, A.F.; Kishlyan, N.V.; et al. Gene expression profiling of flax (Linum usitatissimum L.) under edaphic stress. BMC Plant Biol. 2016, 16, 237. [Google Scholar] [CrossRef] [Green Version]
- Fu, Y.B.; Dong, Y.; Yang, M.H. Multiplexed shotgun sequencing reveals congruent three-genome phylogenetic signals for four botanical sections of the flax genus Linum. Mol. Phylogenetics Evol. 2016, 101, 122–132. [Google Scholar] [CrossRef]
- Galindo-Gonzalez, L.; Deyholos, M.K. RNA-seq Transcriptome Response of Flax (Linum usitatissimum L.) to the Pathogenic Fungus Fusarium oxysporum f. sp. lini. Front. Plant Sci. 2016, 7, 1766. [Google Scholar] [CrossRef] [PubMed] [Green Version]
- Melnikova, N.V.; Dmitriev, A.A.; Belenikin, M.S.; Koroban, N.V.; Speranskaya, A.S.; Krinitsina, A.A.; Krasnov, G.S.; Lakunina, V.A.; Snezhkina, A.V.; Sadritdinova, A.F.; et al. Identification, Expression Analysis, and Target Prediction of Flax Genotroph MicroRNAs Under Normal and Nutrient Stress Conditions. Front. Plant Sci. 2016, 7, 399. [Google Scholar] [CrossRef]
- Bolsheva, N.L.; Melnikova, N.V.; Kirov, I.V.; Speranskaya, A.S.; Krinitsina, A.A.; Dmitriev, A.A.; Belenikin, M.S.; Krasnov, G.S.; Lakunina, V.A.; Snezhkina, A.V.; et al. Evolution of blue-flowered species of genus Linum based on high-throughput sequencing of ribosomal RNA genes. BMC Evol. Biol. 2017, 17, 253. [Google Scholar] [CrossRef] [PubMed] [Green Version]
- Dash, P.K.; Rai, R.; Mahato, A.K.; Gaikwad, K.; Singh, N.K. Transcriptome Landscape at Different Developmental Stages of a Drought Tolerant Cultivar of Flax (Linum usitatissimum). Front. Chem. 2017, 5, 82. [Google Scholar] [CrossRef] [PubMed] [Green Version]
- Dmitriev, A.A.; Krasnov, G.S.; Rozhmina, T.A.; Novakovskiy, R.O.; Snezhkina, A.V.; Fedorova, M.S.; Yurkevich, O.Y.; Muravenko, O.V.; Bolsheva, N.L.; Kudryavtseva, A.V.; et al. Differential gene expression in response to Fusarium oxysporum infection in resistant and susceptible genotypes of flax (Linum usitatissimum L.). BMC Plant Biol. 2017, 17, 253. [Google Scholar] [CrossRef]
- Dmitriev, A.A.; Kudryavtseva, A.V.; Bolsheva, N.L.; Zyablitsin, A.V.; Rozhmina, T.A.; Kishlyan, N.V.; Krasnov, G.S.; Speranskaya, A.S.; Krinitsina, A.A.; Sadritdinova, A.F.; et al. miR319, miR390, and miR393 Are Involved in Aluminum Response in Flax (Linum usitatissimum L.). BioMed Res. Int. 2017, 2017, 4975146. [Google Scholar] [CrossRef] [PubMed] [Green Version]
- Yi, L.; Gao, F.; Siqin, B.; Zhou, Y.; Li, Q.; Zhao, X.; Jia, X.; Zhang, H. Construction of an SNP-based high-density linkage map for flax (Linum usitatissimum L.) using specific length amplified fragment sequencing (SLAF-seq) technology. PLoS ONE 2017, 12, e0189785. [Google Scholar] [CrossRef] [Green Version]
- Wu, J.; Zhao, Q.; Zhang, L.; Li, S.; Ma, Y.; Pan, L.; Lin, H.; Wu, G.; Yuan, H.; Yu, Y.; et al. QTL Mapping of Fiber-Related Traits Based on a High-Density Genetic Map in Flax (Linum usitatissimum L.). Front. Plant Sci. 2018, 9, 885. [Google Scholar] [CrossRef] [Green Version]
- You, F.M.; Xiao, J.; Li, P.; Yao, Z.; Jia, G.; He, L.; Zhu, T.; Luo, M.C.; Wang, X.; Deyholos, M.K.; et al. Chromosome-scale pseudomolecules refined by optical, physical and genetic maps in flax. Plant J. Cell Mol. Biol. 2018, 95, 371–384. [Google Scholar] [CrossRef]
- Zyablitsin, A.V.; Dmitriev, A.A.; Krasnov, G.S.; Bolsheva, N.L.; Rozhmina, T.A.; Muravenko, O.V.; Fedorova, M.S.; Snezhkina, A.V.; Kudryavtseva, A.V.; Melnikova, N.V. CAX3 Gene is Involved in Flax Response to High Soil Acidity and Aluminum Exposure. Mol. Biol. 2018, 52, 514–519. [Google Scholar] [CrossRef]
- Bolsheva, N.L.; Melnikova, N.V.; Kirov, I.V.; Dmitriev, A.A.; Krasnov, G.S.; Amosova, A.C.; Samatadze, T.E.; Yurkevich, O.Y.; Zoshchuk, S.A.; Kudryavtseva, A.V.; et al. Characterization of repeated DNA sequences in genomes of blue-flowered flax. BMC Evol. Biol. 2019, 19, 49. [Google Scholar] [CrossRef] [PubMed] [Green Version]
- Dmitriev, A.A.; Krasnov, G.S.; Rozhmina, T.A.; Zyablitsin, A.V.; Snezhkina, A.V.; Fedorova, M.S.; Pushkova, E.N.; Kezimana, P.; Novakovskiy, R.O.; Povkhova, L.V.; et al. Flax (Linum usitatissimum L.) response to non-optimal soil acidity and zinc deficiency. BMC Plant Biol. 2019, 19, 54. [Google Scholar] [CrossRef] [PubMed]
- Guo, D.; Jiang, H.; Yan, W.; Yang, L.; Ye, J.; Wang, Y.; Yan, Q.; Chen, J.; Gao, Y.; Duan, L.; et al. Resequencing 200 Flax Cultivated Accessions Identifies Candidate Genes Related to Seed Size and Weight and Reveals Signatures of Artificial Selection. Front. Plant Sci. 2019, 10, 1682. [Google Scholar] [CrossRef] [PubMed] [Green Version]
- Xie, D.; Dai, Z.; Yang, Z.; Tang, Q.; Deng, C.; Xu, Y.; Wang, J.; Chen, J.; Zhao, D.; Zhang, S.; et al. Combined genome-wide association analysis and transcriptome sequencing to identify candidate genes for flax seed fatty acid metabolism. Plant Sci. Int. J. Exp. Plant Biol. 2019, 286, 98–107. [Google Scholar] [CrossRef] [PubMed]
- Dmitriev, A.A.; Novakovskiy, R.O.; Pushkova, E.N.; Rozhmina, T.A.; Zhuchenko, A.A.; Bolsheva, N.L.; Beniaminov, A.D.; Mitkevich, V.A.; Povkhova, L.V.; Dvorianinova, E.M.; et al. Transcriptomes of Different Tissues of Flax (Linum usitatissimum L.) Cultivars With Diverse Characteristics. Front. Genet. 2020, 11, 565146. [Google Scholar] [CrossRef]
- Dmitriev, A.A.; Pushkova, E.N.; Novakovskiy, R.O.; Beniaminov, A.D.; Rozhmina, T.A.; Zhuchenko, A.A.; Bolsheva, N.L.; Muravenko, O.V.; Povkhova, L.V.; Dvorianinova, E.M.; et al. Genome Sequencing of Fiber Flax Cultivar Atlant Using Oxford Nanopore and Illumina Platforms. Front. Genet. 2020, 11, 590282. [Google Scholar] [CrossRef]
- Lan, S.; Zheng, C.; Hauck, K.; McCausland, M.; Duguid, S.D.; Booker, H.M.; Cloutier, S.; You, F.M. Genomic Prediction Accuracy of Seven Breeding Selection Traits Improved by QTL Identification in Flax. Int. J. Mol. Sci. 2020, 21, 1577. [Google Scholar] [CrossRef] [Green Version]
- Dvorianinova, E.M.; Pushkova, E.N.; Novakovskiy, R.O.; Povkhova, L.V.; Bolsheva, N.L.; Kudryavtseva, L.P.; Rozhmina, T.A.; Melnikova, N.V.; Dmitriev, A.A. Nanopore and Illumina Genome Sequencing of Fusarium oxysporum f. sp. lini Strains of Different Virulence. Front. Genet. 2021, 12, 662928. [Google Scholar] [CrossRef]
- Povkhova, L.V.; Melnikova, N.V.; Rozhmina, T.A.; Novakovskiy, R.O.; Pushkova, E.N.; Dvorianinova, E.M.; Zhuchenko, A.A.; Kamionskaya, A.M.; Krasnov, G.S.; Dmitriev, A.A. Genes Associated with the Flax Plant Type (Oil or Fiber) Identified Based on Genome and Transcriptome Sequencing Data. Plants 2021, 10, 2616. [Google Scholar] [CrossRef]
- Soto-Cerda, B.J.; Aravena, G.; Cloutier, S. Genetic dissection of flowering time in flax (Linum usitatissimum L.) through single- and multi-locus genome-wide association studies. Mol. Genet. Genom. MGG 2021, 296, 877–891. [Google Scholar] [CrossRef]
- Bolsheva, N.L.; Melnikova, N.V.; Dvorianinova, E.M.; Mironova, L.N.; Yurkevich, O.Y.; Amosova, A.V.; Krasnov, G.S.; Dmitriev, A.A.; Muravenko, O.V. Clarification of the Position of Linum stelleroides Planch. within the Phylogeny of the Genus Linum, L. Plants 2022, 11, 652. [Google Scholar] [CrossRef] [PubMed]
- House, M.A.; Young, L.W.; Robinson, S.J.; Booker, H.M. Transcriptomic Analysis of Early Flowering Signals in ’Royal’ Flax. Plants 2022, 11, 860. [Google Scholar] [CrossRef] [PubMed]
- Li, X.; Guo, D.; Xue, M.; Li, G.; Yan, Q.; Jiang, H.; Liu, H.; Chen, J.; Gao, Y.; Duan, L.; et al. Genome-Wide Association Study of Salt Tolerance at the Seed Germination Stage in Flax (Linum usitatissimum L.). Genes 2022, 13, 486. [Google Scholar] [CrossRef]
- You, F.M.; Rashid, K.Y.; Zheng, C.; Khan, N.; Li, P.; Xiao, J.; He, L.; Yao, Z.; Cloutier, S. Insights into the Genetic Architecture and Genomic Prediction of Powdery Mildew Resistance in Flax (Linum usitatissimum L.). Int. J. Mol. Sci. 2022, 23, 4960. [Google Scholar] [CrossRef] [PubMed]
- Young, L.; Akhov, L.; Kulkarni, M.; You, F.; Booker, H. Fine-mapping of a putative glutathione S-transferase (GST) gene responsible for yellow seed colour in flax (Linum usitatissimum). BMC Res. Notes 2022, 15, 72. [Google Scholar] [CrossRef] [PubMed]
- Dvorianinova, E.M.; Bolsheva, N.L.; Pushkova, E.N.; Rozhmina, T.A.; Zhuchenko, A.A.; Novakovskiy, R.O.; Povkhova, L.V.; Sigova, E.A.; Zhernova, D.A.; Borkhert, E.V.; et al. Isolating Linum usitatissimum L. Nuclear DNA Enabled Assembling High-Quality Genome. Int. J. Mol. Sci. 2022, 23, 3244. [Google Scholar] [CrossRef]
- Sun, C.; Dong, Z.; Zhao, L.; Ren, Y.; Zhang, N.; Chen, F. The Wheat 660K SNP array demonstrates great potential for marker-assisted selection in polyploid wheat. Plant Biotechnol. J. 2020, 18, 1354–1360. [Google Scholar] [CrossRef]
- You, Q.; Yang, X.; Peng, Z.; Xu, L.; Wang, J. Development and Applications of a High Throughput Genotyping Tool for Polyploid Crops: Single Nucleotide Polymorphism (SNP) Array. Front. Plant Sci. 2018, 9, 104. [Google Scholar] [CrossRef] [Green Version]
- Rasheed, A.; Hao, Y.; Xia, X.; Khan, A.; Xu, Y.; Varshney, R.K.; He, Z. Crop Breeding Chips and Genotyping Platforms: Progress, Challenges, and Perspectives. Mol. Plant 2017, 10, 1047–1064. [Google Scholar] [CrossRef] [Green Version]
- Dmitriev, A.; Pushkova, E.; Melnikova, N. Plant Genome Sequencing: Modern Technologies and Novel Opportunities for Breeding. Mol. Biol. 2022, 56, 495–507. [Google Scholar] [CrossRef]
- McCormack, J.E.; Hird, S.M.; Zellmer, A.J.; Carstens, B.C.; Brumfield, R.T. Applications of next-generation sequencing to phylogeography and phylogenetics. Mol. Phylogenet. Evol. 2013, 66, 526–538. [Google Scholar] [CrossRef] [PubMed]
- Cruaud, P.; Rasplus, J.Y.; Rodriguez, L.J.; Cruaud, A. High-throughput sequencing of multiple amplicons for barcoding and integrative taxonomy. Sci. Rep. 2017, 7, 41948. [Google Scholar] [CrossRef] [PubMed]
- Borkhert, E.; Krasnov, G.; Bolsheva, N.; Kezimana, P.; Yurkevich, O.; Muravenko, O.; Kudryavtseva, A.; Melnikova, N. Genetics polymorphism of poplars from Moscow region based on high-throughput sequencing of ITS. Vavilov J. Genet. Breed. 2018, 22, 531–535. [Google Scholar] [CrossRef] [Green Version]
- Melnikova, N.V.; Kudryavtseva, A.V.; Borkhert, E.V.; Pushkova, E.N.; Fedorova, M.S.; Snezhkina, A.V.; Krasnov, G.S.; Dmitriev, A.A. Sex-specific polymorphism of MET1 and ARR17 genes in Populus × sibirica. Biochimie 2019, 162, 26–32. [Google Scholar] [CrossRef]
- Novakovskiy, R.O.; Dvorianinova, E.M.; Rozhmina, T.A.; Kudryavtseva, L.P.; Gryzunov, A.A.; Pushkova, E.N.; Povkhova, L.V.; Snezhkina, A.V.; Krasnov, G.S.; Kudryavtseva, A.V.; et al. Data on genetic polymorphism of flax (Linum usitatissimum L.) pathogenic fungi of Fusarium, Colletotrichum, Aureobasidium, Septoria, and Melampsora genera. Data Brief 2020, 31, 105710. [Google Scholar] [CrossRef]
- Bolger, A.M.; Lohse, M.; Usadel, B. Trimmomatic: A flexible trimmer for Illumina sequence data. Bioinformatics 2014, 30, 2114–2120. [Google Scholar] [CrossRef]
- Li, H. Aligning sequence reads, clone sequences and assembly contigs with BWA-MEM. arXiv 2013, arXiv:1303.3997. [Google Scholar]
- Garrison, E.; Marth, G. Haplotype-based variant detection from short-read sequencing. arXiv 2012, arXiv:1207.3907. [Google Scholar]


Disclaimer/Publisher’s Note: The statements, opinions and data contained in all publications are solely those of the individual author(s) and contributor(s) and not of MDPI and/or the editor(s). MDPI and/or the editor(s) disclaim responsibility for any injury to people or property resulting from any ideas, methods, instructions or products referred to in the content. |
© 2022 by the authors. Licensee MDPI, Basel, Switzerland. This article is an open access article distributed under the terms and conditions of the Creative Commons Attribution (CC BY) license (https://creativecommons.org/licenses/by/4.0/).
Share and Cite
Povkhova, L.V.; Pushkova, E.N.; Rozhmina, T.A.; Zhuchenko, A.A.; Frykin, R.I.; Novakovskiy, R.O.; Dvorianinova, E.M.; Gryzunov, A.A.; Borkhert, E.V.; Sigova, E.A.; et al. Development and Complex Application of Methods for the Identification of Mutations in the FAD3A and FAD3B Genes Resulting in the Reduced Content of Linolenic Acid in Flax Oil. Plants 2023, 12, 95. https://doi.org/10.3390/plants12010095
Povkhova LV, Pushkova EN, Rozhmina TA, Zhuchenko AA, Frykin RI, Novakovskiy RO, Dvorianinova EM, Gryzunov AA, Borkhert EV, Sigova EA, et al. Development and Complex Application of Methods for the Identification of Mutations in the FAD3A and FAD3B Genes Resulting in the Reduced Content of Linolenic Acid in Flax Oil. Plants. 2023; 12(1):95. https://doi.org/10.3390/plants12010095
Chicago/Turabian StylePovkhova, Liubov V., Elena N. Pushkova, Tatiana A. Rozhmina, Alexander A. Zhuchenko, Roman I. Frykin, Roman O. Novakovskiy, Ekaterina M. Dvorianinova, Aleksey A. Gryzunov, Elena V. Borkhert, Elizaveta A. Sigova, and et al. 2023. "Development and Complex Application of Methods for the Identification of Mutations in the FAD3A and FAD3B Genes Resulting in the Reduced Content of Linolenic Acid in Flax Oil" Plants 12, no. 1: 95. https://doi.org/10.3390/plants12010095