
Use of Multivariate Analysis to Unravel the Differences between Two Chamomile Varieties and Their Anticancer and Antioxidant Activities

Abstract
:1. Introduction
2. Results
2.1. Crude Extracts Results
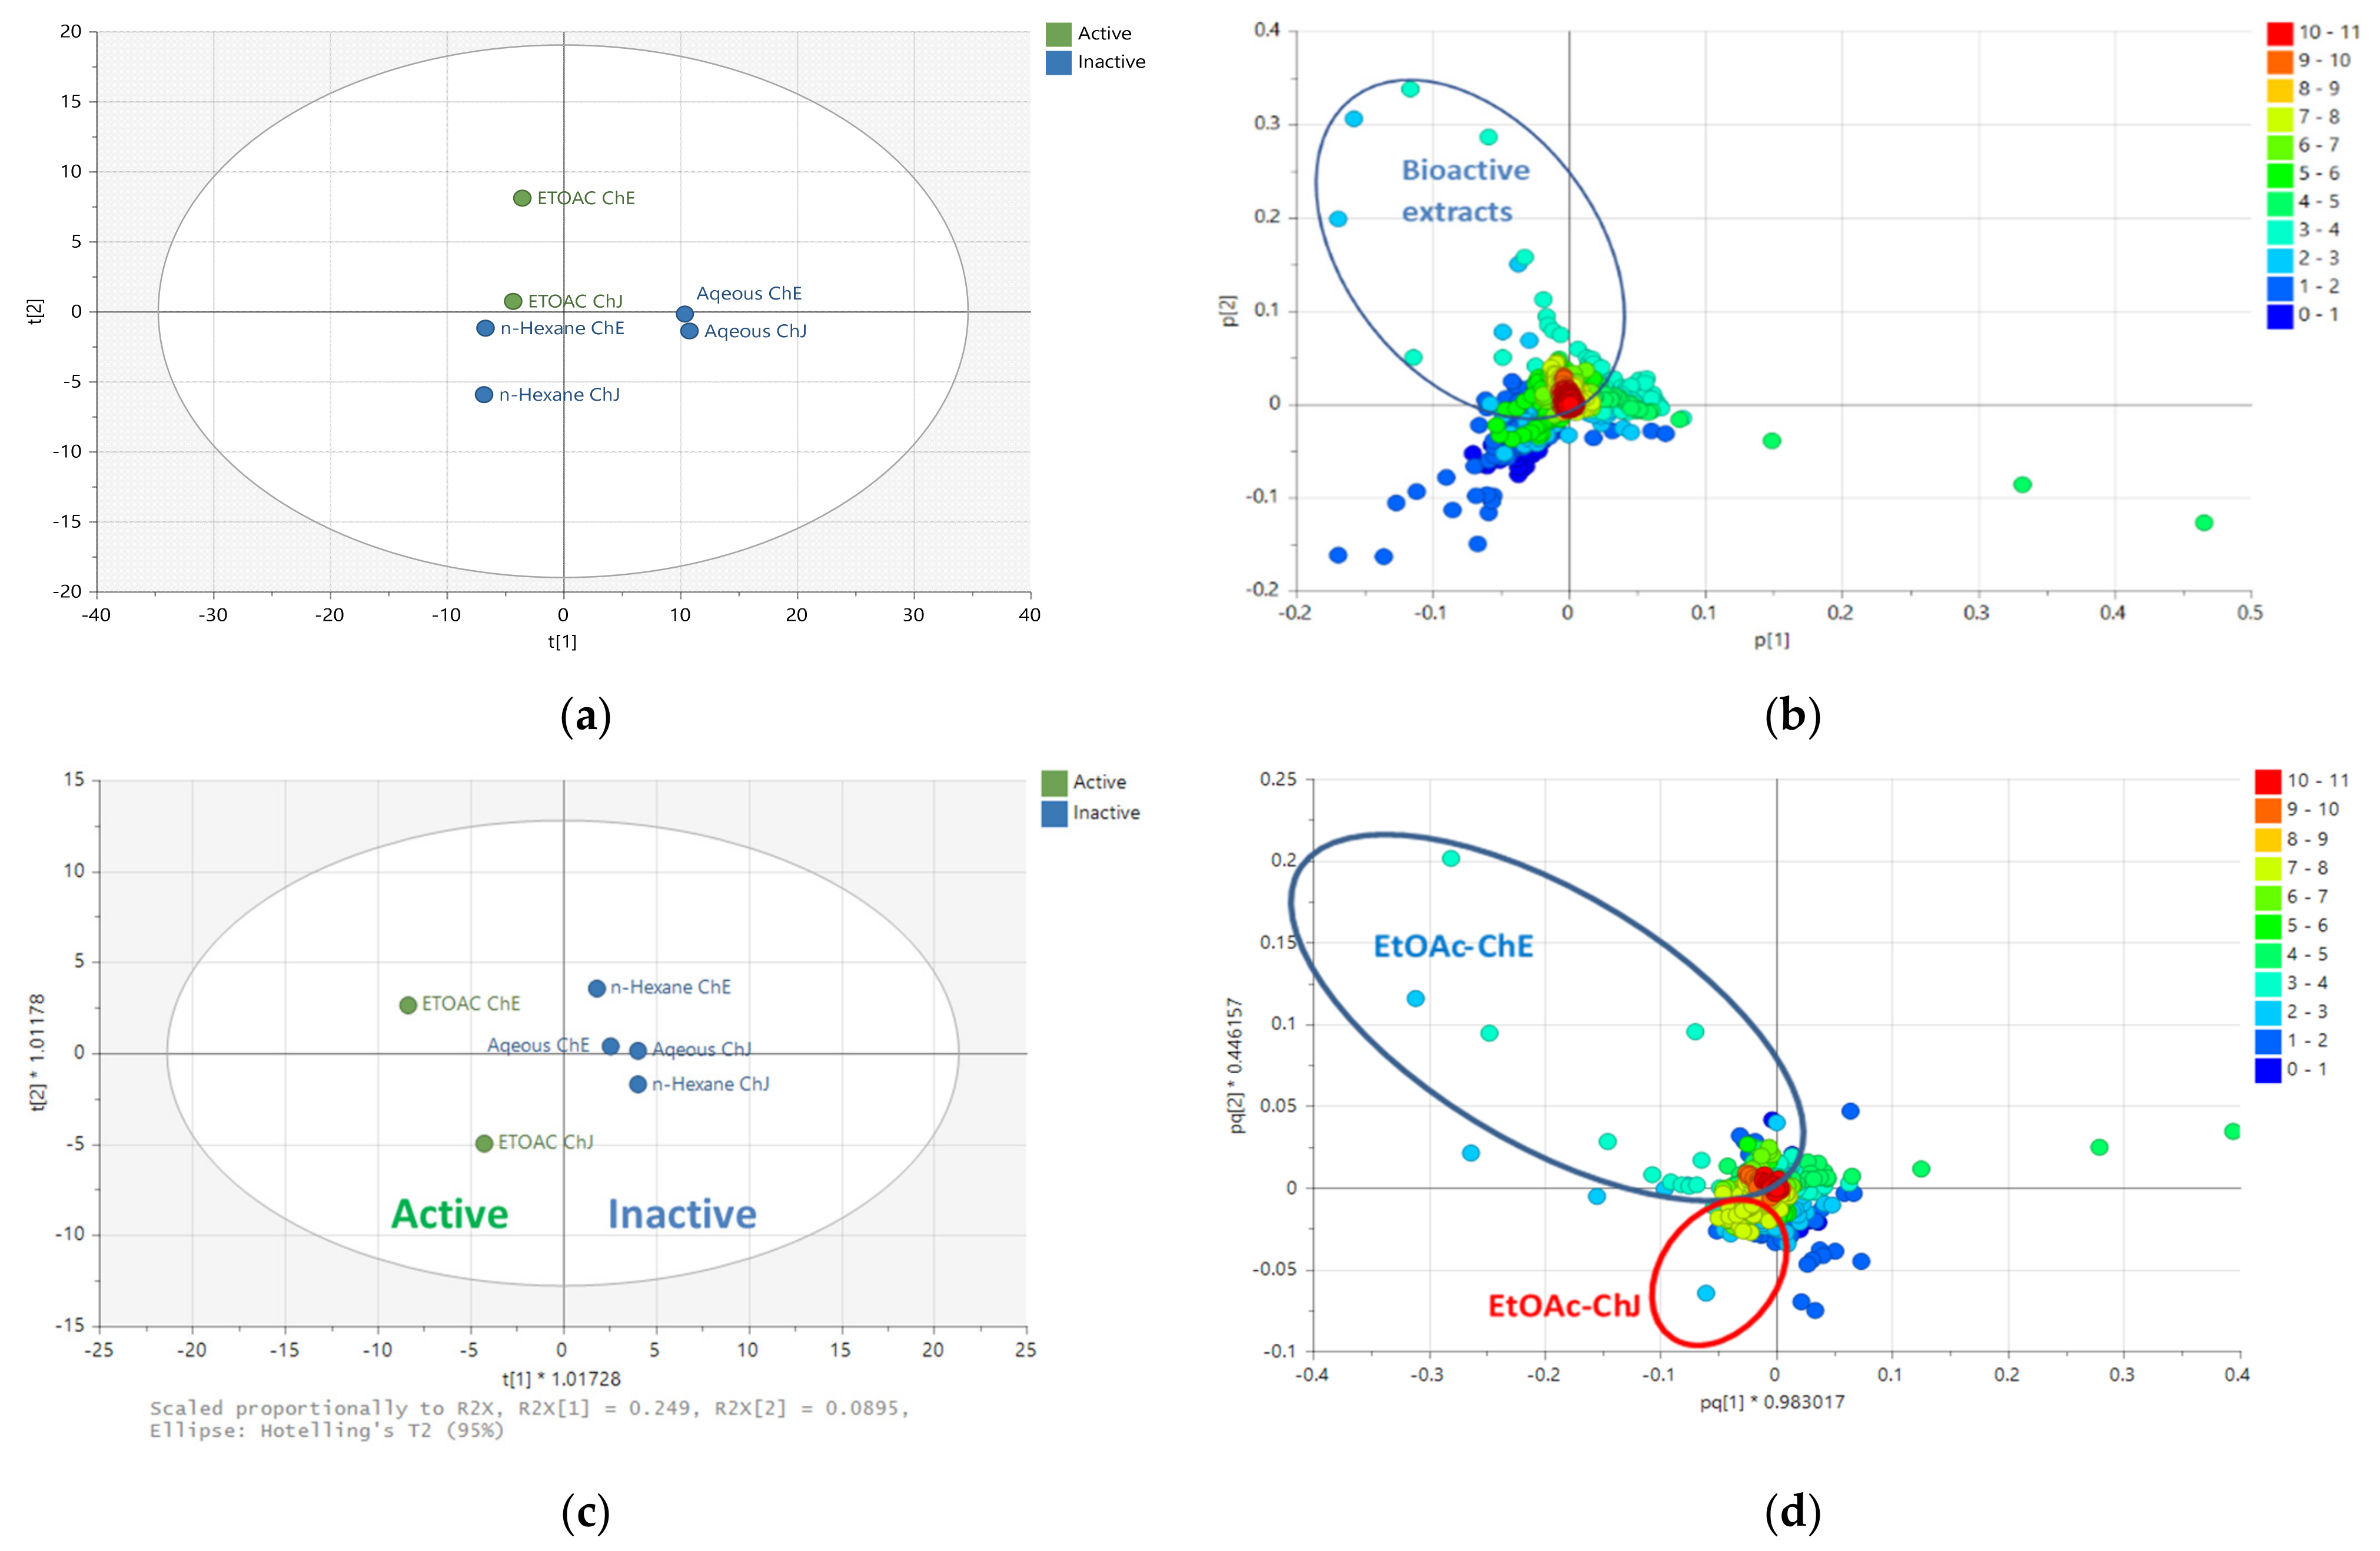
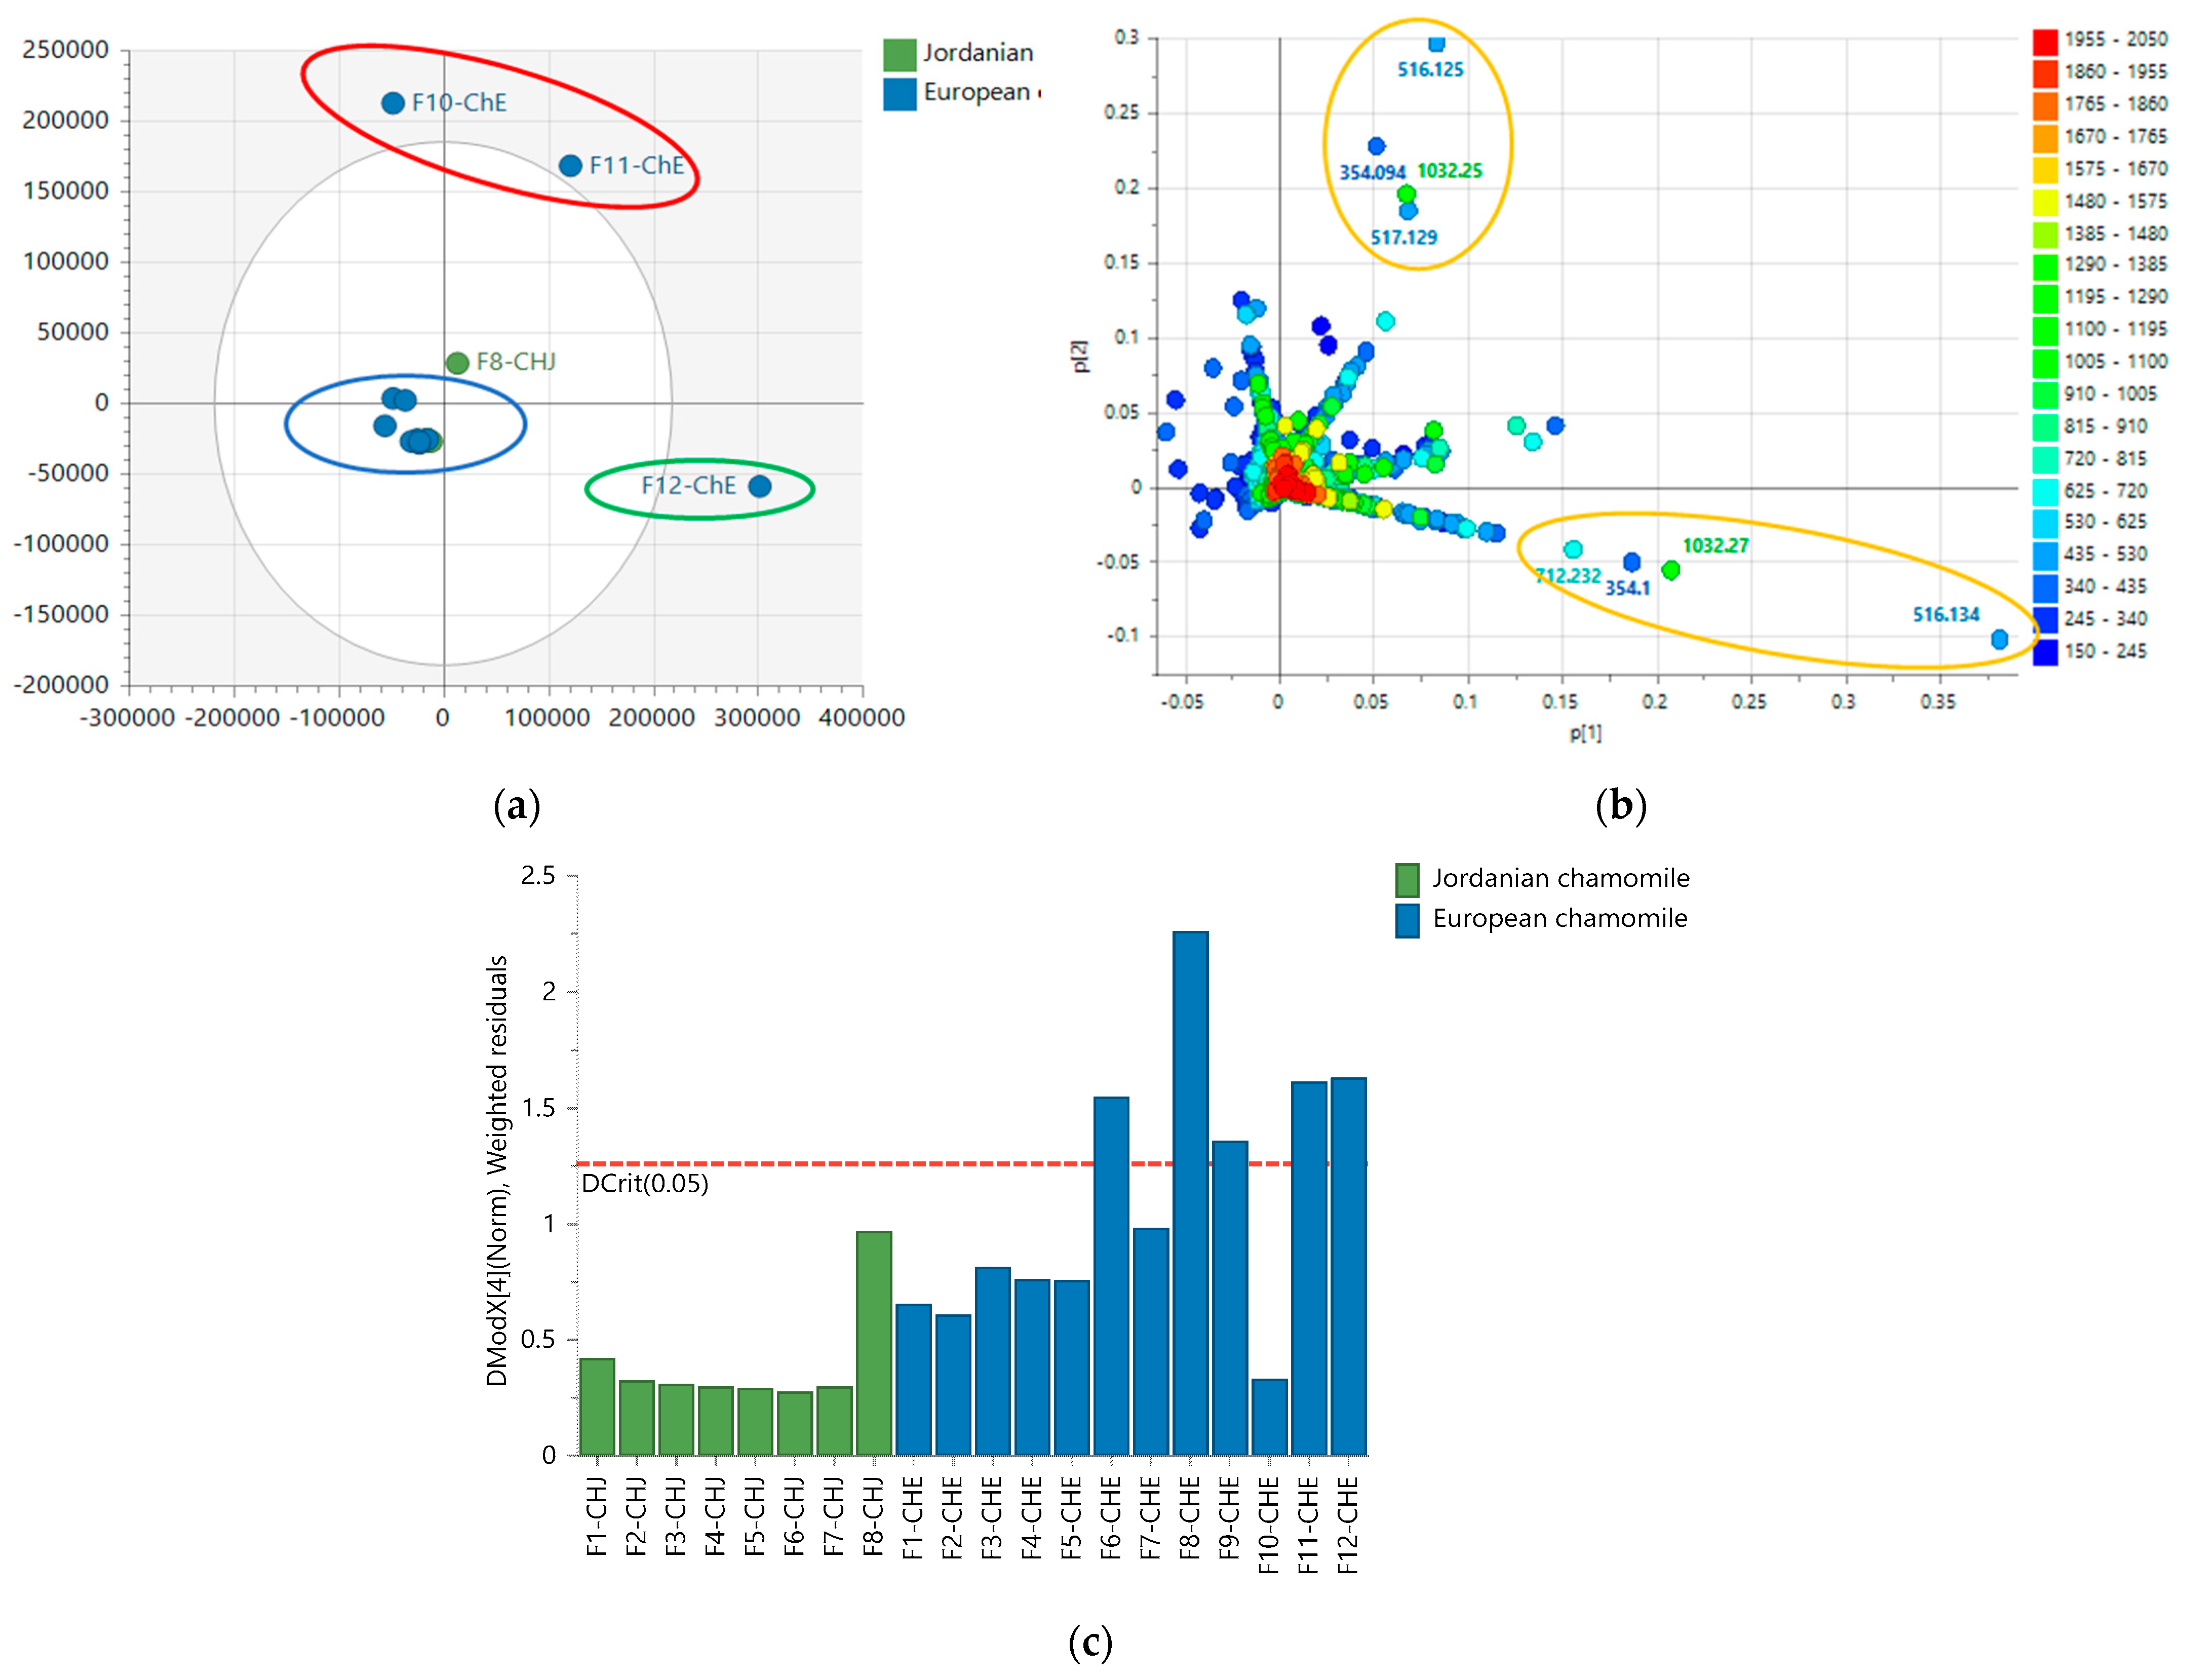
2.2. Multivariate Analysis of NMR Spectral Data
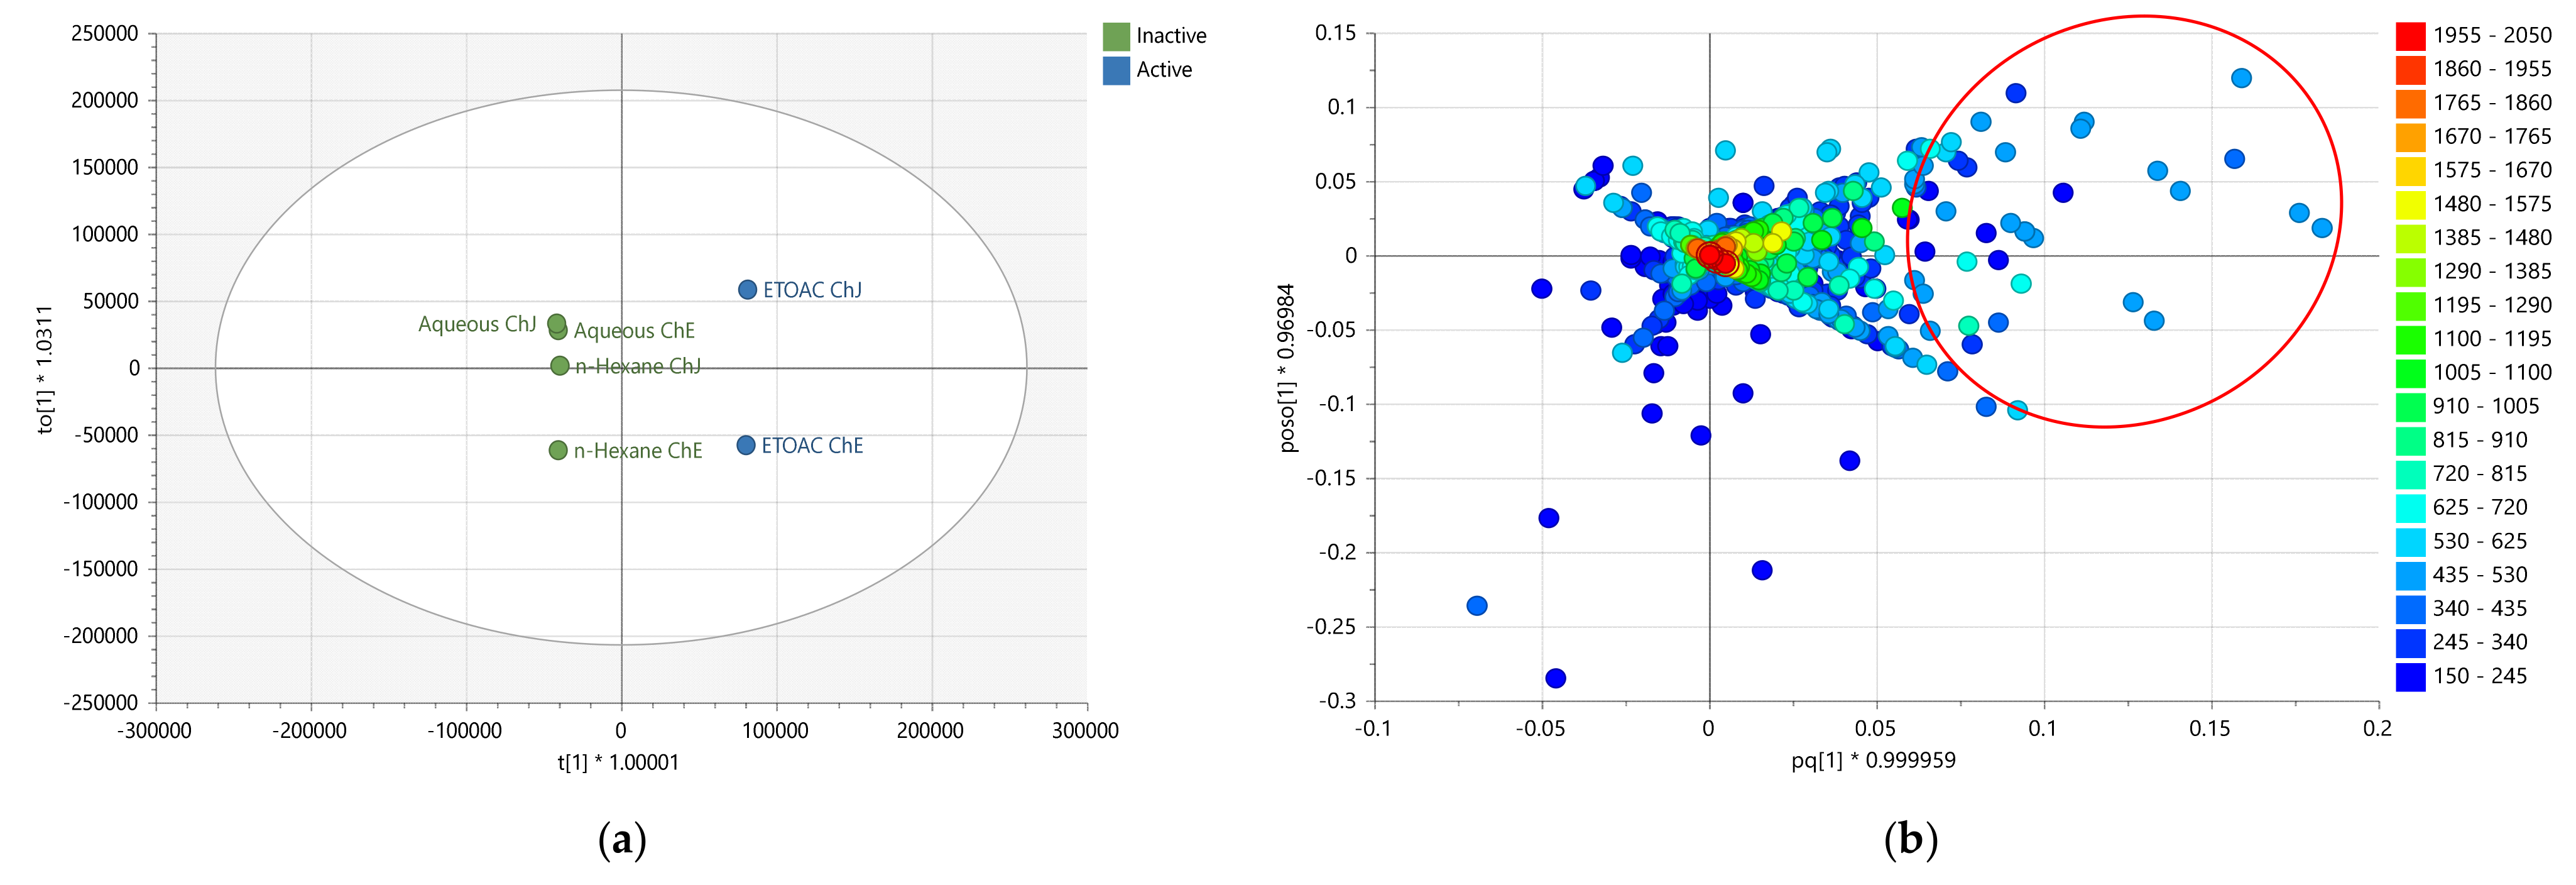
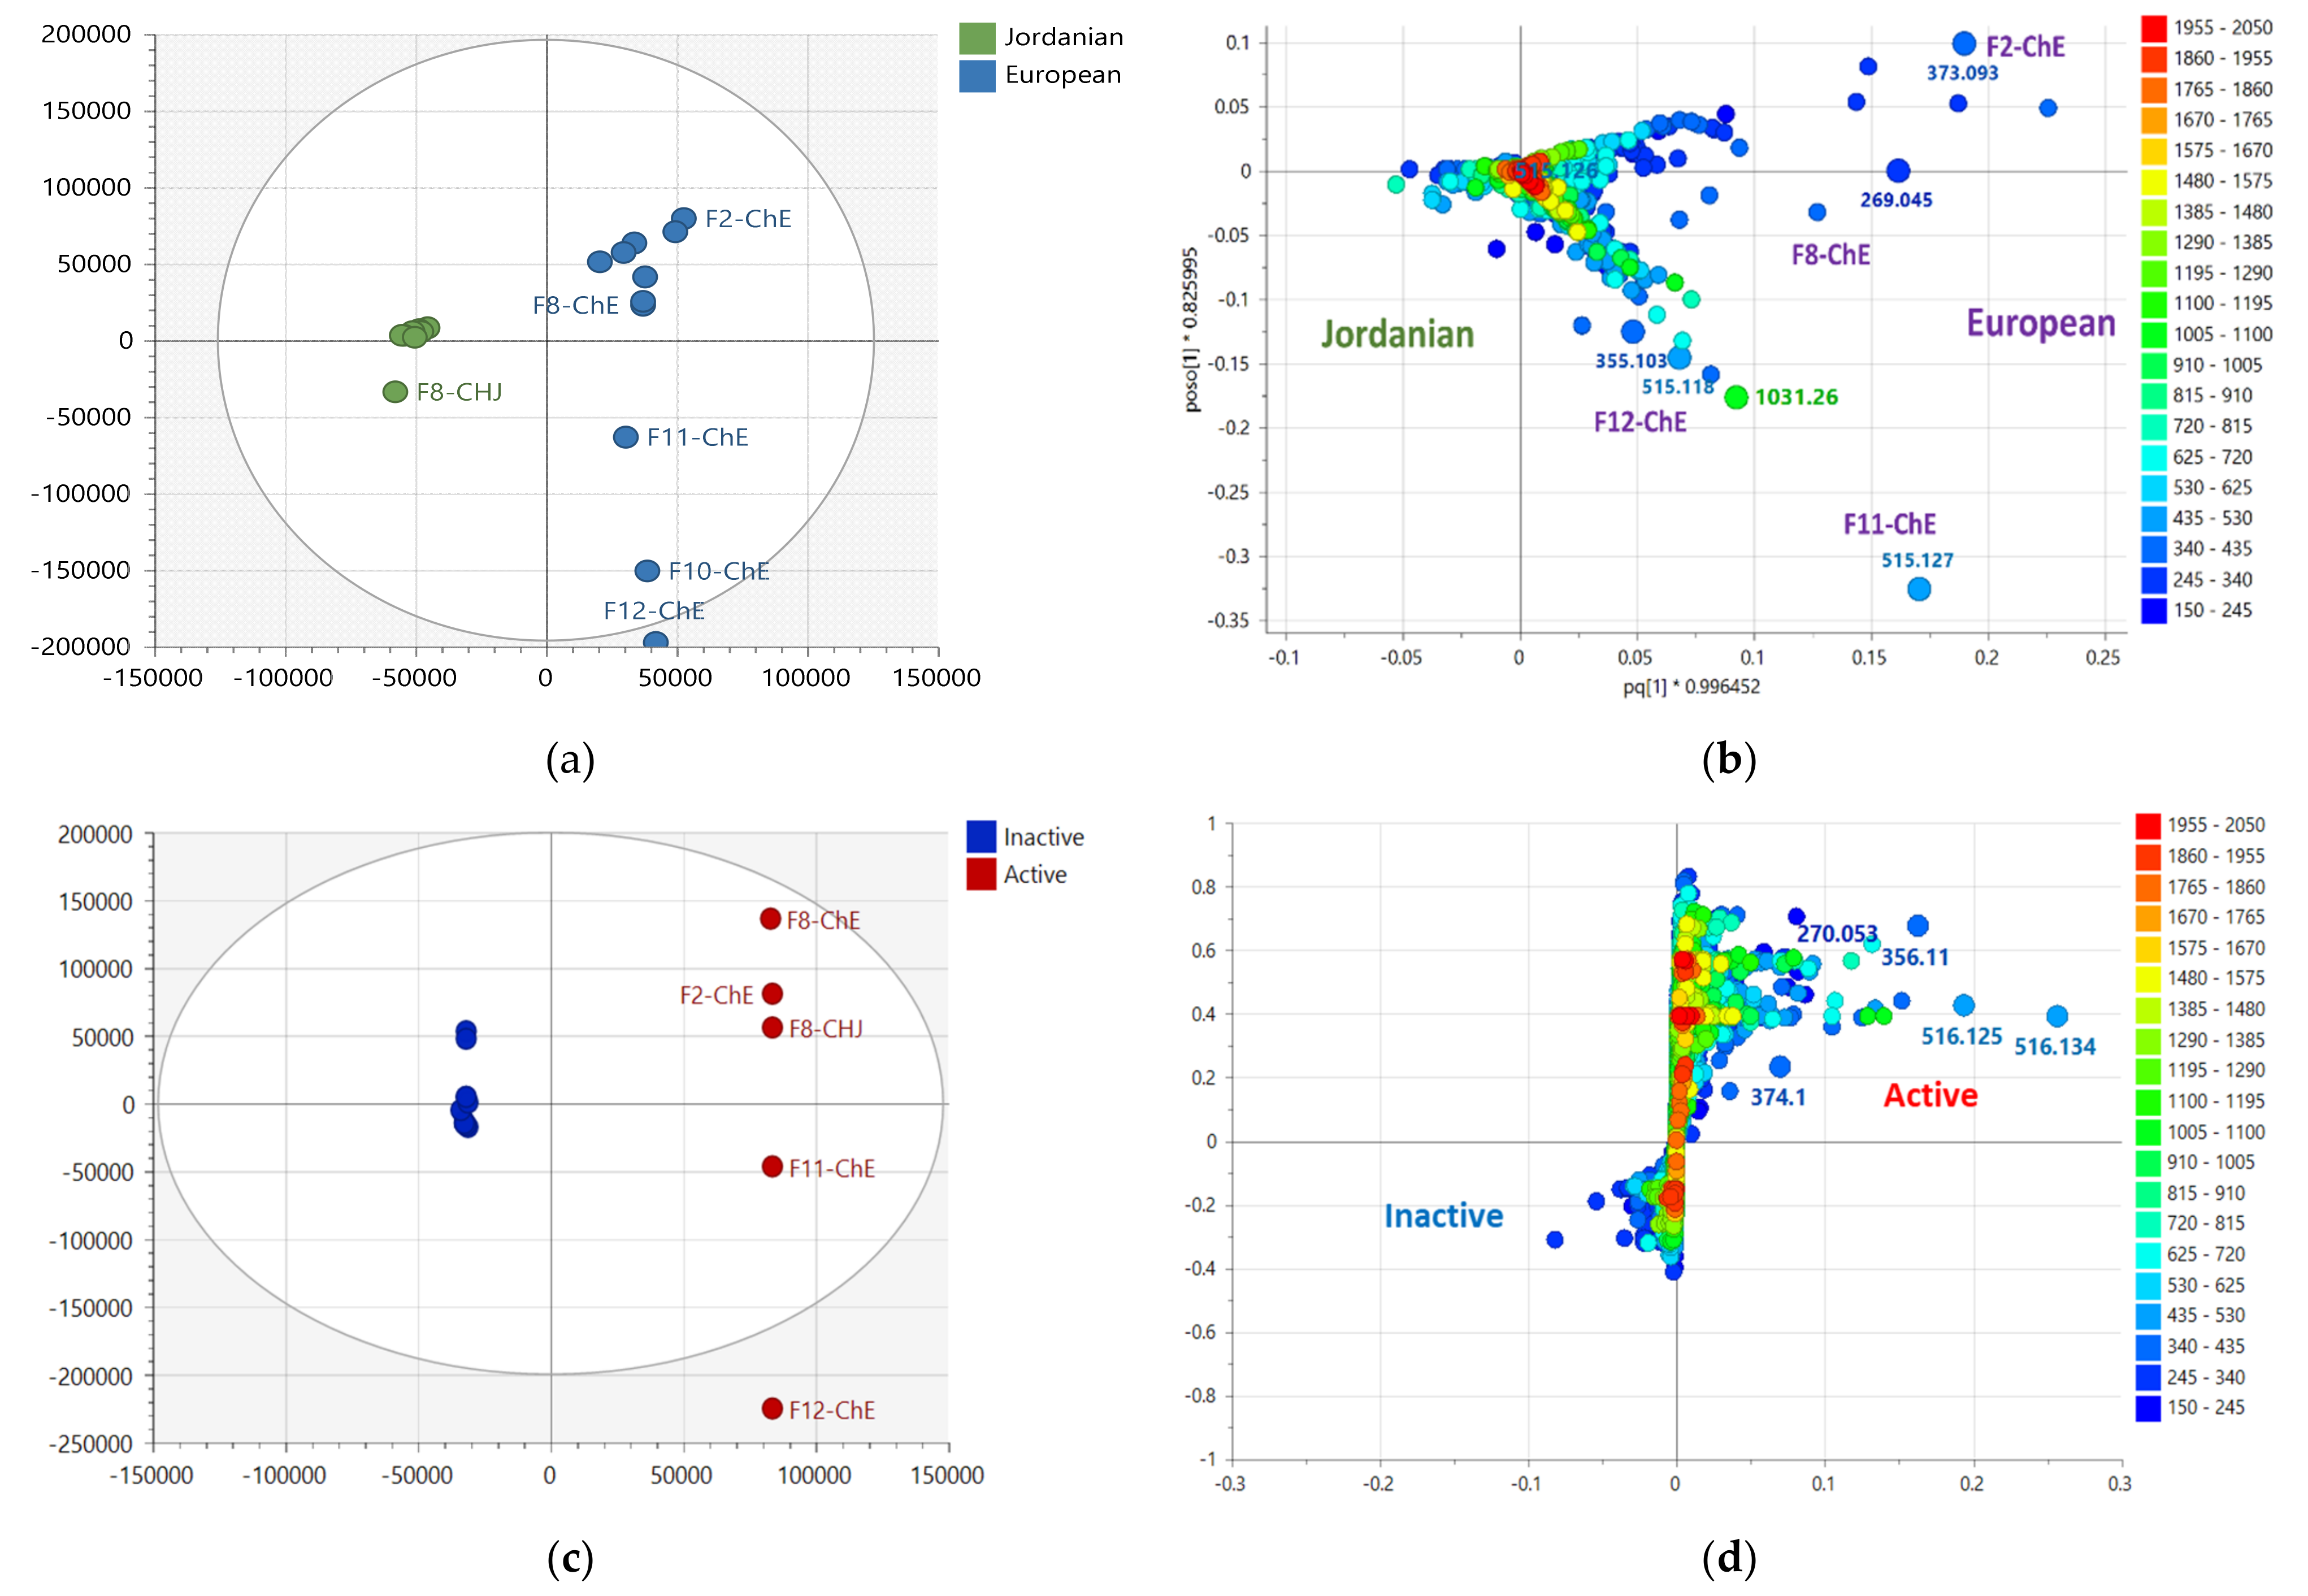
2.3. Multivariate Analysis of LC-HRMS Data
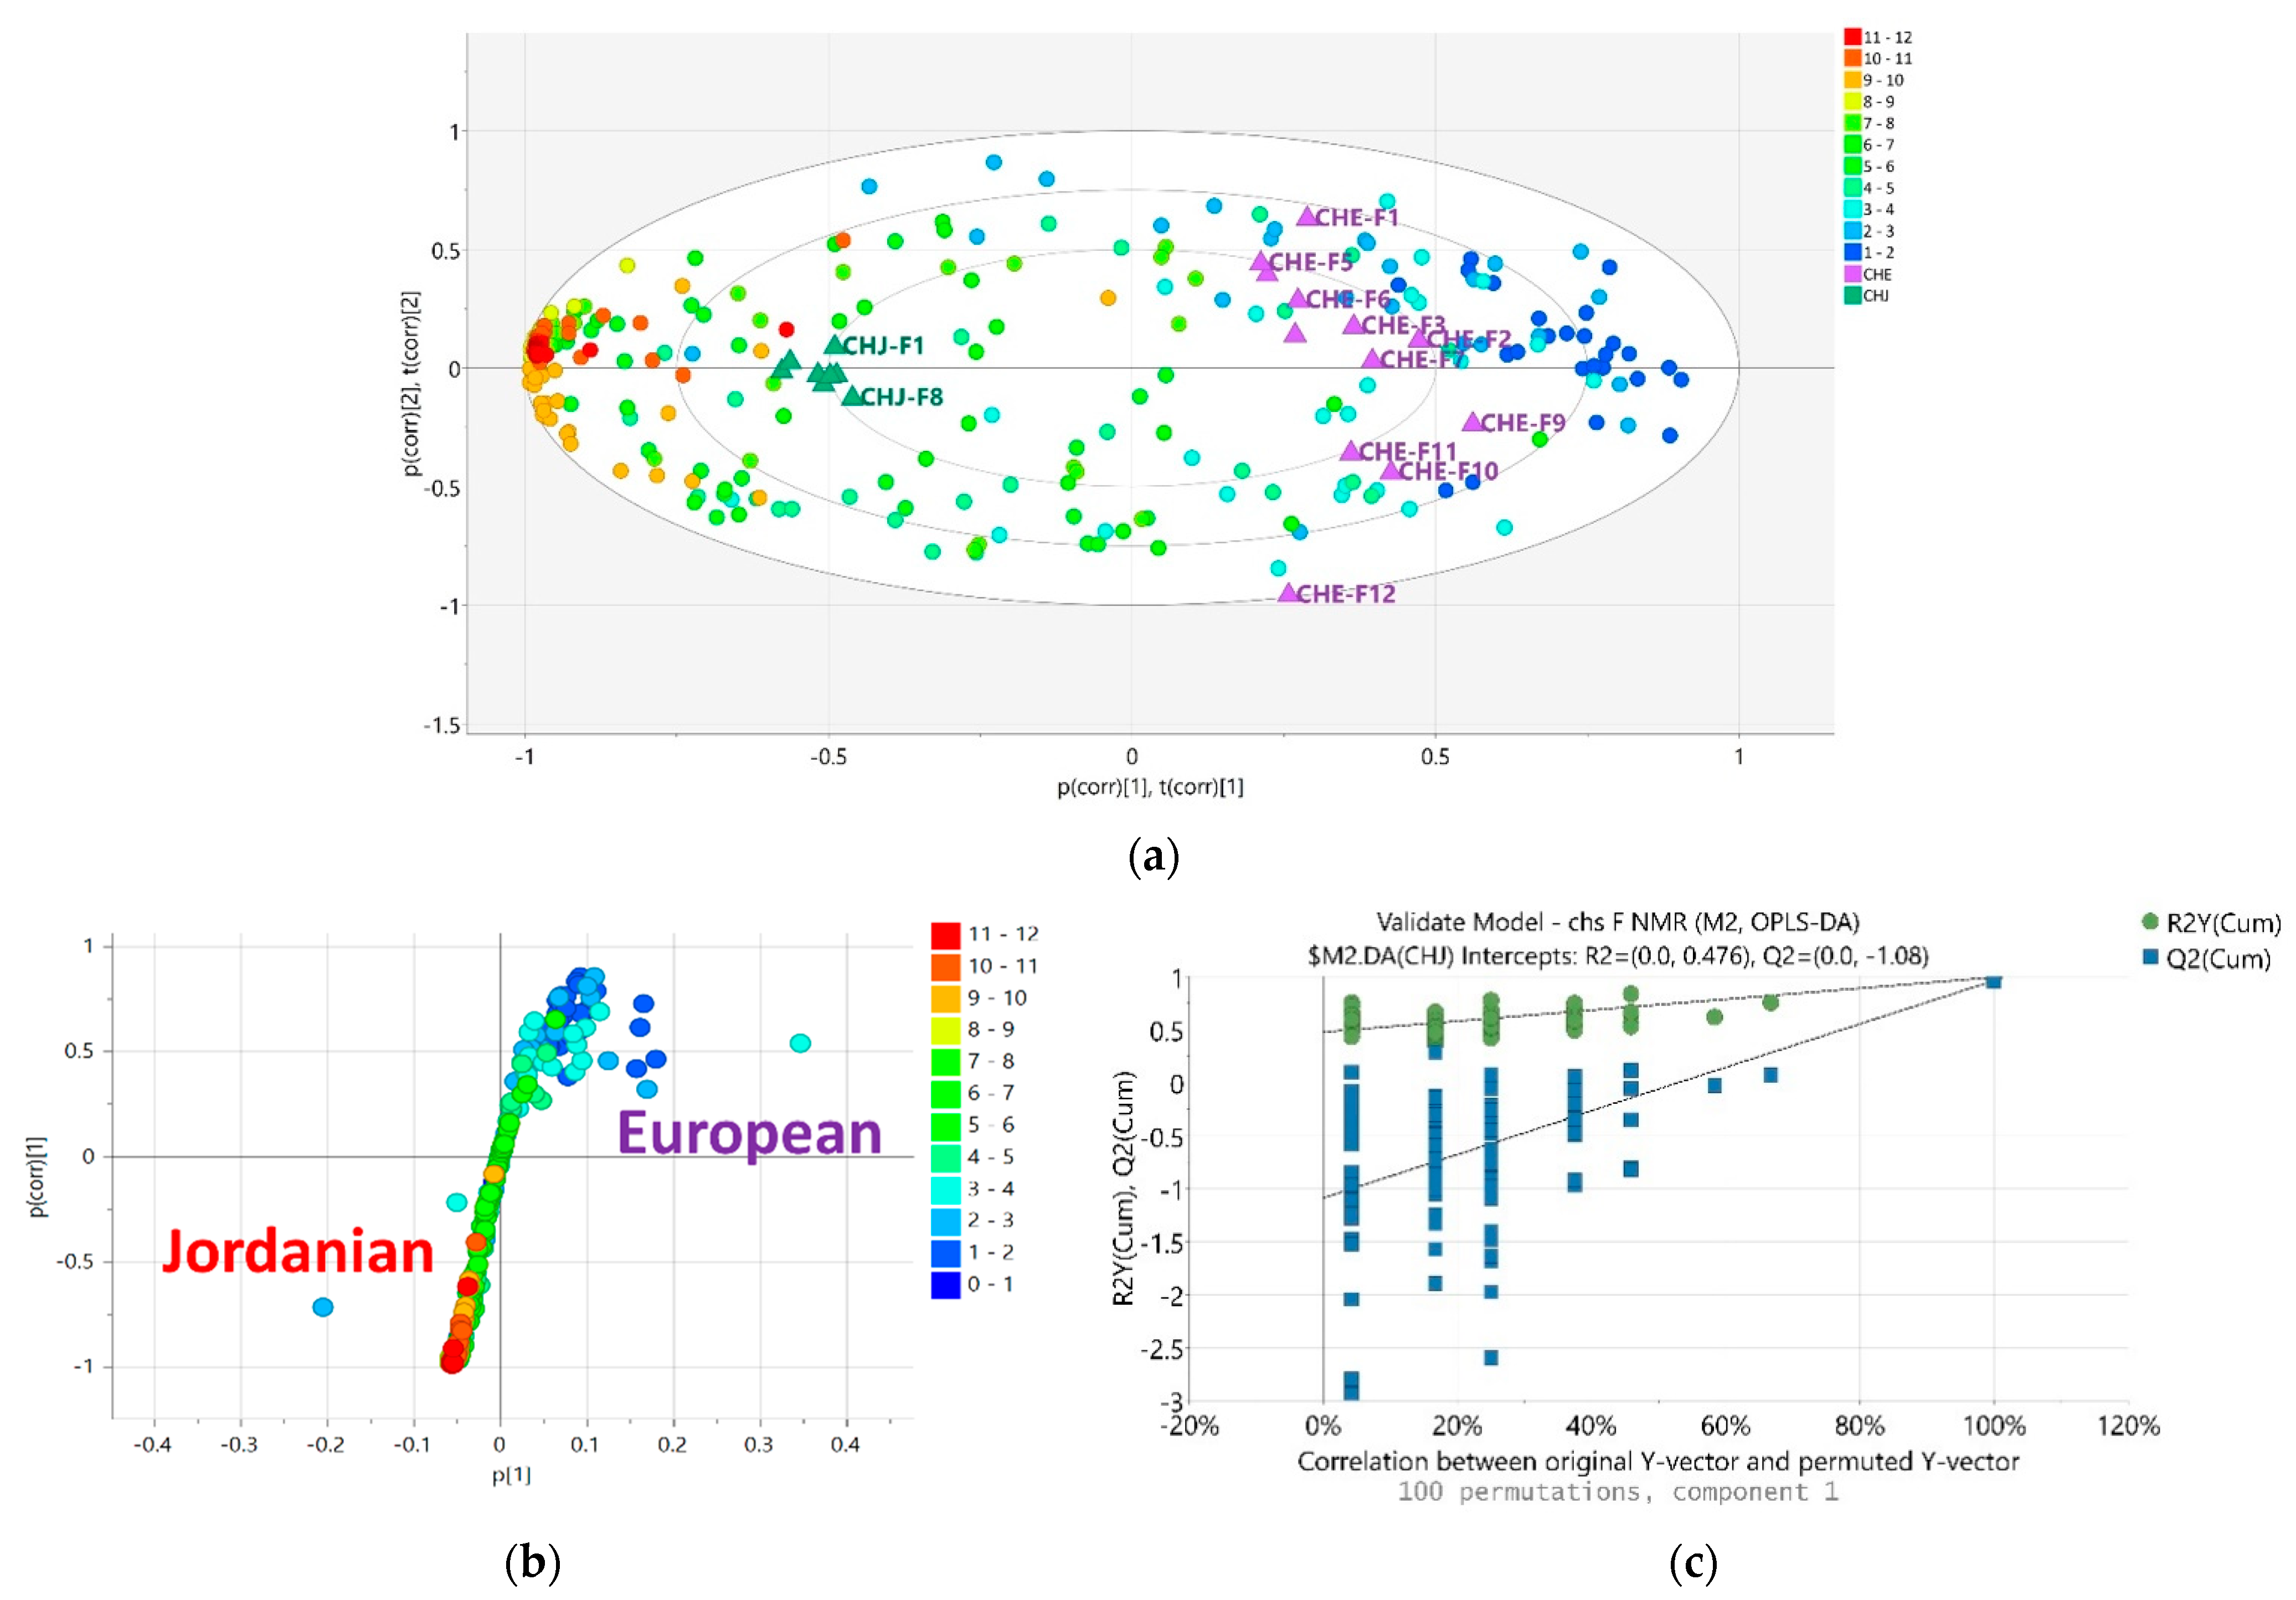
2.4. NMR Analysis of M. chamomilla Fractions
2.5. LC-HRMS Analysis of M. chamomilla Fractions
2.6. Biological Assay Results of the Bioactive Fractions
3. Discussion
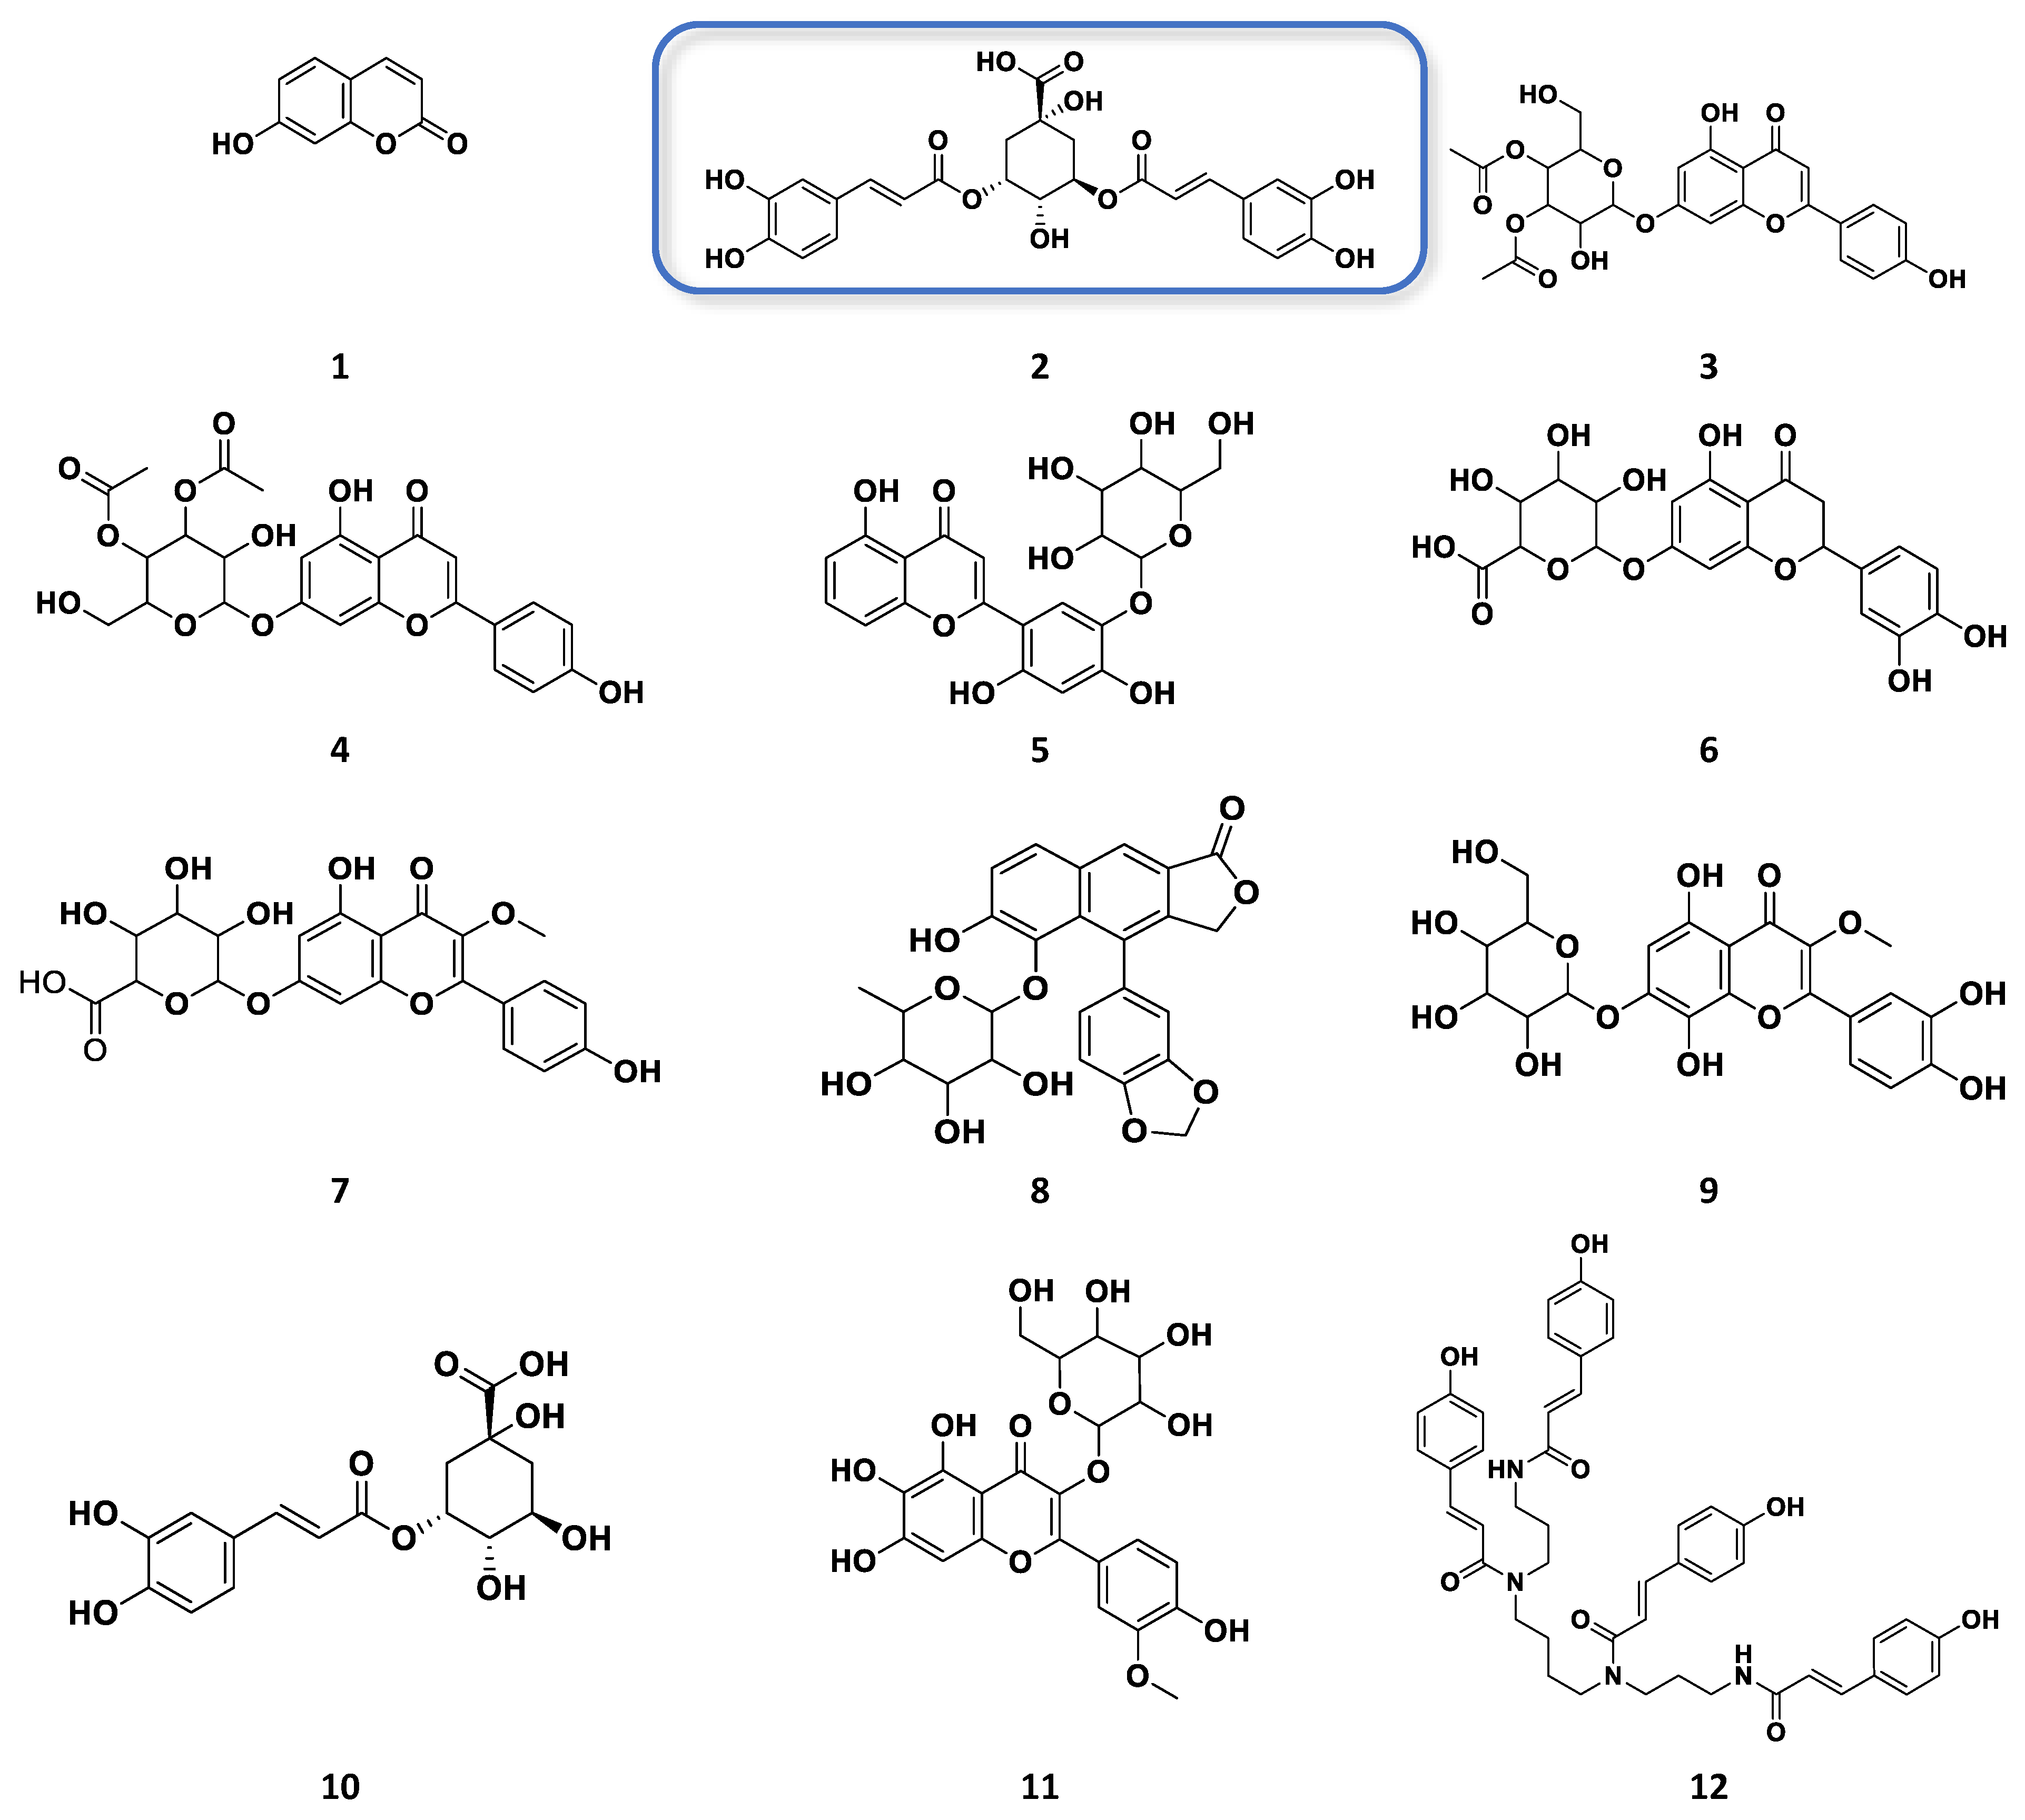
3.1. Metabolomic-Guided Isolation of Target Anticancer Active Metabolites
3.2. Role of Isolated Phenolics and Flavonoids Compound from Chamomile Varieties as Anticancer and Antioxidant Activity
4. Materials and Methods
4.1. Materials and Samples
4.1.1. Plant Material and Preparation of Extracts and Fractions
4.1.2. Data Processing and Chemical Profiling
4.1.3. Biological Assay
4.1.4. Antioxidant Activity
4.2. Fractionation of Active Extracts
4.3. Metabolomic Profiling Studies
4.3.1. Acquisition of Analytical Data NMR and HRESI-MS
4.3.2. HRESI-MS Data Process for Dereplication and Multivariate Analysis
4.3.3. NMR Data Process for Multivariate Analysis (MVA)
4.3.4. Multivariate Analysis
5. Conclusions
Final Conclusions
Supplementary Materials
Author Contributions
Funding
Data Availability Statement
Conflicts of Interest
References
- Sampaio, B.L.; Edrada-Ebel, R.; Da Costa, F.B. Effect of the environment on the secondary metabolic profile of Tithonia diversifolia: A model for environmental metabolomics of plants. Sci. Rep. 2016, 6, 29265. [Google Scholar] [CrossRef] [Green Version]
- Zanatta, A.C.; Vilegas, W.; Edrada-Ebel, R. UHPLC-(ESI)-HRMS and NMR-based metabolomics approach to access the seasonality of Byrsonima intermedia and Serjania marginata from Brazilian Cerrado flora diversity. Front. Chem. 2021, 9, 710025. [Google Scholar] [CrossRef]
- Petit, C.; Fréville, H.; Mignot, A.; Colas, B.; Riba, M.; Imbert, E.; Hurtrez-Boussés, S.; Virevaire, M.; Olivieri, I. Gene flow and local adaptation in two endemic plant species. Biol. Conserv. 2001, 100, 21–34. [Google Scholar] [CrossRef]
- Demain, A.L.; Fang, A. The natural functions of secondary metabolites. In History of Modern Biotechnology I. Advances in Biochemical Engineering/Biotechnology; Fiechter, A., Ed.; Springer: Berlin/Heidelberg, Germany, 2000; Volume 69, pp. 1–39. [Google Scholar] [CrossRef]
- Rohloff, J.; Bones, A.M. Volatile profiling of Arabidopsis thaliana—Putative olfactory compounds in plant communication. Phytochemistry 2005, 66, 1941–1955. [Google Scholar] [CrossRef] [PubMed]
- Ormeño, E.; Baldy, V.; Ballini, C.; Fernandez, C. Production and diversity of volatile terpenes from plants on calcareous and siliceous soils: Effect of soil nutrients. J. Chem. Ecol. 2008, 34, 1219–1229. [Google Scholar] [CrossRef] [PubMed]
- Di Ferdinando, M.; Brunetti, C.; Agati, G.; Tattini, M. Multiple functions of polyphenols in plants inhabiting unfavorable Mediterranean areas. Environ. Exp. Bot. 2014, 103, 107–116. [Google Scholar] [CrossRef]
- Lahijani, M.S.S.; Kateb, H.R.R.; Heady, R.; Yazdani, D. The effect of German chamomile (Marticaria recutita L.) extract and tea tree (Melaleuca alternifolia L.) oil used as irrigants on removal of smear layer: A scanning electron microscopy study. Int. Endod. J. 2006, 39, 190–195. [Google Scholar] [CrossRef] [PubMed]
- Guimarães, R.; Barros, L.; Dueñas, M.; Calhelha, R.C.; Carvalho, A.M.; Santos-Buelga, C.; Queiroz, M.J.R.P.; Ferreira, I.C.F.R. Nutrients, phytochemicals and bioactivity of wild Roman chamomile: A comparison between the herb and its preparations. Food Chem. 2013, 136, 718–725. [Google Scholar] [CrossRef] [PubMed] [Green Version]
- Chandrashekhar, V.M.; Halagali, K.S.; Nidavani, R.B.; Shalavadi, M.H.; Biradar, B.S.; Biswas, D.; Muchchandi, I.S. Anti-allergic activity of German chamomile (Matricaria recutita L.) in mast cell mediated allergy model. J. Ethnopharmacol. 2011, 137, 336–340. [Google Scholar] [CrossRef] [PubMed]
- Cvetanović, A.; Švarc-Gajić, J.; Mašković, P.; Savić, S.; Nikolić, L. Antioxidant and biological activity of chamomile extracts obtained by different techniques: Perspective of using superheated water for isolation of biologically active compounds. Ind. Crops Prod. 2015, 65, 582–591. [Google Scholar] [CrossRef]
- Ma, C.-M.; Winsor, L.; Daneshtalab, M. Quantification of spiroether isomers and herniarin of different parts of Matricaria matricarioides and flowers of Chamaemelum nobile. Phytochem. Anal. 2007, 18, 42–49. [Google Scholar] [CrossRef] [PubMed]
- Roby, M.H.H.; Sarhan, M.A.; Selim, K.A.-H.; Khalel, K.I. Antioxidant and antimicrobial activities of essential oil and extracts of fennel (Foeniculum vulgare L.) and chamomile (Matricaria chamomilla L.). Ind. Crops Prod. 2013, 44, 437–445. [Google Scholar] [CrossRef]
- Srivastava, J.K.; Pandey, M.; Gupta, S. Chamomile, a novel and selective COX-2 inhibitor with anti-inflammatory activity. Life Sci. 2009, 85, 663–669. [Google Scholar] [CrossRef] [Green Version]
- Zhang, S.; Xu, S.; Duan, H.; Zhu, Z.; Yang, Z.; Cao, J.; Zhao, Y.; Huang, Z.; Wu, Q.; Duan, J. A novel, highly-water-soluble apigenin derivative provides neuroprotection following ischemia in male rats by regulating the ERK/Nrf2/HO-1 pathway. Eur. J. Pharmacol. 2019, 855, 208–215. [Google Scholar] [CrossRef] [PubMed]
- McKay, D.L.; Blumberg, J.B. A Review of the bioactivity and potential health benefits of chamomile tea (Matricaria recutita L.). Phytother. Res. 2006, 20, 519–530. [Google Scholar] [CrossRef] [PubMed]
- Shankar, E.; Goel, A.; Gupta, K.; Gupta, S. Plant flavone apigenin: An emerging anticancer agent. Curr. Pharmacol. Rep. 2017, 3, 423–446. [Google Scholar] [CrossRef]
- Sadraei, H.; Asghari, G.; Khanabadi, M.; Minaiyan, M. Anti-inflammatory effect of apigenin and hydroalcoholic extract of Dracocephalum kotschyi on acetic acid-induced colitis in rats. Res. Pharm. Sci. 2017, 12, 322–329. [Google Scholar] [CrossRef] [Green Version]
- Hostetler, G.L.; Ralston, R.A.; Schwartz, S.J. Flavones: Food sources, bioavailability, metabolism, and bioactivity. Adv. Nutr. 2017, 8, 423–435. [Google Scholar] [CrossRef] [Green Version]
- Landis-Piwowar, K.R.; Milacic, V.; Dou, Q.P. Relationship between the methylation status of dietary flavonoids and their growth-inhibitory and apoptosis-inducing activities in human cancer cells. J. Cell. Biochem. 2008, 105, 514–523. [Google Scholar] [CrossRef] [Green Version]
- Salehi, B.; Venditti, A.; Sharifi-Rad, M.; Kręgiel, D.; Sharifi-Rad, J.; Durazzo, A.; Lucarini, M.; Santini, A.; Souto, E.B.; Novellino, E.; et al. The therapeutic potential of apigenin. Int. J. Mol. Sci. 2019, 20, 1305. [Google Scholar] [CrossRef] [Green Version]
- Moharram, F.A.; El Dib, R.A.E.M.; Marzouk, M.S.; El-Shenawy, S.M.; Ibrahim, H.A. New apigenin glycoside, polyphenolic constituents, anti-inflammatory and hepatoprotective activities of Gaillardia grandiflora and Gaillardia pulchella aerial parts. Pharmacogn. Mag. 2017, 13, S244–S249. [Google Scholar] [CrossRef] [Green Version]
- Popova, M.; Dimitrova, R.; Al-Lawati, H.T.; Tsvetkova, I.; Najdenski, H.; Bankova, V. Omani propolis: Chemical profiling, antibacterial activity and new propolis plant sources. Chem. Cent. J. 2013, 7, 158. [Google Scholar] [CrossRef] [Green Version]
- Rubert, J.; Lacina, O.; Zachariasova, M.; Hajslova, J. Saffron authentication based on liquid chromatography high resolution tandem mass spectrometry and multivariate data analysis. Food Chem. 2016, 204, 201–209. [Google Scholar] [CrossRef] [PubMed]
- Aru, V.; Lam, C.; Khakimov, B.; Hoefsloot, H.C.J.; Zwanenburg, G.; Lind, M.V.; Schäfer, H.; van Duynhoven, J.; Jacobs, D.M.; Smilde, A.K.; et al. Quantification of lipoprotein profiles by nuclear magnetic resonance spectroscopy and multivariate data analysis. TrAC Trends Anal. Chem. 2017, 94, 210–219. [Google Scholar] [CrossRef]
- Pluskal, T.; Castillo, S.; Villar-Briones, A.; Orešič, M. MZmine 2: Modular framework for processing, visualizing, and analyzing mass spectrometry-based molecular profile data. BMC Bioinform. 2010, 11, 395. [Google Scholar] [CrossRef] [PubMed] [Green Version]
- Jolliffe, I.T.; Cadima, J. Principal component analysis: A review and recent developments. Philos. Trans. A Math. Phys. Eng. Sci. 2016, 374, 20150202. [Google Scholar] [CrossRef] [PubMed] [Green Version]
- Cífková, E.; Holčapek, M.; Lísa, M.; Vrána, D.; Melichar, B.; Študent, V. Lipidomic differentiation between human kidney tumors and surrounding normal tissues using HILIC-HPLC/ESI–MS and multivariate data analysis. J. Chromatogr. B 2015, 1000, 14–21. [Google Scholar] [CrossRef]
- Forino, M.; Tenore, G.C.; Tartaglione, L.; Carmela, D.A.; Novellino, E.; Ciminiello, P. (1S,3R,4S,5R)5-O-Caffeoylquinic acid: Isolation, stereo-structure characterization and biological activity. Food Chem. 2015, 178, 306–310. [Google Scholar] [CrossRef]
- Kopustinskiene, D.M.; Jakstas, V.; Savickas, A.; Bernatoniene, J. Flavonoids as anticancer agents. Nutrients 2020, 12, 457. [Google Scholar] [CrossRef] [Green Version]
- Al-Rimawi, F.; Rishmawi, S.; Ariqat, S.H.; Khalid, M.F.; Warad, I.; Salah, Z. Anticancer activity, antioxidant activity, and phenolic and flavonoids content of wild Tragopogon porrifolius plant extracts. Evid.-Based Complement. Alternat. Med. 2016, 2016, 9612490. [Google Scholar] [CrossRef] [Green Version]
- Christophoridou, S.; Dais, P. Detection and quantification of phenolic compounds in olive oil by high resolution 1H nuclear magnetic resonance spectroscopy. Anal. Chim. Acta 2009, 633, 283–292. [Google Scholar] [CrossRef]
- Savage, A.K.; van Duynhoven, J.P.; Tucker, G.; Daykin, C.A. Enhanced NMR-based profiling of polyphenols in commercially available grape juices using solid-phase extraction. Magn. Reason. Chem. 2011, 49 (Suppl. S1), S27–S36. [Google Scholar] [CrossRef] [PubMed]
- Barnes, S.; Benton, H.P.; Casazza, K.; Cooper, S.J.; Cui, X.; Du, X.; Engler, J.; Kabarowski, J.H.; Li, S.; Pathmasiri, W.; et al. Training in metabolomics research. II. Processing and statistical analysis of metabolomics data, metabolite identification, pathway analysis, applications of metabolomics and its future. J. Mass Spectrom. 2016, 51, 535–548. [Google Scholar] [CrossRef] [Green Version]
- Vonthron-Sénécheau, C.; Weniger, B.; Ouattara, M.; Bi, F.T.; Kamenan, A.; Lobstein, A.; Brun, R.; Anton, R. In vitro antiplasmodial activity and cytotoxicity of ethnobotanically selected Ivorian plants. J. Ethnopharmacol. 2003, 87, 221–225. [Google Scholar] [CrossRef]
- Liang, Y.S.; Kim, H.K.; Lefeber, A.W.; Erkelens, C.; Choi, Y.H.; Verpoorte, R. Identification of phenylpropanoids in methyl jasmonate treated Brassica rapa leaves using two-dimensional nuclear magnetic resonance spectroscopy. J. Chromatogr. A 2006, 1112, 148–155. [Google Scholar] [CrossRef]
- Danino, O.; Gottlieb, H.E.; Grossman, S.; Bergman, M. Antioxidant activity of 1,3-dicaffeoylquinic acid isolated from Inula viscosa. Food Res. Int. 2009, 42, 1273–1280. [Google Scholar] [CrossRef]
- Hong, S.; Joo, T.; Jhoo, J.-W. Antioxidant and anti-inflammatory activities of 3, 5-dicaffeoylquinic acid isolated from Ligularia fischeri leaves. Food Sci. Biotech. 2015, 24, 257–263. [Google Scholar] [CrossRef]
- Matouq, M.; El-Hasan, T.; Al-Bilbisi, H.; Abdelhadi, M.; Hindiyeh, M.; Eslamian, S.; Duheisat, S. The climate change implication on Jordan: A case study using GIS and artificial neural networks for weather forecasting. J. Taibah Univ. Sci. 2013, 7, 44–55. [Google Scholar] [CrossRef] [Green Version]
- Nogués, I.; Llusià, J.; Ogaya, R.; Munné-Bosch, S.; Sardans, J.; Peñuelas, J.; Loreto, F. Physiological and antioxidant responses of Quercus ilex to drought in two different seasons. Plant Biosyst. 2014, 148, 268–278. [Google Scholar] [CrossRef]
- Rivas-Ubach, A.; Gargallo-Garriga, A.; Sardans, J.; Oravec, M.; Mateu-Castell, L.; Pérez-Trujillo, M.; Parella, T.; Ogaya, R.; Urban, O.; Peñuelas, J. Drought enhances folivory by shifting foliar metabolomes in Quercus ilex trees. New Phytol. 2014, 202, 874–885. [Google Scholar] [CrossRef] [PubMed] [Green Version]
- Ramakrishna, A.; Ravishankar, G. Influence of abiotic stress signals on secondary metabolites in plants. Plant Signal. Behav. 2011, 6, 1720–1731. [Google Scholar]
- Arbona, V.; Manzi, M.; Ollas, C.D.; Gómez-Cadenas, A. Metabolomics as a tool to investigate abiotic stress tolerance in plants. Int. J. Mol. Sci. 2013, 14, 4885–4911. [Google Scholar] [CrossRef] [Green Version]
- Reddy, A.R.; Chaitanya, K.V.; Vivekanandan, M. Drought-induced responses of photosynthesis and antioxidant metabolism in higher plants. J. Plant Physiol. 2004, 161, 1189–1202. [Google Scholar] [CrossRef] [PubMed]
- Morison, J.; Lawlor, D. Interactions between increasing CO2 concentration and temperature on plant growth. Plant Cell Environ. 1999, 22, 659–682. [Google Scholar] [CrossRef] [Green Version]
- Sung, B.; Chung, H.Y.; Kim, N.D. Role of apigenin in cancer prevention via the induction of apoptosis and autophagy. J. Cancer Prev. 2016, 21, 216–226. [Google Scholar] [CrossRef] [Green Version]
- Madunic, J.; Madunic, I.V.; Gajski, G.; Popic, J.; Garaj-Vrhovac, V. Apigenin: A dietary flavonoid with diverse anticancer properties. Cancer Lett. 2018, 413, 11–22. [Google Scholar] [CrossRef]
- Birt, D.F.; Jeffery, E. Flavonoids. Adv. Nutr. 2013, 4, 576–577. [Google Scholar] [CrossRef] [Green Version]
- Sak, K. Cytotoxicity of dietary flavonoids on different human cancer types. Pharmacog. Rev. 2014, 8, 122–146. [Google Scholar] [CrossRef] [PubMed] [Green Version]
- Simon, H.-U.; Haj-Yehia, A.; Levi-Schaffer, F. Role of reactive oxygen species (ROS) in apoptosis induction. Apoptosis 2000, 5, 415–418. [Google Scholar] [CrossRef] [PubMed]
- Bak, M.J.; Das Gupta, S.; Wahler, J.; Suh, N. Role of dietary bioactive natural products in estrogen receptor-positive breast cancer. Semin. Cancer Biol. 2016, 40–41, 170–191. [Google Scholar] [CrossRef] [PubMed] [Green Version]
- Zhou, Y.; Zheng, J.; Li, Y.; Xu, D.P.; Li, S.; Chen, Y.M.; Li, H.B. Natural Polyphenols for Prevention and Treatment of Cancer. Nutrients 2016, 8, 515. [Google Scholar] [CrossRef] [PubMed] [Green Version]
- Mafuvadze, B.; Liang, Y.; Besch-Williford, C.; Zhang, X.; Hyder, S.M. Apigenin induces apoptosis and blocks growth of medroxyprogesterone acetate-dependent BT-474 xenograft tumors. Horm. Cancer 2012, 3, 160–171. [Google Scholar] [CrossRef] [Green Version]
- Seo, H.S.; Ku, J.M.; Choi, H.S.; Woo, J.K.; Jang, B.H.; Go, H.; Shin, Y.C.; Ko, S.G. Apigenin induces caspase-dependent apoptosis by inhibiting signal transducer and activator of transcription 3 signaling in HER2-overexpressing SKBR3 breast cancer cells. Mol. Med. Rep. 2015, 12, 2977–2984. [Google Scholar] [CrossRef] [Green Version]
- Seo, H.S.; Jo, J.K.; Ku, J.M.; Choi, H.S.; Choi, Y.K.; Woo, J.K.; Kim, H.I.; Kang, S.Y.; Lee, K.M.; Nam, K.W.; et al. Induction of caspase-dependent extrinsic apoptosis by apigenin through inhibition of signal transducer and activator of transcription 3 (STAT3) signalling in HER2-overexpressing BT-474 breast cancer cells. Biosci. Rep. 2015, 35, e00276. [Google Scholar] [CrossRef] [Green Version]
- Seo, H.-S.; Ku, J.M.; Choi, H.-S.; Woo, J.-K.; Jang, B.-H.; Shin, Y.C.; Ko, S.-G. Induction of caspase-dependent apoptosis by apigenin by inhibiting STAT3 signaling in HER2-overexpressing MDA-MB-453 breast cancer cells. Anticancer Res. 2014, 34, 2869–2882. [Google Scholar]
- Bai, H.; Jin, H.; Yang, F.; Zhu, H.; Cai, J. Apigenin induced MCF-7 cell apoptosis-associated reactive oxygen species. Scanning 2014, 36, 622–631. [Google Scholar] [CrossRef]
- Birt, D.F.; Walker, B.; Tibbels, M.G.; Bresnick, E. Anti-mutagenesis and anti-promotion by apigenin, robinetin and indole-3-carbinol. Carcinogenesis 1986, 7, 959–963. [Google Scholar] [CrossRef]
- He, J.; Xu, Q.; Wang, M.; Li, C.; Qian, X.; Shi, Z.; Liu, L.Z.; Jiang, B.H. Oral administration of apigenin inhibits metastasis through AKT/P70S6K1/MMP-9 pathway in orthotopic ovarian tumor model. Int. J. Mol. Sci. 2012, 13, 7271–7282. [Google Scholar] [CrossRef] [PubMed]
- Sohretoglu, D.; Barut, B.; Sari, S.; Ozel, A.; Arroo, R. In vitro and in silico assessment of DNA interaction, topoisomerase I and II inhibition properties of chrysosplenetin. Int. J. Biol. Macromol. 2020, 163, 1053–1059. [Google Scholar] [CrossRef]
- Sinha, S.; Amin, H.; Nayak, D.; Bhatnagar, M.; Kacker, P.; Chakraborty, S.; Kitchlu, S.; Vishwakarma, R.; Goswami, A.; Ghosal, S. Assessment of microtubule depolymerization property of flavonoids isolated from Tanacetum gracile in breast cancer cells by biochemical and molecular docking approach. Chem.-Biol. Interact. 2015, 239, 1–11. [Google Scholar] [CrossRef] [PubMed]
- Chahar, M.K.; Sharma, N.; Dobhal, M.P.; Joshi, Y.C. Flavonoids: A versatile source of anticancer drugs. Pharmacog. Rev. 2011, 5, 1. [Google Scholar]
- Talhouk, R.; Karam, C.; Fostok, S.; El-Jouni, W.; Barbour, E. Anti-inflammatory bioactivities in plant extracts. J. Med. Food 2007, 10, 1–10. [Google Scholar] [CrossRef]
- Tungmunnithum, D.; Thongboonyou, A.; Pholboon, A.; Yangsabai, A. Flavonoids and other phenolic compounds from medicinal plants for pharmaceutical and medical aspects: An overview. Medicines 2018, 5, 93. [Google Scholar] [CrossRef]
- Kikuzaki, H.; Hisamoto, M.; Hirose, K.; Akiyama, K.; Taniguchi, H. Antioxidant properties of ferulic acid and its related compounds. J. Agric. Food Chem. 2002, 50, 2161–2168. [Google Scholar] [CrossRef]
- Macintyre, L.; Zhang, T.; Viegelmann, C.; Martinez, I.J.; Cheng, C.; Dowdells, C.; Abdelmohsen, U.R.; Gernert, C.; Hentschel, U.; Edrada-Ebel, R. Metabolomic tools for secondary metabolite discovery from marine microbial symbionts. Mar. Drugs 2014, 12, 3416–3448. [Google Scholar] [CrossRef] [Green Version]


| Type of Extract | Jordanian Chamomile (mg/mL) | European Chamomile (mg/mL) | n |
|---|---|---|---|
| n-Hexane | inactive | inactive | 3 |
| 10% aq MeOH | inactive | inactive | 3 |
| EtOAc (Mean ± SEM) | 0.20 (0.20 ± 3.29 × 10⁻⁵) | 0.16 (0.16 ± 2.77 × 10⁻⁵) | 3 |
| ascorbic acid (control) mg/mL (Mean ± SEM) | 0.11 (0.11 ± 1.43 × 10⁻⁵) | 3 | |
| quercetin (control) mg/mL (Mean ± SEM) | 0.03 (0.03 ± 4.00 × 10⁻⁴) | 3 | |
| Var ID * | p-Values | m/z (Da) | Rt (min) | MW | Name | Molecular Formula | Reported Biological Source in the Database |
|---|---|---|---|---|---|---|---|
| P_1931 | 3.60 × 10⁻⁶ | 163.0389 | 7.84 | 162.0317 | 7-hydroxy-2H-1-benzopyran-2-one (1) | C9H6O3 | M. chamomilla |
| N_3284 | 5.31 × 10⁻⁵ | 515.1196 | 8.43 | 516.1269 | 7″-Z-3,5-di-O-caffeoylquinic acid (2) ** and positional isomers | C25H24O12 | Arnica montana |
| P_1848 | 2.16 × 10⁻⁴ | 517.1341 | 8.43 | 516.1269 | 3″,4″-di-acetylcosmosiin (3) ** | C25H24O12 | M. chamomilla |
| O-[3,4-dihydroxy-E-cinnamoyl-4-α-d-glucopyranoside] (4) ** | Erycibe obtusifolia | ||||||
| P_21550 | 2.51 × 10⁻⁴ | 465.1029 | 7.55 | 464.0956 | 2′,4′,5,5′,7 pentahydroxyflavone (5) ** | C21H20O12 | Artemisia hispanica |
| P_7541 | 2.51 × 10⁻⁴ | 465.1028 | 7.55 | 464.0956 | 7-O-β-d-glucuronopyranoside (6) ** | C21H20O12 | Chrysanthemum indicum |
| N_3306 | 1.36 × 10⁻³ | 463.0887 | 7.61 | 464.0960 | bracteoside (7) | C22H22O12 | Centaurea bracteatassssss |
| P_1044 | 2.83 × 10⁻³ | 499.1235 | 8.46 | 498.1162 | elenoside (8) | C25H22O11 | Justicia hyssopifolia (no hits found from the f. Asteraceae) |
| N_3290 | 5.26 × 10⁻³ | 493.0991 | 7.72 | 494.1064 | 3-O-methylgossypetin 7-glucoside (9) ** | C22H22O13 | Artemisia fragrans |
| N_3285 | 1.06 × 10⁻² | 353.0880 | 8.34 | 354.0952 | 5-O-E-caffeoylquinic acid (10) | C16H18O9 | Cynara scolymus Cydonia oblonga, Aster scabe |
| P_845 | 1.50 × 10⁻² | 495.1133 | 7.76 | 494.1061 | 3,4′,5,6,7 pentahydroxy 3′-methoxyflavone (11) ** | C22H22O13 | Eupatorium tinifolium |
| P_716 | 4.06 × 10⁻² | 787.3694 | 12.56 | 786.3622 | N1,N5,N10,N14- tetra-trans-p-coumaroylspermine (12) | C46H50N4O8 | M. chamomilla |
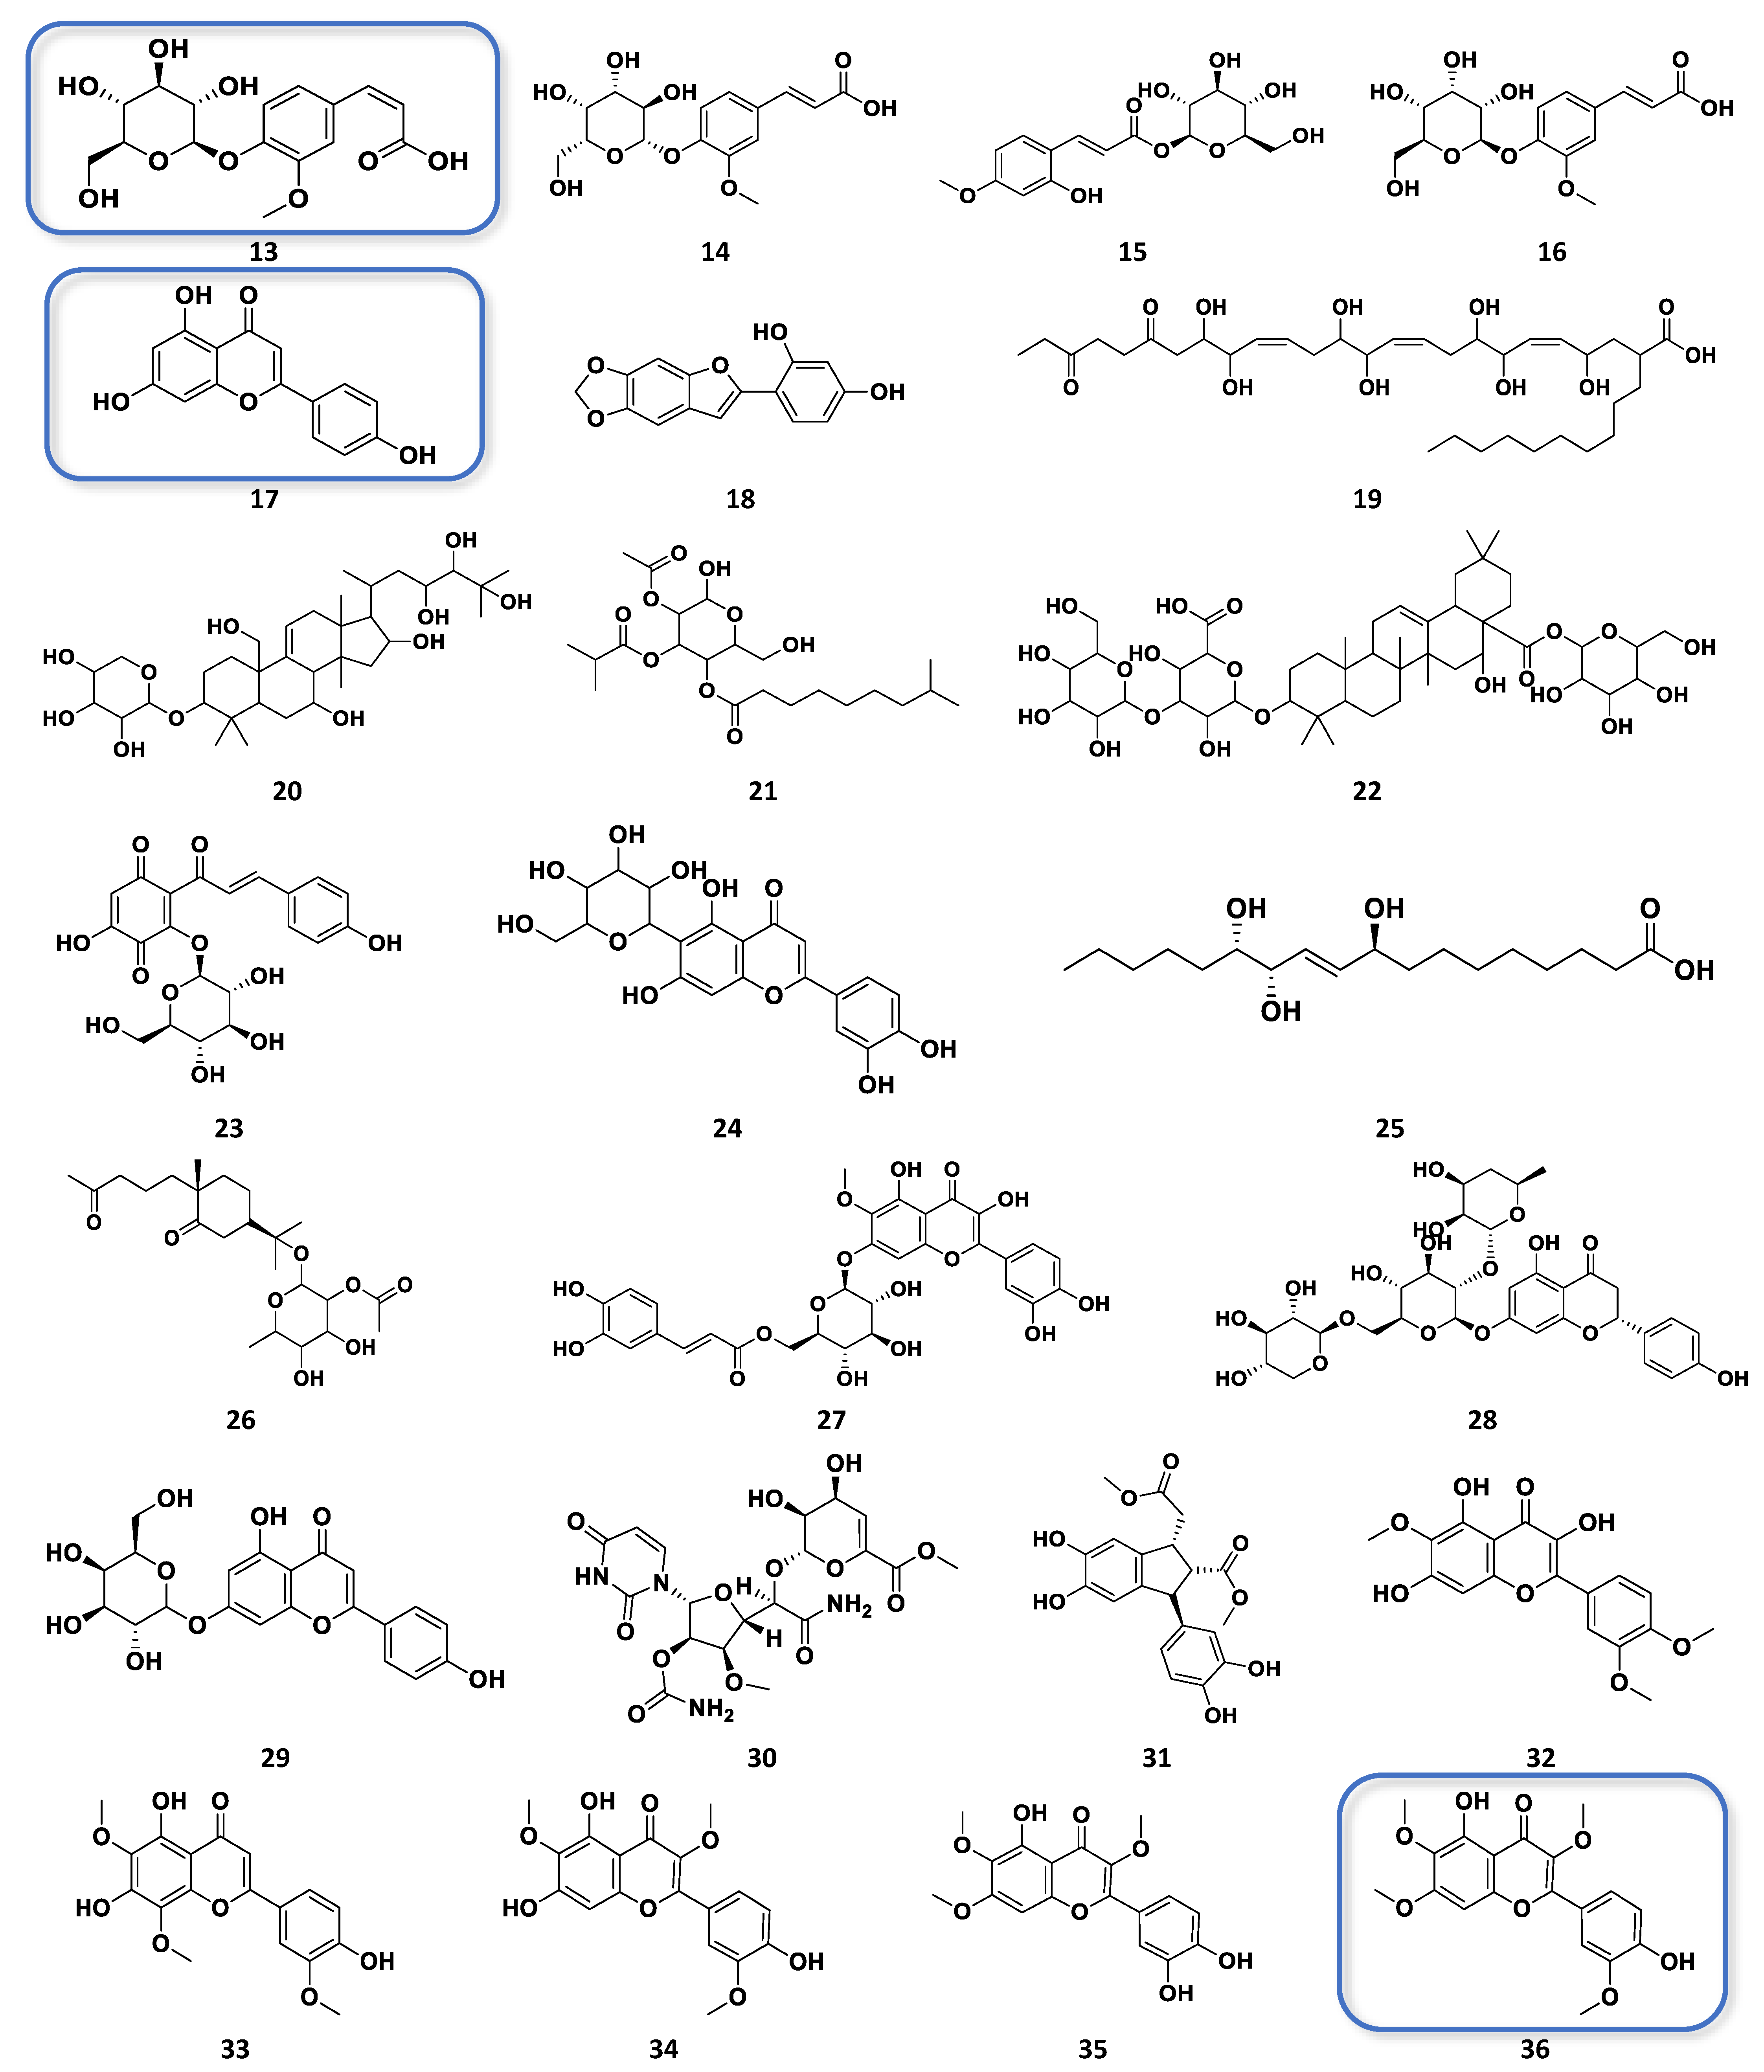
| Primary ID * | p-Value | m/z | Rt (min) | MW | Compound Hits | Molecular Formula | Source |
|---|---|---|---|---|---|---|---|
| N_5225 | 0.0020 | 355.1031 | 5.54 | 356.1104 | Z-glucoferulic acid/4′→1-O-feruloylglucose (13) | C16H20O9 | Equisetum arvense |
| 4′-O-β-d-galactopyranoside (14) | |||||||
| 2′-hydroxy, 4′-Me ether,1-O-p-coumaroyl glucose (15) | M. chamomilla | ||||||
| 4′-O-β-d-allopyranoside (16) | Cimicifuga dahurica C. heracleifolia | ||||||
| N_3180 | 0.0137 | 269.0452 | 12.55 | 270.0525 | apigenin (17) | C15H10O5 | wide range of plant spp. |
| 2-(2,4-dihydroxyphenyl)-5,6-methylene dioxybenzofuran (18) | Artemisia indica | ||||||
| N_11757 | 0.0144 | 655.4065 | 13.55 | 656.4137 | bractic acid (19) | C35H60O11 | Ajuga bracteosa |
| orbicoside (20) | Astragalus orbiculatus | ||||||
| N_2695 | 0.0145 | 785.3552 | 12.92 | 786.3625 | see Compound 12 | C46H50N4O8 | M. chamomilla |
| N_11748 | 0.0146 | 445.2447 | 13.37 | 446.2520 | 2-acetyl-3-O-(2-methylpropanoyl) β-d-glucose-4-O-(8-methylnonanoyl) (21) | C22H38O9 | Solanum aethiopsicum (only 2 hits) |
| N_9100 | 0.0146 | 515.1190 | 8.10 | 516.126 | see compound 2 | C25H24O12 | |
| N_11749 | 0.0165 | 971.4864 | 14.43 | 972.4937 | calendasaponin B (22) | C48H76O20 | Calendula officinalis |
| N_11744 | 0.0165 | 447.0921 | 7.68 | 448.0994 | carthamone (23) luteolin 6-C-glucoside (24) | C21H20O11 | Carthamus tinctorius Artemisia princeps |
| N_3234 | 0.0169 | 329.2329 | 12.89 | 330.2402 | pinellic acid (25) | C18H34O5 | Helianthus heterophyllus |
| N_11753 | 0.0188 | 441.2497 | 14.53 | 442.2570 | O-(2-O-acetyl-β-d-fucopyranoside)-11- hydroxy-4,5-secoeudesmane-4,5-dione (26) | C23H38O8 | Carthamus arborescens |
| N_5224 | 0.0202 | 655.1293 | 9.14 | 656.1366 | tinctoside (27) | C31H28O16 | Anthemis tinctoria |
| N_11652 | 0.0236 | 493.0977 | 7.79 | 494.1049 | see compounds 9 and 11 | C22H22O13 | |
| N_5231 | 0.0421 | 355.1026 | 7.23 | 356.1098 | see N_5225 | C16H20O9 | see N_5225 |
| N_5236 | 0.0515 | 463.0874 | 7.56 | 464.0947 | see compounds 5 and 6 | C21H20O12 | |
| N_5226 | 0.0653 | 711.2130 | 7.23 | 712.2203 | theaflavanoside II (28) | C32H40O18 | Camellia sinensis |
| N_3484 | 0.0670 | 353.0872 | 8.85 | 354.0944 | see Compound 9 | C16H18O9 | |
| N_4575 | 0.0772 | 515.1182 | 8.47 | 516.1255 | a structural isomer of N_9100 | C25H24O12 | |
| N_11743 | 0.0868 | 516.1220 | 8.29 | 517.1290 | No hits | - | - |
| N_2900 | 0.1009 | 431.0976 | 8.61 | 432.1049 | thalictiin (29) | C21H20O10 | Thalictrum thunbergia Chrysanthemum morifolium |
| N_5222 | 0.10510 | 1031.2400 | 8.35 | 1032.2500 | No hits | not predicted | - |
| N_14912 | 0.1085 | 515.1265 | 8.09 | 516.1338 | methyl ester of antibiotic a 503083f (30) | C19H24N4O13 | Streptomyces sp. SANK 62,799 (only 1 hit) |
| N_14913 | 0.1085 | 711.2250 | 7.23 | 712.2320 | No hits | not predicted | - |
| N_14914 | 0.1085 | 1031.2606 | 8.10 | 1032.2679 | [2M − H] of m/z 515.126 (N_9100) | - | |
| N_2089 | 0.1104 | 353.0930 | 8.48 | 354.0993 | No hits | not predicted | - |
| N_2649 | 0.1406 | 359.0772 | 13.57 | 360.0845 | 7,8′-cyclo-3′,4,4′,5-tetrahydroxy-2,7′-lignan-9,9′-dioic acid di-Me ester (31) 5,7-dihydroxy-3′,4′,6-trimethoxyflavonol (32) sudachitin (33) quercetagetin 3,3′,6-trimethyl ether (34) chrysosplenol D (35) | C18H16O8 | Helianthus annuus Arnica chamissonis Artemisia klotzchiana Centaurea hyssopifolia, Tanacetum parthenium from many Asteraceae |
| N_435 | 0.3460 | 373.0926 | 15.56 | 374.0999 | chrysosplenetin (36) | C19H18O8 | from many Asteraceae |
| Samples | Trend Line Equation | R2 | EC50 mg/mL | Mean ± SEM | n |
|---|---|---|---|---|---|
| F11 ChE | y = 15.466ln(x) + 68.738 | 0.9156 | 0.311 | 0.311 ± 2.21 × 10⁻⁵ | 3 |
| F12 ChE | y = 11.573ln(x) + 67.599 | 0.9249 | 0.165 | 0.165 ± 1.20 × 10⁻⁵ | 3 |
| F8 ChJ | y = 9.3158ln(x) + 74.126 | 0.9605 | 0.076 | 0.076 ± 2.61 × 10⁻⁵ | 3 |
| ascorbic acid | y = 10.592ln(x) + 70.222 | 0.9664 | 0.146 | 0.0146 ± 4.63 × 10⁻⁵ | 3 |
| quercetin | y = 16.534ln(x) + 104.2 | 0.9383 | 0.034 | 0.034 ± 4.60 × 10⁻⁴ | 3 |
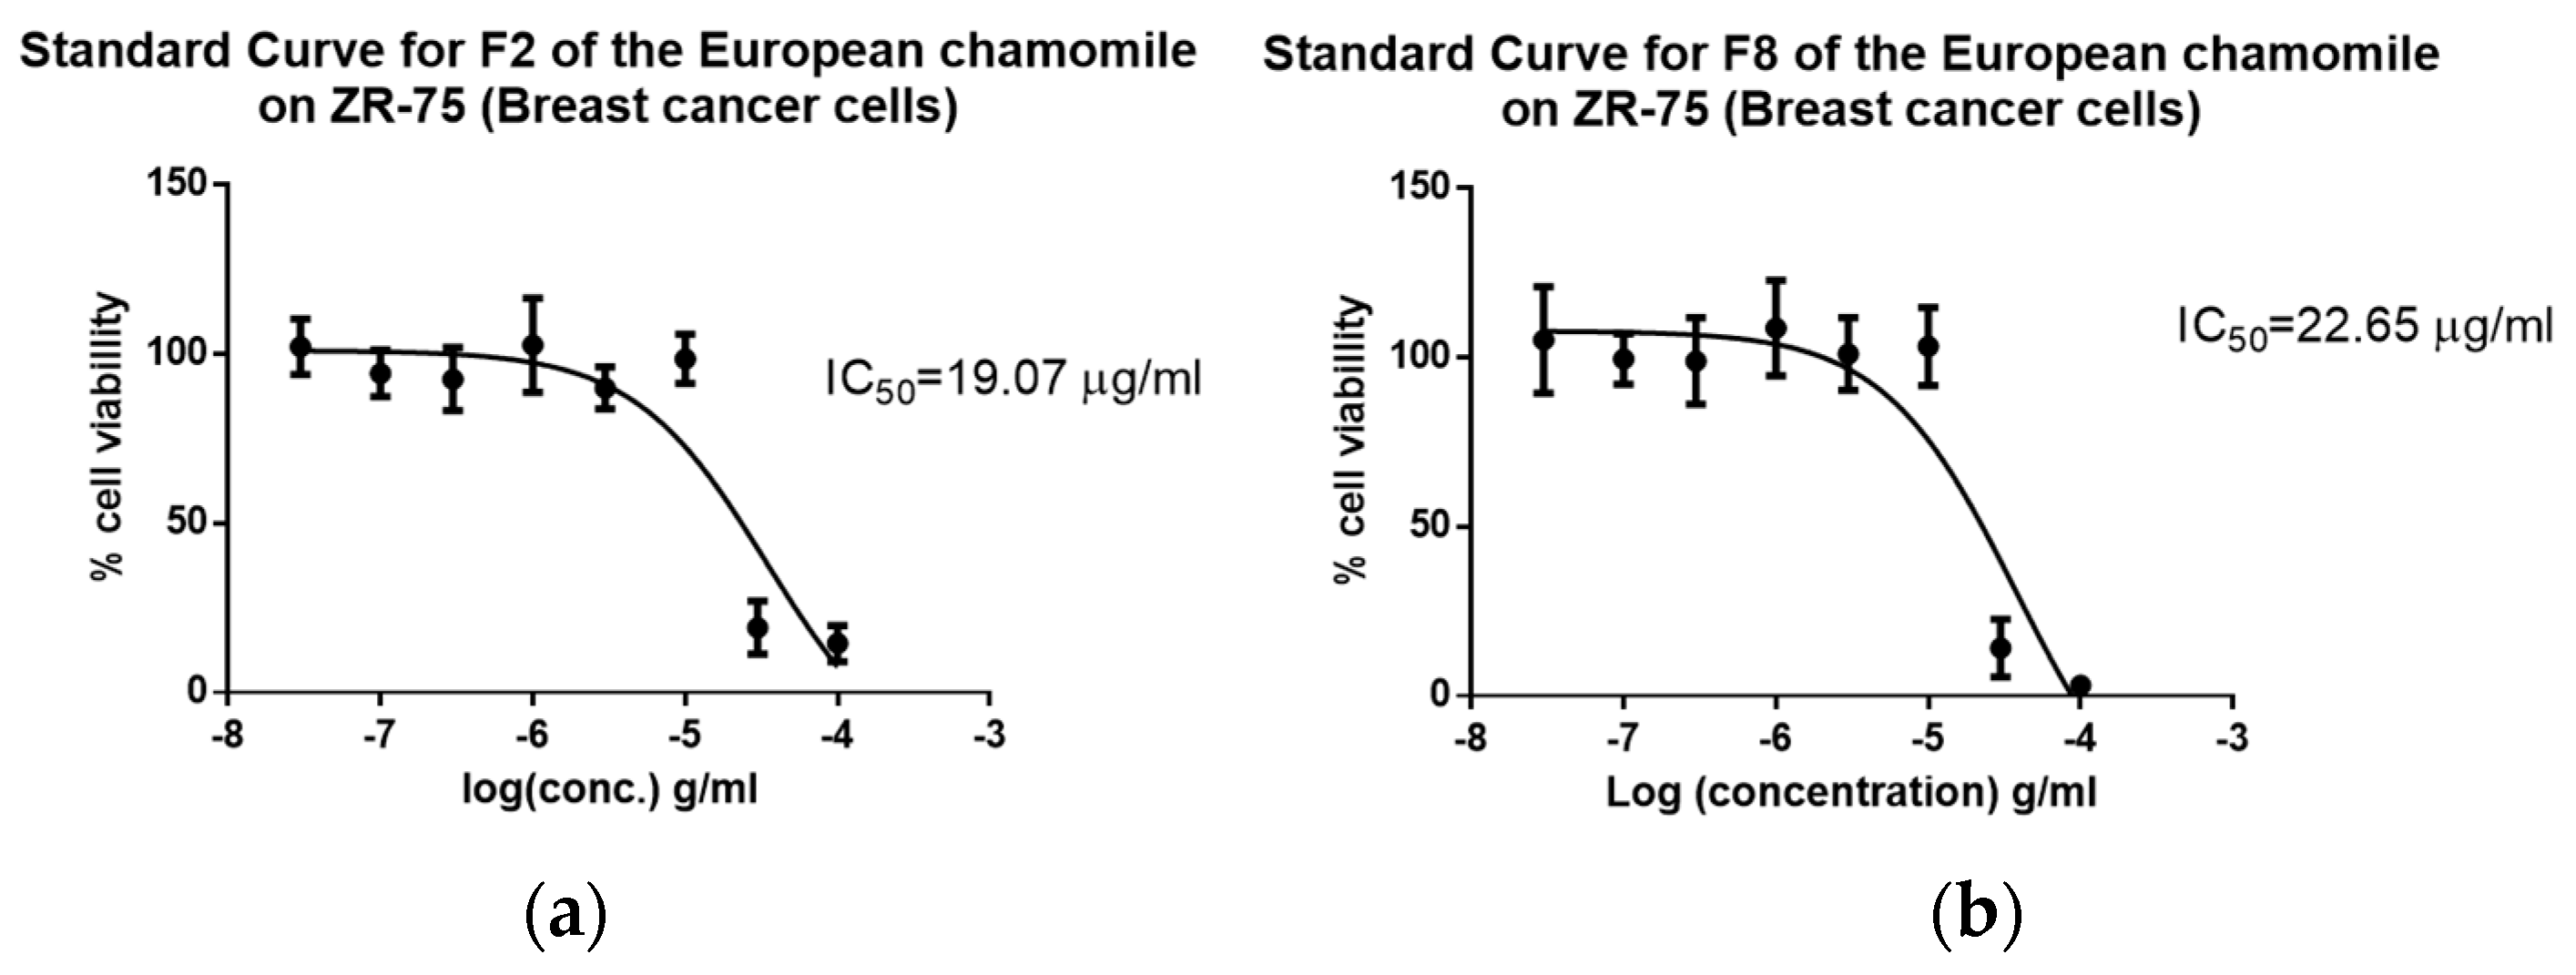
| Bioactive Fraction | IC50 ZR-75 (µg/mL) | IC50 HS-27 (µg/mL) | Toxicity | SI |
|---|---|---|---|---|
| F2-ChE (Mean ± SEM) | 21.07 (21.07 ± 5.31 × 10⁻⁶) | >100 (2.60 × 10⁻⁷) | Not toxic | >4.74 selective |
| F8-ChE (Mean ± SEM) | 22.65 (22.65 ± 6.30 × 10⁻⁶) | >100 (1.88 × 10⁻⁷) | Not toxic | >4.41 selective |
| Cell Line | Flask | 96 Well Plates |
|---|---|---|
| ZR-75 | 8 × 10³ | 1 × 10⁵ |
| HS-27 | 2 × 10⁴ | 1 × 10⁵ |
Disclaimer/Publisher’s Note: The statements, opinions and data contained in all publications are solely those of the individual author(s) and contributor(s) and not of MDPI and/or the editor(s). MDPI and/or the editor(s) disclaim responsibility for any injury to people or property resulting from any ideas, methods, instructions or products referred to in the content. |
© 2023 by the authors. Licensee MDPI, Basel, Switzerland. This article is an open access article distributed under the terms and conditions of the Creative Commons Attribution (CC BY) license (https://creativecommons.org/licenses/by/4.0/).
Share and Cite
Atoum, D.; Fernandez-Pastor, I.; Young, L.; Edrada-Ebel, R. Use of Multivariate Analysis to Unravel the Differences between Two Chamomile Varieties and Their Anticancer and Antioxidant Activities. Plants 2023, 12, 2297. https://doi.org/10.3390/plants12122297
Atoum D, Fernandez-Pastor I, Young L, Edrada-Ebel R. Use of Multivariate Analysis to Unravel the Differences between Two Chamomile Varieties and Their Anticancer and Antioxidant Activities. Plants. 2023; 12(12):2297. https://doi.org/10.3390/plants12122297
Chicago/Turabian StyleAtoum, Dana, Ignacio Fernandez-Pastor, Louise Young, and RuAngelie Edrada-Ebel. 2023. "Use of Multivariate Analysis to Unravel the Differences between Two Chamomile Varieties and Their Anticancer and Antioxidant Activities" Plants 12, no. 12: 2297. https://doi.org/10.3390/plants12122297