Abstract
It is of agronomic importance to apply nitrogen (N), but it has high environmental risks in reclaimed saline soils. Therefore, we should apply N fertilizer at an appropriate rate to increase crop yield but decrease N losses. In this soil column experiment, rice yield, N uptake, and ammonia (NH3) and nitrous oxide (N2O) losses were measured in four treatments with no N application (control) and with N applications of 160, 200, and 240 kg/ha (N160, N200, and N240, respectively). The results show that grain yield, spike number, and thousand-kernel weight increased with increases in N application rate, but there was no significant difference in grain yield between N200 and N240. However, the kernels per spike increased first and then decreased with the increase in N application, of which N200 was recorded to have the highest kernels per spike value, which was 16.8 and 9.8% higher than those of N160 and N240, respectively. Total NH3 volatilization of the rice season increased with increasing N input, especially during the first and second supplementary fertilization stages. The NH4+-N concentration of overlying water was relatively lower under the N200 treatment in these two stages, and the yield-scaled NH3 volatilization and the emission factor were the lowest in N200, which were 26.2–27.8% and 4.0–21.0% lower than those of N160 and N240, respectively. Among the three N-applied treatments, N2O losses and the emission factor as well as the yield-scaled N2O emissions were the lowest under the N200 treatment, which had 34.7% and 78.9% lower N2O emissions and 57.8% and 83.5% lower emission factors than those of the N160 and N240 treatments, respectively. Moreover, the gene copies of AOA and AOB amoA, nirS, and nirK in cultivated layer soils all reached the minimum under the N200 treatment. According to the comprehensive effects of N fertilizer on rice grain yield and NH3 and N2O losses, we recommend applying 200 kg/ha to reclaimed saline soil to ensure crop yield and reduce N losses.
1. Introduction
In recent years, China’s cultivated land has been declining, with 0.01% of cultivated land being destroyed every year. It is estimated that China’s per capita cultivated land area will decrease to less than 0.08 ha between 2010 and 2030, which will become a significant challenge for sustainable development and food security [1,2]. Although China attaches great importance to cultivated land protection, the quantity and quality of cultivated land are still declining, and the conflict between population and cultivated land resources is becoming increasingly significant [3]. Therefore, there is an urgent need to develop and utilize other land resources to improve the current situation of cultivated land reduction. Saline soil is an important reserve land resource in grain production, and more than 800 million hectares of cultivated land around the world are affected by salinization. In China, saline land accounts for 25% of the land, and these land resources have not been fully developed and expanded [4,5]. Therefore, rational utilization of saline soil resources is of great significance. It is well known that the soil nutrients of reclaimed saline soil are generally poor, and nitrogen (N) is the nutrient that limits the yield and is the most difficult to manage in the crop system of saline soil. Hence, it is necessary to increase the N nutrient content in the processes of developing and utilizing saline soil [6]. However, excessive N application is common in farmland management and food production, and a large amount of N loss causes a series of severe environmental problems, such as water pollution, intensified ammonia (NH3) volatilization, and increased nitrous oxide (N2O) emissions [7,8,9]. Thus, it is especially necessary to consider the rational application of N fertilizer in the processes of cultivation and crop planting in reclaimed saline soil [10].
Saline–alkaline soil is not suitable for farming because of its low fertility and high salt content, which results in the national food security strategy of “ask for grains from saline-alkaline land” requiring more effort [11]. Rice is one of the stable crops that can survive in saline soil, and its planation could help to improve saline soil fertility [12]. It is well known that gaseous N losses, such as N2O emissions and NH3 volatilization, have been the main forms of N losses in rice paddy fields [13]. In recent years, the area of rice planting in saline soil has gradually increased, and the study on yield and N losses in the process of rice planting in saline soil has also increased. Bao et al. (2019) conducted experiments on four kinds of salt-tolerant rice under different N application rates. The results showed that reasonable application of N in saline soils was beneficial to increasing the spike number and kernels per spike, and the yield of the four kinds of rice reached the maximum when the N application rate was 150 kg/ha [14]. With the increase in the N application rate, the chlorophyll content of rice also increased, and the maintenance time of the green leaf area was longer, which was conducive to rice photosynthesis and dry matter accumulation, thus improving grain yield [15]. However, Qiu et al. (2022) found that the application of N is the main factor that caused a significant increase in NH3 volatilization [16]. Urea hydrolyzes quickly in paddy fields, and NH4+-N concentration of the overlying water is highly consistent with the NH3 volatilization rate [17]. In a rice field experiment, Kim et al. (2021) showed that N2O emissions increased significantly with an increase in the N application rate [18]. In addition, in the saline soil area of Songnen plain, China, N application significantly promoted N2O emissions, which increased with the increase in the N application rate and reached the maximum when the N application rate was 250 kg/ha [19]. In alkaline soil, ammonia-oxidizing bacteria (AOB) play a dominant role in nitrification, but AOB do not contain N2O reductase, which may lead to an increase in N2O emissions under a high N input condition [20,21]. Liu et al. (2010) found that a lack of N fertilizer may reduce soil nitrate N (NO3−-N) and nitrite N contents, resulting in a lack of substrates for nirK and nirS denitrification microorganisms, and that a reduction in nirK and nirS gene abundance may also decrease N2O emissions [22].
In summary, there have been many studies on the effects of N application rate on the rice-production system in saline soil, but few studies have comprehensively considered the responses of rice yield, N uptake, and environmental losses based on different N application rates in saline soils. Therefore, a soil column experiment was conducted to comprehensively evaluate the effects of three N inputs on rice yield, NH3 volatilization, and N2O emissions, which could help to explore an optimal N application rate for rice production in saline soil. Under the optimal N input condition, we can save production costs while ensuring crop yield and reducing environmental N losses.
2. Results
2.1. Rice Growth, Yield, and the Related Agronomic Traits
Compared with the control, N addition significantly (p < 0.05) increased the plant height, Soil Plant Development Analysis (SPAD), and Normalized Difference Vegetative Index (NDVI) at the tillering stage (Figure 1). At the earing stage, the plant height, leaf SPAD, and NDVI of rice increased with the increase in the N application rate, but there was no significant difference between the N200 and N240 treatments. At maturation stage, rice leaf SPAD in the N160 treatment was significantly (p < 0.05) lower than that in the control treatment. Nevertheless, rice plant height, leaf SPAD, and NDVI in the N200 and N240 treatments were higher than those in the control treatment, but there was no significant difference between the N160 and N240 treatments (Figure 1).
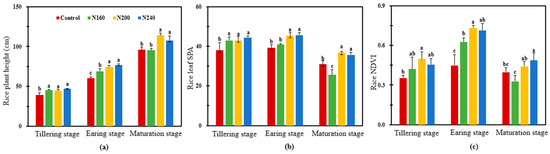
Figure 1.
Response of the plant height (a), SPAD (b), and NDVI (c) of rice grown in saline soil to different N application rates. Bars refer to the SD of the mean value (n = 3). Different letters above the same column indicate statistically significant differences between treatments, according to Duncan’s post hoc test at the level of p < 0.05.
More N application resulted in significantly (p < 0.05) higher rice straw biomass, of which N200 significantly (p < 0.05) enhanced the rice grain yield by 61.3% over N160. However, the grain yield did not further increase when the N application rate continued to increase to 240 kg/ha, which might have been a result of its significantly (p < 0.05) lower harvest index than that of N160 and N200 (Table 1).

Table 1.
Rice straw biomass, grain yield, and the related agronomic traits of rice grown in saline soil received with different N inputs.
With the increase in the N application rate from 0 to 240 kg/ha, the spike number continuously significantly (p < 0.05) increased, but the kernels per spike increased first and then decreased, and reached the maximum under the N200 treatment, which was 36.3% and 9.8% higher than that in the control and N240 treatments, respectively. The thousand-kernel weight was slightly higher under the N200 and N240 treatments (Table 1).
2.2. N Content and Uptake of Rice Straw and Grain
The N content of rice straw increased with the increase in the N application rates, and the N content in the N200 and N240 treatments significantly (p < 0.05) increased by 53.5% and 62.6%, respectively, compared with the control (Table 2). However, the N content of grain increased first and then decreased with the increase in N inputs and reached the maximum in the N200 treatment, which was 11.0% and 6.0% (p < 0.05) higher than that in the N160 and N240 treatments, respectively. Generally, rice straw, grain, and their total N uptake increased with the increase in the N application rates. For the three N-added treatments, the N uptakes by rice straw and grain in N200 and N240 were on average 2.8- and 1.8-fold, respectively, that in N160. Consequently, total N uptake by rice plants in N200 and N240 was 1.9- and 2.3-fold that in N160 (Table 2).
Table 2.
N content and uptake of rice straw and grain grown in saline soils with different N application rates.
2.3. NH3 Volatilization
With the increase in the N application rates, NH3 volatilization from rice paddies at the observations during the basal (BF) and first supplementary fertilizations (SF1) of N increased continuously, a pattern that was not observed after the second supplementary fertilization (SF2) (Table 3). Overall, the NH3 volatilization at the BF and SF2 observations was less than that at the SF1 observation. It was noted that a larger NH3 volatilization in the N240 treatment in the BF was recorded, which was 1.9 and 1.2 times higher than that of the N160 and N200 treatments, respectively. More N input resulted in higher total NH3 volatilization of the rice-growth cycle. In particular, the total NH3 volatilization was 17.1–68.6% (p < 0.05) higher in the N240 than in the N160 and N200 treatments, respectively. Under the three N-amended treatments, N200 had the lowest emission factor and yield-scaled NH3 volatilization, which were 27.8% and 26.1% (p < 0.05) lower than those in N160 and N240, respectively (Table 3).
Table 3.
NH3 volatilization, emission factors, and yield-scaled NH3 volatilization in the rice-growth cycle from saline soil with varied N inputs.
2.4. Dynamics of pH, NH4+-N, and NO3−-N in Overlying Water
2.4.1. pH
The pH of the overlying water showed an overall trend, first increasing and then decreasing. After the third day of BF, the pH of the overlying water in N200 was always higher than that of the other treatments, with a maximum value of 8.9 (Figure 2a). The pH of the overlying water in N200 had the highest value throughout the BF, with an average increase of 0.34 and 0.24 units compared to N160 and N240, respectively. The pH of the overlying water did not change significantly during the SF1 observation, but the highest pH value was also recorded in N200, whereas the pH was always lower in the N240 treatment than in other treatments. The pH in the N application treatments dropped sharply on the second day after SF2 and then gradually fluctuated downwards. It was at its highest in the N160 treatment. The pH varied from 7.12 to 7.77 in the N200 treatment during SF2, which was higher than the range of variation in the other treatments. The overlying water pH was lower in the N200 treatments than in the other treatments after day 3 during SF2 (Figure 2c).
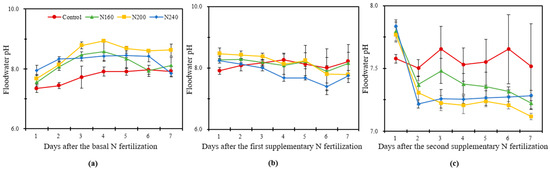
Figure 2.
The variation in pH of the overlying water within one week after the basal N fertilization (a), first supplementary fertilization (b) and second supplementary fertilization (c) in saline soil with different N application rates. Bars refer to the SD of the mean value (n = 3).
2.4.2. Ammonium N in Overlying Water
As can be seen from Figure 3, the ammonium N (NH4+-N) concentration was significantly (p < 0.05) higher in the N-applied treatments than in the control treatment in the overlying water and showed an overall increasing trend followed by a decreasing trend thereafter. During BF, the NH4+-N concentration increased immediately and then decreased in the overlying water, with the NH4+-N concentration in the N160 and N240 treatments reaching the peak on the second day of fertilizer application; however, the peak was found on the fourth day in the N200 treatment. Compared with other treatments, the NH4+-N concentration in the overlying water was the highest in the N240 treatment during the first three days after N fertilizer application, whereas the NH4+-N concentration was always higher in the N200 treatment than in the other treatments after the fourth day of N fertilizer application. The average NH4+-N concentration was 44% and 7% higher in the N200 treatment than in the N160 and N240 treatments, respectively, during BF (Figure 3a). The NH4+-N concentration in the overlying water showed a consistently decreasing trend during SF1 and SF2. In SF1, the NH4+-N concentration in the overlying water decreased obviously from the first to the fourth days after fertilization and then decreased slowly (Figure 3b). In SF2, the NH4+-N concentration in the overlying water decreased sharply on the second day and then stabilized, gradually approaching almost 0 mg/L (Figure 3c). The highest NH4+-N concentrations in the SF1 and SF2 observations were both recorded in the N240 and N160 treatments, whereas the lowest NH4+-N concentration in SF2 was in the N200 treatment.
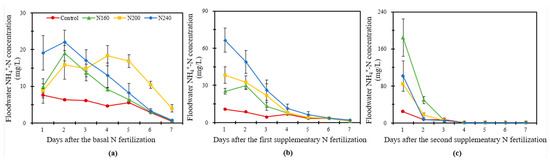
Figure 3.
The variation in the NH4+-N concentration of the overlying water within one week after the basal N fertilization (a), first supplementary fertilization (b) and second supplementary fertilization (c) in saline soil with three N application rates. Bars refer to the SD of the mean value (n = 3).
2.4.3. NO3−-N in Overlying Water
Figure 4 shows that the NO3−-N concentration in the overlying water was generally low and that the overall range in variation was relatively small. In BF, the NO3−-N concentration in the overlying water increased in the N200 and N240 treatments but decreased in the N160 treatment with time. The N240 treatment had the highest value of average NO3−-N concentration (Figure 4a). The NO3−-N concentration of each treatment had no significant change in SF1 and showed a trend of first increasing and then decreasing (Figure 4b). The peaks in the N160 and N240 treatments were reached on the fourth day, whereas that of the N200 treatment was reached on the fifth day. The NO3−-N concentrations were always higher in the N200 and N240 treatments than the N160 treatment. The NO3−-N concentration was higher in the N200 treatment than in the other treatments after the fourth day. The NO3−-N concentration in the overlying water increased sharply on the seventh day of fertilization in SF2 (Figure 4c). In the first six days, no significant change was found in the N160 treatment and a weak peak appeared on the fourth day, whereas the NO3−-N concentration in the N200 and N240 treatments increased first and then decreased, and the peak appeared on the second day of fertilization. At the SF2 observation, the average NO3−-N concentrations were 53% and 87% higher in the N200 and N240 treatments, respectively, than in the N160 treatments.
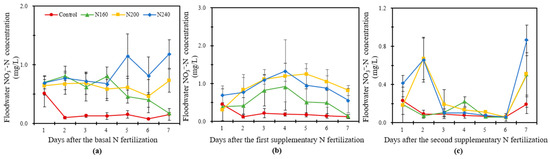
Figure 4.
The variation in the NO3−-N concentration in the overlying water within one week after the basal N fertilization (a), first supplementary fertilization (b) and second supplementary fertilization (c) in saline soil with different N application rates. Bars refer to the SD of the mean value (n = 3).
2.5. N2O Emissions
Total N2O emissions, emission factors, and the yield-scaled N2O emissions all decreased first and then increased with increasing N application (Figure 5). We found that N200 treatment had the lowest total N2O emissions, emission factor, and yield-scaled N2O emissions. The total N2O emissions were higher under all N applications than under the control, but total N2O emissions were 34.7% and 78.9% significantly (p < 0.05) lower in the N200 treatment than the N160 and N240 treatments, respectively (Figure 5a). Meanwhile, N2O emissions were significantly (p < 0.05) lower in the N200 treatment by 57.8% and 83.5%compared to the N160 and N240 treatments, respectively (Figure 5b). The yield-scaled N2O emissions of N200 was similar to that of the control, but was 59.5% and 78.3% significantly (p < 0.05) lower than that of N160 and N240, respectively (Figure 5c).
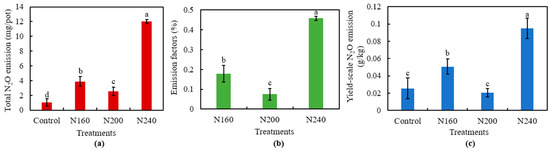
Figure 5.
Total N2O emissions (a), emission factor (b), and the yield-scaled N2O emissions (c) from saline soil with different N application rates. Bars refer to the SD of the mean value (n = 3). Different letters above the same column indicate statistically significant differences between treatments, according to Duncan’s post hoc test at the level of p < 0.05.
2.6. Soil pH, NH4+-N, and NO3−-N Content and N Cycling-Related Functional Gene Copies
Cultivated layer soils had different pHs at the BF, SF1, and SF2 observations (Figure 6a). Overall, there was no difference in soil pH among the treatments with different N inputs. Only the soil in N240 had significantly (p < 0.05) higher and lower pHs than those in the other treatments at BF and SF2, respectively. After BF, no change was observed regarding the surface soil NH4+-N content (Figure 6b). In SF1, the NH4+-N concentration in the surface soil varied greatly and increased with the increase in N application. In particular, the NH4+-N content in the surface soil of N240 was 2.4-fold that in the control. The NH4+-N concentration in the cultivated layer soil decreased first and then increased with the increase in the N application rate in SF2. Although the difference in the surface soil NH4+-N concentration among the N-added treatments was not significant, the NH4+-N content of the N160 soil was 70.1% significantly (p < 0.05) higher than that of the control. In comparison to the control, no change in surface soil NO3−-N was found in the three N-added treatments in either the SF1 or the SF2 case (Figure 6c). However, at BF, the surface soil from N200 had significantly (p < 0.05) 14.2% higher NO3−-N than that from N160. In addition, we found that NO3−-N concentration at each fertilizer stage was the highest in the N200 treatment, and the average NO3−-N concentration was 26.7% and 12.5% higher in the N200 treatment than in the N160 and N240 treatments, respectively, during the whole growth process of rice.
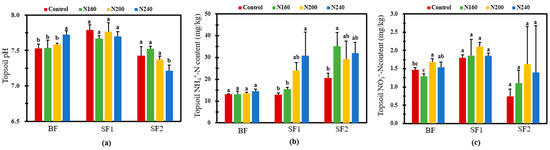
Figure 6.
Soil pH (a), NH4+-N (b), and NO3—N (c) concentrations after the three stages of fertilization for one week in the rice-growth season with different N application rates. Bars refer to the SD of the mean value (n = 3). Different letters above same column indicate statistically significant differences between treatments, according to Duncan’s post hoc test at the level of p < 0.05.
The AOA amoA gene copies were decreased due to the N application (Table 4). In addition, two high N inputs (N200 and N240) resulted in 51.1–62.5% (p < 0.05) lower AOA amoA gene copies than the low N input (N160). Compared with the control, AOB amoA gene copies were increased significantly (p < 0.05) in N160, which was 9.0- and 2.3-fold that in N200 and N240, respectively. The N applications at 160 and 200 kg/ha significantly (p < 0.05) reduced the copies of the nirK gene by 30.4% and 50.7%, respectively, compared with the control. When the N application rate further increased to 240 kg/ha, no change was found when compared to the control. Low N inputs with 160–200 kg/ha exerted no influence on the nirS and nosZ gene copies. However, they increased dramatically when 240 kg/ha N was applied to the saline soil. That is, the nirS and nosZ gene copies under N240 were 3.3–4.8- and 3.9–5.2-fold those under the other three experimental treatments.
Table 4.
The soil N cycling-related functional gene copies in saline soil collected at one week after SF2 applied in the rice-growth season with different N inputs.
3. Discussion
3.1. Effect of Different N Inputs on Rice Yield and N Uptake
Nitrogen is an important limiting factor for crop yield. Different N inputs have different effects on rice yield and yield components [15,23]. Guo et al. (2021) conducted an experiment on the sodic saline–alkaline soils in the western Songnen plain and found that there was no parabolic relationship between rice yield and N application, which reached the peak when the N application rate was 150 kg/ha [24]. The results of the present experiment show that rice yield continued to increase with the increase in the N application rate, which could be attributed to the saline soil used in this experiment having very poor soil fertility. The soil they used only had 9 g/kg organic matter content, far less than the organic matter content (36.2 and 34.6 g/kg) in Guo’s experiment and even lower than the average topsoil organic matter content of Chinese farmland soil (24.82 g/kg) [24,25]. Thus, a higher N application rate is needed to meet the demands of crop growth [26]. Nevertheless, there was no significant difference in rice grain yield between N200 and N240 in the current experiment, and when the N application rate reached 200 kg/ha, a continued increasing N application rate had no significant yield-increase effect. Sui et al. (2013) pointed out that the increased number of effective spikes, kernels per spike, and grain weight contributed the improved rice grain yield [27]. According to the data of rice yield components in the current study, increasing N fertilizer could increase the spike number and kernels per spike and therefore improve the yield. In particular, the kernels per spike reached the highest value of 137.4 under the N200 treatment. The rice SPAD was significantly (p < 0.05) higher in the N200 and N240 treatments than in the N160 treatment at the earing stage and the maturation stage (Table 1). The SPAD of rice leaves increased with the increasing N application rate and higher chlorophyll content was an important factor for high rice yield, which is consistent with the results of a split area test on saline–alkali meadow soil by Meng et al. (2022) [28,29,30]. This could be one of the reasons why the increased rice grain yield under saline soils received 200 and 240 kg/ha N. However, the plant height, SPAD, and NDVI of rice in N160 were lower, and the SPAD and NDVI in particular were even lower than the control at the earing stage. Therefore, excessive N reduction would threaten rice growth and lead to a yield decline.
The N uptake by rice was related to the N application rates, and N use efficiency generally decreased with an increase in the N application rate in sodic saline–alkaline rice paddies [24,31]. Our results show that with the increase in the N application rates, N uptake by rice shoot biomass increased and the N use efficiency of rice straw increased. However, the N use efficiency of grain increased first and then decreased, reaching the peak in the N200 treatment. The field experiment on sodic saline–alkali soil at Songnen plain by Lv et al. (2021) showed that the growth rate of stems was higher under low N treatment than that under high N treatment, which is significant for improving the dry matter of stems and prevent lodging at a low N level [31]. In other words, lodging maybe cause the loss of biomass at a high N level. This helps to explain the higher rice N use efficiency of N200 in comparison with N240. In addition, excessive N application increased nutrient reserves in vegetative organs [32] and increased the N proportion in straw but in turn reduced the grain N use efficiency. According to data in Table 1 and Table 2, the rice grain yield was similar between the N240 and N200 treatments, but the straw biomass was significantly (p < 0.05) higher in the N240 treatment compared to the N200 treatment, and the rice harvest index decreased, leading to a decrease in grain N use efficiency.
Soil NO3−-N content is an important determinant of the N application rate and increased with the increase in the N application rate [33,34]. After N reduction, soil NO3−-N content and N loss decreases and N use efficiency increases. In this experiment, the NO3−-N content in each fertilizer stage increased first and then decreased with the increase in the N application rate and reached the maximum at 200 kg/ha, which is inconsistent with the results of most previous studies that were conducted in non-saline soils [33,34]. The reason could be that the relatively low N application rate in saline soil is not enough to support the normal growth of plants, which leads to a decrease in NO3−-N reductase activity in plants and an increase in NO3−-N accumulation [35]. Therefore, the residual NO3−-N in soil also increases after crop harvest, which may lead to higher soil NO3−-N content in N200 than in N240. In addition, based on the results from a pot simulation trial under different soil salinity, Min et al. (2012) reached a similar conclusion that soil NO3−-N content was the highest at the medium N level, followed by a high N level [36]. However, there was no significant difference in NO3−-N content between the N240 and N200 treatments in this experiment. Therefore, comprehensively considering the grain yield, N uptake, and use efficiency of the crop, the optimal recommended N application rate is 200 kg/ha in saline soil according to the current work.
3.2. Effect of N Application at Varied Rates on NH3 Volatilization from Saline Soil
Soil NH3 volatilization in paddy fields increased linearly with the increase in the N application rate. Furthermore, in saline soil with elevating salinity, suppressed urea hydrolysis, nitrification, and soil NH4+-N adsorption capacity could promote NH3 volatilization [37,38]. The present results show that the total NH3 volatilization increased with the increase in the N application rate during the whole rice-growth cycle. Similar NH3 volatilization patterns were observed in rice cultivation under slightly and moderately salt-affected soil [39]. However, in actual production, excessive N reduction in order to reduce NH3 volatilization may result in decreased crop production. Therefore, NH3 volatilization and crop yield should be considered of equal importance, so the yield-scaled NH3 volatilization is of more practical significance [40]. However, unlike in non-saline agricultural soil, there are few studies on the yield-scaled NH3 volatilization of rice production in saline–alkali soil [41]. In this study, the yield-scaled NH3 volatilization decreased first and then increased with the increase in the N application rate, and the lowest value was found in the N200 treatment.
In terms of the fertilization stage, NH3 volatilization during SF1 accounted for a higher proportion under the different N application rates than that during BF and SF2 in this experiment. The temperature recorded at SF1 was relatively higher and the activity of urease was enhanced, which promoted urea hydrolysis and intensified NH3 volatilization [42]. Therefore, reducing NH3 volatilization in SF1 is key to reducing the total NH3 volatilization. In our experiment, the NH3 volatilization ratio in SF1 was at the maximum in the N200 and N240 treatments. This is consistent with the laboratory simulation test results of Li (2017), which indicated that the maximum NH3 volatilization ratio of rice in saline–alkali soil was in SF1 with an N application rate of 75–300 kg/ha [43]. As for other two stages, the NH3 volatilization load during BF under the N240 treatment was higher than during SF2, which is similar to the experiment conducted by Wang et al. (2012) in non-saline soil [44]. This may be due to the sparse growth of rice in BF and a root system that was insufficient for absorbing N, resulting in a greater loss of NH3 volatilization, whereas the growth of rice in SF2 was vigorous, and the rice plants directly blocked gas flow and reduced NH3 volatilization [45,46].
The pH and NH4+-N in the overlying water of paddies are important indicators to regulate N migration and transformation in saline–alkali paddy ecosystems [47]. From the perspective of the whole rice-growth cycle, the dynamic pattern of pH and NH4+-N in the overlying water was similar, which increased first and then decreased. The NH3 volatilization boosted with the increase in pH in the overlying water, an effect that was more significant for the BF observation [48]. For the three N application rates, the N200 treatment recorded the highest pH values in the BF and SF1 phases, but the highest NH3 volatilization was found in the N240 treatment. This may be due to NH4+ itself tending to transform in the direction of NH3 in saline soil with a high pH, resulting in a different variation trend of pH and NH3 volatilization in overlying water [49]. Reducing the concentration of NH4+-N in the overlying water is a key approach to reducing the NH3 volatilization [50]. Wang et al. (2023) found that the NH4+-N concentration in the overlying water was significantly positively correlated with NH3 volatilization in saline–alkali paddy fields [47]. In the current experiment, NH3 volatilization in SF1 accounted for a relatively large proportion, and the concentration of NH4+-N in the overlying water in SF1 was higher in N240 than in other N-applied treatments, which confirms the results of previous studies.
3.3. Effect of Different N Applications on N2O Emissions
Nitrification and denitrification processes with the participation of soil microorganisms produced the N2O. The application of N fertilizer can significantly increase NH4+-N and NO3−-N concentration in soil, which could enhance the nitrification and denitrification capacities and consequently promote soil N2O emissions [51,52,53]. In saline soils, the imbalance of salinity inhibition on nitrite (NO2−-N) oxidation and NH3 oxidation leads to the accumulation of NO2−-N in soil, which leads to an increase in N2O emissions. In addition, compared with non-salt soil, the decrease in microbial respiration in saline–alkali soil also reduces the oxygen consumption in the overlying water and/or surface layer soil and increases the dissolved oxygen, which inhibits the synthesis of N2O reductase and reduces the abundance of the nosZ gene, further leading to an increase in N2O emissions [38,54,55,56]. A previous study has shown that application of urea significantly promoted cumulative N2O emissions in saline–alkali soil [47]. In this experiment, the N2O emissions did not continuously increase with the increase in the N application rate and reached the minimum when the N application rate was 200 kg/ha. The change in soil pH affects denitrification enzyme activity, which then affects N2O emissions. With the increase in the soil pH, the activity of soil N2O reductase also increases [57]. The soil pH of the N240 treatment was lower than that of the N200 treatment in SF1 and SF2 in this experiment, which led to low N2O reductase activity and may be a reason why N2O emissions in the N240 treatment were higher than those in the N200 treatment. Similarly, Jia et al. (2020) reported that N2O emissions were nonlinearly related to the N application rate under salt stress [58].
Nitrogen application affected the soil pH and the abundance of the N cycle functional gene, such as the nitrification process of functional genes AOA and AOB amoA and the denitrification process of functional genes nirK, nirS, and nosZ [59]. Our results show that the gene copies of AOA amoA, AOB amoA, nirS, and nirK in soil decreased first and then increased with the increase in the N application rate one week after SF2 (Table 4), which is similar to the changes in N2O emissions, and all reached the lowest point in the N200 treatment. However, the nosZ gene copies increased with the increase in the N application rate, which is different from the change trend of N2O emissions. Ammonia oxidation to NO2−-N is the ring-limiting step of nitrification, so the control of microorganisms (AOA and AOB) in this process is an important measure to control N2O emissions [60]. In the current study, the AOA and AOB amoA gene copies under the N200 treatment were the lowest, resulting in the lowest N2O emissions. Shi et al. (2019) also proved that AOB is the main contributor to N2O emissions through experiments on saline–alkali soil [61]. The symbolic process of denitrification is the reduction of NO2−-N to NO, which is mainly completed by the nitrite reductase nirK and nirS genes [62], which may be the reason why N2O emissions are correlated with an abundance of nirK and nirS genes. Pan et al. (2023) pointed out that the increase in urea significantly increased the denitrification rate and slowed down the decrease in nirK gene abundance due to saline–alkali treatment but had no significant effect on nirS gene abundance [63], which is similar to the results of this study. The nirK gene abundance in the N240 treatment was higher than that in the N200 treatment, whereas there was no difference in the nirS gene abundance between the N160 and N200 treatments. The increased ratio of (nirK + nirS)/nosZ in the saline soil environment indicates that the ratio of the final N2O/(N2O + N2) product increased, and thus the genetic potential of N2O emission was improved [64]. The (nirK + nirS)/nosZ ratio in the N200 treatment was the lowest in this experiment, which may have led to it having the lowest N2O emissions.
4. Materials and Methods
4.1. Experiment Setup
4.1.1. Soil Properties
The paddy soil column simulation test was carried out in a greenhouse of Jiangsu Academy of Agricultural Sciences (32°08′ N, 118°82′ E) in an East Asian monsoon climate zone with an annual precipitation of 1106.5 mm and an average annual temperature of 15.5 °C. The tested soil was clay and had the following basic physicochemical properties: an initial pH (1:2.5 soil to water) of 8.01, a total salt content of 4.4‰, a total N content of 0.69 g/kg, an available P content of 4.72 mg/kg, an available K content of 147.47 mg/kg, a soil organic matter content of 9.00 g/kg, a cation-exchange capacity of 2.54 mg/kg, and 21.67% sand, 20.67% silt, and 56.67% clay.
4.1.2. Experimental Design and Management
In this experiment, four treatments were set up according to different N application rates: 0, 160, 200, and 240 kg/ha, denoted as control, N160, N200, and N240, respectively. No N was applied as the control and each treatment was replicated three times. N, phosphorus (P), and potassium (K) fertilizers were arranged using urea (46% N), calcium superphosphate (12% P2O5), and potassium chloride (60% K2O), respectively. The input of P and K fertilizers (in P2O5 and K2O, respectively) was 90 and 120 kg/ha for each treatment, respectively. N fertilizers were applied as 30%, 30%, and 40% of the basal N fertilization stage (BF), first supplement N fertilization stage (SF1), and second supplement N fertilization stage (SF2), respectively, whereas P and K fertilizers were applied in one application of BF. The soil columns were made of PVC material with a height of 50 cm and a diameter of 30 cm, and the amount of N, P, and K fertilizer applied in the soil columns was converted to 0.07 m2 per column. Rice (Oryza sativa L., var. Nangeng 46) was transplanted in June 2022, with three holes per soil column and three seedlings per hole, and was harvested in November.
4.2. Sample Collection and Determination
4.2.1. Rice Growth, Yield, and N Use Efficiency
During the rice-growth season, the Normalized Difference Vegetative Index (NDVI) values were measured with a hand-held GreenSeeker (Trimble, Westminster, CO, USA) crop sensor. The Soil Plant Development Analysis (SPAD) values were measured with a SPAD 502 (Konica Minolta, Tokyo, Japan) meter. The straw and grain were harvested separately at the maturation stage, the spike number and kernels per spike in each soil column were recorded, and the weight of the straw and grain was measured. The dried straw and grain samples were digested with H2SO4 and H2O2 and the total N content was measured by the Kjeldahl method [65]. Harvest index, straw and grain N uptake, and N use efficiency were calculated according to the following formulas.
4.2.2. NH3 Volatilization
NH3 volatilization was measured with a modified continuous airflow enclosure method [66]. In this experiment, the chamber was 15 cm in internal diameter and 20 cm in height; the NH3 absorbent was 2% boric acid; 20 mL of a mixture of methyl red, bromocresol green, and ethanol were added to each 1 L of absorbent; and 80 mL of NH3 absorbent was poured into the absorbent bottle each time. After collection, the chamber was removed from the airtight room to avoid environmental influences and the NH3 absorbent solution was immediately titrated by 0.02 mol/L H2SO4 to calculate the daily NH3 volatilization, with the total NH3 volatilization being the sum of the daily NH3 volatilization during the observation period.
4.2.3. N2O Emissions
N2O was determined by the modified closed chamber method [66]. Four consecutive gas samples were collected on the second, fourth, sixth, and eighth days after fertilization and every 10–12 days thereafter, but gas samples were collected on the second, fourth, sixth, and eighth days after the start of the mid-season drainage period. When sampling, a transparent Plexiglas cylinder (inner diameter 36 cm, height 100 cm) was placed in the water tank to form a closed space. The gas in the chamber was collected for 15, 30, 45, and 60 min, and the temperature in the chamber was recorded. Gas samples were analyzed and determined with a gas chromatograph (Agilent 7890A, Agilent Technologies, Santa Clara, CA, USA). The N2O emissions were calculated according to the following formula, and the total N2O emissions was the accumulation of N2O emissions collected every time throughout the whole rice season.
Note: F indicates the N2O emissions (µg/m2/h), ρ indicates the N2O gas density in standard conditions (1.25 kg/m3), h indicates the transparent Plexiglas cylinder height, indicates the rate of change of gas concentration in the transparent Plexiglas cylinder with time (µg/L/h), and T indicates the absolute temperature inside the transparent Plexiglas cylinder.
4.2.4. The pH, NH4+-N, and NO3−-N Concentrations of Overlying Water
We collected approximately 100 mL of overlying water on days 1, 3, 5, and 7 after fertilizer application and immediately brought them back to the laboratory for freezing. The pH was determined in situ using a convenient pH meter. The concentrations of NH4+-N and NO3−-N in the overlying water were determined by indophenol blue colorimetry and an ultraviolet spectrophotometer.
4.2.5. The pH, NH4+-N, and NO3−-N Concentrations and Copies of N Cycle Functional Genes in Soils
Soil was collected from the 0–20 cm soil layer during the basal N fertilization stage, first supplement N fertilization stage, and second supplement N fertilization stage; air dried; and sieved; and the fresh soil samples were frozen and stored in the laboratory refrigerator for use. A total of 10 g of air-dried soil sample was taken, 25 mL of water were added to stand for half an hour, and then a pH meter was used to determine the soil pH. A total of 5 g fresh soil samples was extracted by adding 25 mL of 2 mol/L KCl solution and then filtrated after shaking for 1 h. NH4+-N and NO3−-N were determined by indophenol blue colorimetry and an ultraviolet spectrophotometer [67]. The abundance of soil N cycle functional genes (AOB amoA, AOA amoA, nirS, nirK, and nosZ) was quantitatively determined by qPCR [68].
4.3. Statistical Analysis
The data were collated and analyzed by ANOVA using Excel 2010 and SPSS 16.0 software (SPSS Inc., Chicago, IL, USA). Multiple comparison tests were performed between the different treatments using Duncan’s method, with different lowercase letters indicating significant differences between treatments at the significance level of p < 0.05.
5. Conclusions
The rice grain yield increased with the increase in the N application rate in a certain range, but when the N application rate was higher than 200 kg/ha, the grain yield was not further improved in the saline soil. The kernels per spike reached the maximum in N200. More N input induced higher total NH3 volatilization from the rice-growth cycle. The NH4+-N concentration of the overlying water in SF1 and SF2 were both at a low level in the N200 treatment. Therefore, we obtained the lowest yield-scaled NH3 volatilization (3.3 g/kg) at a medium N input (200 kg/ha). The gene copies of AOA amoA, AOB amoA, nirS, and nirK in soil decreased first and then increased with the increase in the N application rate. Meanwhile, both total N2O emissions and the yield-scaled N2O emissions reached the minimum in the N200 treatment. Considering the responses of rice yield, NH3 volatilization, and N2O emissions to different N application rates, 200 kg/ha is recommended to achieve a higher crop yield and lower environmental N losses in reclaimed saline soils. Meanwhile, the long-term effects of different N managements on crop production and N losses from saline soil should be clarified at the field scale in future investigations.
Author Contributions
Conceptualization, H.S. and H.H.; methodology, H.S.; investigation, S.W.; writing—original draft preparation, S.W.; writing—review and editing, H.S. and Z.Z.; supervision, H.S.; funding acquisition, H.H. All authors have read and agreed to the published version of the manuscript.
Funding
This work was finically supported by the Science and Technology Innovation Program of Jiangsu province, China for “Carbon Dioxide Emission Peaking and Carbon Neutrality” (BE2022305), and the Qing Lan Project of Jiangsu Province, China.
Data Availability Statement
Data are available after requesting.
Acknowledgments
We thank Chengmei Feng and Yu Zhang for the managements in experiment.
Conflicts of Interest
The authors declare no conflict of interest.
References
- Yan, Y.; Zhao, J.Z.; Deng, H.B.; Luo, Q.S. Predicting China’s cultivated land resources and supporting capacity in the twenty-first century. Int. J. Sustain. Dev. World Ecol. 2006, 13, 229–241. [Google Scholar] [CrossRef]
- Chen, A.Q.; He, H.X.; Wang, J.; Li, M.; Guan, Q.C.; Hao, J.M. A study on the arable land demand for food security in China. Sustainability 2019, 11, 4769. [Google Scholar] [CrossRef]
- Zhou, Y.; Li, X.H.; Liu, Y.S. Cultivated land protection and rational use in China. Land Use Policy 2021, 106, 105454. [Google Scholar] [CrossRef]
- Ma, S.L.; Cao, P.X.; Zhang, J.C.; Liu, J.; Wang, J.P.; Zhu, L.J.; Yuan, Z.M. Effects of AMF on the growth and photosynthetic characteristics of Zelkova serrata under salt stress. J. Nanjing For. Univ. Nat. Sci. Ed. 2022, 46, 122–130. (In Chinese) [Google Scholar]
- Fan, Z.X.; Wang, G.M.; Zhang, H.C.; Chen, J. Effects of organic fertilizer addition on dissolved organic carbon in coastal saline soils. J. Nanjing For. Univ. Nat. Sci. Ed. 2022, 46, 15–24. (In Chinese) [Google Scholar]
- Liu, M.L.; Wang, C.; Liu, X.L.; Lu, Y.C.; Wang, Y.F. Saline-alkali soil applied with vermicompost and humic acid fertilizer improved macro aggregate and microstructure to enhance salt leaching and inhibit nitrogen losses. Appl. Soil Ecol. 2020, 156, 103705. [Google Scholar] [CrossRef]
- Ren, C.C.; Zhang, X.M.; Reis, S.; Gu, B.J. Socioeconomic barriers of nitrogen management for agricultural and environmental sustainability. Agric. Ecosyst. Environ. 2022, 333, 107950. [Google Scholar] [CrossRef]
- Yang, G.Y.; Ji, H.T.; Liu, H.J.; Feng, Y.F.; Zhang, Y.F.; Chen, L.J.; Guo, Z. Nitrogen fertilizer reduction in combination with Azolla cover for reducing ammonia volatilization and improving nitrogen use efficiency of rice. PeerJ. 2021, 9, e11077. [Google Scholar] [CrossRef]
- Sun, B.F.; Zhao, H.; Lv, Y.Z.; Lu, F.; Wang, X.K. The effects of nitrogen fertilizer application on methane and nitrous oxide emission/uptake in Chinese croplands. J. Integr. Agric. 2016, 15, 440–450. [Google Scholar] [CrossRef]
- Yan, F.L.; Zhang, F.C.; Fan, J.L.; Hou, X.H.; Bai, W.Q.; Liu, X.Q.; Wang, Y.; Pan, X.K. Optimization of irrigation and nitrogen fertilization increases ash salt accumulation and ions absorption of drip-fertigated sugar beet in saline-alkali soils. Field Crops Res. 2021, 271, 108247. [Google Scholar] [CrossRef]
- Jin, M.J.; Zhou, Y.H.; Wen, B.L.; Liu, L.; Liu, H.Y. Progresses of gypsums for the improvement of saline-alkaline soil. J. Nanjing For. Univ. Nat. Sci. Ed. 2023, 47, 1–8. (In Chinese) [Google Scholar]
- Xu, Z.K.; Shao, T.Y.; Lv, Z.X.; Yue, Y.; Liu, A.H.; Long, X.H.; Zhou, Z.X.; Gao, X.M.; Rengel, Z. The mechanisms of improving coastal saline soils by planting rice. Sci. Total Environ. 2020, 703, 135529. [Google Scholar] [CrossRef] [PubMed]
- Xia, L.L.; Li, X.B.; Ma, Q.Q.; Lam, S.K.; Wolf, B.; Kiese, R.; Butterbach-Bahl, K.; Chen, D.L.; Li, Z.; Yan, X.Y. Simultaneous quantification of N2, NH3 and N2O emissions from a flooded paddy field under different N fertilization regimes. Glob. Change Biol. 2020, 26, 2292–2303. [Google Scholar] [CrossRef]
- Bao, Y.W.; Huang, L.H.; Li, Y.Y.; Wang, M.M.; Liang, Z.W. How Different Nitrogen Application Rates Affect Yield Composition and Nitrogen Uptake of Rice (Oryza sativa L.) in a Saline-Sodic Paddy Field. Pol. J. Environ. Stud. 2019, 28, 553–564. [Google Scholar] [CrossRef] [PubMed]
- Zhou, C.C.; Jia, B.Y.; Wang, S.; Huang, Y.C.; Wang, Y.; Han, K.; Wang, W.D. Effects of nitrogen fertilizer applications on photosynthetic production and yield of japonica rice. Int. J. Plant Prod. 2021, 15, 599–613. [Google Scholar] [CrossRef]
- Qiu, H.N.; Yang, S.H.; Jiang, Z.W.; Xu, Y.; Jiao, X.Y. Effect of Irrigation and Fertilizer Management on Rice Yield and Nitrogen Loss: A Meta-Analysis. Plants 2022, 11, 1690. [Google Scholar] [CrossRef]
- Han, H.H.; Gao, R.; Cui, Y.L.; Gu, S.X. Transport and transformation of water and nitrogen under different irrigation modes and urea application regimes in paddy fields. Agric. Water Manag. 2021, 255, 107024. [Google Scholar] [CrossRef]
- Kim, G.W.; Kim, P.J.; Khan, M.I.; Lee, S.J. Effect of rice planting on nitrous oxide (N2O) emission under different levels of nitrogen fertilization. Agronomy 2021, 11, 217. [Google Scholar] [CrossRef]
- Tang, J.; Wang, J.J.; Li, Z.Y.; Wang, S.N.; Qu, Y.K. Effects of irrigation regime and nitrogen fertilizer management on CH4, N2O and CO2 emissions from saline–alkaline paddy fields in Northeast China. Sustainability 2018, 10, 475. [Google Scholar] [CrossRef]
- Ma, F.; Li, M.; Wei, N.; Dong, L.B.; Zhang, X.Y.; Han, X.; Li, K.; Guo, L.P. Impacts of Elevated Atmospheric CO2 and N Fertilization on N2O Emissions and Dynamics of Associated Soil Labile C Components and Mineral N in a Maize Field in the North China Plain. Agronomy 2022, 12, 432. [Google Scholar] [CrossRef]
- Guo, L.P.; Wang, X.D.; Diao, T.T.; Ju, X.T.; Niu, X.G.; Zheng, L.; Zhang, X.Y.; Han, X. N2O emission contributions by different pathways and associated microbial community dynamics in a typical calcareous vegetable soil. Environ. Pollut. 2018, 242, 2005–2013. [Google Scholar] [CrossRef] [PubMed]
- Liu, E.K.; Yan, C.R.; Mei, X.R.; He, W.Q.; Bing, S.H.; Ding, L.P.; Liu, Q.; Liu, S.A.; Fan, T.L. Long-term effect of chemical fertilizer, straw, and manure on soil chemical and biological properties in northwest China. Geoderma 2010, 158, 173–180. [Google Scholar] [CrossRef]
- Bi, Y.M.; Kant, S.; Clark, J.; Gidda, S.; Ming, F.; Xu, J.Y.; Rochon, A.; Shelp, B.J.; Hao, L.X.; Zhao, R.; et al. Increased nitrogen-use efficiency in transgenic rice plants over-expressing a nitrogen-responsive early nodulin gene identified from rice expression profiling. Plant Cell Environ. 2009, 32, 1749–1760. [Google Scholar] [CrossRef] [PubMed]
- Guo, X.H.; Lan, Y.C.; Xu, L.Q.; Yin, D.W.; Li, H.Y.; Qian, Y.D.; Zheng, G.P.; Lv, Y.D. Effects of nitrogen application rate and hill density on rice yield and nitrogen utilization in sodic saline–alkaline paddy fields. J. Integr. Agric. 2021, 20, 540–553. [Google Scholar] [CrossRef]
- Liang, Z.Z.; Chen, S.C.; Yang, Y.Y.; Zhao, R.Y.; Shi, Z.; Rossel, R.A.V. National digital soil map of organic matter in topsoil and its associated uncertainty in 1980’s China. Geoderma 2019, 335, 47–56. [Google Scholar] [CrossRef]
- Yan, X.Y.; Cai, Z.C.; Wang, S.W.; Smith, P. Direct measurement of soil organic carbon content change in the croplands of China. Glob. Change Biol. 2011, 17, 1487–1496. [Google Scholar] [CrossRef]
- Sui, B.A.; Feng, X.M.; Tian, G.L.; Hu, X.Y.; Shen, Q.R.; Guo, S.W. Optimizing nitrogen supply increases rice yield and nitrogen use efficiency by regulating yield formation factors. Field Crops Res. 2013, 150, 99–107. [Google Scholar] [CrossRef]
- Fu, H.; Cui, D.; Shen, H. Effects of nitrogen forms and application rates on nitrogen uptake, photosynthetic characteristics and yield of double-cropping rice in south China. Agronomy 2021, 11, 158. [Google Scholar] [CrossRef]
- Huang, J.R.; Sun, J.Y.; Liao, H.J.; Liu, X.D. Detection of brown plant hopper infestation based on SPAD and spectral data from rice under different rates of nitrogen fertilizer. Precis. Agric. 2015, 16, 148–163. [Google Scholar] [CrossRef]
- Meng, X.Y.; Ran, C.; Liu, B.L.; Zhao, Z.X.; Bai, T.Q.; Zhao, M.M.; Cheng, Z.W.; Chen, G.; Geng, Y.Q. Effect of straw return with nitrogen fertilizer on photosynthetic characteristics and yield of rice in soda saline–alkali rice paddy fields. Cereal Res. Commun. 2023, 51, 509–526. [Google Scholar] [CrossRef]
- Lv, Y.D.; Lan, Y.C.; Xu, L.Q.; Yin, D.W.; Wang, H.Z.; Zheng, G.P.; Guo, X.H. Reducing nitrogen rate and hill distance improves rice dry matter production in saline–alkali soils. Agron. J. 2021, 113, 5114–5125. [Google Scholar] [CrossRef]
- Xu, Z.; He, P.; Yin, X.Y.; Struik, P.C.; Ding, W.C.; Liu, K.L.; Huang, Q.H. Simultaneously improving yield and nitrogen use efficiency in a double rice cropping system in China. Eur. J. Agron. 2022, 137, 126513. [Google Scholar] [CrossRef]
- Cameron, K.C.; Di, H.J.; Moir, J.L. Nitrogen losses from the soil/plant system, a review. Ann. Appl. Biol. 2013, 162, 145–173. [Google Scholar] [CrossRef]
- Muhammad, I.; Lv, J.Z.; Yang, L.; Ahmad, S.; Farooq, S.; Zeeshan, M.; Zhou, X.B. Low irrigation water minimizes the nitrate nitrogen losses without compromising the soil fertility, enzymatic activities and maize growth. BMC Plant Biol. 2022, 22, 159. [Google Scholar] [CrossRef] [PubMed]
- Razmjooei, Z.; Etemadi, M.; Eshghi, S.; Ramezanian, A.; Abarghuei, F.M.; Alizargar, J. Potential role of foliar application of Azotobacter on growth, nutritional value and quality of Lettuce under different nitrogen levels. Plants 2022, 11, 406. [Google Scholar] [CrossRef] [PubMed]
- Min, W.; Hou, Z.A.; Liang, Y.C.; Ye, J.; Liu, W.; Zhao, L. Effects of soil salinity level and nitrogen rate on urea-N transformation in grey desert soil. Chin. J. Soil Sci. 2012, 43, 1372–1379. [Google Scholar]
- Chen, A.Q.; Lei, B.K.; Hu, W.L.; Lu, Y.; Mao, Y.T.; Duan, Z.Y.; Shi, Z.S. Characteristics of ammonia volatilization on rice grown under different nitrogen application rates and its quantitative predictions in Erhai Lake Watershed, China. Nutr. Cycl. Agroecosyst. 2015, 101, 139–152. [Google Scholar] [CrossRef]
- Li, Y.W.; Xu, J.Z.; Liu, S.M.; Qi, Z.M.; Wang, H.Y.; Wei, Q.; Gu, Z.; Liu, X.Y.; Hameed, F. Salinity-induced concomitant increases in soil ammonia volatilization and nitrous oxide emission. Geoderma 2020, 361, 114053. [Google Scholar] [CrossRef]
- Li, Y.Y.; Huang, L.H.; Zhang, H.; Wang, M.M.; Liang, Z.W. Assessment of ammonia volatilization losses and nitrogen utilization during the rice growing season in alkaline salt-affected soils. Sustainability 2017, 9, 132. [Google Scholar] [CrossRef]
- Feng, Y.F.; Sun, H.J.; Xue, L.H.; Liu, Y.; Gao, Q.; Lu, K.P.; Yang, L.Z. Biochar applied at an appropriate rate can avoid increasing NH3 volatilization dramatically in rice paddy soil. Chemosphere 2017, 168, 1277–1284. [Google Scholar] [CrossRef]
- Wan, X.J.; Wu, W.; Shah, F. Nitrogen fertilizer management for mitigating ammonia emission and increasing nitrogen use efficiencies by 15N stable isotopes in winter wheat. Sci. Total Environ. 2021, 790, 147587. [Google Scholar] [CrossRef] [PubMed]
- Li, T.L.; Wang, Z.G.; Wang, C.X.; Huang, J.Y.; Feng, Y.F.; Shen, W.S.; Zhou, M.; Yang, L.Z. Ammonia volatilization mitigation in crop farming, A review of fertilizer amendment technologies and mechanisms. Chemosphere 2022, 303, 134944. [Google Scholar] [CrossRef] [PubMed]
- Li, Y.Y. The Research on Ammonia Volatilization and Nitrogen Use Efficiency in Saline-Sodic Paddy Fields. Ph.D. Thesis, University of Chinese Academy of Sciences, Beijing, China, 2017. (In Chinese). [Google Scholar]
- Wang, J.; Wang, D.J.; Zhang, G.; Wang, C. Effect of wheat straw application on ammonia volatilization from urea applied to a paddy field. Nutr. Cycl. Agroecosyst. 2012, 94, 73–84. [Google Scholar] [CrossRef]
- Hou, H.; Zhou, S.; Hosomi, M.; Toyota, K.; Yosimura, K.; Mutou, Y.; Nisimura, T.; Takayanagi, M.; Motobayashi, T. Ammonia emissions from anaerobically-digested slurry and chemical fertilizer applied to flooded forage rice. Water Air Soil Pollut. 2007, 183, 37–48. [Google Scholar] [CrossRef]
- Abulaiti, A.; She, D.L.; Zhang, W.J.; Xia, Y.Q. Regulation of denitrification/ammonia volatilization by periphyton in paddy fields and its promise in rice yield promotion. J. Sci. Food Agric. 2022, 103, 4119–4130. [Google Scholar] [CrossRef]
- Wang, X.Y.; Wang, M.M.; Chen, L.; Shutes, B.; Yan, B.X.; Zhang, F.M.; Lyu, J.; Zhu, H. Nitrogen migration and transformation in a saline-alkali paddy ecosystem with application of different nitrogen fertilizers. Environ. Sci. Pollut. Res. 2023, 30, 51665–51678. [Google Scholar] [CrossRef]
- Yu, S.; Xue, L.H.; Feng, Y.F.; Liu, Y.; Song, Z.Z.; Mandal, S.; Yang, L.Z.; Sun, Q.Y.; Xing, B.S. Hydrochar reduced NH3 volatilization from rice paddy soil, Microbial-aging rather than water-washing is recommended before application. J. Clean. Prod. 2020, 268, 122233. [Google Scholar] [CrossRef]
- Francis, D.D.; Vigil, M.F.; Mosier, A.R. Gaseous losses of nitrogen other than through denitrification. Nitrogen Agric. Syst. 2008, 49, 255–279. [Google Scholar]
- He, Y.P.; Zhang, J.Y.; Yang, S.H.; Hong, D.L.; Xu, J.Z. Effect of controlled drainage on nitrogen losses from controlled irrigation paddy fields through subsurface drainage and ammonia volatilization after fertilization. Agric. Water Manag. 2019, 221, 231–237. [Google Scholar] [CrossRef]
- Baggs, E.M. A review of stable isotope techniques for N2O source partitioning in soils, recent progress remaining challenges and future considerations. Rapid Commun. Mass Spectrom. 2008, 22, 1664–1672. [Google Scholar] [CrossRef]
- Wrage, N.; Velthof, G.L.; Van Beusichem, M.L.; Oenema, O. Role of nitrifier denitrification in the production of nitrous oxide. Soil Biol. Biochem. 2001, 33, 1723–1732. [Google Scholar] [CrossRef]
- He, F.F.; Jiang, R.F.; Chen, Q.; Zhang, F.; Su, F. Nitrous oxide emissions from an intensively managed greenhouse vegetable cropping system in Northern China. Environ. Pollut. 2009, 157, 1666–1672. [Google Scholar] [CrossRef] [PubMed]
- Wong, V.N.L.; Dalal, R.C.; Greene, R.S.B. Salinity and sodicity effects on respiration and microbial biomass of soil. Biol. Fert. Soils. 2008, 44, 943–953. [Google Scholar] [CrossRef]
- Sun, X.; Jayakumar, A.; Ward, B.B. Community composition of nitrous oxide consuming bacteria in the oxygen minimum zone of the eastern tropical South Pacific. Front. Microbiol. 2017, 8, 1183. [Google Scholar] [CrossRef]
- Pan, Y.C.; She, D.L.; Chen, X.Y.; Xia, Y.Q.; Timm, L.C. Elevation of biochar application as regulator on denitrification/NH3 volatilization in saline soils. Environ. Sci. Pollut. R. 2021, 28, 41712–41725. [Google Scholar] [CrossRef] [PubMed]
- Wang, Y.; Cao, W.; Guo, J.; Zhang, M. Effects of Increasing pH on Nitrous Oxide and Dinitrogen Emissions from Denitrification in Sterilized and Unsterilized Forest Soils. Forests 2022, 13, 1589. [Google Scholar] [CrossRef]
- Jia, J.; Bai, J.H.; Wang, W.; Yin, S.; Zhang, G.L.; Zhao, Q.Q.; Wang, X.; Liu, X.H.; Cui, B.S. Salt stress alters the short-term responses of nitrous oxide emissions to the nitrogen addition in salt-affected coastal soils. Sci. Total Environ. 2020, 742, 140124. [Google Scholar] [CrossRef]
- Ouyang, Y.; Evans, S.E.; Friesen, M.L.; Tiemann, L.K. Effect of nitrogen fertilization on the abundance of nitrogen cycling genes in agricultural soils, a meta-analysis of field studies. Soil Biol. Biochem. 2018, 127, 71–78. [Google Scholar] [CrossRef]
- Cui, P.Y.; Fan, F.L.; Yin, C.; Li, Z.J.; Song, A.L.; Wan, Y.F.; Liang, Y.C. Urea-and nitrapyrin-affected N2O emission is coupled mainly with ammonia oxidizing bacteria growth in microcosms of three typical Chinese arable soils. Soil Biol. Biochem. 2013, 66, 214–221. [Google Scholar] [CrossRef]
- Shi, Y.L.; Liu, X.R.; Zhang, Q.W. Effects of combined biochar and organic fertilizer on nitrous oxide fluxes and the related nitrifier and denitrifier communities in a saline-alkali soil. Sci. Total Environ. 2019, 686, 199–211. [Google Scholar] [CrossRef]
- Braker, G.; Conrad, R. Diversity, structure, and size of N2O producing microbial communities in soils—What matters for their functioning? Adv. Appl. Microbiol. 2011, 75, 33–70. [Google Scholar]
- Pan, Y.C.; She, D.L.; Shi, Z.Q.; Cao, T.H.; Xia, Y.Q.; Shan, J. Salinity and high pH reduce denitrification rates by inhibiting denitrifying gene abundance in a saline-alkali soil. Sci. Rep. 2023, 13, 2155. [Google Scholar] [CrossRef] [PubMed]
- Wang, H.T.; Gilbert, J.A.; Zhu, Y.G.; Yang, X.R. Salinity is a key factor driving the nitrogen cycling in the mangrove sediment. Sci. Total Environ. 2018, 631, 1342–1349. [Google Scholar] [CrossRef]
- Lu, R.K. Methods for Agricultural Chemical Analysis of Soil, 3rd ed.; China Agricultural Science and Technology Press: Beijing, China, 2000; pp. 264–268. (In Chinese) [Google Scholar]
- Sun, H.J.; Zhang, H.L.; Powlson, D.; Min, J.; Shi, W.M. Rice production, nitrous oxide emission and ammonia volatilization as impacted by the nitrification inhibitor 2-chloro-6-(trichloromethyl)-pyridine. Field Crops Res. 2015, 173, 1–7. [Google Scholar] [CrossRef]
- Lu, Z.G.; Hua, J.F.; Yin, Y.L.; Shi, Q. Effects of nitrogen form on growth and physiological characteristics of Hibiscus hamabo under salt stress. J. Nanjing For. Univ. Nat. Sci. Ed. 2022, 46, 91–98. (In Chinese) [Google Scholar]
- Chen, Z.J.; Jin, Y.Y.; Yao, X.; Wei, X.K.; Li, X.Z.; Li, C.J.; White, J.F.; Nan, Z.B. Gene analysis reveals that leaf litter from Epichloë endophyte-infected perennial ryegrass alters diversity and abundance of soil microbes involved in nitrification and denitrification. Soil Biol. Biochem. 2021, 154, 108123. [Google Scholar] [CrossRef]
Disclaimer/Publisher’s Note: The statements, opinions and data contained in all publications are solely those of the individual author(s) and contributor(s) and not of MDPI and/or the editor(s). MDPI and/or the editor(s) disclaim responsibility for any injury to people or property resulting from any ideas, methods, instructions or products referred to in the content. |
© 2023 by the authors. Licensee MDPI, Basel, Switzerland. This article is an open access article distributed under the terms and conditions of the Creative Commons Attribution (CC BY) license (https://creativecommons.org/licenses/by/4.0/).