Article

Identification of Climate-Smart Bread Wheat Germplasm Lines with Enhanced Adaptation to Global Warming

1
Division of Genomic Resources, Indian Council of Agricultural Research (ICAR)-National Bureau of Plant Genetic Resources, New Delhi 110012, India
2
Post-Graduate School, ICAR-Indian Agricultural Research Institute, New Delhi 110012, India
3
Division of Germplasm Evaluation, ICAR-National Bureau of Plant Genetic Resources, New Delhi 110012, India
4
Division of Nematology, ICAR-Indian Agricultural Research Institute, New Delhi 110012, India
5
Division of Plant Physiology, ICAR-Indian Agricultural Research Institute, New Delhi 110012, India
*
Author to whom correspondence should be addressed.
Plants 2023, 12(15), 2851; https://doi.org/10.3390/plants12152851
Submission received: 30 May 2023 / Revised: 22 July 2023 / Accepted: 24 July 2023 / Published: 2 August 2023
(This article belongs to the Section Plant Genetic Resources)

Abstract

:
Bread wheat (Triticum aestivum L.) is widely grown in sub-tropical and tropical areas and, as such, it is exposed to heatstress especially during the grain filling period (GFP). Global warming has further affected its production and productivity in these heat-stressed environments. We examined the effects of heatstress on 18 morpho-physiological and yield-related traits in 96 bread wheat accessions. Heat stress decreased crop growth and GFP, and consequently reduced morphological and yield-related traits in the delayed sown crop. A low heat susceptibility index and high yield stability were used for selecting tolerant accessions. Under heatstress, the days to 50% anthesis, flag-leaf area, chlorophyll content, normalized difference vegetation index (NDVI), thousand grain weight (TGW), harvest index and grain yield were significantly reduced both in tolerant and susceptible accessions. The reduction was severe in susceptible accessions (48.2% grain yield reduction in IC277741). The plant height, peduncle length and spike length showeda significant reduction in susceptible accessions, but a non-significant reduction in the tolerant accessions under the heatstress. The physiological traits like the canopy temperature depression (CTD), plant waxiness and leaf rolling were increased in tolerant accessions under heatstress. Scanning electron microscopy of matured wheat grains revealed ultrastructural changes in endosperm and aleurone cells due to heat stress. The reduction in size and density of large starch granules is the major cause of the yield and TGW decrease in the heat-stress-susceptible accessions. The most stable and high-yielding accessions, namely, IC566223, IC128454, IC335792, EC576707, IC535176, IC529207, IC446713 and IC416019 were identified as the climate-smart germplasm lines. We selected germplasm lines possessing desirable traits as potential parents for the development of bi-parent and multi-parent mapping populations.

1. Introduction

Bread wheat (Triticum aestivum L., 2n = 6X = 42, BBAADD), an important cereal crop, is a staple food for 40% of the world’s population [1]. It provides 20% of the total dietary calories consumed globally [2], and contributes proteins, vitamins and dietary fiber to the human diet and phytochemicals for human health benefits [3]. Wheat was cultivated on 219.0 million ha land with a global production of 760.9 million tons during 2020 and has contributed 8% to the world’s food basket [4].The demand of wheat is expected to rise by 60% from today’s level by 2050 and its production is expected to decrease by ~30% during this period due to extreme weather events [5]. Climate changes have impacted agriculture production and productivity globally during the past decades and seriously threatened the food supply [6,7]. Therefore, major advances in global food systems are required to ensure food security to the burgeoning human population, which is expected to reach 10 billion by 2050 and for sustainable development [8]. With increasing climate instability due to global warming, agricultural productivity will continue to be negatively impacted [9]. Studies suggest that every 1 °C rise in the average global surface temperature will lead to a decline in wheat yields from 4.1 to 6.4% worldwide and 8.0% in India [10].
The narrow genetic base of elite cultivars necessitates the screening of germplasm conserved in genebanks to enhance resilience against stressors [11]. The efficient utilization of germplasm resources is crucial for enhancing the genetic gains to address the challenges posed by global warming [12]. Genetic diversity is paramount for crop improvement, and for bread wheat, this resides in three genomes, which were constituted by the polyploidization of ancestral diploid species [13]. Bread wheat originated in Fertile Crescent after a few events of initial allopolyploidization and it spread to all continents except Antarctica [14]. During the course of evolution and, later on, its global cultivation, bread wheat has adapted to various agro-ecologies from temperate (cold) to sub-tropical (hot and dry) and tropical (hot and humid) environments. The widely adapted germplasm with stress tolerance conserved in genebanks of national and international research institutes (e.g., World Wheat Collection, CIMMYT, Mexico), needs to be utilized in breeding programs for further enhancing the genetic gains in wheat [15,16].
The Indo-Gangetic Plains (IGP) region of India contributes about 15% of global wheat production. However, about 51% of its area might be re-classified as a heat-stressed (HS) short-season production mega-environment by 2050 [17]. Globally, heatstress during the grain filling period (GFP) is a major yield-reducing factor [18]. Heatstress during GFP, commonly referred to as terminal-heat stress, adversely affects plant growth and grain yield. Late-sown wheat is invariably exposed to terminal-heat stress, resulting in significant yield losses [19,20]. The delayed sowing of wheat is common in the IGP region and hence it endures heatstress during GFP [21]. Every 1 °C rise in temperature above the optimum of 28 °C during GFP has resulted in yield losses of 3–17% in the Great Plains of USA and the Eastern IGP of India [22,23]. Hence, study on the impact of heatstress on the productivity of wheat in these regions has emerged as a top priority in the climate change scenario.
Several adaptive morpho-physiological traits like early ground cover, epicuticular wax, leaf rolling, stay-green, biomass and flag-leaf area contribute to heat-stress tolerance in wheat [24,25]. Adaptive physiological traits such as CTD, cell membrane thermo-stability, NDVI, chlorophyll content and fluorescenceare associated with heat-stress tolerance and significantly contribute to the performance of tolerant wheat lines in an HS environment [26,27]. Heatstress during crop growth and grain development significantly reduces morphological and yield-related traits, viz., plant height, tiller number, peduncle length, spike length, spikelets and grains per spike, TGW and yield in wheat [28,29]. Endosperm shrinkage in grains of heat-stressed plants is a major cause of yield and TGW reduction [30,31]. Heatstress causes damage to the cellular structure and affects various metabolic pathways, mainly those related to membrane thermostability, photosynthesis and starch synthesis [32,33,34]. Each genotype responds to a changed environment differently due to its genetic makeup and interaction with the environment [19,35]. The genotypes, which maintain a high TGW and yield under an HS environment, seem to possess a higher tolerance to a hot environment [36,37]. The exposure of wheat plants, at anthesis and during GFP, to a higher than the optimal temperature, affects the grain development and, as a result, reduces productivity [38,39]. The knowledge of the source–sink relationship during grain development is critical for the selection of germplasm that can produce a better yield and quality under global warming [40]. Thus, an understanding of the sink– source relationship under heatstress in wheat germplasm could be useful for selecting tolerant lines.
Genotype–Environment (G × E) interactions are important factors in the expression of quantitative traits such as yield and its component traits. A stability analysis has been used to identify varieties with a superior performance and yield stability under different environments [41]. Germplasm offers the best opportunity to develop varieties with a small G × E interaction. Climate-smart varieties tolerate negative effects of climate change better and produce a higher yield and better quality in stressful environments. Screening a large genebank collection for tolerance to stresses is a right approach to develop climate- smart varieties [11]. The morpho-physiological traits have been used to screen germplasm for heat-stress tolerance in numerous studies worldwide [18,42]. The testing of diverse germplasm under an HS environment would be useful to understand plant responses to heatstress and the identification of superior lines for the development of mapping populations. Thus, aims of this study were to understand the impacts of heatstress on morpho-physiological and grain traits, to identify climate-smart germplasm and to select desirable parents for the creation of bi-parent and multi-parent mapping populations.

2. Materials and Methods

2.1. Plant Materials

Plant materials consisted of a subset of 96 bread wheat accessions (79 indigenous and 17 exotic collections), selected from a large genebank collection of wheat [43], which included released varieties for the late-sown condition, trait-specific germplasm and genetic stocks. Seeds of wheat accessions were obtained from the working collection of the Indian National Gene Bank (INGB) at the ICAR-National Bureau of Plant Genetic Resources (NBPGR), New Delhi. Passport data of wheat accessions are provided in Supplementary Table S1. The geo-referencing of wheat accessions on the world map was performed using the software ‘DIVA-GIS’ [44]. The germplasm chosen for the present study were genetically diverse and represented all wheat growing zones of India (Supplementary Figure S1).

2.2. Experimental Site, Design and Weather Conditions

Field experiments were conducted at Experimental Farm, ICAR-NBPGR, New Delhi, situated at 28.649° N latitude, 77.152° E longitude and 220 m altitude, during the Rabi seasons of years 2018–2019 and 2019–2020. The farm area lies in the North–Western Plain Zone (NWPZ) of wheat production with a semi-arid and sub-tropical climate and sandy- loam alluvial soil, slightly alkaline in pH and low in organic matter content. In each crop season, two sowing dates were (i) normal (sown in first week of December; non-stressed (NS) environment) and (ii) late-sown wheat (sown in first week of January; HS environment). Thus, in late-sown wheat, accessions were exposed to heatstress during GFP. The combination of year and sowing dates made our field experiments have four environments, which included two NS and two HS environments for testing the stability of wheat germplasm under heatstress. The field trials were laid out in an Augmented Block Design (ABD) with fiveblocks, where four checks, namely, Raj3765, HD2932, WR544 and HD2967, were randomized and replicated in each block. Each experimental plot consisted of three rows of a 2.0 m length with 25 cm spacing between rows (1.5 m2 area). The standard crop management practices for irrigated ecology were followed for raising a healthy wheat crop. Weather parameters like the temperature and rainfall were recorded during the crop period of 2018–2019 and 2019–2020. Crop duration was expressed in standard meteorological weeks (SMW).

2.3. Field Phenotyping and Data Recording

The morpho-physiological and yield traits related to heat-stress tolerance were recorded as per the Manual on Physiological Breeding II: A field guide to wheat phenotyping [45]. The traits were recorded during different growth phases of wheat trials (Table 1).

2.4. Scanning Electron Microscopy

Mature grains from heat-stress tolerant and susceptible accessions of bread wheat were transverse sectioned into three small pieces. The middle sections were mounted on an aluminum stub using double-side adhesive carbon tape. The specimens were uniformly coated with a thin layer of gold–palladium using an Emitech SC7620 sputter coater. Specimens were examined under a Scanning Electron Microscope (SEM, Model Tescan Vega3, Tescan Analytics, Fuveau, Alpes-Côte d’Azur, France) operated at 10.0 kV using a secondary electron detector. The aleurone layer, endosperm cells and starch granules were observed, and their images were captured.

2.5. Statistical Analysis

Adjusted mean values were used for the statistical analyses of ABD trial data of 18 traits recorded under NS and HS environments over 2 years. An analysis of variance (ANOVA) was performed following a test of the homogeneity of variances and applying Aitkin’s transformation using SAS software version 9.4 [46]. Pearson’s correlation coefficients (r) were derived using IBM SPSS statistics software version 20.0 [47] for both NS and HS environments. A cluster analysis was performed with Ward’s minimum variance using Euclidean distance matrices. The dendrogram was constructed using the unweighted paired group method of the arithmetic averages (UPGMA) algorithm. We categorized the accessions as tolerant or susceptible based on the heat susceptibility index (HSI). HSI was computed based on grain yield (GY) data using the formula [48] HSI = (1 − Xa/Xb)/(1 − Ya/Yb), where Xa and Xb are mean values of the GY of an individual accession under the HS and the NS environment, respectively; Ya and Yb are mean values of the GY of all accessions under the HS and the NS environment, respectively.
We used HSI values to categorize wheat accessions as highly tolerant (HSI < 0.50), tolerant (HSI = 0.51–1.0), susceptible (HSI = 1.0–1.50) and highly susceptible (HSI > 1.50). The phenotypic variance (σ2ph), genotypic variance (σ2g), phenotypic coefficient of variation (PCV), genotypic coefficient of variation (GCV), broad sense heritability (H2) and genetic advance (GA) were calculated on mean data of four checks using SAS software.
Heritability (H2) % = (σ2g2ph) × 100 and genetic advance (GA) = H × k × σph, where σph is the phenotypic standard deviation and k is the constant 2.06 at 5% selection intensity, were computed. The diversity estimates were derived using the Shannon–Weiner index [49].
Shannon - Weiner   index ( H )   = i = 1 n pi   ln ( pi )
where n is the number of phenotypic classes for a character, Pi is the relative frequency in the ith class of the jth trait and ln is the natural logarithm of Pi. The extent of diversity was interpreted as H′ < 0.5: low, H′ = 0.5 to 1.0: high and H′ > 1.0: very high. The traits showing H′ > 1.5 revealed a great genetic diversity among the accessions.
We performed a stability analysis usingthe Eberhart and Russell (1966) model [50] with Windostat software (IndoStat Services, Hyderabad, India). The stability model used is Yij = µi + βiIj + δij, where Yij is the mean of the ith genotype in the jth environment, µi is the ith genotype mean over all environments, βi is the regression coefficient of the ith genotype, Ij is the environmental index and δij is the deviation from the regression of the ith genotype at the jth environment. The stable genotypes have a higher mean than the population mean, regression coefficient (βi = 1) and small S2di. These genotypes are well adapted to both the environments. The genotypes having a higher mean, βi > 1 and a small S2di are adapted to the favorable (NS) environment. The genotypes with a higher mean, βi < 1 and a small S2di are specially adapted to the unfavorable (HS) environment. Four categories of accessions were made, viz., highly tolerant, tolerant, susceptible and highly susceptible based on the mean, stability and HSI.

3. Results

3.1. Weather Conditions during Crop Seasons

The maximum and minimum temperatures and rainfall during the GFP of 2018–2019 and 2019–2020 crop growing seasons are presented in Figure 1. GFP started from 8 SMW (18–24 February) and completed during 14 SMW (1–7 April) in the normal sown (NS) crop, while it was from 12 SMW (18–24 March) to 17 SMW (22–28 April) for the late-sown (HS) crops. Light to moderate rainfall occurred during GFP under the NS environment in 2018–2019, but it was moderate to heavy rainfall during 2019–2020. The light rainfall during GFP slightly lowered the rising day and night temperatures under the HS environment during both the crop seasons. The wheat crops of the HS environment (sown in January) were exposed to mean day temperatures of above 35 °C in 2018–2019 and 33 °C in 2019–2020 during the grain development. The night temperature was also higher during GFP under the HS environment than the NS environment during both the crop seasons. On average, the maximum temperature was 7.7 °C higher in 2018–2019 and 5.7 °C in 2019–2020 under the HS environment. Thus, the air temperature during GFP for the late-sown crop was significantly higher than the optimum temperature needed for grain development (22–25 °C). Hence, the late-sown crops were exposed to severe heatstress during GFP.

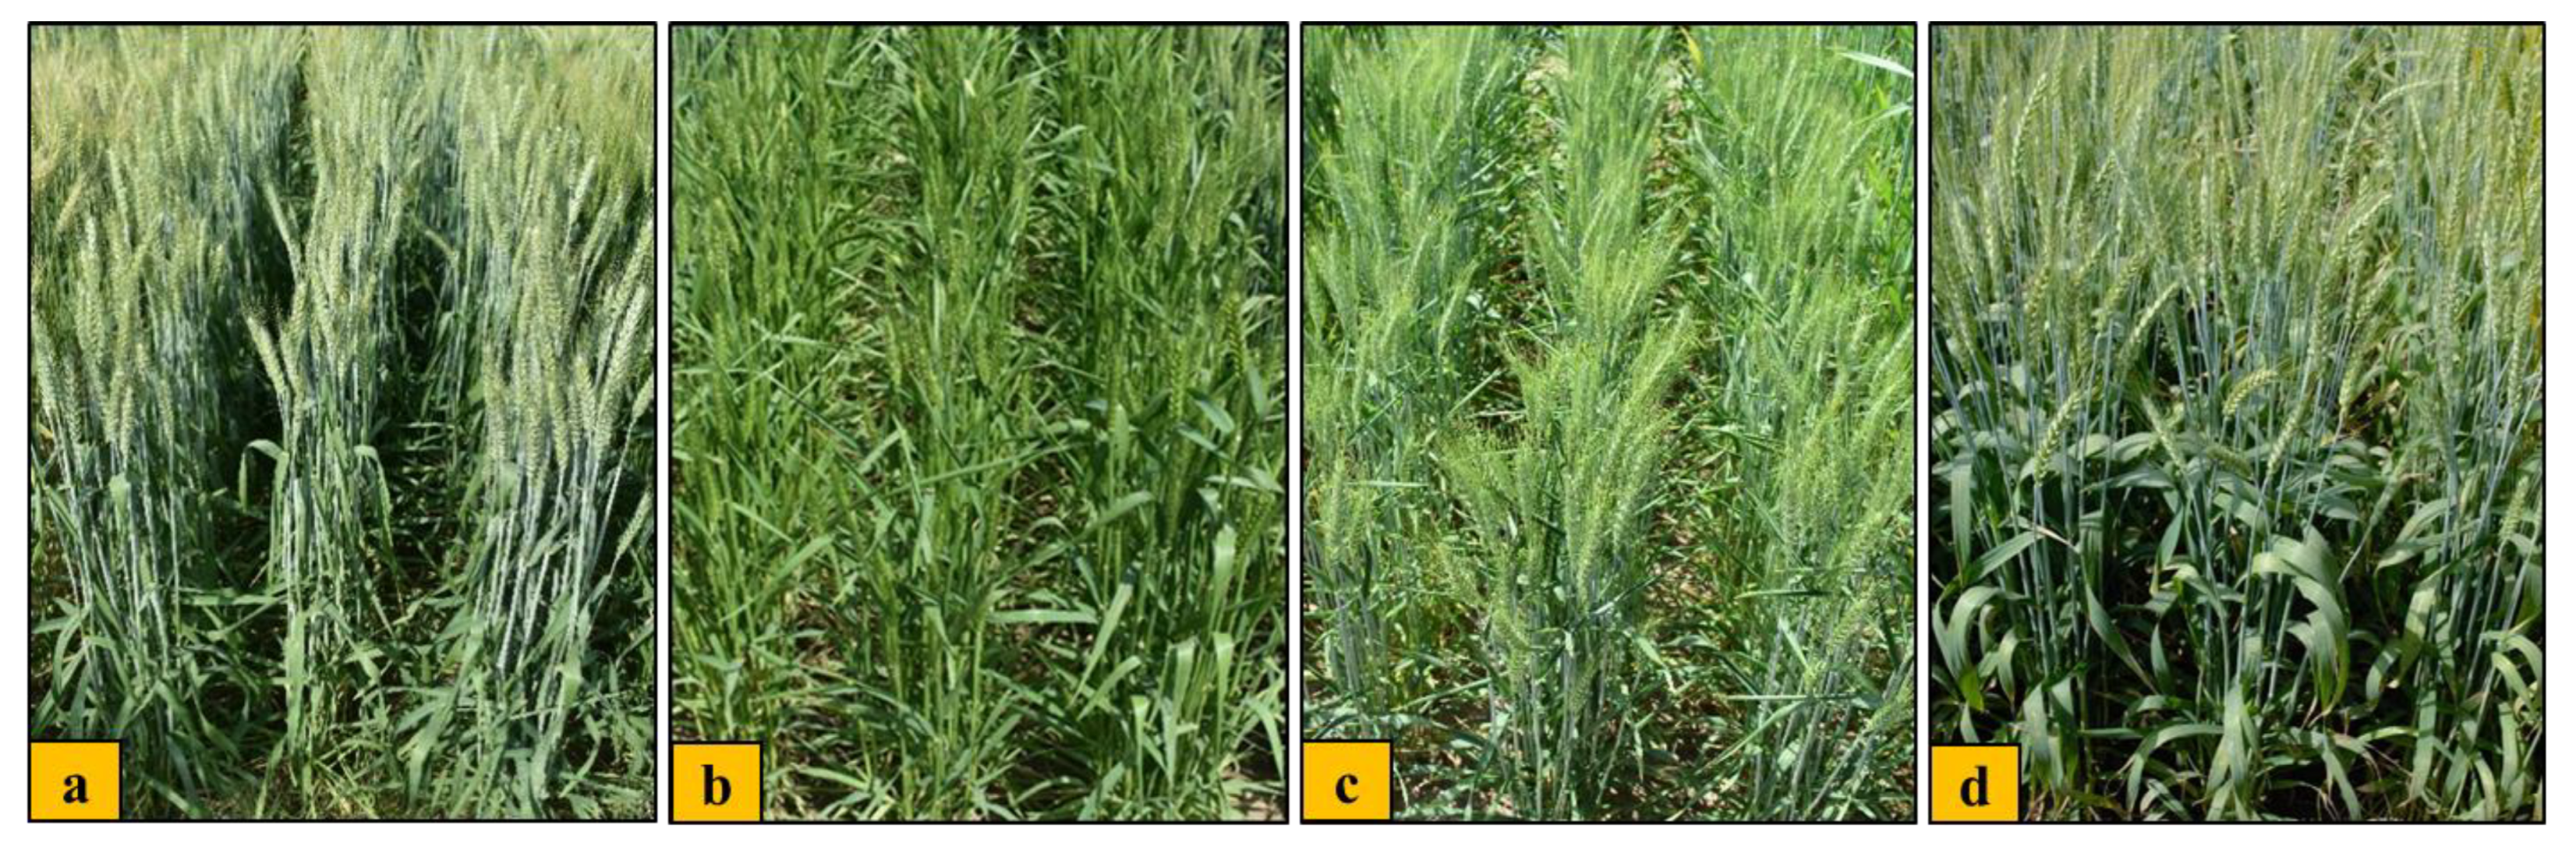
3.2. Crop Growth and Genetic Variability

The differences in the climatic conditions in the environments were reflected by the variations observed for the phenological and agronomic traits, as presented in Table 2. Significant differences were observed for DA, PH, PL, FLA, SL, NSS and GFP between environments. Bread wheat accessions showed significant differences for all the traits except CTD, under both NS and HS environments (Supplementary Table S2). CTD showed a large variation due to the year effect and hence exhibited a non-significant variation for the genotype. The other physiological traits like NDVI and MSI also showed a greater variation due to the year than the genotype. Thus, the variation due to the year was significant for almost all the traits except CC, LR, NSS, HI and YPP, under both NS and HS environments. Then genotype × year (G × Y) interaction showed non-significant differences in most of the traits. NDVI had a significant G × Y interaction in both NS and HS environments, while TGW showed a significant G × Y interaction in the NS environment. Morphological traits, namely, PH, PL, SL and GL, showed a significant G × Y interaction under heatstress. Thus, the morpho-physiological and yield-related traits showed a wide-range of phenotypic variability under both NS and HS environments. Check variety WR544 (IC296383) had the earliest anthesis on 83.4 and 66.6 days in normal and late-sown trials, respectively.
Accessions IC393878 and IC252725 showed the highest GFP of 39.5 and 32.0 days under NS and HS environments, respectively. Accession EC577013 had the tallest plants (150.9 cm) under NS, while accession EC576585 had the tallest plants (127.0 cm) under the HS environment. However, accession IC335792 produced the shortest plant (84.9 cm) under NS and accession IC443653 had the shortest plants (73.2 cm) under the HS environment. Accession IC277741 produced the highest grain yield (802.5 g) in the NS environment, while accession IC566223 produced the highest grain yield (598.1 g) under the HS environment. The lowest grain yield (300.1 g) was produced in accession IC542509 under NS, whereas accession IC539287 produced the lowest yield (176.7 g) under the HS environment. Accession IC573461 showed the highest TGW (52.2 g) under the NS environment, while accession IC539221 produced the highest TGW (46.6 g) under the HS environment. Accession IC443653 showed the highest harvest index (48.0%) under the HS environment.
Bread wheat accessions exhibited a significant variation for most of the physiological traits. They showed a high variability in physiological traits such as plant waxiness and leaf rolling (Figure 2). Accessions IC528965 and IC529207 showed the highest waxiness (score 10) under both the environments. Accession IC416019 showed the highest leaf rolling (score 9.5) under NS, whereas accessions IC416019 and IC416055 showed the highest leaf rolling (score 10) under the HS environment. Accession IC573461 showed the highest CC (38.5) under NS, while accession IC252444 had the highest CC (37.2) in the HS condition. However, accession IC542547 possessed the lowest CC under both the environments. Accessions IC542509 and IC566223 showed the highest NDVI under both NS (0.72) and HS (0.64) environments. CTD was higher under HS than the NS environment. Accession EC190962 showed the highest value of CTD (9.7 °C) under the NS environment, while accession IC542509 exhibited the highest CTD (12.0 °C) under the HS environment. The accessions IC277741 and 83 EC573527 exhibited the highest value for MSI (77.5%) under NS, while accession IC542544 showed the highest MSI (72.6%) under the HS environment. Detailed data for all the traits are shown in Supplementary Tables S3 and S4.
A wide range of genetic variability was recorded for most of the traits (Table 2). PCV was higher than GCV for all the quantitative traits. The highest PCV was observed for CTD (26.1%) under the HS environment followed by PW (23.8%) under the NS environment. The highest GCV was recorded for PW (19.6%) followed by LR (17.5%) under the NS environment. The estimates of a high H2 (>70%) were recorded for DA (84.9% under NS and 85.4% under HS) and GL (77.9% under NS and 89.3% under HS) in both environments; CC (75.9%) and PL (79.4%) in HS; and LR (71.4%) in the NS environment. A genetic advance was the highest for PW (33.2%) followed by LR (30.5%) under the NS environment.
The Shannon–Weiner diversity index (H′) revealed a high morpho-physiological diversity among studied bread wheat accessions considering all traits under NS (H′ = 1.56) and HS environments (H′ = 1.47). The most diverse traits were PW (H′ = 1.90), CTD (H′ = 1.88), NSS (H′ = 1.79) and NDVI (H′ = 1.78) under NS, while under the HS environment, NSS (H′ = 1.78), PW (H′ = 1.77), MSI (H′ = 1.70) and CTD (H′ = 1.69) displayed a high phenotypic diversity. The grain length showed the least variability under both NS (H′ = 1.19) and HS (H′ = 1.14) environments. The frequency distribution for 12 important phenological, physiological and yield-related traits, namely, DA, GFP, CC, CTD, NDVI, MSI, PW, LR, PH, PL, TGW and GY, also supported the existence of a widerange of genetic variability in the germplasm (Supplementary Figure S2).

3.3. Genetic Relationship in Wheat Accessions

A UPGMA dendrogram grouped all the 96 wheat accessions into six major clusters using data of 18 morpho-physiological traits recorded under the HS environment (Figure 3).
Most of the accessions were included in the first three clusters, and cluster I, II and III consisted of 21, 42 and 17 accessions, respectively. The remaining three clusters grouped 16 accessions with cluster IV, V and VI having 10, 5 and 1 accessions, respectively. Most of the accessions adapted to heatstress, viz., accession IC566223, IC529207, IC535176, EC534487, IC252348, IC401976, IC075240, IC539531 and EC574731, grouped in cluster III along with two national check varieties, HD2932 and HD2967. Accession IC542509 took the longest time to 50% anthesis (119 days in NS and 94 days in HS environment), produced the lowest yield in both the NS and HS environments and formed a solitary accession in cluster VI. Accessions EC576585, IC536162, IC252999, EC190899, IC252867, IC536050, IC416075, IC572925, IC443653 and WR544 flowered early (<69 days) in the HS environment and were grouped in cluster I.

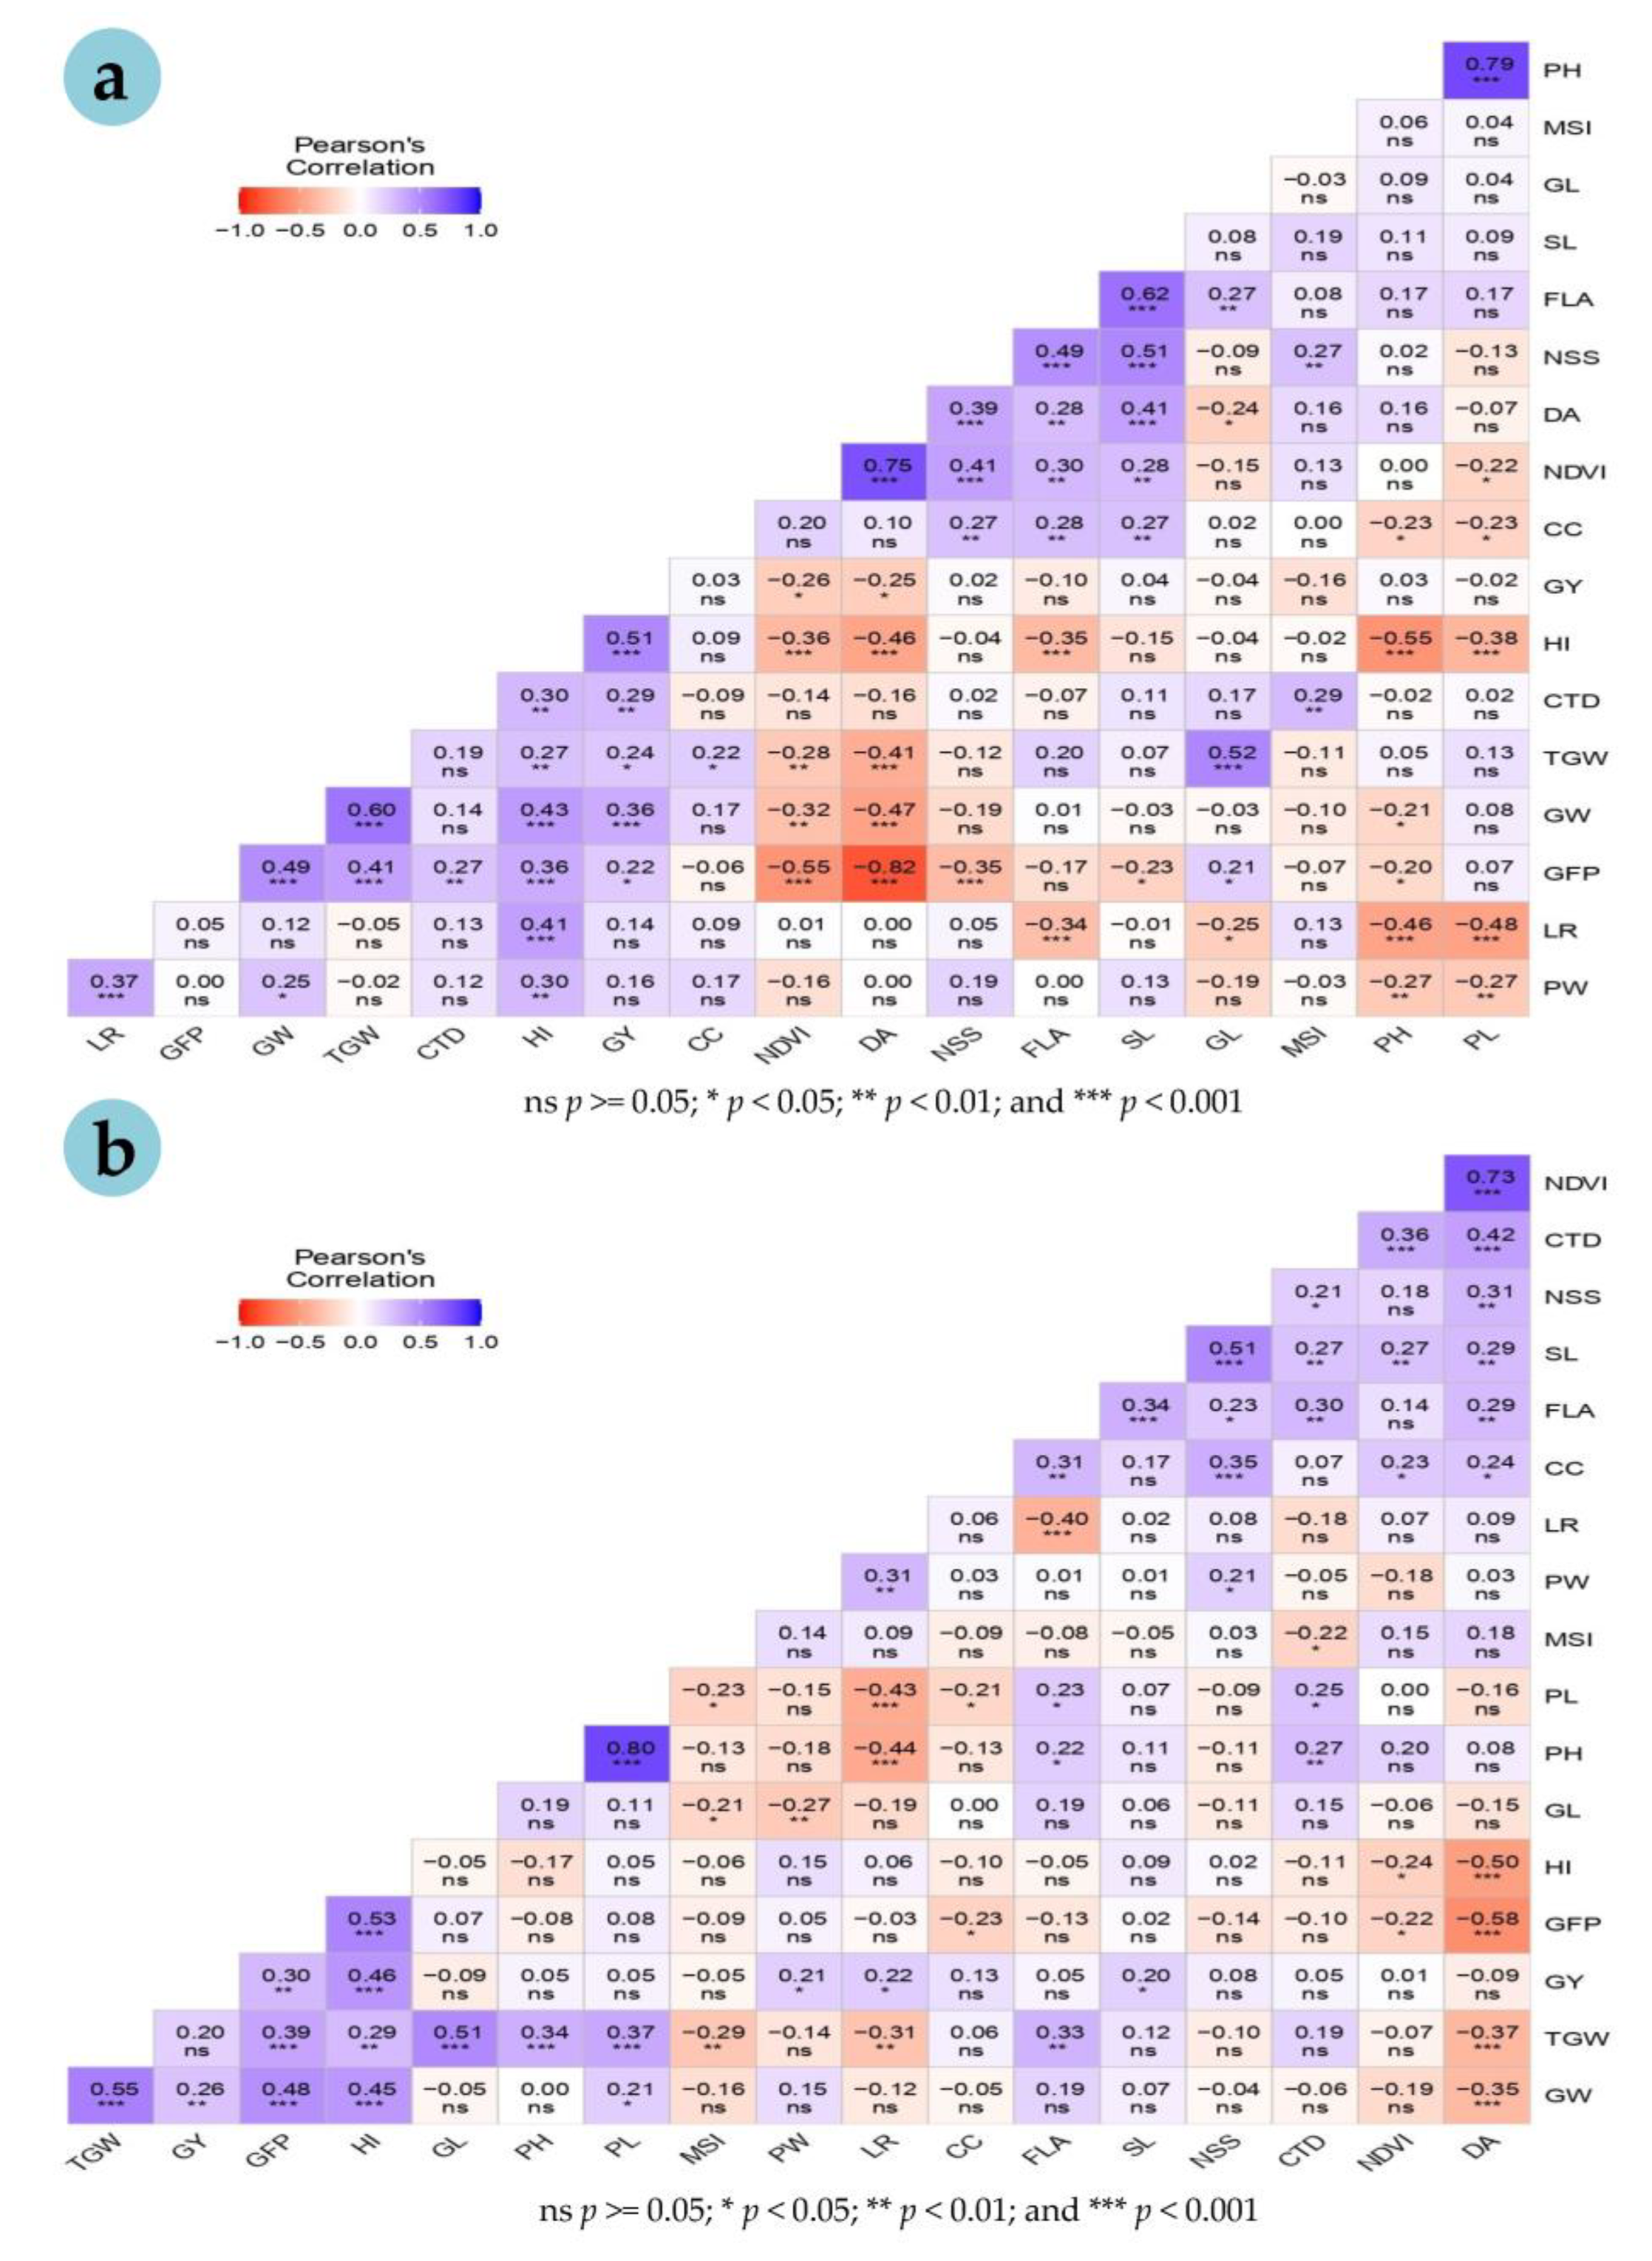
3.4. Correlations with Grain Yield

Grain yield associated positively with GFP, PW, LR, SL, HI and GW under the HS environment (Figure 4a). However, under the NS environment, GY associated positively with CTD, GFP, HI, GW and TGW, but negatively with NDVI and DA (Figure 4b).
TGW showed positive associations with GFP, HI, GL and GW under both NS and HS environments. However, under heatstress, TGW was associated positively with PH, PL and FLA, but negatively with MSI, LR and DA. Strong positive correlations were recorded between PH and PL, and SL and NSS, under both the environments. GFP associated positively with GW, TGW and HI, but negatively with DA under both the environments. Similarly, DA also associated negatively with HI, TGW and GW under both environments. Among the physiological traits, positive associations were observed between PW and LR under both the environments. NDVI associated positively with both CC and CTD under the HS environment. The cooler canopy (CTD) showed positive correlations with DA, PH, PL, FLA, SL and NSS under the HS environment. However, CTD associated positively with MSI under NS and negatively under the HS environment.

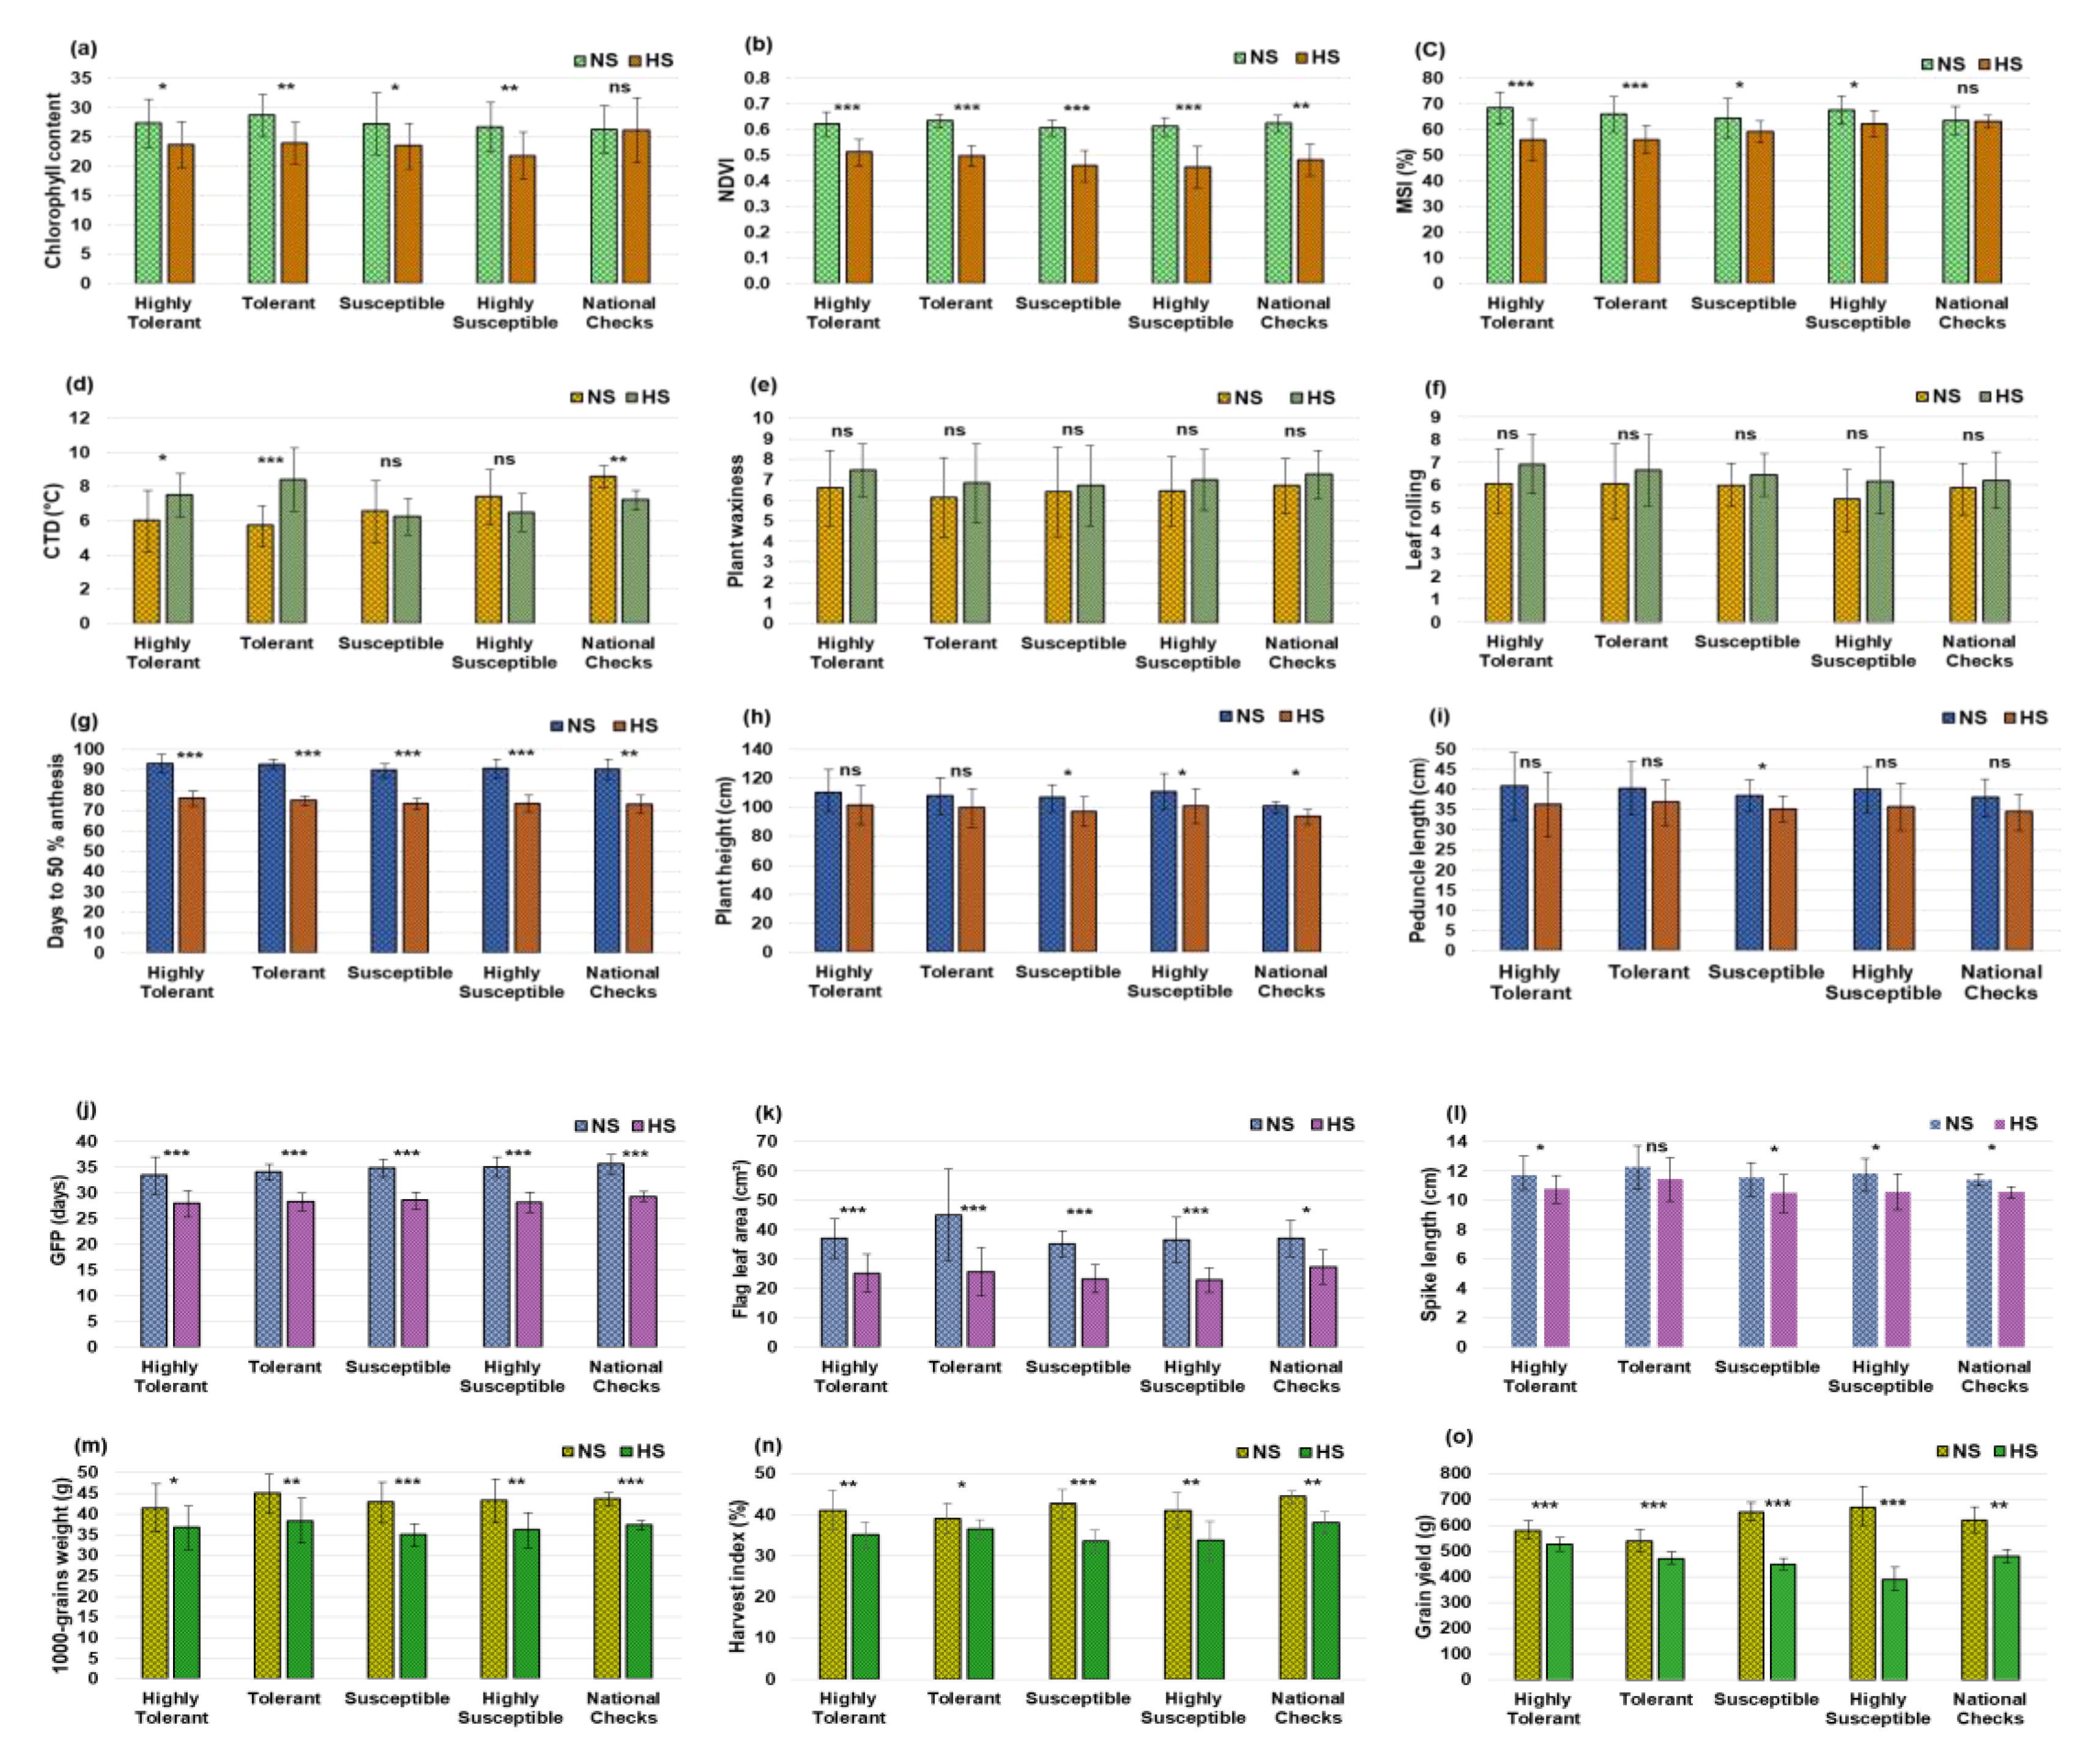
3.5. Impact of HeatStress on Yield and Morpho-Physiological Traits

Late sowing reduced the optimal period for crop growth and grain development. The unfavorable weather conditions prevailing under the HS environment had an adverse effect on the grain yield and its contributing traits, which showed a reduced expression. However, physiological adaptive traits, namely, CTD, PW and LR, showed an increased expression under the HS environment. Phenological traits like DA were reduced by 17 days. PH, PL and GFP were decreased by 9.7 cm, 4.1 cm and 6.0 days, respectively, under the heat-stress condition. Likewise, heatstress reduced FLA by 13.6 cm2. The heatstress prevailed, at the onset of the reproductive phase and during the grain development stage, decreased SL, NSS, GL and GW. The heatstress during GFP had an adverse effect on grain yield and TGW, and reduced these traits by 138.6 g and 6.0 g, respectively. Among the physiological traits, CC, NDVI and MSI were reduced by 4.2, 0.14 and 7.2%, respectively, under heatstress. However, CTD increased from 6.2 to 6.9 °C under the HS environment to maintain an optimal sub-cellular temperature during GFP. PL and LR were also increased from 6.2 to 6.9 and 5.8 to 6.5, respectively, under the heatstress. A boxplot analysis clearly showed the differential effect of heatstress on morpho-physiological traits in tolerant and susceptible accessions (Figure 5).
All the traits were reduced under the HS environment in both tolerant and susceptible accessions except CTD, PW and LR. However, mean values of CTD, PW and LR were higher under HS in the tolerant accessions. The tolerant accessions showed higher mean values for all traits as compared to heat-susceptible ones under the HS environment, except MSI. A higher MSI was observed in the susceptible accessions because of more leakage of cell contents at 100 °C and showed higher EC as compared to the tolerant accessions.
The effects of heatstress on important traits were also investigated in five classes of wheat accessions, namely, highly tolerant, tolerant, susceptible and highly susceptible accessions, along with national checks. Under heatstress, the reduction in CC and NDVI was more evident in susceptible accessions as compared to tolerant. However, under the HS environment, MSI showed relatively higher values in susceptible accessions. CTD revealed a significant increase in tolerant accessions as compared to the susceptible ones under the HS environment (Figure 6). However, PW and LR showed higher values in tolerant accessions under heatstress but they were not significant when compared to the NS environment. DA, FLA, GFP, TGW, HI and GY were reduced significantly both in tolerant and susceptible accessions under heatstress. However, PH, PL and SL showed a non-significant reduction in tolerant accessions under the HS environment.

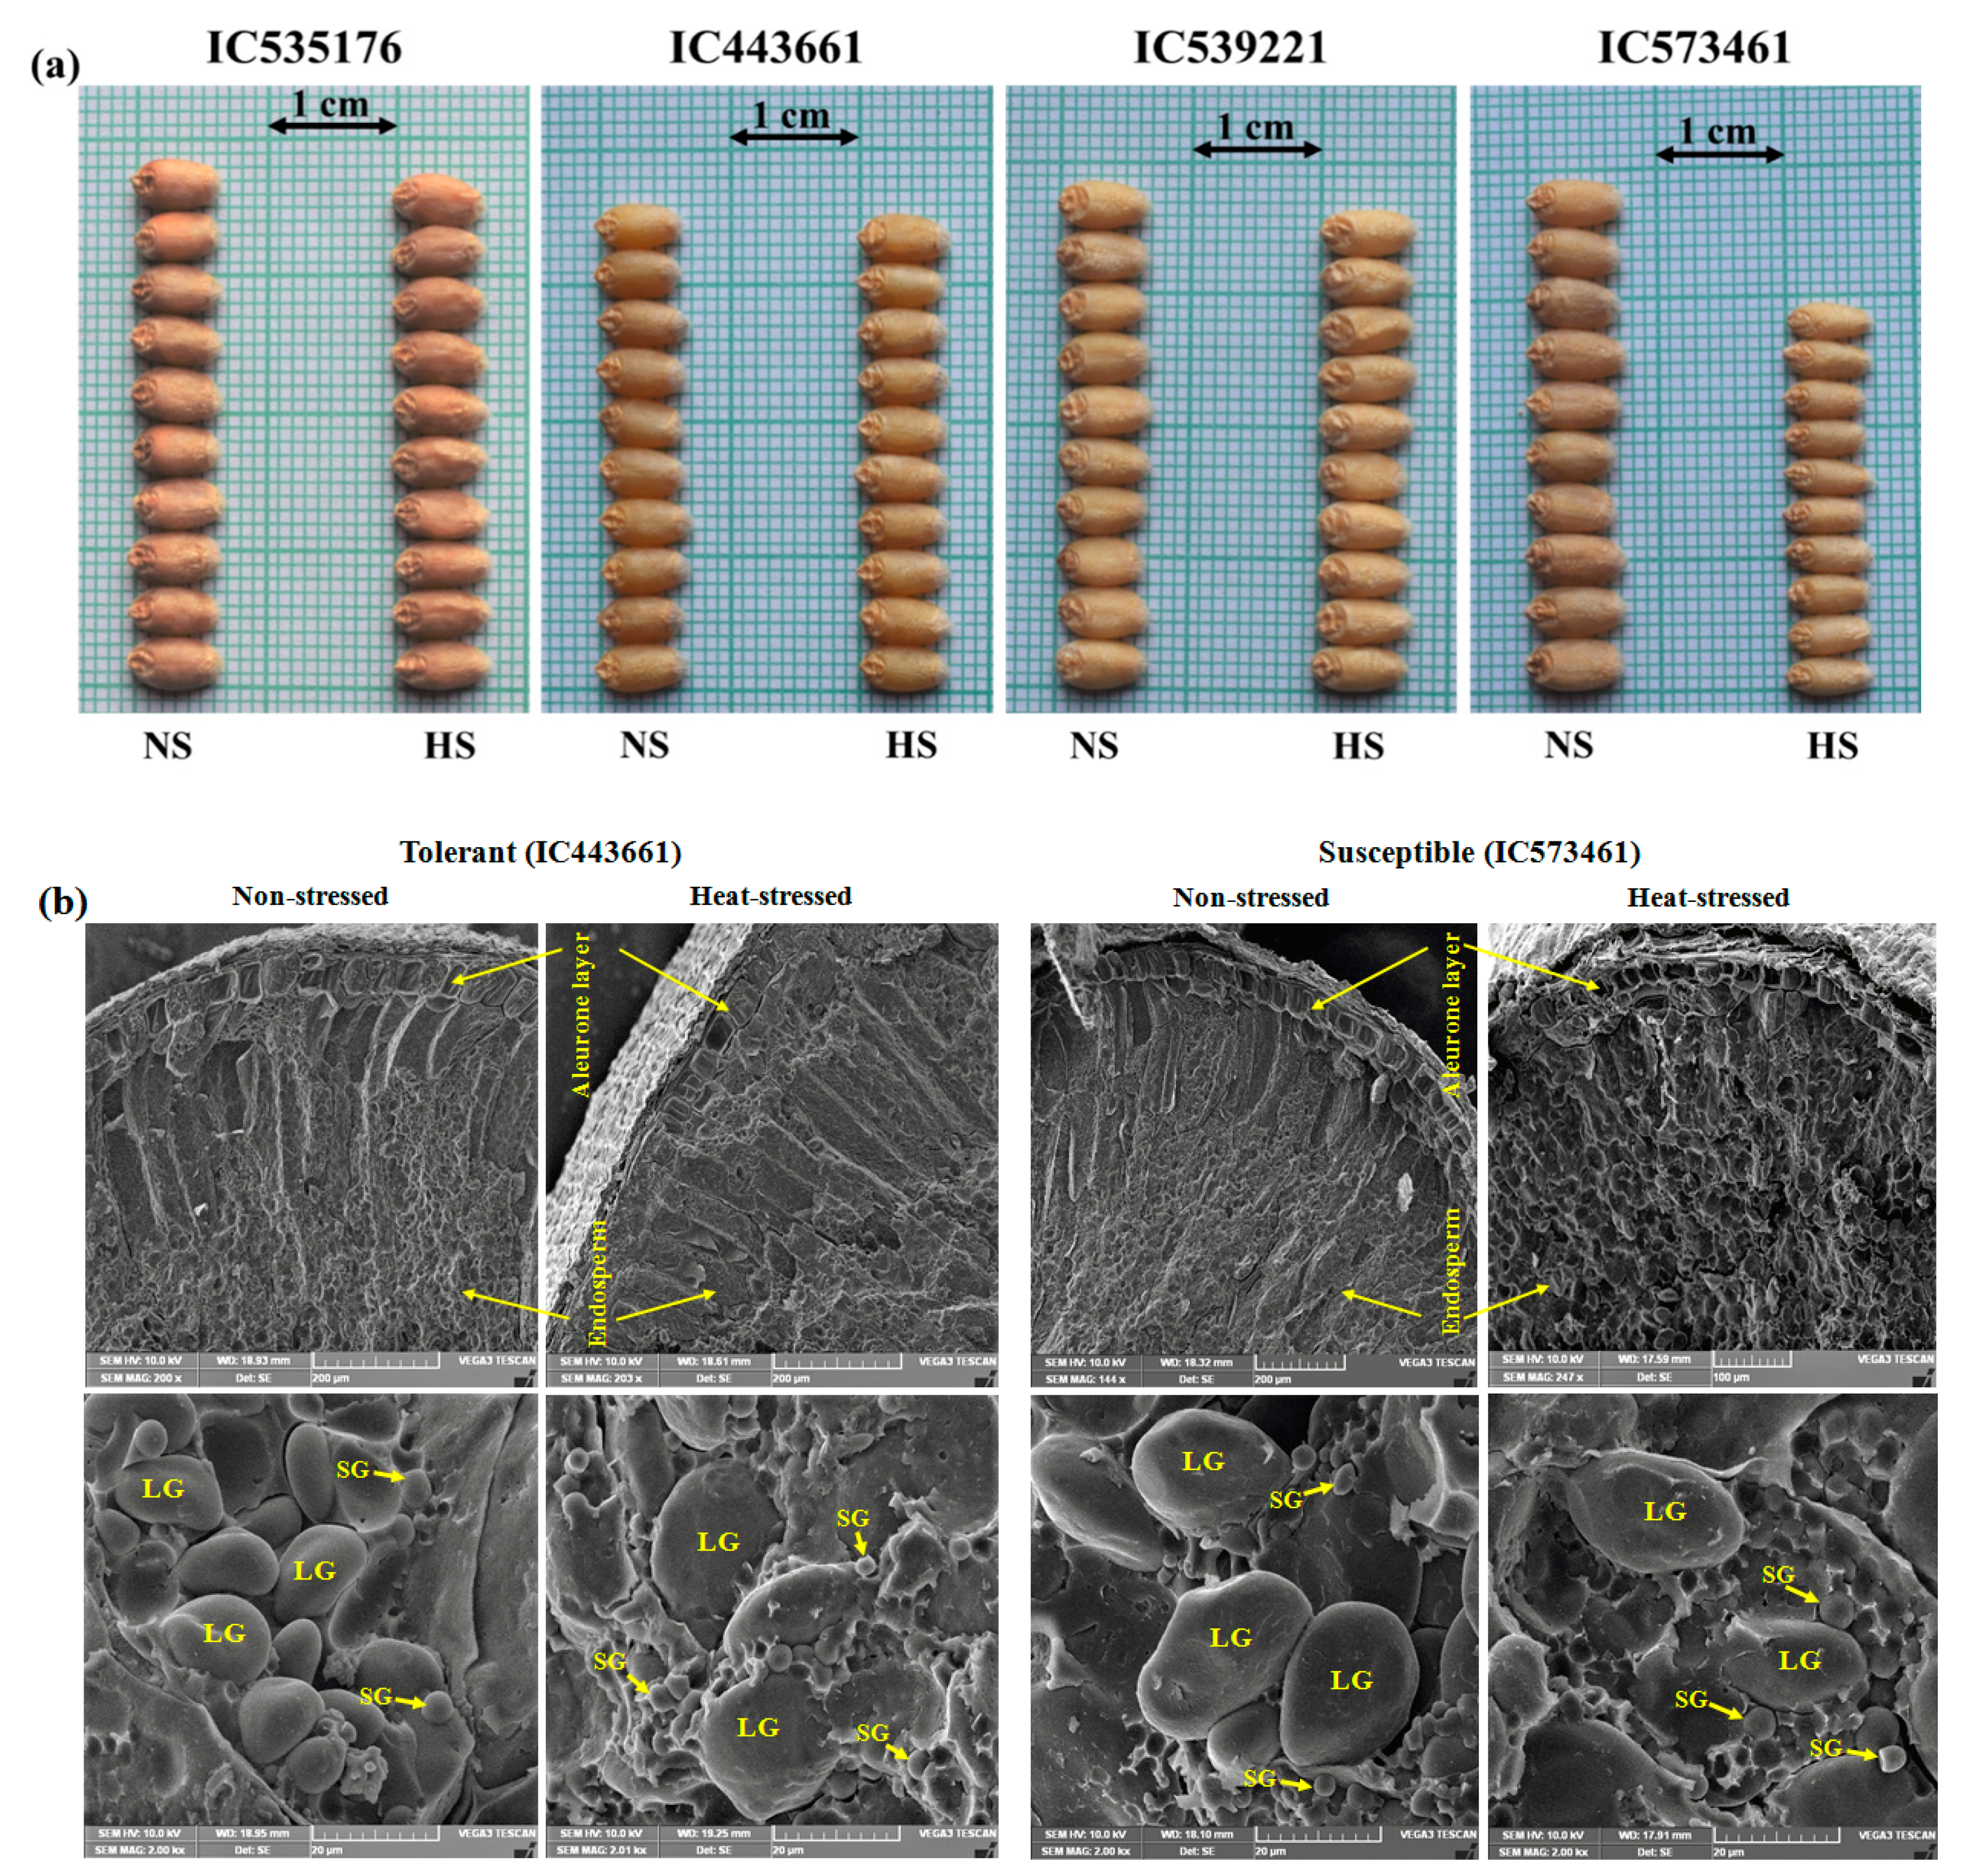
3.6. Impact of HeatStress on Wheat Grains

Heatstress reduced GW, GL and TGW in all the accessions. However, the effect of heatstress on grain traits was more evident in susceptible than tolerant accessions (Figure 7). The reduction in GW was significantly high in the susceptible compared to tolerant accessions (Figure 7a). SEM analyses of the aleurone layer and endosperm were carried out in mature wheat grains of heat-tolerant and -susceptible accessions grown in NS and HS environments (Figure 7b). The heatstress during GFP adversely affected the aleurone layer and endosperm of wheat grains. The concentration and morphology of starch granules changed under heat stress. The size, shape and structure of the aleurone layer and starch granules of heat-stress-tolerant grains were quite different from the heat-stress-susceptible genotypes. The aleurone layer was destructured in the susceptible accessions (Figure 7b, upper panel).
The heatstress showed adverse effects on the structure and packing of starch granules. Robust, bold and well-structured large starch granules (LG) were observed in both the heat-stress-tolerant and -susceptible accessions under the NS environment, whereas unstructured, shriveled LG with a prominence of small starch granules (SG) were present in the wheat grains developed under the HS environment. The density of LG (A-type; 15–35 µm) was higher in both heat-stress-tolerant and -susceptible accessions in the NS environment, whereas, in the HS environment, the density of LG reduced slightly in tolerant accessions while it was considerably reduced in the susceptible accessions. The density of SG (B-type; 2–8 µm) was higher in both tolerant and susceptible accessions under the heatstress.

3.7. Selection of Heat-Stress-Adapted Germplasm

Grain yield and TGW were used for a stability analysis using four environment datasets. ANOVA showed significant differences (p < 0.01) among accessions (=Genotype, G) and environments (E) for both the traits (Supplementary Table S5). The grain yield exhibited significant interactions for G × E, G × E (Linear), E + (G × E) and E (Linear). However, TGW revealed significant interactions for E + (G × E) and E (Linear), but non-significant interactions for G × E and G × E (Linear). On the basis of the mean performance, regression coefficient (βi) and HSI, wheat accessions were classified as adapted to the unfavorable (HS) environment, favorable (NS) environment or both environments (Table 3; Figure 8). Accessions IC566223, IC529207, IC335792, IC535176, EC576707, IC128454, IC416019, IC446713, IC265318, IC252348, IC401976, IC075240 and IC539531 performed well under the HS environment and were identified as highly tolerant genotypes. Accessions IC252431, IC277741, EC190899, CUO/79/Pru11A, EC277134, IC524299, IC553599, EC576585, IC573461 and EC576066 performed poorly in the HS environment, and are highly susceptible.
Five accessions, namely, IC393878, IC416018, IC539221, EC534487 and IC443661, performed well under both the environments, and are called general adapters. Likewise, stability for TGW revealed that some accessions were well adapted to HS, NS or both environments (Table 3, Figure 8).
The details of mean performance and stability parameters of 96 wheat accessions for TGW and grain yield are provided in Supplementary Table S6. The accessions showing a higher mean than the population mean, regression coefficient (βi) < 1 and HSI < 0.5 and producing >500 g of grain yield were considered as highly tolerant genotypes (Supplementary Table S7). The top 10 accessions were screened out for various morpho—physiological, yield and contributing traits under both NS and HS environments (Supplementary Table S8).
We selected germplasm lines based on their performance under the HS environment as potential parents for the development of bi-parent and MAGIC (Multi-Parent Advanced Generation Inter-Cross) populations (Table 4). Accessions, which showed extreme phenotypes under the HS environment, were chosen as potential parents for the creation of trait-specific bi-parent mapping populations. However, for the selection of promising parents for four-parent and eight-parent MAGIC populations, accessions showing the highest expression of yield and its associated morpho-physiological traits were considered.

4. Discussion

The production and productivity of bread wheat are adversely affected due to terminal-heat stress as a result of delayed sowing in many parts of India [21]. We evaluated a diverse set of 96 accessions of bread wheat to analyze the plant responses to heatstress, and their effects on morpho-physiological and yield-related traits. Proper endosperm development under heatstress is the key to maintain TGW, yield level and grain quality in wheat, and to facilitate the selection of superior and stable genotypes under an HS environment [36,51]. The heatstress imposed by sowing the wheat trial in a very late condition during the first week of January in both years created a unique environment to test germplasm for heat-stress tolerance. Delayed-sown wheat is exposed to higher temperatures at reproductive and grain filling stages, and this is a widely used strategy to screen germplasm for yield and other traits under heatstress [52,53]. Yield, a complex quantitative trait, is the endproduct of many interactions between genes for physiological and yield component traits. Heatstress has a wide range of effects on plants in terms of physiological, biochemical and gene regulation pathways [54].

4.1. Trait Variability and Impact of HeatStress

The wheat accessions showed a varied response to heatstress and provided an ample scope for the selection of trait-specific accessions. We observed a high level of variability in the germplasm accessions. A non-significant genotype × year (G × Y) interaction for most of the traits reveals that accessions had similar expressions in both the years. The significant G × Y interactions for NDVI in both environments; TGW under NS; and PH, PL, SL and GL under the HS environment suggest that accessions performed differently over the years for these traits. Our results corroborate earlier studies [35,55], which also reported varied responses of these traits and their interactions with the environment. The heat-adapted genotypes with the best yielding ability also possessed a high early biomass, high grain filling rates and a low canopy temperature [56].
The response to heat stress involves physiological adaptations, required to protect vital cellular functions like photosynthesis and homeostasis of metabolites [54,57]. The heatstress had an adverse effect on crop growth and development, and it consequently negatively affected morphological and yield-related traits, namely, DA, PH, PL, FLA, GFP, SL, NSS, HI, GL, GW, TGW and GY. Physiological traits, viz., CC, NDVI and MSI, were reduced, whereas CTD, PW and LR were enhanced, under the HS environment. The reduction in the above traits was more prominent in the susceptible accessions. Such a reduction in morphological and yield traits was also reported in earlier studies [28,36,37,53]. A CTD analysis is a reliable and non-invasive method for selecting heat-tolerant lines [58]. Like this study, a reduction in days to heading, GFP, PH, HI, TGW and GY under heatstress was also observed earlier [28,36]. The extent of reduction for a given trait varied in these studies due to the use of a different set of genotypes and test conditions. The yield and its component traits are more severely affected with the increase in heat stress. The yield parameters were also reduced in the plants exposed to heatstress in wheat landraces [59]. Recently, in India, areduction in DA, MSI and yield traits was reported in late-sown wheat [60]. This study also observed that HSI was the lowest in the heat-tolerant germplasm and supports our observations. A higher leaf waxiness under an HS condition was also reported earlier [25], supporting our results of an increased waxiness under heatstress, which protects a plant against excess radiation and water loss through the reflection of visible and infrared wave lengths [61]. The heritability of waxiness is low because of significant G × E interactions [62]. Genotypes with the stay-green trait performed better under heat stress and could be used for heat stress tolerance breeding [63].

4.2. Association of Grain Yield with Other Traits

Grain yield, a complex quantitative trait, is controlled by many interactions between morphological, physiological and related parameters. Under the HS environment, the yield showed positive correlations with GFP, HI, GW, PW and LR. The positive correlation of yield with GFP reveals that a longer grain development period is a vital factor for improving yield under heatstress. In a previous study [36], grain yield and HI showed a positive correlation with TGW under both normal and terminal-heat stress conditions, whereas GFP was positively associated with TGW only under the heatstress. This study advocates that the selection for a low TGW reduction is an indirect criterion to identify high yielding lines under terminal heatstress. In our study, TGW revealed an association with yield only under the NS environment. However, another study [64] reported an association of TGW with yield under both optimal and HS environments. A positive association of yield with GFP and TGW was also reported under heatstress [65]. There was a non-significant association of grain yield with DA, PH and TGW in the present study under the HS environment, which confirms the results of an earlier study [53]. Hence, the focus should be on the traits showing a high association with yield under the HS environment for the selection of heat-tolerant lines.
In our study, CC did not show an association with GY, but CTD revealed a significant association with GY only under the heatstress. Similarly, Elbasyoni [35] also observed no correlation between CC and GY. However, a high correlation of both CTD and CC with GY under heatstress was reported earlier [24,66]. High genetic variations for CC and TGW along with a positive association between these two traits were found under a heat- stress condition in elite winter wheat lines [67]. Similarly, an association of CTD with GY was also observed under both NS and HS environments [23]. Under heatstress, GY displayed a strong positive correlation with both CTD and days to heading [68,69,70]. The longer time before heading enables the development of large spikes with extra spikelets producing more grains per plant. The association studies reveal that grain yield in wheat correlates positively with some physiological and yield-related traits under heat stress. Thus, the selection of these traits could be vital for heat-stress-tolerance breeding.

4.3. Grain Development under Heat Stress

Heat stress during GFP adversely affects the grain size in bread wheat. In our study, the effect of heatstress on GW was more severe as compared to GL, which resulted in shriveled grains in susceptible accessions. The development of shriveled grains in the susceptible accessions was due to changes in the ultrastructure of aleurone cells and starch granules in endosperm. Our findings on grain development under heatstress corroborate a recent study [71], wherein they observed a severe effect of heatstress on grain traits like GL, GW and grain area along with starch synthesis. The effect of heatstress shows a significantly reduced GW and perimeter. The endosperm of mature wheat grain contains two types of starch granules: large (10–35 µm) A-type and small (1–10 µm) B-type [72,73]. The density and size of the large type of starch granules were slightly reduced in the tolerant accessions while these were reduced considerably in the susceptible accessions under the HS environment. The concentration of small starch granules was higher in both the heat-tolerant and -susceptible accessions under the HS environment. Our findings on the size and density of starch granules are supported by a previous study [74], which reported that the ratio of large and small starch granules decreases significantly under heatstress and this limits the potential sink size for dry matter deposition in wheat grains. Heat stress during GFP triggers ultrastructural changes in the aleurone layer and endosperm, and causes disordered cells, grain shrinkage and a reduced TGW in susceptible genotypes [31].
Grain development is influenced by various metabolic processes occurring in leaves, mainly the production and translocation of photoassimilates and importing of precursors for the biosynthesis of grain reserves, minerals and other functional constituents [75]. Hence, it is crucial to know the physiological, biochemical and genetic mechanisms that govern the grain development events under heatstress to devise strategies for yield enhancement in wheat. The identification and selection of germplasm lines with a higher yield and grain weight along with an early maturity, semi-tall plant height, higher NDVI during GFP and higher CC at the milky stage ought to be the hallmark of breeding strategies for heat-stress tolerance [53,64]. Harnessing the genetic variability for these traits in the germplasm is vital for the breeding of heat-stress-tolerant cultivars.

4.4. Yield Stability and Selection of Heat-Adapted Accessions

Heat-stress adaptation is a complex phenomenon and is influenced by several factors such as the genotype and its interaction with the environment over a long period of time. A wheat plant achieves adaptation through variation in phenology and other related traits determining the plant architecture [42]. Hence, it is crucial to understand genes that underpin the variations in plant phenology and physiology, and their interactions with other genes and the environment. The yield stability across the environments is a reliable criterion for the selection of heat-stress-adapted germplasm [41,76]. Climate-change- associated global warming has severely affected yield stability in cereal crops [77]. G×E interactions are of major importance to a plant breeder for developing improved varieties. We used a stability analysis [50] to identify stable and better yielding accessions under heatstress. The better-performing accessions in the HS environment might be used as donor parents for a heat-stress-adaptation breeding program for the IGP region. A similar study was carried out to select superior yielding lines under heatstress [35]. However, G×E interaction biplots were used to select genotypes with a stable performance across all environments [19,29]. A selection strategy was also suggested to improve adaptation to heat stress in bread wheat [53]. Heat stress significantly affects all the yield contributing traits and TGW, an important trait for the selection of tolerant lines. The heat-tolerant lines with a high grain yield could be selected using HSI and stability analyses [78]. The stable and higher yielding accessions identified under the HS environment could be utilized in breeding programs for the development of heatstress-tolerant wheat cultivars.

5. Conclusions

Wheat genetic resources used in the present study represent a part of the reference set for heat-stress tolerance and hence exhibited a high extent of genetic variability for morpho-physiological and yield-related traits. The terminal-heatstress in the late-sown bread wheat crop negatively affected grain yield and its contributing traits. The higher temperature than the optimum temperature during GFP reduced the grain size, and eventually decreased TGW and grain yield under the HS environment. The ultrastructural analysis of matured grains showed that the decrease in size and density of large starch granules in endosperm is the main cause of the yield and TGW reduction in the heat- stress-susceptible accessions. The high yielding accessions possessing desirable morpho- physiological traits and adaptation to the HS environment were identified and selected, which could be utilized for the development of mapping populations and the genetic improvement of bread wheat for heat tolerance.

Supplementary Materials

The following supporting information can be downloaded at: https://www.mdpi.com/article/10.3390/plants12152851/s1, Figure S1: Geo-referencing map of bread wheat accessions, Figure S2: Frequency distribution of 96 bread wheat accessions for 12 important morpho-physiological and yield contributing traits, Table S1: Passport details of 96 bread wheat accessions, Table S2: ANOVA for combined ABD data of 18 traits under NS and HS environments, Tables S3 and S4: Combined adjusted mean values for 18 traits under NS and HS environment, respectively, Table S5: ANOVA for TGW and GY based on stability analysis, Table S6: Mean performance and stability parameters for TGW and GY, Table S7: Identified heat-stress-tolerant and -susceptible wheat accessions, Table S8: Promising accessions selected for different traits for NS and HS environments.

Author Contributions

M.C.Y. conceptualized and validated the study. A.P. performed experiments and recorded field and lab data. J.K. provided germplasm and analyzed quantitative data. S.T. curated data. G.C. performed the ultrastructural analysis of wheat grains. M.C.Y. and A.P. wrote and prepared the original draft and finalized the manuscript. J.K. and V.P. reviewed and edited the manuscript. M.C.Y. supervised the study, administered the project and acquired funding. All authors contributed to the research article and approved the submitted version. All authors have read and agreed to the published version of the manuscript.

Funding

The first author is grateful to the Director of the ICAR-Indian Agricultural Research Institute, New Delhi, for granting a senior research fellowship during Ph.D. study. This work was funded by the ICAR Network Project on National Innovations in Climate Resilient Agriculture “Focused collection of climate-smart germplasm of rice and wheat, their valuation and genetic enhancement through pre-breeding for abiotic stress tolerance” with the scheme code 13921 and project number 1006607.

Institutional Review Board Statement

Not applicable.

Informed Consent Statement

Not applicable.

Data Availability Statement

The original contributions are included in the article/supplementary files. Further queries can be directed to the corresponding author.

Conflicts of Interest

The authors declare no conflict of interest.

References

  1. Acevedo, M.; Zurn, J.D.; Molero, G.; Singh, P.; He, X.; Aoun, M.; McCandless, L. The role of wheat in global food security. In Agricultural Development and Sustainable Intensification: Technology and Policy Challenges in the Face of Climate Change, 1st ed.; Routledge: New York, NY, USA, 2018; pp. 81–110. [Google Scholar] [CrossRef]
  2. Shiferaw, B.; Smale, M.; Braun, H.J.; Duveiller, E.; Reynolds, M.; Muricho, G. Crops that feed the world 10. Past successes andfuture challenges to the role played by wheat in global food security. Food Sec. 2013, 5, 291–317. [Google Scholar] [CrossRef] [Green Version]
  3. Shewry, P.R.; Hey, S.J. The contribution of wheat to human diet and health. Food Energy Secur. 2015, 4, 178–202. [Google Scholar] [CrossRef] [PubMed]
  4. FAO. World Food and Agriculture–Statistical Yearbook; FAO: Rome, Italy, 2022. [Google Scholar] [CrossRef]
  5. CIMMYT. FFAR Grant Develops Climate-Resilient Wheat. CIMMYT Press Release 11 January 2021. Available online: https://www.cimmyt.org/news/ffar-grant-develops-climate-resilient-wheat/ (accessed on 25 January 2021).
  6. Lobell, D.B.; Schlenker, W.; Costa-Roberts, J. Climate trends and global crop production since 1980. Science 2011, 333, 616–620. [Google Scholar] [CrossRef] [PubMed] [Green Version]
  7. Wheeler, T.; von Braun, J. Climate change impacts on global food security. Science 2013, 341, 508–513. [Google Scholar] [CrossRef]
  8. FAO. The Future of Food and Agriculture–Trends and Challenges; Food and Agriculture Organization of the United Nations: Rome, Italy, 2017; p. 151. [Google Scholar]
  9. Wang, P.; Deng, X.; Jiang, S. Global warming, grain production and its efficiency: Case study of major grain production region. Ecol. Indic. 2018, 105, 563–570. [Google Scholar] [CrossRef]
  10. Liu, B.; Asseng, S.; Müller, C.; Ewert, F.; Elliott, J.; Lobell, D.B.; Martre, P.; Ruane, A.C.; Wallach, D.; Jones, J.W.; et al. Similar estimates of temperature impacts on global wheat yield by three independent methods. Nat. Clim. Change 2016, 6, 1130–1136. [Google Scholar] [CrossRef]
  11. McCouch, S.R.; Navabi, Z.K.; Abberton, M.; Anglin, N.L.; Barbieri, R.L.; Baum, M.; Bett, K.; Booker, H.; Brown, G.L.; Bryan, G.J.; et al. Mobilizing crop biodiversity. Mol. Plant 2020, 13, 1341–1344. [Google Scholar] [CrossRef]
  12. Reynolds, M.; Tattaris, M.; Cossani, C.M.; Ellis, M.; Yamaguchi-Shinozaki, K.; Pierre, C.S. Exploring genetic resources to increase adaptation of wheat to climate change. In Advances in Wheat Genetics: From Genome to Field; Ogihara, Y., Takumi, S., Handa, H., Eds.; Springer: Tokyo, Japan, 2015; pp. 355–368. [Google Scholar] [CrossRef] [Green Version]
  13. Mujeeb-Kazi, A.; Kazi, A.G.; Dundas, I.; Rasheed, A.; Ogbonnaya, F.; Kishii, M.; Bonnett, D.; Wang, R.R.C.; Xu, S.; Chen, P.; et al. Genetic diversity for wheat improvement as a conduit to food security. Adv. Agron. 2013, 122, 179–257. [Google Scholar] [CrossRef]
  14. Matsuoka, Y. Evolution of polyploid Triticum wheats under cultivation: The role of domestication, natural hybridization and allopolyploid speciation in their diversification. Plant Cell Physiol. 2011, 52, 750–764. [Google Scholar] [CrossRef] [Green Version]
  15. Tadesse, W.; Sanchez-Garcia, M.; Assefa, S.G.; Amri, A.; Bishaw, Z.; Ogbonnaya, F.C.; Baum, M. Genetic gains in wheat breeding and its role in feeding the world. Crop Breed. Genet. Genom. 2019, 1, e190005. [Google Scholar] [CrossRef] [Green Version]
  16. Singh, S.; Vikram, P.; Sehgal, D.; Burgueño, J.; Sharma, A.; Singh, S.K.; Sansaloni, C.P.; Joynson, R.; Brabbs, T.; Ortiz, C.; et al. Harnessing genetic potential of wheat germplasm banks through impact-oriented-prebreeding for future food and nutritional security. Sci. Rep. 2018, 8, 12527. [Google Scholar] [CrossRef] [PubMed] [Green Version]
  17. Ortiz, R.; Sayre, K.D.; Govaerts, B.; Gupta, R.; Subbarao, G.V.; Ban, T.; Hodson, D.; Dixon, J.M.; Ortiz-Monasterio, J.I.; Reynolds, M. Climate change: Can wheat beat the heat? Agric. Ecosyst. Environ. 2008, 126, 46–58. [Google Scholar] [CrossRef]
  18. Farooq, M.; Bramley, H.; Palta, J.A.; Siddique, K.H. Heat stress in wheat during reproductive and grain-filling phases. Crit. Rev. Plant Sci. 2011, 30, 491–507. [Google Scholar] [CrossRef]
  19. Rane, J.; Pannu, R.K.; Sohu, V.S.; Saini, R.S.; Mishra, B.; Shoran, J.; Crossa, J.; Vargas, M.; Joshi, A.K. Performance of yield and stability of advanced wheat genotypes under heat stress environments of the Indo-Gangetic plains. Crop Sci. 2007, 47, 1561–1573. [Google Scholar] [CrossRef]
  20. Kumar, S.N.; Aggarwal, P.K.; Rani, D.N.S.; Saxena, R.; Chauhan, N.; Jain, S. Vulnerability of wheat production to climate change in India. Clim. Res. 2014, 59, 173–187. [Google Scholar] [CrossRef]
  21. Joshi, A.K.; Mishra, B.; Chatrath, R.; Ortiz -Ferrara, G.; Singh, R.P. Wheat improvement in India: Present status, emerging challenges and future prospects. Euphytica 2007, 157, 431–446. [Google Scholar] [CrossRef]
  22. Lobell, D.B.; Burke, M.B.; Tebaldi, C.; Mastrandrea, M.D.; Falcon, W.P.; Naylor, R.L. Prioritizing climate change adaptation needs for food security in 2030. Science 2008, 319, 607–610. [Google Scholar] [CrossRef]
  23. Mondal, S.; Singh, R.P.; Crossa, J.; Huerta-Espino, J.; Sharma, I.; Chatrath, R.; Singh, G.P.; Sohu, V.S.; Mavi, G.S.; Sukuru, V.S.P.; et al. Earliness in wheat: A key to adaptation under terminal and continual high temperature stress in South Asia. Field Crops Res. 2013, 151, 19–26. [Google Scholar] [CrossRef]
  24. Reynolds, M.P.; Ortiz-Monasterio, J.I.; McNab, A. Application of Physiology in Wheat Breeding; D.F. CIMMYT: Texococo, Mexico, 2001. [Google Scholar]
  25. Huggins, T.D.; Mohammed, S.; Sengodon, P.; Ibrahim, A.M.H.; Tilley, M.; Hays, D.B. Changes in leaf epicuticular wax load and its effect on leaf temperature and physiological traits in wheat cultivars (Triticum aestivum L.) exposed to high temperatures during anthesis. J. Agro. Crop Sci. 2018, 204, 49–61. [Google Scholar] [CrossRef]
  26. Fokar, M.; Nguyen, H.T.; Blum, A. Heat tolerance in spring wheat. I. Estimating cellular thermotolerance and its heritability. Euphytica 1998, 104, 1–8. [Google Scholar] [CrossRef]
  27. Zhao, H.; Dai, T.; Jing, Q.; Jiang, D.; Cao, W. Leaf senescence and grain filling affected by post-anthesis high temperatures in two different wheat cultivars. Plant Growth Regul. 2007, 51, 149–158. [Google Scholar] [CrossRef]
  28. Mondal, S.; Singh, R.P.; Huerta-Espino, J.; Kehel, Z.; Autrique, E. Characterization of heat- and drought-stress tolerance in high-yielding spring wheat. Crop Sci. 2015, 55, 709. [Google Scholar] [CrossRef]
  29. Telfer, P.; Edwards, J.; Bennett, D.; Ganesalingam, D.; Able, J.; Kuchel, H. A field and controlled environment evaluation of wheat (Triticum aestivum) adaptation to heat stress. Field Crops Res. 2018, 229, 55–65. [Google Scholar] [CrossRef]
  30. Jenner, C.F. Starch synthesis in the kernel of wheat under high temperature conditions. Aust. J. Plant Physiol. 1994, 21, 791–806. [Google Scholar] [CrossRef]
  31. Dias, A.S.; Bagulho, A.S.; Lidon, F.C. Ultrastructure and biochemical traits of bread and durum wheat grains under heat stress. Braz. J. Plant Physiol. 2008, 20, 323–333. [Google Scholar] [CrossRef] [Green Version]
  32. Keeling, P.L.; Bacon, P.J.; Holt, D.C. Elevated temperature reduces starch deposition in wheat endosperm by reducing the activity of soluble starch synthase. Planta 1993, 191, 342–348. [Google Scholar] [CrossRef]
  33. Shah, N.H.; Paulsen, G.M. Interaction of drought and high temperature on photosynthesis and grain-filling of wheat. Plant Soil 2003, 257, 219–226. [Google Scholar] [CrossRef]
  34. Cossani, C.M.; Reynolds, M.P. Physiological traits for improving heat tolerance in wheat. Plant Physiol. 2012, 160, 1710–1718. [Google Scholar] [CrossRef] [Green Version]
  35. Elbasyoni, I.S. Performance and stability of commercial wheat cultivars under terminal heat stress. Agronomy 2018, 8, 37. [Google Scholar] [CrossRef] [Green Version]
  36. Sharma, R.C.; Tiwary, A.K.; Ortiz-Ferrara, G. Reduction in kernel weight as a potential indirect selection criterion for wheat grain yield under terminal heat stress. Plant Breed. 2008, 127, 241–248. [Google Scholar] [CrossRef]
  37. Fleitas, M.C.; Mondal, S.; Gerard, G.S.; Hernández-Espinosa, N.; Singh, R.P.; Crossa, J.; Guzmán, C. Identification of CIMMYT spring bread wheat germplasm maintaining superior grain yield and quality under heat-stress. J. Cereal Sci. 2020, 93, 102981. [Google Scholar] [CrossRef]
  38. Asseng, S.; Ewert, F.; Martre, P.; Rötter, R.P.; Lobell, D.B.; Cammarano, D.; Kimball, B.A.; Ottman, M.J.; Wall, G.W.; White, J.W.; et al. Rising temperatures reduce global wheat production. Nat. Clim. Chang. 2015, 5, 143–147. [Google Scholar] [CrossRef]
  39. Ray, D.K.; Gerber, J.S.; MacDonald, G.K.; West, P.C. Climate variation explains a third of global crop yield variability. Nat. Comm. 2015, 6, 5989. [Google Scholar] [CrossRef] [Green Version]
  40. Abdelrahman, M.; Burritt, D.J.; Gupta, A.; Tsujimoto, H.; Tran, L.S.P. Heat stress effects on source–sink relationships and metabolome dynamics in wheat. J. Exp. Bot. 2020, 71, 543–554. [Google Scholar] [CrossRef] [PubMed]
  41. Kang, M.S.; Prabhakaran, V.T.; Mehra, R.B. Genotype-by-environment interaction incrop improvement. In Plant Breeding-Mendelian to Molecular Approaches; Jain, H.K., Kharkwal, M.C., Eds.; Narosa Publishing House: New Delhi, India, 2004; pp. 535–572. [Google Scholar]
  42. Hyles, J.; Bloomfield, M.T.; Hunt, J.R.; Trethowan, R.M.; Trevaskis, B. Phenology and related traits for wheat adaptation. Heredity 2020, 125, 417–430. [Google Scholar] [CrossRef]
  43. Phogat, B.S.; Kumar, S.; Kumari, J.; Kumar, N.; Pandey, A.C.; Singh, T.P.; Kumar, S.; Tyagi, R.K.; Jacob, S.R.; Singh, A.K.; et al. Characterization of wheat germplasm conserved in the Indian National Genebank and establishment of a composite core collection. Crop Sci. 2021, 61, 604–620. [Google Scholar] [CrossRef]
  44. Hijmans, R.J.; Guarino, L.; Cruz, M.; Rojas, E. Computer tools for spatial analysis of plant genetic resources data: 1. DIVA-GIS. Plant Genet. Resour. Newslett. 2001, 127, 15–19. [Google Scholar]
  45. Pask, A.J.D.; Pietragalla, J.; Mullan, D.M.; Reynolds, M.P. Physiological Breeding II: A Field Guide to Wheat Phenotyping; D.F. CIMMYT: Texococo, Mexico, 2012. [Google Scholar]
  46. SAS Institute. Statistical Analysis System for Windows, Version 9.4; SAS Institute Inc.: Cary, NC, USA, 2013.
  47. IBM SPSS. IBM SPSS (Statistical Package for the Social Sciences) Statistics Software for Windows, Version 20.0; IBM Corp.: Armonk, NY, USA, 2011. Available online: https://hadoop.apache.org (accessed on 15 January 2021).
  48. Fischer, R.A.; Maurer, R. Drought resistance in spring wheat cultivars. I. Grain yield responses. Aust. J. Agr. Res. 1978, 29, 897–912. [Google Scholar] [CrossRef]
  49. Shannon, C.E.; Weaver, W. The Mathematical Theory of Communication; University of Illinois Press: Urbana, IL, USA, 1949. [Google Scholar]
  50. Eberhart, S.A.; Russell, W.A. Stability parameters for comparing varieties. Crop Sci. 1966, 6, 36–40. [Google Scholar] [CrossRef] [Green Version]
  51. Mondal, S.; Rutkoski, J.E.; Velu, G.; Singh, P.K.; Crespo-Herrera, L.A.; Guzman, C.; Bhavani, S.; Lan, C.; He, X.; Singh, R.P. Harnessing diversity in wheat to enhance grain yield, climate resilience, disease and insect pest resistance and nutrition through conventional and modern breeding approaches. Front. Plant Sci. 2016, 7, 991. [Google Scholar] [CrossRef] [Green Version]
  52. Dwivedi, S.K.; Basu, S.; Kumar, S.; Kumar, G.; Prakash, V.; Kumar, S.; Mishra, J.S.; Bhatt, B.P.; Malviya, N.; Singh, G.P.; et al. Heat stress induced impairment of starch mobilisation regulates pollen viability and grain yield in wheat: Study in eastern Indo-Gangetic Plains. Field Crops Res. 2017, 206, 106–114. [Google Scholar] [CrossRef]
  53. Ullah, S.; Bramley, H.; Mahmood, T.; Trethowan, R. A strategy of ideotype development for heat-tolerant wheat. J. Agro. Crop Sci. 2020, 206, 229–241. [Google Scholar] [CrossRef]
  54. Bita, C.; Gerats, T. Plant tolerance to high temperature in a changing environment: Scientific fundamentals and production of heat stress-tolerant crops. Front. Plant Sci. 2013, 4, 273. [Google Scholar] [CrossRef] [PubMed] [Green Version]
  55. Gowda, D.S.S.; Singh, G.P.; Singh, A.M. Relationship between canopy temperature depression, membrane stability, relative water content and grain yield in bread wheat (Triticum aestivum) under heat-stress environments. Indian J. Agric. Sci. 2011, 81, 197–202. [Google Scholar]
  56. Pinto, R.S.; Molero, G.; Reynolds, M.P. Identification of heat tolerant wheat lines showing genetic variation in leaf respiration and other physiological traits. Euphytica 2017, 213, 76. [Google Scholar] [CrossRef]
  57. Wahid, A.; Gelani, S.; Ashraf, M.; Foolad, M.R. Heat tolerance in plants: An overview. Environ. Exp. Bot. 2007, 61, 199–223. [Google Scholar] [CrossRef]
  58. Lepekhov, S.B. Canopy temperature depression for drought- and heat stress tolerance in wheat breeding. Vavilov J. Genet. Breed. 2022, 26, 196–201. [Google Scholar] [CrossRef]
  59. Tomás, D.; Coelho, L.P.; Rodrigues, J.C.; Viegas, W.; Silva, M. Assessment of four Portuguese wheat landrace diversity to cope with global warming. Front. Plant Sci. 2020, 11, 594977. [Google Scholar] [CrossRef]
  60. Agarwal, V.P.; Gupta, N.K.; Gupta, S.; Singh, G. Screening of wheat germplasm for terminal heat tolerance under hyper-arid conditions. Cereal Res. Commun. 2021, 49, 375–383. [Google Scholar] [CrossRef]
  61. Shepherd, T.; Griffiths, D.W. The effects of stress on plant cuticular waxes. New Phytol. 2006, 171, 469–499. [Google Scholar] [CrossRef]
  62. Mohammed, S.; Huggins, T.D.; Beecher, F.; Chick, C.; Sengodon, P.; Mondal, S.; Paudel, A.; Ibrahim, A.M.; Tilley, M.; Hays, D.B. The role of leaf epicuticular wax in the adaptation of wheat (Triticum aestivum L.) to high temperatures and moisture deficit conditions. Crop Sci. 2018, 58, 679–689. [Google Scholar] [CrossRef]
  63. Soni, A.; Munjal, R. Characterisation and evaluation of wheat genetic resources for heat stress tolerance using stay-green traits. Crop Pasture Sci. 2023. [Google Scholar] [CrossRef]
  64. Mondal, S.; Dutta, S.; Crespo-Herrera, L.; Huerta-Espino, J.; Braun, H.J.; Singh, R.P. Fifty years of semi-dwarf spring wheat breeding at CIMMYT: Grain yield progress in optimum, drought and heat stress environments. Field Crops Res. 2020, 250, 107757. [Google Scholar] [CrossRef]
  65. Al-Ashkar, I.; Alotaibi, M.; Refay, Y.; Ghazy, A.; Zakri, A.; Al-Doss, A. Selection criteria for high-yielding and early-flowering bread wheat hybrids under heat stress. PLoS ONE 2020, 15, e0236351. [Google Scholar] [CrossRef] [PubMed]
  66. Reynolds, M.P.; Pierre, C.S.; Saad, A.S.I.; Vargas, M.; Condon, A.G. Evaluating potential genetic gains in wheat associated with stress-adaptive trait expression in elite genetic resources under drought and heat stress. Crop Sci. 2007, 47, S172–S189. [Google Scholar] [CrossRef]
  67. Fu, J.; Bowden, R.L.; Jagadish, S.V.K.; Prasad, P.V.V. Genetic variation for terminal heat stress tolerance in winter wheat. Front. Plant Sci. 2023, 14, 1132108. [Google Scholar] [CrossRef]
  68. Ayeneh, A.; van Ginkel, M.; Reynolds, M.P.; Ammar, K. Comparison of leaf, spike, peduncle and canopy temperature depression in wheat under heat stress. Field Crops Res. 2002, 79, 173–184. [Google Scholar] [CrossRef]
  69. Bahar, B.; Yildirim, M.; Yucel, C. Heat and drought resistance criteria in spring bread wheat (Triticum aestivum L.): Morpho- physiological parameters for heat tolerance. Sci. Res. Essays. 2011, 6, 2212–2220. [Google Scholar] [CrossRef] [Green Version]
  70. Lordkaew, S.; Yimyam, N.; Wongtamee, A.; Jamjod, S.; Rerkasem, B. Evaluating a heat-tolerant wheat germplasm in a heat stress environment. Plant Genet. Resour. 2019, 17, 339–345. [Google Scholar] [CrossRef]
  71. Chaubey, R.K.; Bhutia, D.D.; Navathe, S.; Mishra, V.K.; Singh, A.K.; Chand, R. Interrelationships among different grain characteristics of wheat grown under optimum and late sowing date conditions in the Eastern Indo-Gangetic plains of India. Cereal Res. Commun. 2021, 49, 449–455. [Google Scholar] [CrossRef]
  72. Chiotelli, E.; Le Meste, M. Effect of small and large wheat starch granules on thermomechanical behavior of starch. Cereal Chem. 2002, 79, 286–293. [Google Scholar] [CrossRef]
  73. Uthayakumaran, S.; Wrigley, C. Wheat: Grain-quality Characteristics and Management of Quality Requirements. In Cereal Grains-Assessing and Managing Quality; Batey, C.W.I., Miskelly, D., Eds.; Woodhead Publishing: Cambridge, UK, 2017; pp. 91–134. [Google Scholar] [CrossRef]
  74. Liu, P.; Guo, W.; Jiang, Z.; Pu, H.; Feng, C.; Zhu, X.; Peng, Y.; Kuang, A.; Little, C.R. Effects of high temperature after anthesis on starch granules in grains of wheat (Triticum aestivum L.). J. Agric. Sci. 2011, 149, 159–169. [Google Scholar] [CrossRef] [Green Version]
  75. Sehgal, A.; Sita, K.; Siddique, K.H.M.; Kumar, R.; Bhogireddy, S.; Varshney, R.K.; Hanumantharao, B.; Nair, R.M.; Prasad, P.V.; Nayyar, H. Drought or/and heat-stress effects on seed filling in food crops: Impacts on functional biochemistry, seed yields, and nutritional quality. Front. Plant Sci. 2018, 9, 1705. [Google Scholar] [CrossRef] [PubMed] [Green Version]
  76. Braun, H.J.; Atlin, G.; Payne, T. Multi-location testing as a tool to identify plant response to global climate change. In Climate Change and Crop Production; Reynolds, M.P., Ed.; CABI: Wallingford, UK, 2010; pp. 115–138. [Google Scholar]
  77. Powell, N.; Ji, X.; Ravash, R.; Edlinton, J.; Dolferus, R. Yield stability for cereals in a changing climate. Funct. Plant Biol. 2012, 39, 539–552. [Google Scholar] [CrossRef] [PubMed]
  78. Gupta, V.; Mehta, G.; Kumar, S.; Ramdas, S.; Tiwari, R.; Singh, G.P.; Sharma, P. AMMI and GGE biplot analysis of yield under terminal heat tolerance in wheat. Mol. Biol. Rep. 2023, 50, 3459–3467. [Google Scholar] [CrossRef] [PubMed]
Figure 1. Temperature and rainfall variation during grain filling period (GFP; from anthesis to physiological maturity) in both non–stressed (NS) and heat-stressed (HS) environments in wheat crop seasons of 2018–2019 and 2019–2020. RF–rainfall, Tmax—maximum temperature, Tmin—minimum temperature.
Plants 12 02851 g001
Figure 2. Adaptation to terminal heatstress by highly tolerant accessions of bread wheat germplasm during grain filling period.Comparisons ofaccession IC529207 (highly tolerant) with highest plant waxiness (score 10) (a) vs. accession IC252431 (highly susceptible) showing the least plant waxiness (score 1) (b), and accession IC416019 (highly tolerant) showing the highest leaf rolling (score 10) (c) vs. IC553599 (highly susceptible) showing the least leaf rolling (score 4) (d).
Plants 12 02851 g002
Figure 3. UPGMA dendrogram constructed with Ward’s minimum variance method for 96 bread wheat accessions using data of 18 morpho-physiological and yield-related traits recorded under heat-stress environment. Six clusters are marked on the left side of the dendrogram.
Plants 12 02851 g003
Figure 4. Pearson’s correlations coefficients (r) derived between 18 morpho-physiological and yield traits under non-stressed (a) and heat-stressed (b) environments in 96 bread wheat accessions.
Plants 12 02851 g004
Figure 5. Boxplot distribution of variability assessed for 18 morpho-physiological and yield-related traits under non-stressed (NS) and heat-stressed (HS) environments in 96 bread wheat accessions categorized based on HSI values as tolerant (HSI < 1.0) and susceptible (HSI > 1.0).
Plants 12 02851 g005
Figure 6. Effects of heatstress on important morpho-physiological and yieldtraits in tolerant and susceptible accessions of bread wheat. Reduction in CC and NDVI was more evident in highly susceptible and susceptible accessions compared to highly tolerant and tolerant accessions under HS environment (a,b). MSI was higher in highly susceptible and susceptible accessions than the tolerant accessions in HS environment (c). CTD, PW and LR increased in the tolerant accessions as compared to the susceptible ones under HS environment (df). Under heatstress, DA, PH and PL were reduced in both the tolerant and susceptible accessions (gi). GFP, FLA and SL all decreased in both tolerant and susceptible accessions under heatstress (jl). TGW, HI and GY were higher in the tolerant accessions than the susceptible ones in HS environment (mo). Levels of significance (ns p ≥ 0.05, * p < 0.05; ** p < 0.01 and *** p < 0.001) were derived using t test.
Plants 12 02851 g006
Figure 7. Impact of heatstress on grain morphology and ultrastructure as visualized with scanning electron microscopy (SEM) in tolerant and susceptible accessions of bread wheat. Reduction in grain width due to heatstress was more evident in susceptible accession IC573461 as compared to three tolerant accessions, IC535176, IC443661 and IC539221 (a). Ultrastructural changes caused by heatstress in endosperm and aleurone layer of grains in very-late-sown bread wheat accessions (b). SEM revealed ultrastructure of matured wheat grains, showing aleurone layer and endosperm ((b), upper panel; low magnification) and packing of starch granules (structure and density as seen in close-up view) in the endosperm ((b), lower panel; high magnification) in tolerant (IC443661) and susceptible (IC573461) accessions in non-stressed (NS) and heat-stressed (HS) environments.
Plants 12 02851 g007
Figure 8. Stability parameters for GY and TGW based on Eberhart and Russell model. Frequency distribution (a,b), mean performance and regression value (βi) (c,d) and stability based on S2Di (e,f) of 96 bread wheat accessions for GY and TGW.
Plants 12 02851 g008
Table 1. Morpho-physiological and yield-related traits studied in 96 bread wheat accessions under non-stressed and heat-stressed environments during two crop seasons of 2018–2019 and 2019–2020.
S. No.Traits StudiedCodeHow Was the Trait Measured?
1.Chlorophyll ContentCCEstimated on flag leaves of five random main tillers in each accession with hand-held Chlorophyll Content Meter (Model-CCM-200 plus, Opti-Sciences, Hudson, NH, USA).
2.Canopy Temperature Depression (°C)CTDMeasured on warm, sunny and clear day using portable Infrared Thermometer (Fisher Scientific, Loughborough, Leicestershire, UK).
3.Normalized Difference Vegetation IndexNDVINDVI was recorded using hand-held crop sensor (Green Seeker®, Trimble, Westminster, CO, USA). It ranged from 0 to 1; 0 refers to no green area and 1 to maximum greenness.
4.Membrane Stability Index (%)MSIMSI was estimated with small leaf discs of uniform size cut from 0.1 g leaf samples of each wheat accession and calculated using the following formula: MSI = [1 − (C1/C2)] × 100, where C1 and C2 represent readings of EC (Electrical Conductivity) recorded using digital conductivity meter at 45 °C and 100 °C, respectively.
5.Days to 50% AnthesisDARecorded as the period between the date of sowing and the dateat which 50% of spikes start to extrude their anthers.
6.Grain Filling Period (days)GFPGFP calculated as the difference between days to 50% anthesis and days to physiological maturity.
7.Plant Waxiness (0–10 scale)PWPW was measured with visual observations of whole plot during mid of GFP and scored using scale from 0 (0%) to 10 (100%) in an increment of 10%.
8.Leaf Rolling (0–10 scale)LRLR was measured at mid of GFP with visual observation of whole plot and scored as proportion of the leaves showing rolling effect using a scale from 0 (0%) to 10 (100%) in an increment of 10%.
9.Plant Height (cm)PHPH was measured from base of the plant to top of the spike excluding awns of the main tiller at maturity.
10.Peduncle Length (cm)PLMeasured from uppermost node to the spike collar of the main tiller at maturity in three plants per accession.
11.Flag Leaf Area (cm2)FLADerived from five randomly chosen plants’ flag leaves using the equation Leaf area = Length × Breadth × 0.75.
12.Spike Length (cm)SLMeasured from the spike collar to tip of the spike excluding awns of the main tiller in three plants per accession.
13.Number of Spikelets per SpikeNSSSpikelets per spike were counted on the main tiller spike of three plants per accession.
14.Grain Length (mm)GLMeasured on five grains per accession with Digimatic Caliper (Model-CD-6″ASX, Mitutoyo Corporation, Kawasaki, Kanagawa, Japan).
15.Grain Width (mm)GWGrain width was measured from five grains randomly selected per accession with Digimatic Caliper.
16.1000-Grain Weight (g)TGWTGW was recorded from 1000 grains randomly selected from plot yield and weighted using sensitive electronic balance (d = 0.1 mg, Sartorius, model CPA64, Göttingen, Lower Saxony, Germany).
17.Harvest Index (%)HIHI was calculated using the following formula: HI = (Grain yield per plant/Biological yield per plant) ×100.
18.Grain Yield (g/m2)GYPlot yield of each accession harvested, threshed manually, and weight of grains recorded with electronic balance. GY is expressed as yield per unit area.
Table 2. Descriptive statistics of pooled data of 18 morpho-physiological and yield traits recorded in 96 accessions of bread wheat in NS and HS environments during two crop seasons of 2018–2020.
TraitEnvironmentRangeMean ± S.E.SDCV
(%)
PCV
(%)
GCV (%)H2
(%)
GA
(%)
Min.Max.
CCINS17.438.526.9 ± 0.434.2115.6918.115.068.325.5
HS13.537.222.7 ± 0.494.1018.1018.616.275.929.0
CTD (°C)NS2.69.76.2 ± 0.181.8029.1923.310.520.39.7
HS4.412.06.9 ± 0.151.4721.2426.111.017.89.6
NDVI (0–1)NS0.540.720.62 ± 0.010.046.037.55.142.96.6
HS0.320.640.48 ± 0.010.0612.6110.98.563.814.3
MSI (%)NS50.077.566.6 ± 0.706.8910.3510.56.033.07.2
HS43.772.659.4 ± 0.686.7011.298.52.58.71.5
PW (0–10)NS1.010.06.2 ± 0.201.9431.3523.819.667.633.2
HS2.010.06.9 ± 0.171.6824.4721.417.264.628.5
LR (0–10)NS2.59.55.8 ± 0.131.2822.0420.817.571.430.5
HS4.010.06.5 ± 0.131.2619.2919.115.061.424.1
Days to 50% anthesisNS83.4119.091.9 ± 0.484.725.136.15.684.910.6
HS66.694.074.6 ± 0.403.885.206.86.385.411.9
GFP (days)NS24.039.534.2 ± 0.252.457.1619.910.729.011.9
HS23.532.028.1 ± 0.201.946.918.75.743.07.7
Plant height (cm)NS84.9150.9106.6 ± 1.3112.8312.035.92.517.82.2
HS73.2127.096.9 ± 1.2512.2312.637.14.439.15.7
Peduncle length (cm)NS29.460.139.2 ± 0.616.0015.3314.712.167.720.6
HS27.053.835.1 ± 0.545.2715.0414.512.979.423.7
Flag leaf area (cm2)NS21.977.037.4 ± 0.888.6123.0120.416.162.426.2
HS14.251.723.8 ± 0.615.9524.9617.814.566.324.3
Spike length (cm)NS8.715.611.7 ± 0.121.1810.146.83.019.42.7
HS8.113.510.6 ± 0.111.1010.384.81.37.10.7
Spikelets per spikeNS16.024.020.2 ± 0.151.467.235.92.112.71.6
HS15.522.718.7 ± 0.151.497.985.92.416.32.0
Grain length (mm)NS5.978.766.90 ± 0.040.395.595.64.977.99.0
HS5.858.626.68 ± 0.040.385.636.15.889.311.3
Grain width (mm)NS2.844.023.49 ± 0.020.195.313.52.033.02.4
HS2.643.683.27 ± 0.020.185.523.31.417.91.2
1000-grain weight (g) NS30.052.241.5 ± 0.535.1912.516.03.024.13.0
HS24.946.635.5 ± 0.484.7313.348.03.316.72.8
Harvest index (%)NS21.650.639.7 ± 0.494.8412.199.41.713.30.6
HS23.448.034.4 ± 0.454.3812.769.33.211.92.3
Grain yield (g/m2)NS300.0802.5562.2 ± 8.7786.0015.3011.37.342.19.8
HS176.7598.1423.6 ± 7.3471.9516.9710.55.830.26.6
Table 3. Grouping of different wheat accessions based on Eberhart and Russell stability model and their mean performance under NS and HS environments for TGW and GY along with HSI.
AdaptationWheat AccessionTGWGrain YieldTGWGrain YieldHSI
µβiS2DiµβiS2DiNSHSNSHS
Unfavorable (heat-stressed) environmentIC54342537.41.320.09487.2 −0.56319.8539.731.9508.0498.00.08
IC12845433.61.051.91543.6−0.22376.5234.929.1546.0538.10.05
IC26531839.10.7111.30500.7−0.15363.4038.536.4508.0504.10.03
IC25234846.01.3816.61480.1−0.15529.3546.941.9488.0476.70.09
IC56622336.30.7623.13589.5 0.04119.0940.434.7604.3598.10.04
IC33579233.61.027.37559.70.20446.4534.029.9593.4539.40.37
IC29019137.31.121.93500.50.269.7639.734.5522.2482.70.31
IC40197648.00.734.67493.3 0.2821.8949.745.2510.5478.10.26
IC44671344.70.621.02522.7 0.3211.4146.641.7545.2505.40.30
EC57670733.70.152.20552.1 0.3637.5833.832.4579.2534.70.37
IC07524042.90.886.98474.5 0.3363.5044.739.9501.9460.10.34
IC41601943.61.711.29510.00.4155.0549.136.8542.5490.10.40
EC57473142.00.990.22520.70.4362.5145.237.6549.2500.70.36
IC53517646.70.190.94556.0 0.4761.9147.145.0593.9532.10.43
IC53953146.10.752.11478.30.5049.4848.542.6517.2452.10.52
IC52920737.71.0626.18563.50.555.1039.335.7604.9527.40.52
Both environmentsIC41601843.00.8913.29553.8 0.7836.9947.137.6605.9508.10.66
IC44366140.8−0.061.18463.90.8524.3841.139.2523.2413.40.86
EC53448743.21.242.62551.6 0.9280.8547.737.6609.9496.10.76
IC53922149.80.863.33529.0 0.9412.3451.846.6593.2468.70.86
IC39387845.31.213.85572.2 0.96109.6249.343.9633.7516.70.75
Favorable (non-stressed) environmentIC57346141.82.8646.15558.5 1.3934.8652.231.1654.9462.71.20
IC53571739.40.6917.82553.6 1.45104.9743.438.0649.0464.11.17
IC14491133.30.810.05537.0 1.5679.2735.031.1648.9425.41.41
EC57617540.01.323.41557.9 1.62176.6044.438.1661.7456.71.27
EC27713440.41.3271.39570.8 1.69154.0048.035.3680.4464.71.30
IC25261935.01.391.74545.9 1.70112.1640.232.2659.5441.71.35
IC52924234.31.562.87482.2 1.82169.2940.530.7600.9369.11.58
IC44369433.60.895.34505.4 1.93240.8137.731.9630.9387.71.58
IC55359939.60.662.56550.5 1.9857.6042.439.3685.7424.71.56
IC52429942.51.56117.81565.8 2.02114.9750.534.1709.5422.71.65
IC25243134.10.761.61607.9 2.05269.0537.733.0739.5478.41.44
EC19089935.81.813.98588.32.18155.1941.133.1732.4448.71.58
EC57658545.40.757.26492.9 2.19178.9748.544.7637.5353.71.82
CUO/79/Pru 11A 45.11.1075.79580.5 2.38102.4352.140.7741.0423.41.75
IC27774137.50.6842.16597.62.7476.5938.035.8802.5416.11.97
NationalchecksRAJ376540.80.804.03514.2 0.6135.6743.038.7552.5472.00.60
HD293239.21.027.19538.1 1.1449.9041.736.6614.7458.81.04
WR54441.10.993.10562.8 1.3125.2444.637.7655.1472.11.14
HD296740.51.253.38592.71.0346.1244.936.2665.2518.70.90
Population mean38.6--489.4--41.541.5562.2423.61.00
LSD (5%)------2.12.649.021.1-
Abbreviations: TGW: 1000-Grain weight, HSI: Heat susceptibility index, NS: Non-stressed environment, HS: Heat-stressed environment, μ: Mean, βi: Regression coefficient, S2di: Deviations from the regression.
Table 4. Identification and selection of parents for the development of mapping populations for heat-stress tolerance in bread wheat.
Sl. No.Traits for Mapping
Population
Parents with Desirable Traits for Heat-Stress
Tolerance
(a).Bi-Parent PopulationParent (Higher Value)Parent (Lower Value)
1.Plant waxiness IC529207, IC528965 IC252431, IC252444
2.Leaf rolling IC416019, IC416055IC553599, IC252816
3.Earliness IC296383IC542509
4.Grain filling periodIC252725EC577013
5.Grain widthIC401976IC112258
6.1000-grain weightIC539221 IC542544
7.Harvest indexIC443653IC542509
8.Grain yield IC566223 EC577013
(b).MAGIC PopulationParents with Desirable Traits
1.4-parent MAGICIC566223, IC529207, IC416019, IC296383
2.8-parent MAGICIC128454, IC519900, IC528965, IC416055,
IC539221, IC401976, IC535176, IC566223
Disclaimer/Publisher’s Note: The statements, opinions and data contained in all publications are solely those of the individual author(s) and contributor(s) and not of MDPI and/or the editor(s). MDPI and/or the editor(s) disclaim responsibility for any injury to people or property resulting from any ideas, methods, instructions or products referred to in the content.

