Simultaneous Quantification and Visualization of Photosynthetic Pigments in Lycopersicon esculentum Mill. under Different Levels of Nitrogen Application with Visible-Near Infrared Hyperspectral Imaging Technology
Abstract
:1. Introduction
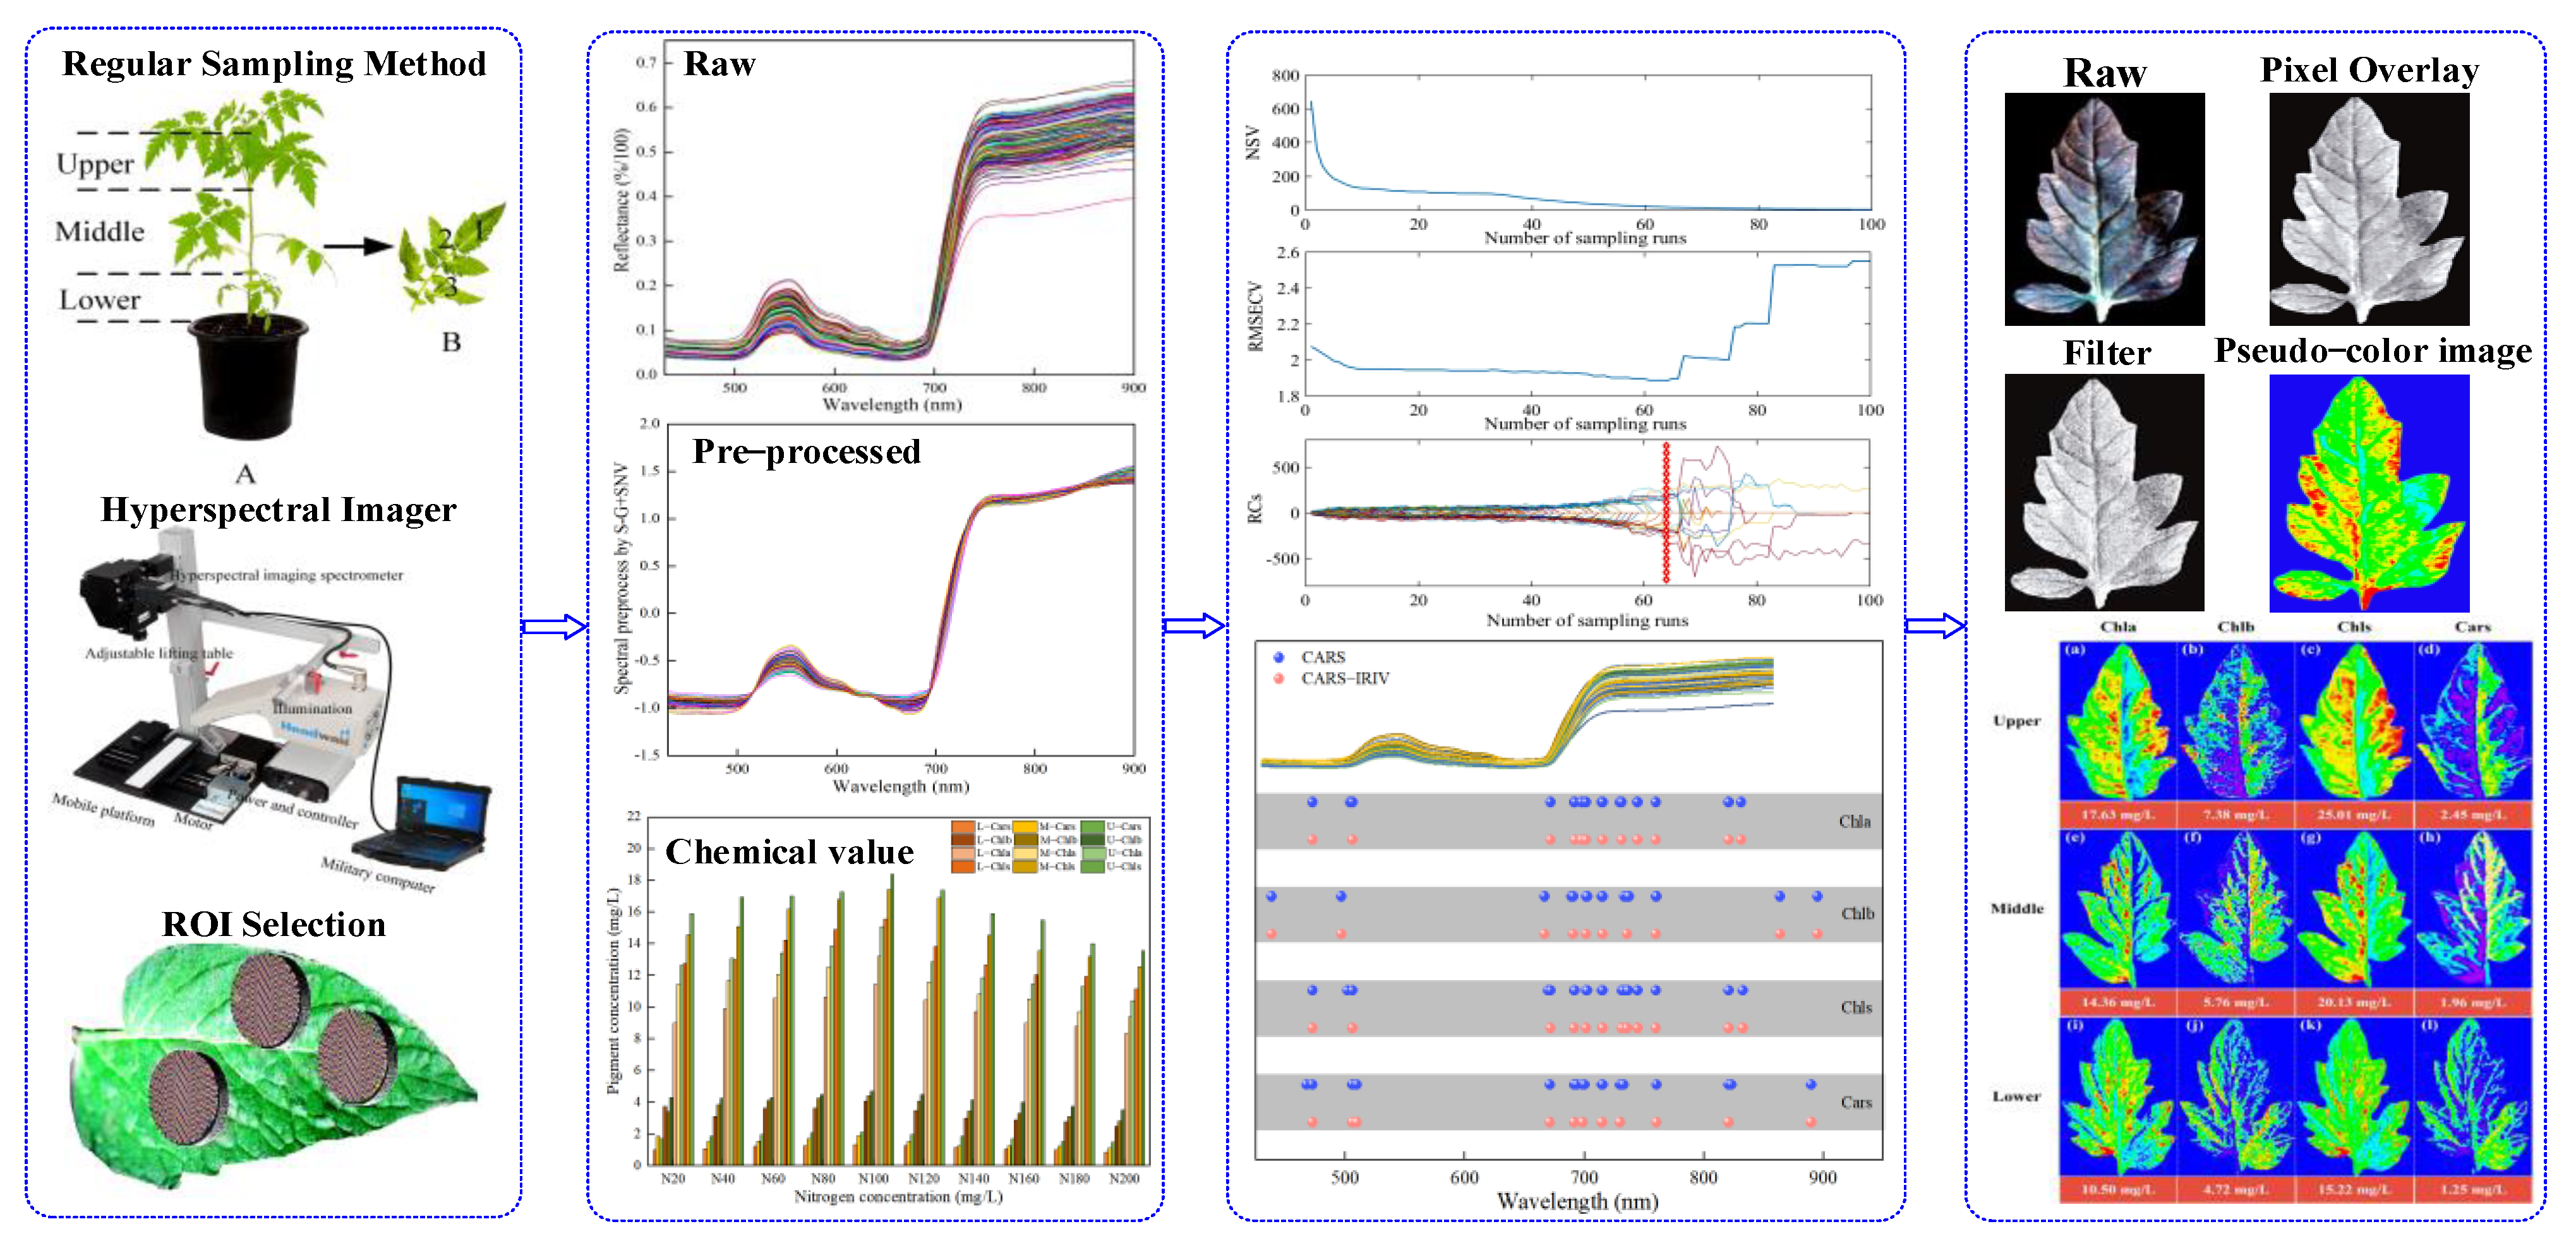
- The concentration of Chla, Chlb, Chls and Cars were used as the research indexes. The chemical constituents of the leaves were determined using traditional laboratory methods, and the spectrum and image were obtained through VNIR–HSI;
- The software of batch extraction and processing was compiled for selecting the regions of interest (ROI);
- A “coarse-fine” characteristic variable screening strategy was proposed for the pre-treated spectral data to establish quantitative models that could simultaneously predict multiple pigments;
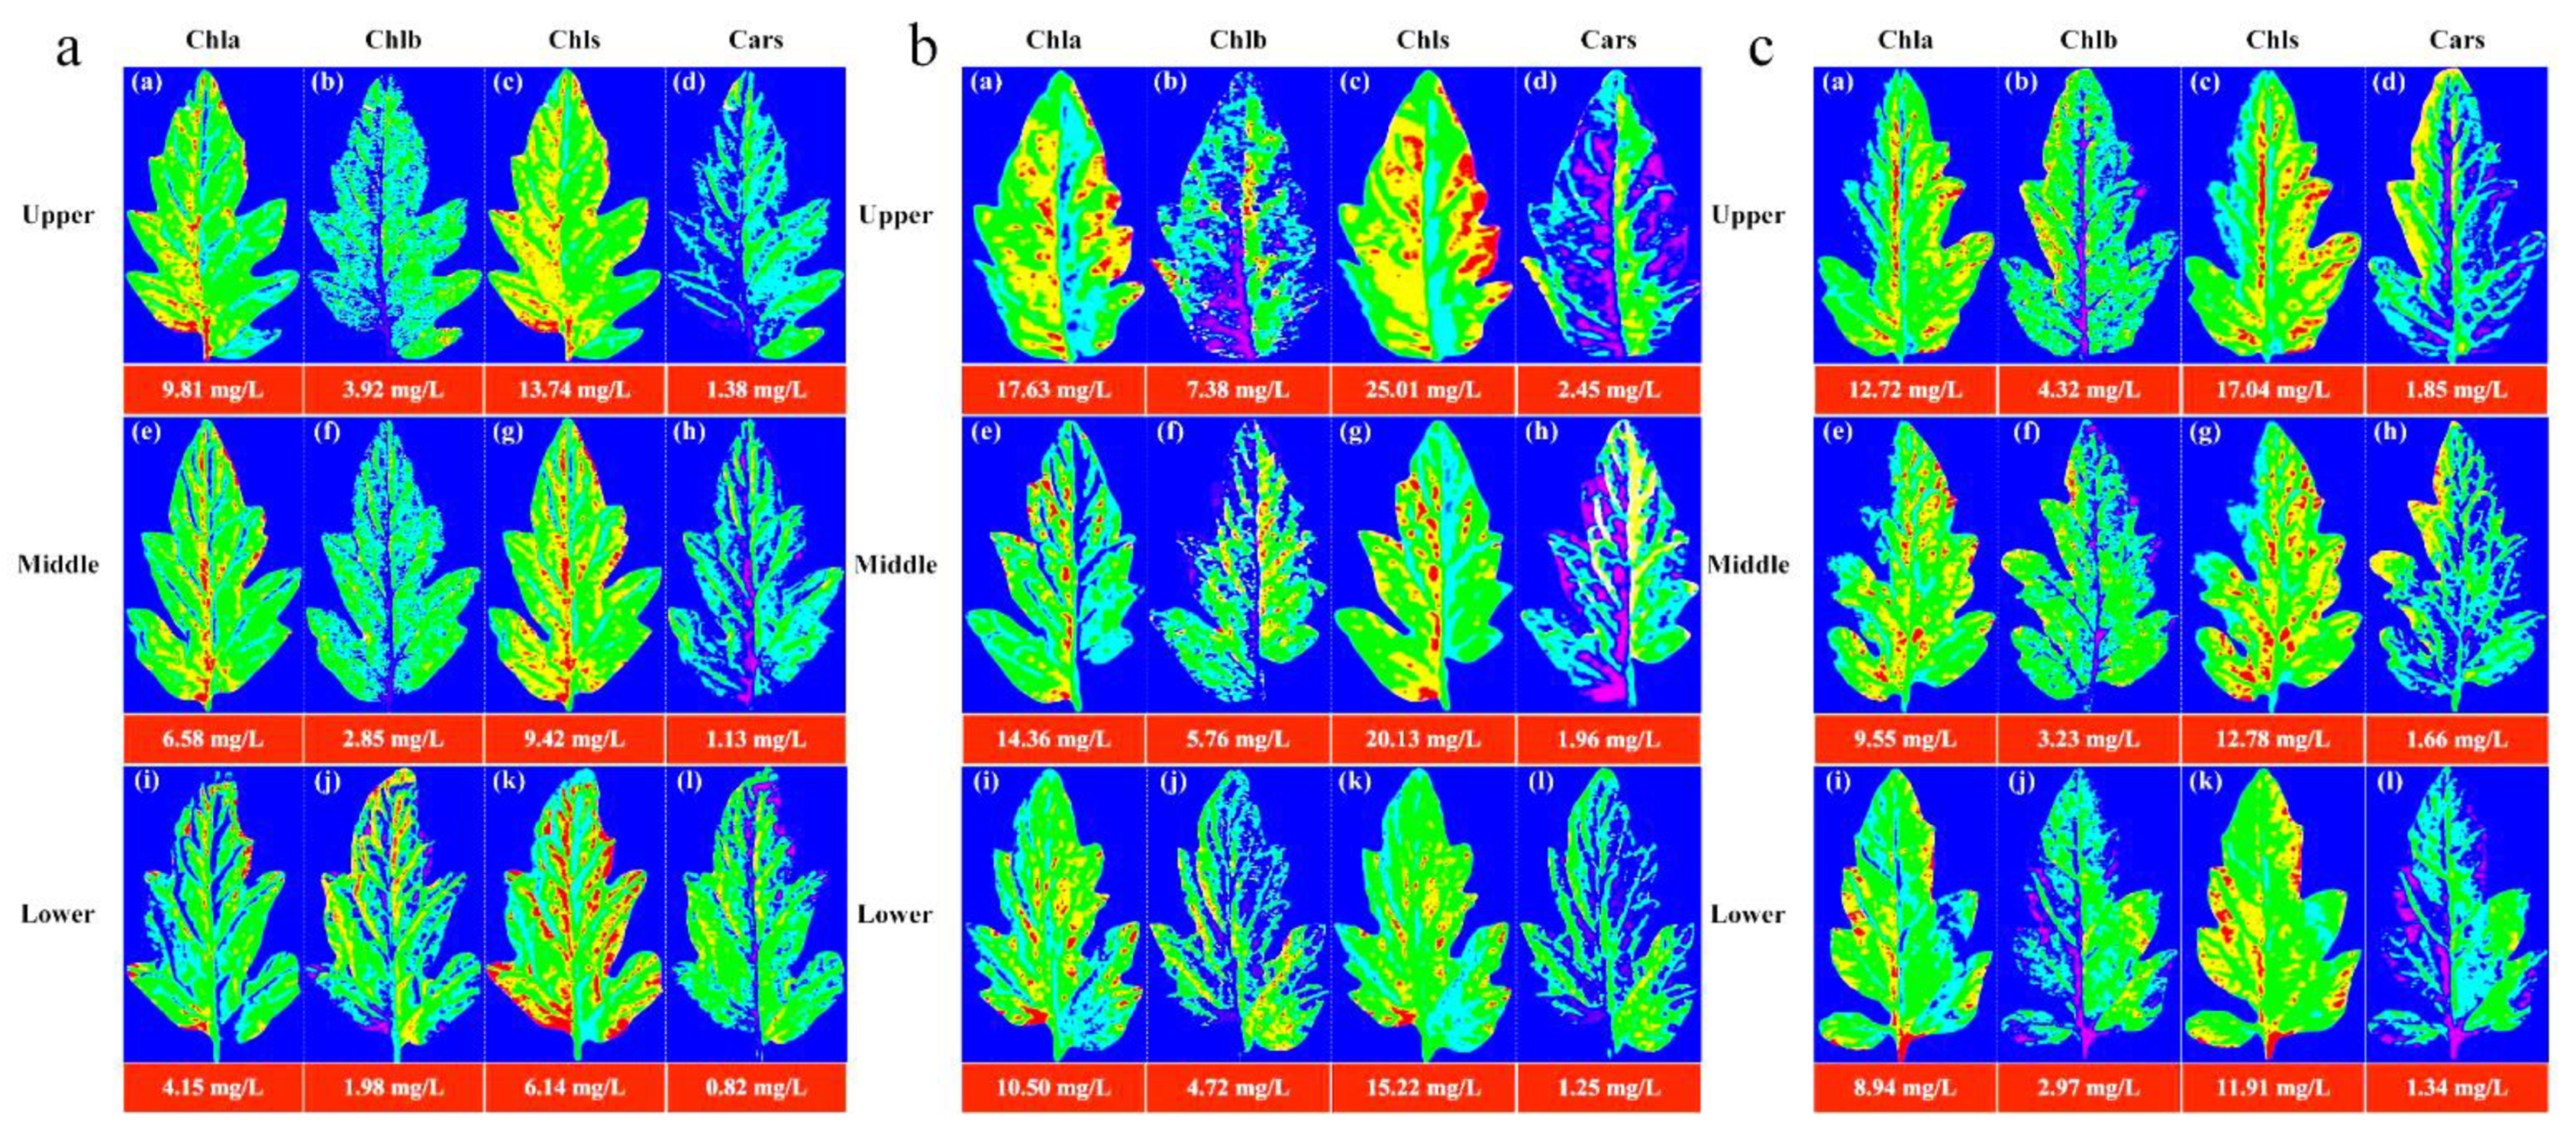
- The distributions and concentrations of pigments at various leaf locations were visualized using prediction models applied to the image. Visual analysis was conducted to determine the appropriate nitrogen concentration for Lycopersicon esculentum Mill. cultivation, as well as the distribution of Chla, Chlb, Chls and Cars.
2. Results
2.1. Statistical Analysis of Measured Pigments Concentration of Leaf Positions
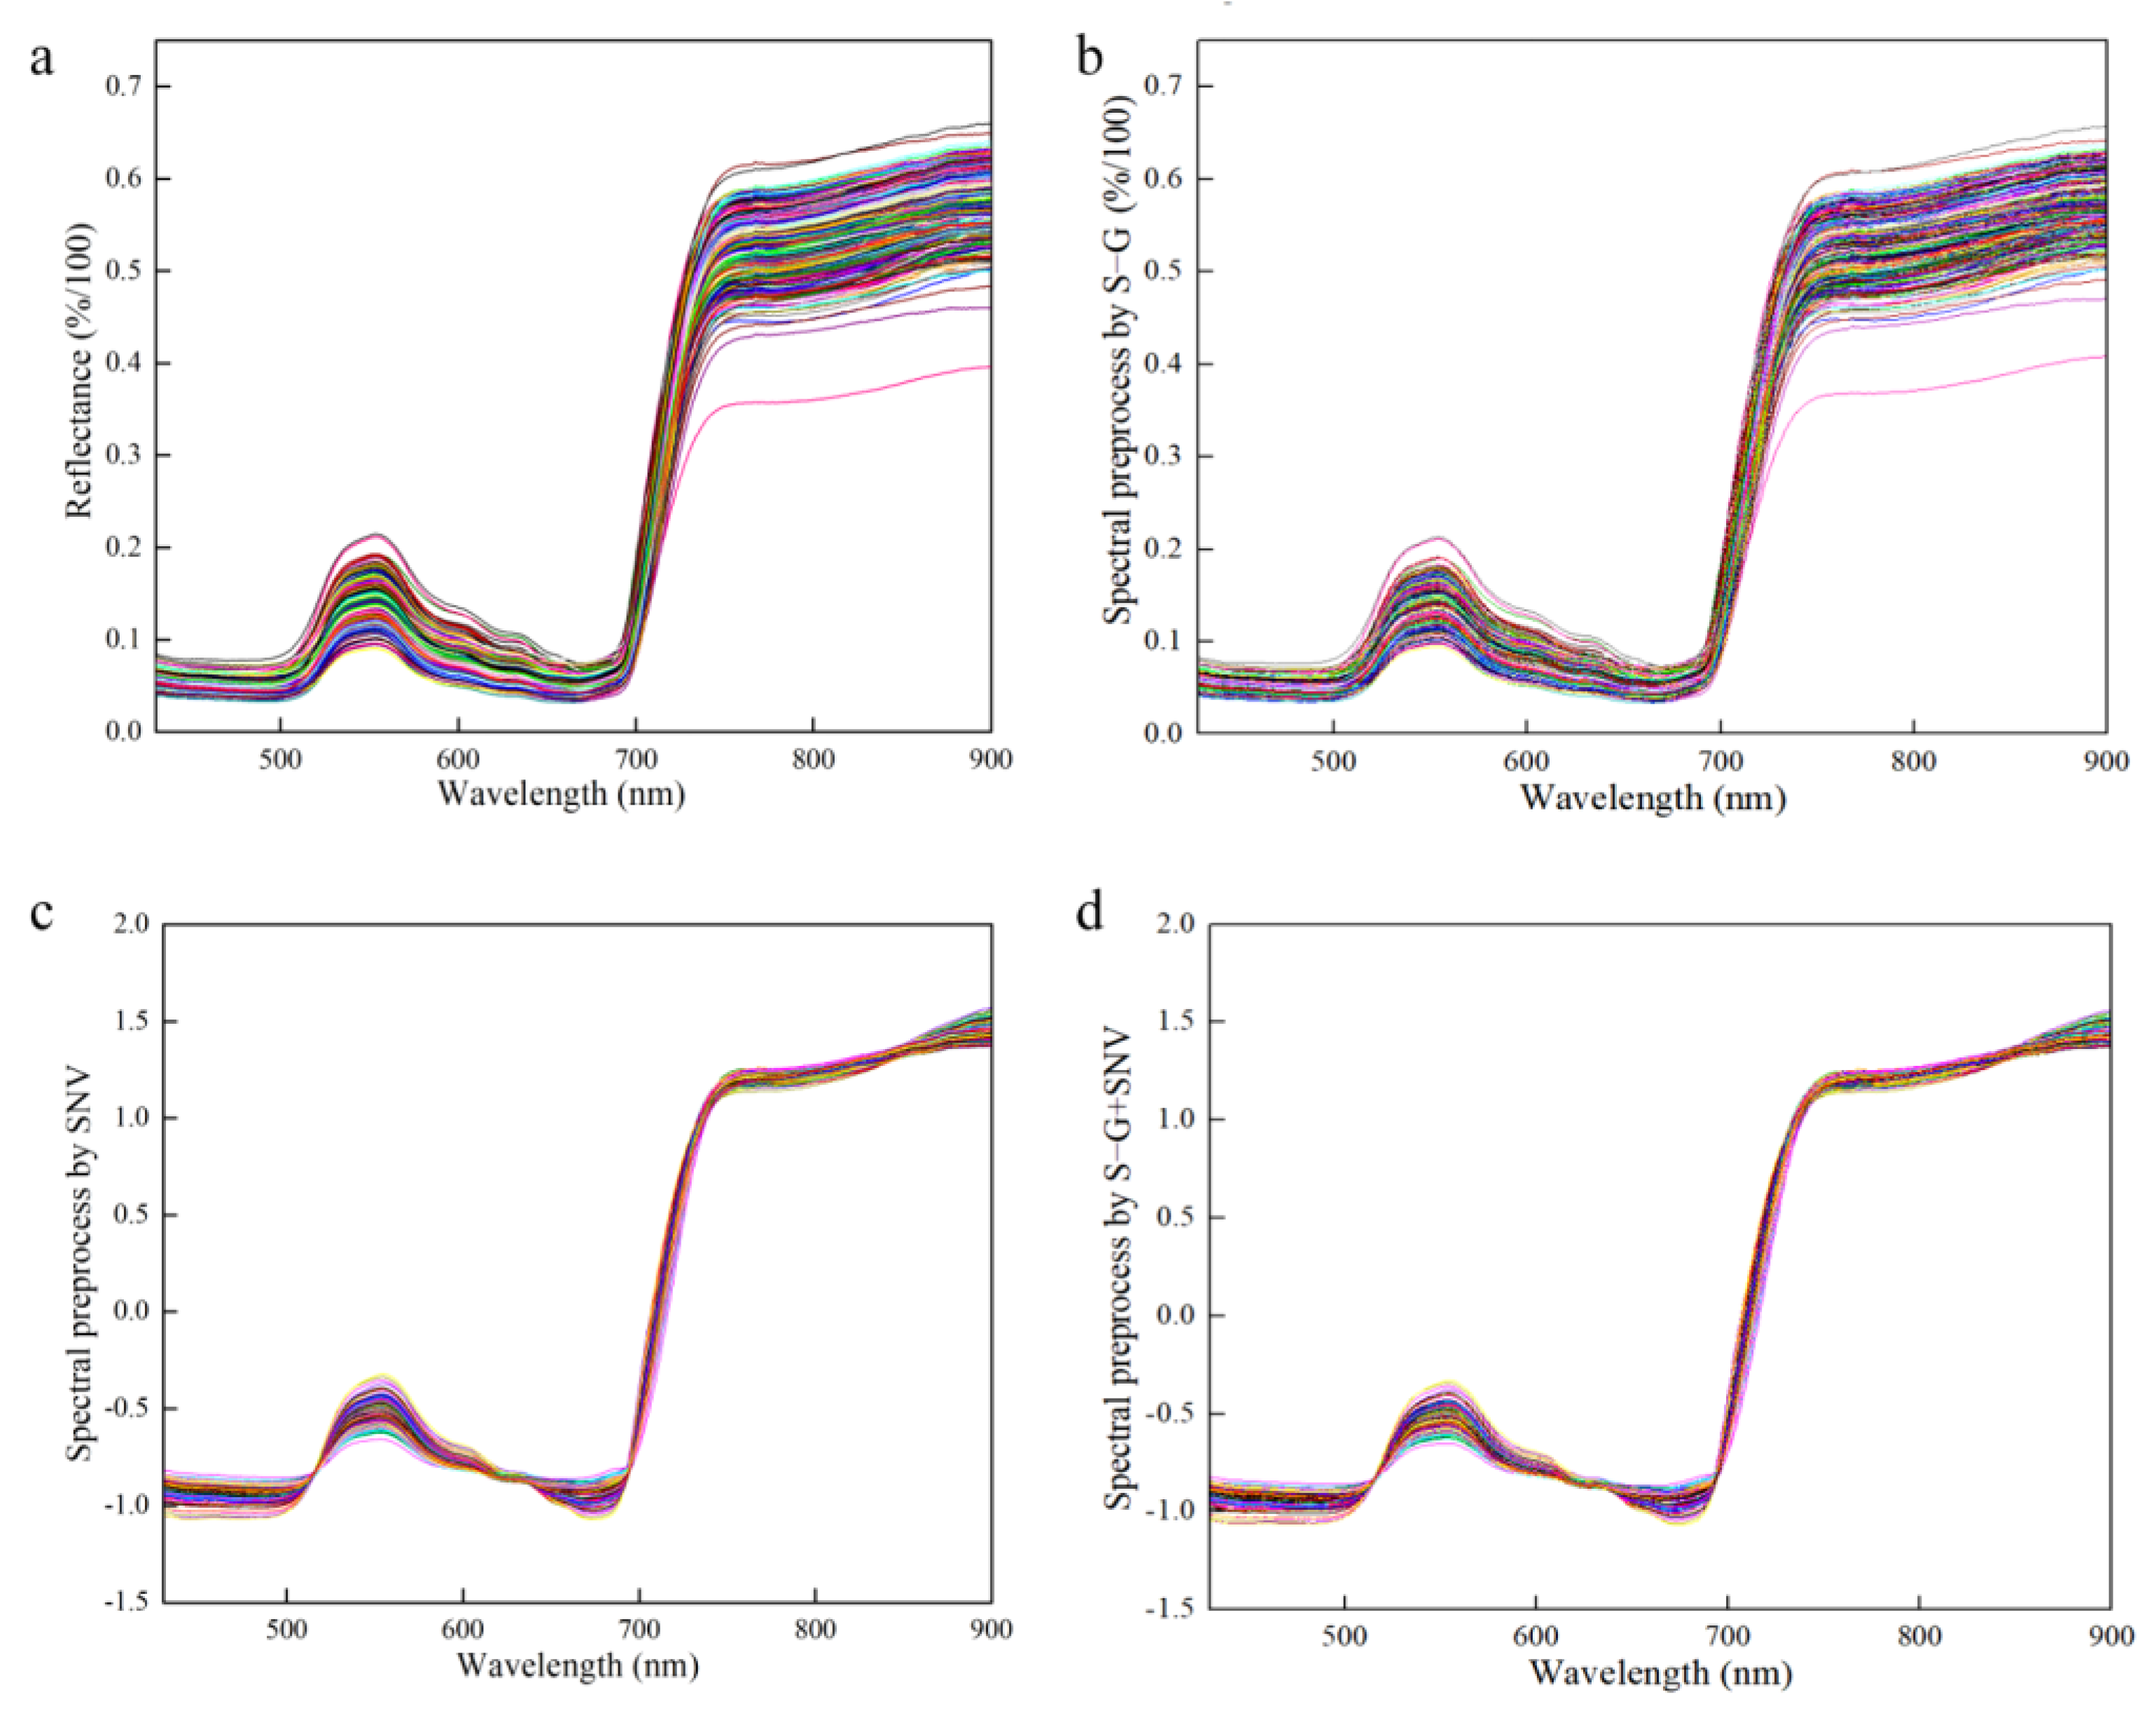
2.2. Sample Partition and Data Preprocessing
2.3. Results of CARS–PLSR Modeling
2.4. Results of CARS–IRIV–PLSR Modeling
2.5. Visualized Distribution of Leaf Pigments
3. Discussion
4. Materials and Methods
4.1. Experimental Design and Sample Collection
4.2. Hyperspectral Image Acquisition
4.3. Chemical Measurement of Pigment Concentration
4.4. Selection of ROI
4.5. Spectrum Pretreatment and Model Calibration
- Based on Monte Carlo sampling (MCS), a PLSR model is established by randomly selecting 80% of the calibration set of samples to obtain the regression coefficients |Ki| (i = 1, 2, ⋯, p) for the i-th wavelength;
- The exponentially decreasing function (EDF) is applied to eliminate the wavelength with smaller |Ki|, and the retention rate of the variable is rj = ae−bj (j = 1, 2, ⋯, N). Among them, j represents the j-th MCS; N represents the number of MCS; a and b are constants, calculated by r1 = 1 and rN = 2/p, the formula are as follows:
- The variables are further filtered based on the adaptive reweighted sampling (ARS) technique. The variables were filtered by evaluating the weights (i = 1, 2, ⋯, p);
- Repeat the above steps until the number of MCS reaches a predetermined value of N;
- The 5-fold root mean square error of cross-validation (RMSEcv) is used as the evaluation criterion. The values of the subset of variables obtained from each MCS are compared, and the subset of variables corresponding to the minimum RMSEcv is selected as the optimal variable.
- The spectrum bands randomly generate an m × p matrix A containing only 0 and 1 (0 and 1 indicate whether the corresponding variables are involved in performing the modeling), with the same number of 0 and 1. The PLSR model is established in each row of matrix A. The RMSEcv obtained from the 5-fold cross-validation is used as the evaluation criterion. This obtains an m × 1 vector denoted as RMSEcv0. Replace the 1 with 0 and the 0 with 1 in the i-th (i = 1, 2, ⋯, p) column of the A to obtain the matrix B. Similarly, a PLSR model is established in each row of the B to obtain an m × 1 vector denoted as RMSEcvi;
- Define Φ0 and Φi to assess the importance of each variable with the following equations. The difference between the mean values of Φ0 and Φi is denoted as DMi. If DMi < 0, it is a strong or weak information variable; if DMi > 0, it is an uninformative or interfering variable. A Mann-Whitney U-test is performed by defining p = 0.05 as the threshold. Finally, the variables are classified as strong information, weak information, uninformative and interfering information:
- In each iteration, strong and weak information variables are retained, and uninformative and interfering information variables are eliminated. Return to step 1. for the next iteration until only strong and weak information is left in the set of variables;
- Backward elimination is performed for t retained variables. First, a PLSR model is established for the t variables to obtain RMSEcvt. Then, a PLSR model is established for the t − 1 variables by eliminating the j-th (j = 1, 2, ⋯, t) variable to obtain RMSEcvj. If RMSEcvj is less than RMSEcvt, the j-th variable is eliminated; otherwise, it is retained. Loop this process, and the remaining variables are the final selected characteristic variables.
4.6. Visualization of Leaf Pigment
5. Conclusions
- Plants may experience various challenges in addition to nitrogen stress, such as salt stress and water stress. In the future, HSI technology can be integrated with other stress monitoring technologies to realize multi-stress joint diagnosis and to better comprehend the growing stage of plants;
- Combining the hyperspectrum, Raman spectrum and fluorescence spectrum to obtain multi-source data allows for the qualitative and quantitative analysis of the stress mechanism;
- HSI superpixel segmentation mostly targets images with a single scale and one mode. The superpixel segmentation of multi-scale and multi-modal pictures will receive more attention in future studies. Super-pixel segmentation uses end-to-end learning techniques to apply deep learning to enhance the accuracy and efficiency as it adapts to more complex image scenarios;
- HSI technique generates a significant amount of complicated data, necessitating the use of effective data processing and analysis algorithms. Future research can concentrate on streamlining data processing techniques to raise the precision and effectiveness of stress diagnosis;
- The primary focus of the current HSI technology is static images of plants; however, future advancements may provide dynamic monitoring to enable the continuous observation of the plant stress response at various periods and spatial scales;
- The primary requirement of the current HSI technology is massive imaging apparatus, which restricts its applicability in real-world field applications. Future research might concentrate on creating more lightweight imaging equipment that is easier to utilize in various settings.
Supplementary Materials
Author Contributions
Funding
Institutional Review Board Statement
Informed Consent Statement
Data Availability Statement
Acknowledgments
Conflicts of Interest
References
- Zeeshan, M.; Ahmad, W.; Hussain, F.; Ahamd, W.; Numan, M.; Shah, M.; Ahmad, I. Phytostabalization of the heavy metals in the soil with biochar applications, the impact on chlorophyll, carotene, soil fertility and tomato crop yield. J. Clean. Prod. 2020, 255, 120318. [Google Scholar] [CrossRef]
- Putra, B.T.W.; Soni, P. Enhanced broadband greenness in assessing Chlorophyll a and b, Carotenoid, and Nitrogen in Robusta coffee plantations using a digital camera. Precis. Agric. 2018, 19, 238–256. [Google Scholar] [CrossRef]
- Zhou, X.; Huang, W.; Zhang, J.; Kong, W.; Casa, R.; Huang, Y. A novel combined spectral index for estimating the ratio of carotenoid to chlorophyll content to monitor crop physiological and phenological status. Int. J. Appl. Earth Obs. 2019, 76, 128–142. [Google Scholar] [CrossRef]
- Park, M.-H.; Sangwanangkul, P.; Baek, D.-R. Changes in carotenoid and chlorophyll content of black tomatoes (Lycopersicone sculentum L.) during storage at various temperatures. Saudi J. Biol. Sci. 2018, 25, 57–65. [Google Scholar] [CrossRef] [PubMed]
- Zeb, A.; Imran, M. Carotenoids, pigments, phenolic composition and antioxidant activity of Oxalis corniculata leaves. Food Biosci. 2019, 32, 100472. [Google Scholar] [CrossRef]
- Sonobe, R.; Miura, Y.; Sano, T.; Horie, H. Estimating leaf carotenoid contents of shade-grown tea using hyperspectral indices and PROSPECT–D inversion. Int. J. Remote Sens. 2018, 39, 1306–1320. [Google Scholar] [CrossRef]
- Feng, H.; Chen, G.; Xiong, L.; Liu, Q.; Yang, W. Accurate digitization of the chlorophyll distribution of individual rice leaves using hyperspectral imaging and an integrated image analysis pipeline. Front. Plant Sci. 2017, 8, 1238. [Google Scholar] [CrossRef]
- Soltanikazemi, M.; Minaei, S.; Shafizadeh-Moghadam, H.; Mahdavian, A. Field-scale estimation of sugarcane leaf nitrogen content using vegetation indices and spectral bands of Sentinel-2: Application of random forest and support vector regression. Comput. Electron. Agric. 2022, 200, 107130. [Google Scholar] [CrossRef]
- Wang, Y.; Suarez, L.; Poblete, T.; Gonzalez-Dugo, V.; Ryu, D.; Zarco-Tejada, P. Evaluating the role of solar-induced fluorescence (SIF) and plant physiological traits for leaf nitrogen assessment in almond using airborne hyperspectral imagery. Remote Sens. Environ. 2022, 279, 113141. [Google Scholar] [CrossRef]
- Adegoye, G.A.; Olorunwa, O.J.; Alsajri, F.A.; Walne, C.H.; Wijewandana, C.; Kethireddy, S.R.; Reddy, K.N.; Reddy, K.R. Waterlogging Effects on Soybean Physiology and Hyperspectral Reflectance during the Reproductive Stage. Agriculture 2023, 13, 844. [Google Scholar] [CrossRef]
- Schmilovitch, Z.; Ignat, T.; Alchanatis, V.; Gatker, J.; Ostrovsky, V.; Felföldi, J. Hyperspectral imaging of intact bell peppers. Biosyst. Eng. 2014, 117, 83–93. [Google Scholar] [CrossRef]
- Anwar, A.; Yu, X.; Li, Y. Seed priming as a promising technique to improve growth, chlorophyll, photosynthesis and nutrient contents in cucumber seedlings. Not. Bot. Hortic Agrobot. 2020, 48, 116–127. [Google Scholar] [CrossRef]
- Ding, Y.; Zhang, Z.; Zhao, X.; Cai, W.; Yang, N.; Hu, H.; Huang, X.; Cao, Y.; Cai, W. Unsupervised Self-Correlated Learning Smoothy Enhanced Locality Preserving Graph Convolution Embedding Clustering for Hyperspectral Images. IEEE Trans. Geosci. Remote Sens. 2022, 60, 1–16. [Google Scholar] [CrossRef]
- Ding, Y.; Zhang, Z.; Zhao, X.; Hong, D.; Cai, W.; Yang, N.; Wang, B. Multi-scale receptive fields: Graph attention neural network for hyperspectral image classification. Expert. Syst. Appl. 2023, 223, 119858. [Google Scholar] [CrossRef]
- Chen, Z.; Wu, G.; Gao, H.; Ding, Y.; Hong, D.; Zhang, B. Local aggregation and global attention network for hyperspectral image classification with spectral-induced aligned superpixel segmentation. Expert. Syst. Appl. 2023, 232, 120828. [Google Scholar] [CrossRef]
- Wong, C.Y.; D’Odorico, P.; Bhathena, Y.; Arain, M.A.; Ensminger, I. Carotenoid based vegetation indices for accurate monitoring of the phenology of photosynthesis at the leaf-scale in deciduous and evergreen trees. Remote Sens. Environ. 2019, 233, 111407. [Google Scholar] [CrossRef]
- Yun, Y.-H.; Bin, J.; Liu, D.-L.; Xu, L.; Yan, T.-L.; Cao, D.-S.; Xu, Q.-S. A hybrid variable selection strategy based on continuous shrinkage of variable space in multivariate calibration. Anal. Chim. Acta 2019, 1058, 58–69. [Google Scholar] [CrossRef]
- Zheng, K.; Li, Q.; Wang, J.; Geng, J.; Cao, P.; Sui, T.; Wang, X.; Du, Y. Stability competitive adaptive reweighted sampling (SCARS) and its applications to multivariate calibration of NIR spectra. Chemometr. Intell. Lab. 2012, 112, 48–54. [Google Scholar] [CrossRef]
- Li, H.; Liang, Y.; Xu, Q.; Cao, D. Key wavelengths screening using competitive adaptive reweighted sampling method for multivariate calibration. Anal. Chim. Acta 2009, 648, 77–84. [Google Scholar] [CrossRef]
- Tang, G.; Huang, Y.; Tian, K.; Song, X.; Yan, H.; Hu, J.; Xiong, Y.; Min, S. A new spectral variable selection pattern using competitive adaptive reweighted sampling combined with successive projections algorithm. Analyst 2014, 139, 4894–4902. [Google Scholar] [CrossRef]
- Yun, Y.-H.; Wang, W.-T.; Tan, M.-L.; Liang, Y.-Z.; Li, H.-D.; Cao, D.-S.; Lu, H.-M.; Xu, Q.-S. A strategy that iteratively retains informative variables for selecting optimal variable subset in multivariate calibration. Anal. Chim. Acta 2014, 807, 36–43. [Google Scholar] [CrossRef]
- Deng, B.-C.; Yun, Y.-H.; Liang, Y.-Z.; Yi, L.-Z. A novel variable selection approach that iteratively optimizes variable space using weighted binary matrix sampling. Analyst 2014, 139, 4836–4845. [Google Scholar] [CrossRef] [PubMed]
- Vahtmäe, E.; Kotta, J.; Orav-Kotta, H.; Kotta, I.; Pärnoja, M.; Kutser, T. Predicting macroalgal pigments (chlorophyll a, chlorophyll b, chlorophyll a+ b, carotenoids) in various environmental conditions using high-resolution hyperspectral spectroradiometers. Int. J. Remote Sens. 2018, 39, 5716–5738. [Google Scholar] [CrossRef]
- Wang, Y.; Hu, X.; Jin, G.; Hou, Z.; Ning, J.; Zhang, Z. Rapid prediction of chlorophylls and carotenoids content in tea leaves under different levels of nitrogen application based on hyperspectral imaging. J. Sci. Food Agric. 2019, 99, 1997–2004. [Google Scholar] [CrossRef] [PubMed]
- Che, S.; Du, G.; Zhong, X.; Mo, Z.; Wang, Z.; Mao, Y. Quantification of Photosynthetic Pigments in Neopyropia yezoensis Using Hyperspectral Imagery. Plant Phenomics 2023, 5, 12. [Google Scholar] [CrossRef]
- Yin, S.; Zhou, K.; Cao, L.; Shen, X. Estimating the Horizontal and Vertical Distributions of Pigments in Canopies of Ginkgo Plantation Based on UAV-Borne LiDAR, Hyperspectral Data by Coupling PROSAIL Model. Remote Sens. 2022, 14, 715. [Google Scholar] [CrossRef]
- Guo, L.; Zheng, W.; Chen, F.; Wang, W.; Zhang, D.; Hu, Z.; Chu, Y. Meat species identification accuracy improvement using sample set portioning based on joint x–y distance and laser-induced breakdown spectroscopy. Appl. Opt. 2021, 60, 5826–5831. [Google Scholar] [CrossRef] [PubMed]
- Bao, Z.; Guo, H.; Li, J.; Li, Y.; He, L. Detection of volatile fatty acids in anaerobic digestion system by near infrared spectroscopy. Biomass Bioenerg. 2023, 175, 106842. [Google Scholar] [CrossRef]
- Cheng, J.-H.; Sun, D.-W. Partial least squares regression (PLSR) applied to NIR and HSI spectral data modeling to predict chemical properties of fish muscle. Food Eng. Rev. 2017, 9, 36–49. [Google Scholar] [CrossRef]
- Hair, F.J., Jr.; Sarstedt, M.; Hopkins, L.G.; Kuppelwieser, V. Partial least squares structural equation modeling (PLS-SEM) An emerging tool in business research. Eur. Bus. Rev. 2014, 26, 106–121. [Google Scholar] [CrossRef]
- Wojdyło, A.; Nowicka, P.; Tkacz, K.; Turkiewicz, I.P. Fruit tree leaves as unconventional and valuable source of chlorophyll and carotenoid compounds determined by liquid chromatography-photodiode-quadrupole/time of flight-electrospray ionization-mass spectrometry (LC-PDA-qTof-ESI-MS). Food Chem. 2021, 349, 129156. [Google Scholar] [CrossRef] [PubMed]
- Niroula, A.; Khatri, S.; Timilsina, R.; Khadka, D.; Khadka, A.; Ojha, P. Profile of chlorophylls and carotenoids of wheat (Triticum aestivum L.) and barley (Hordeum vulgare L.) microgreens. J. Food Sci. Technol. 2019, 56, 2758–2763. [Google Scholar] [CrossRef] [PubMed]
- Harizanova, A.; Koleva-Valkova, L. Effect of silicon on photosynthetic rate and the chlorophyll fluorescence parameters at hydroponically grown cucumber plants under salinity stress. J. Cent. Eur. Agric. 2019, 20, 953–960. [Google Scholar] [CrossRef]
- Falcioni, R.; Antunes, W.C.; Demattê, J.A.M.; Nanni, M.R. A Novel Method for Estimating Chlorophyll and Carotenoid Concentrations in Leaves: A Two Hyperspectral Sensor Approach. Sensors 2023, 23, 3843. [Google Scholar] [CrossRef]
- Roca, M.; Pérez-Gálvez, A. Metabolomics of Chlorophylls and Carotenoids: Analytical Methods and Metabolome-Based Studies. Antioxidants 2021, 10, 1622. [Google Scholar] [CrossRef]
- Lichtenthaler, H.; Babani, F. Contents of photosynthetic pigments and ratios of chlorophyll a/b and chlorophylls to carotenoids (a+b)/(x+c) in C4 plants as compared to C3 plants. Photosynthetica 2022, 60, 3–9. [Google Scholar] [CrossRef]
- Kira, O.; Linker, R.; Gitelson, A. Non-destructive estimation of foliar chlorophyll and carotenoid contents: Focus on informative spectral bands. Int. J. Appl. Earth Obs. 2015, 38, 251–260. [Google Scholar] [CrossRef]
- Cupellini, L.; Calvani, D.; Jacquemin, D.; Mennucci, B. Charge transfer from the carotenoid can quench chlorophyll excitation in antenna complexes of plants. Nat. Commun. 2020, 11, 662. [Google Scholar] [CrossRef]
- Cupellini, L.; Calvani, D.; Jacquemin, D.; Mennucci, B. Excitation quenching in chlorophyll–carotenoid antenna systems: ‘coherent’or ‘incoherent’. Photosynth. Res. 2020, 144, 301–315. [Google Scholar] [CrossRef]
- Durna, D.; Aygün, B.; Genişel, M.; Singh, V. Investigation of the neutron radiation protective properties of chlorophyll and carotenoid. Radiat. Phys. Chem. 2023, 208, 110873. [Google Scholar] [CrossRef]
- Sharma, S.; Baran, C.; Tripathi, A.; Awasthi, A.; Jaiswal, A.; Uttam, R.; Bharti, A.S.; Singh, R.; Uttam, K.N. Phytochemical screening of the different cultivars of ixora flowers by non-destructive, label-free, and rapid spectroscopic techniques. Anal. Lett. 2021, 54, 2276–2292. [Google Scholar] [CrossRef]
- Song, G.; Wang, Q. Developing Hyperspectral Indices for Assessing Seasonal Variations in the Ratio of Chlorophyll to Carotenoid in Deciduous Forests. Remote Sens. 2022, 14, 1324. [Google Scholar] [CrossRef]
- Chen, Y.; Cao, R.; Chen, J.; Liu, L.; Matsushita, B. A practical approach to reconstruct high-quality Landsat NDVI time-series data by gap filling and the Savitzky–Golay filter. ISPRS J. Photogramm. 2021, 180, 174–190. [Google Scholar] [CrossRef]
- Candan, Ç.; Inan, H. A unified framework for derivation and implementation of Savitzky–Golay filters. Signal Process. 2014, 104, 203–211. [Google Scholar] [CrossRef]
- Mishra, P.; Passos, D. A synergistic use of chemometrics and deep learning improved the predictive performance of near-infrared spectroscopy models for dry matter prediction in mango fruit. Chemometr. Intell. Lab. 2021, 212, 104287. [Google Scholar] [CrossRef]
- Ji, Q.; Li, C.; Fu, X.; Liao, J.; Hong, X.; Yu, X.; Ye, Z.; Zhang, M.; Qiu, Y. Protected Geographical Indication Discrimination of Zhejiang and Non-Zhejiang Ophiopogonis japonicus by Near-Infrared (NIR) Spectroscopy Combined with Chemometrics: The Influence of Different Stoichiometric and Spectrogram Pretreatment Methods. Molecules 2023, 28, 2803. [Google Scholar] [CrossRef] [PubMed]
- Sun, H.; Zhang, S.; Ren, R.; Xue, J.; Zhao, H. Detection of Soluble Solids Content in Different Cultivated Fresh Jujubes Based on Variable Optimization and Model Update. Foods 2022, 11, 2522. [Google Scholar] [CrossRef] [PubMed]
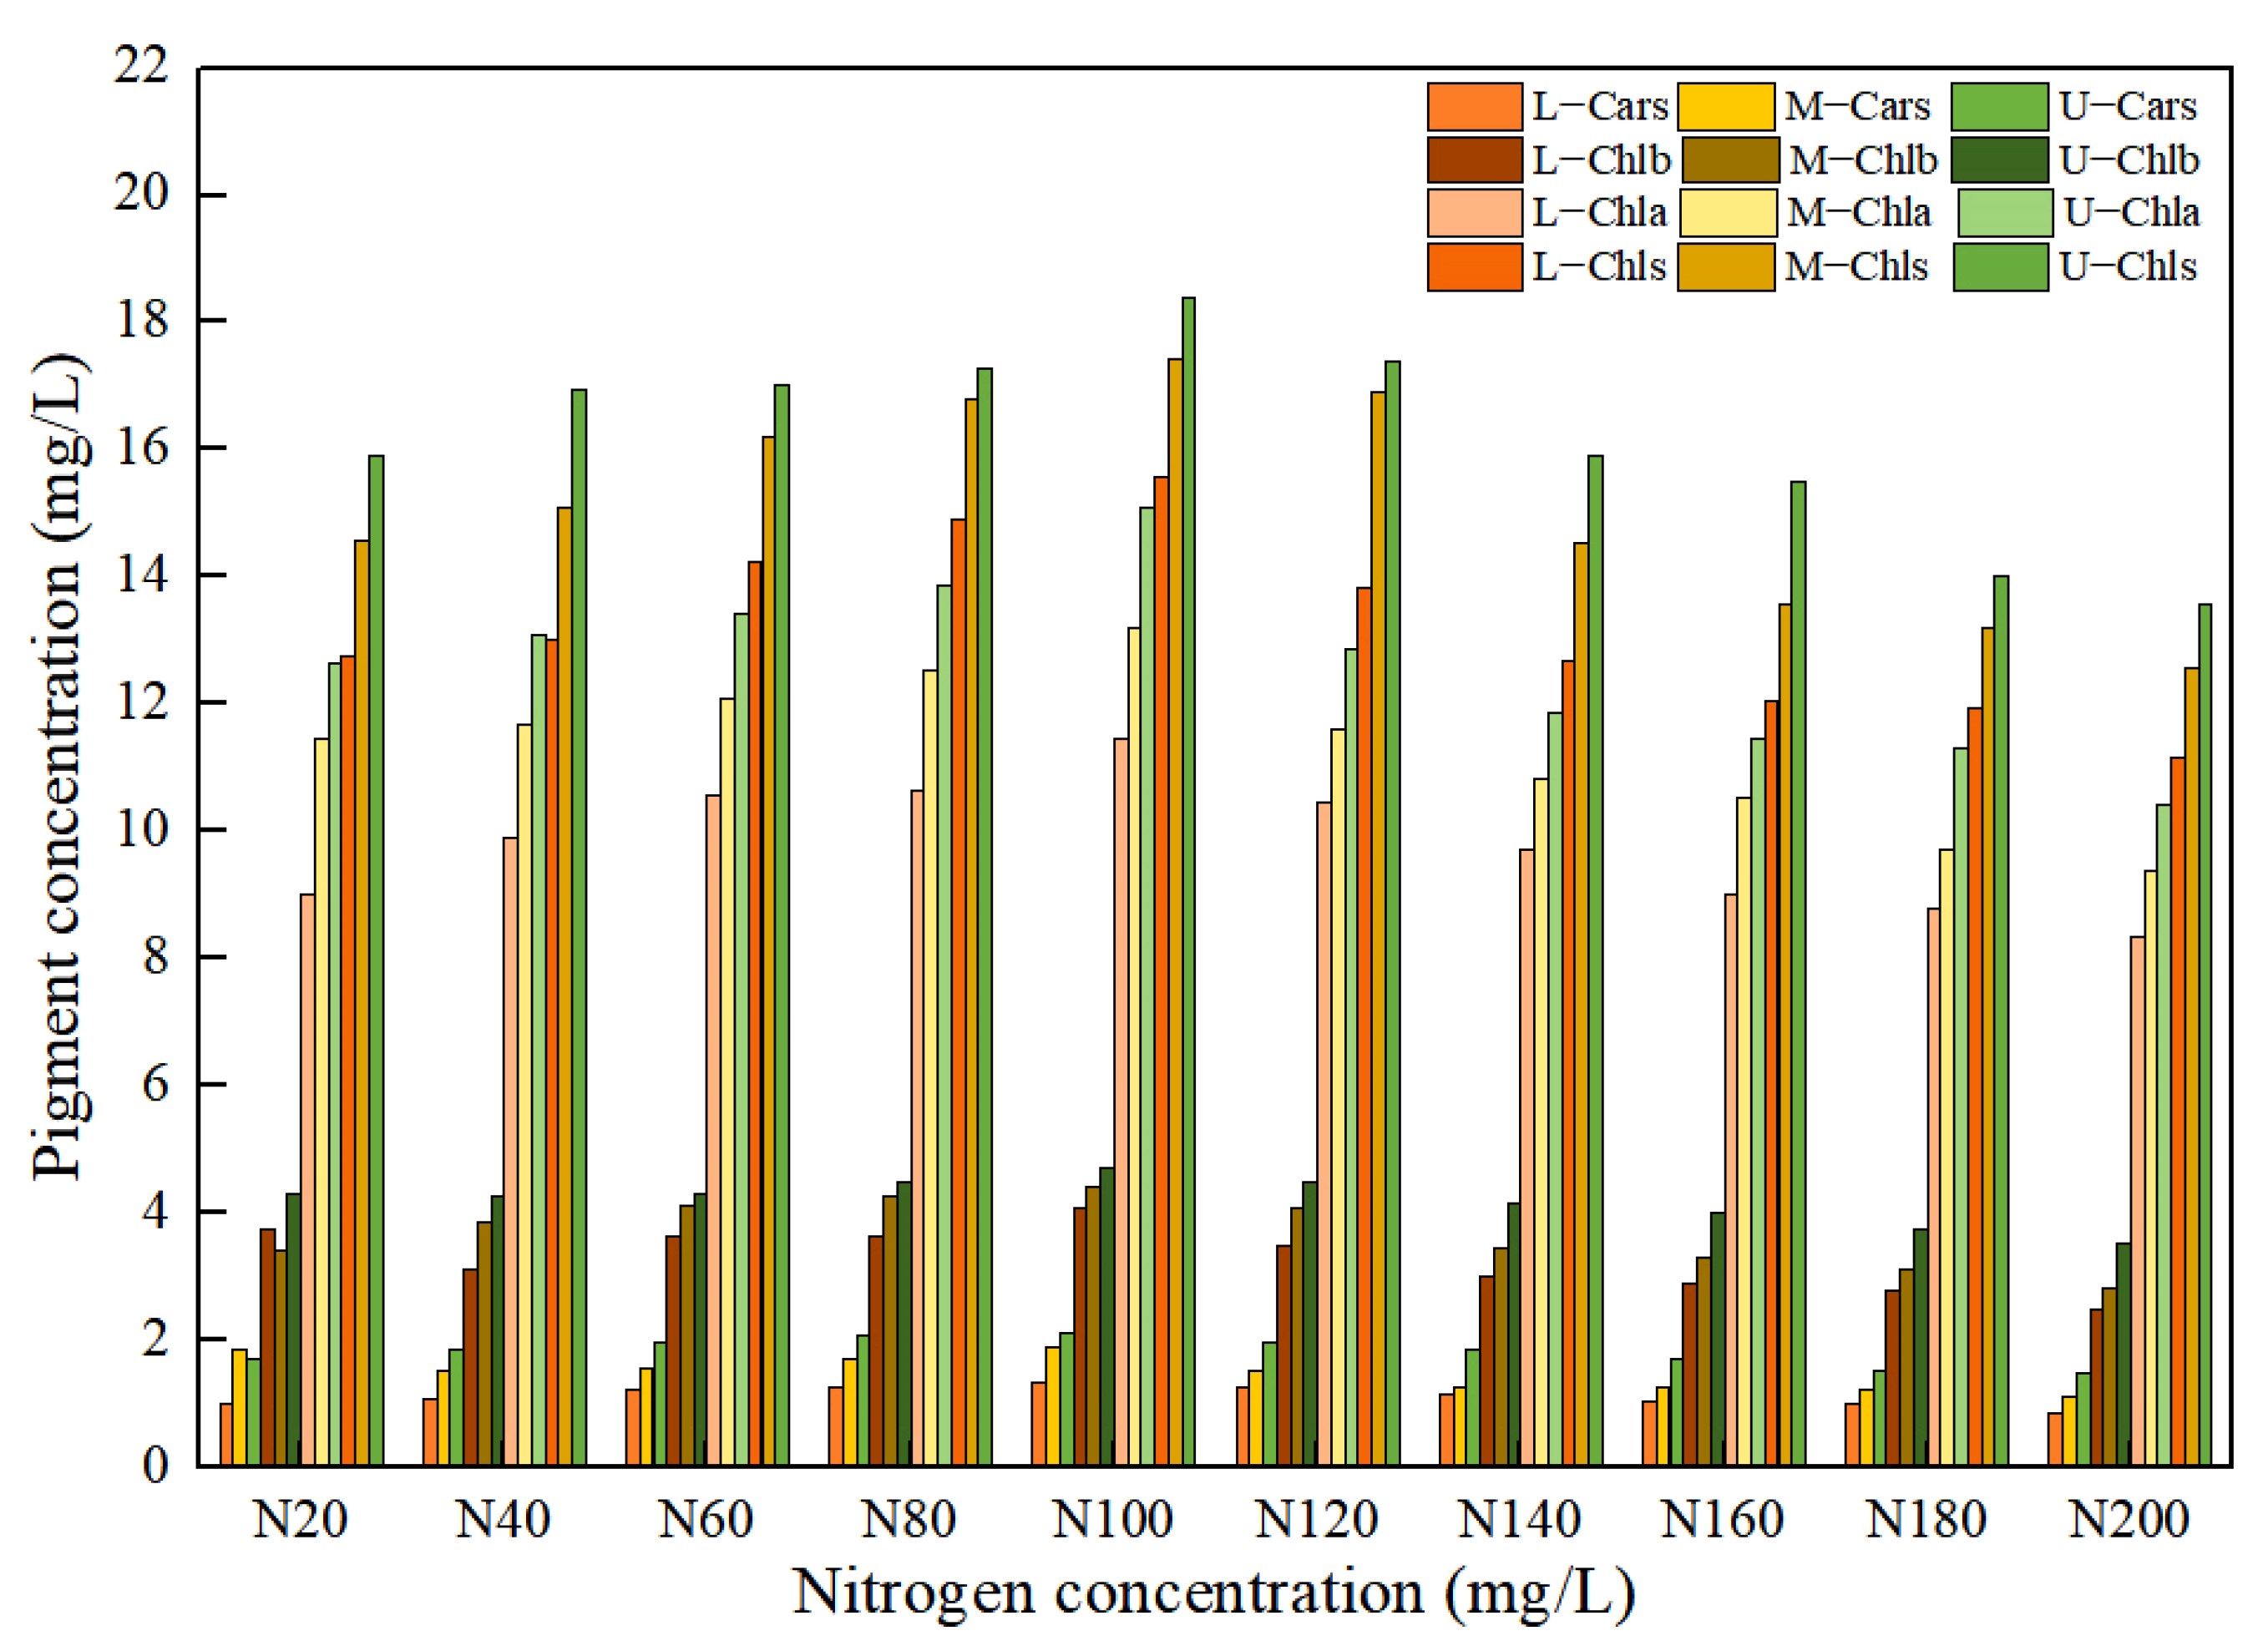

| Pigments | Subsets | NS a | Range (mg/L) | Mean (mg/L) | SD b (mg/L) |
|---|---|---|---|---|---|
| Chla | Calibration set | 326 | 3.37–21.13 | 9.22 | 3.05 |
| Prediction set | 109 | 5.56–20.14 | 9.61 | 2.52 | |
| Chlb | Calibration set | 326 | 1.22–8.49 | 3.29 | 1.23 |
| Prediction set | 109 | 1.80–7.89 | 3.45 | 1.04 | |
| Chls | Calibration set | 326 | 4.61–29.62 | 12.44 | 4.19 |
| Prediction set | 109 | 7.52–28.02 | 13.26 | 5.07 | |
| Cars | Calibration set | 326 | 0.6–3.23 | 1.48 | 0.48 |
| Prediction set | 109 | 0.9–2.8 | 1.50 | 0.42 |
| Pigments | Models | Calibration Set | Prediction Set | RPD | ||
|---|---|---|---|---|---|---|
| Rc2 | RMSEc | Rp2 | RMSEp | |||
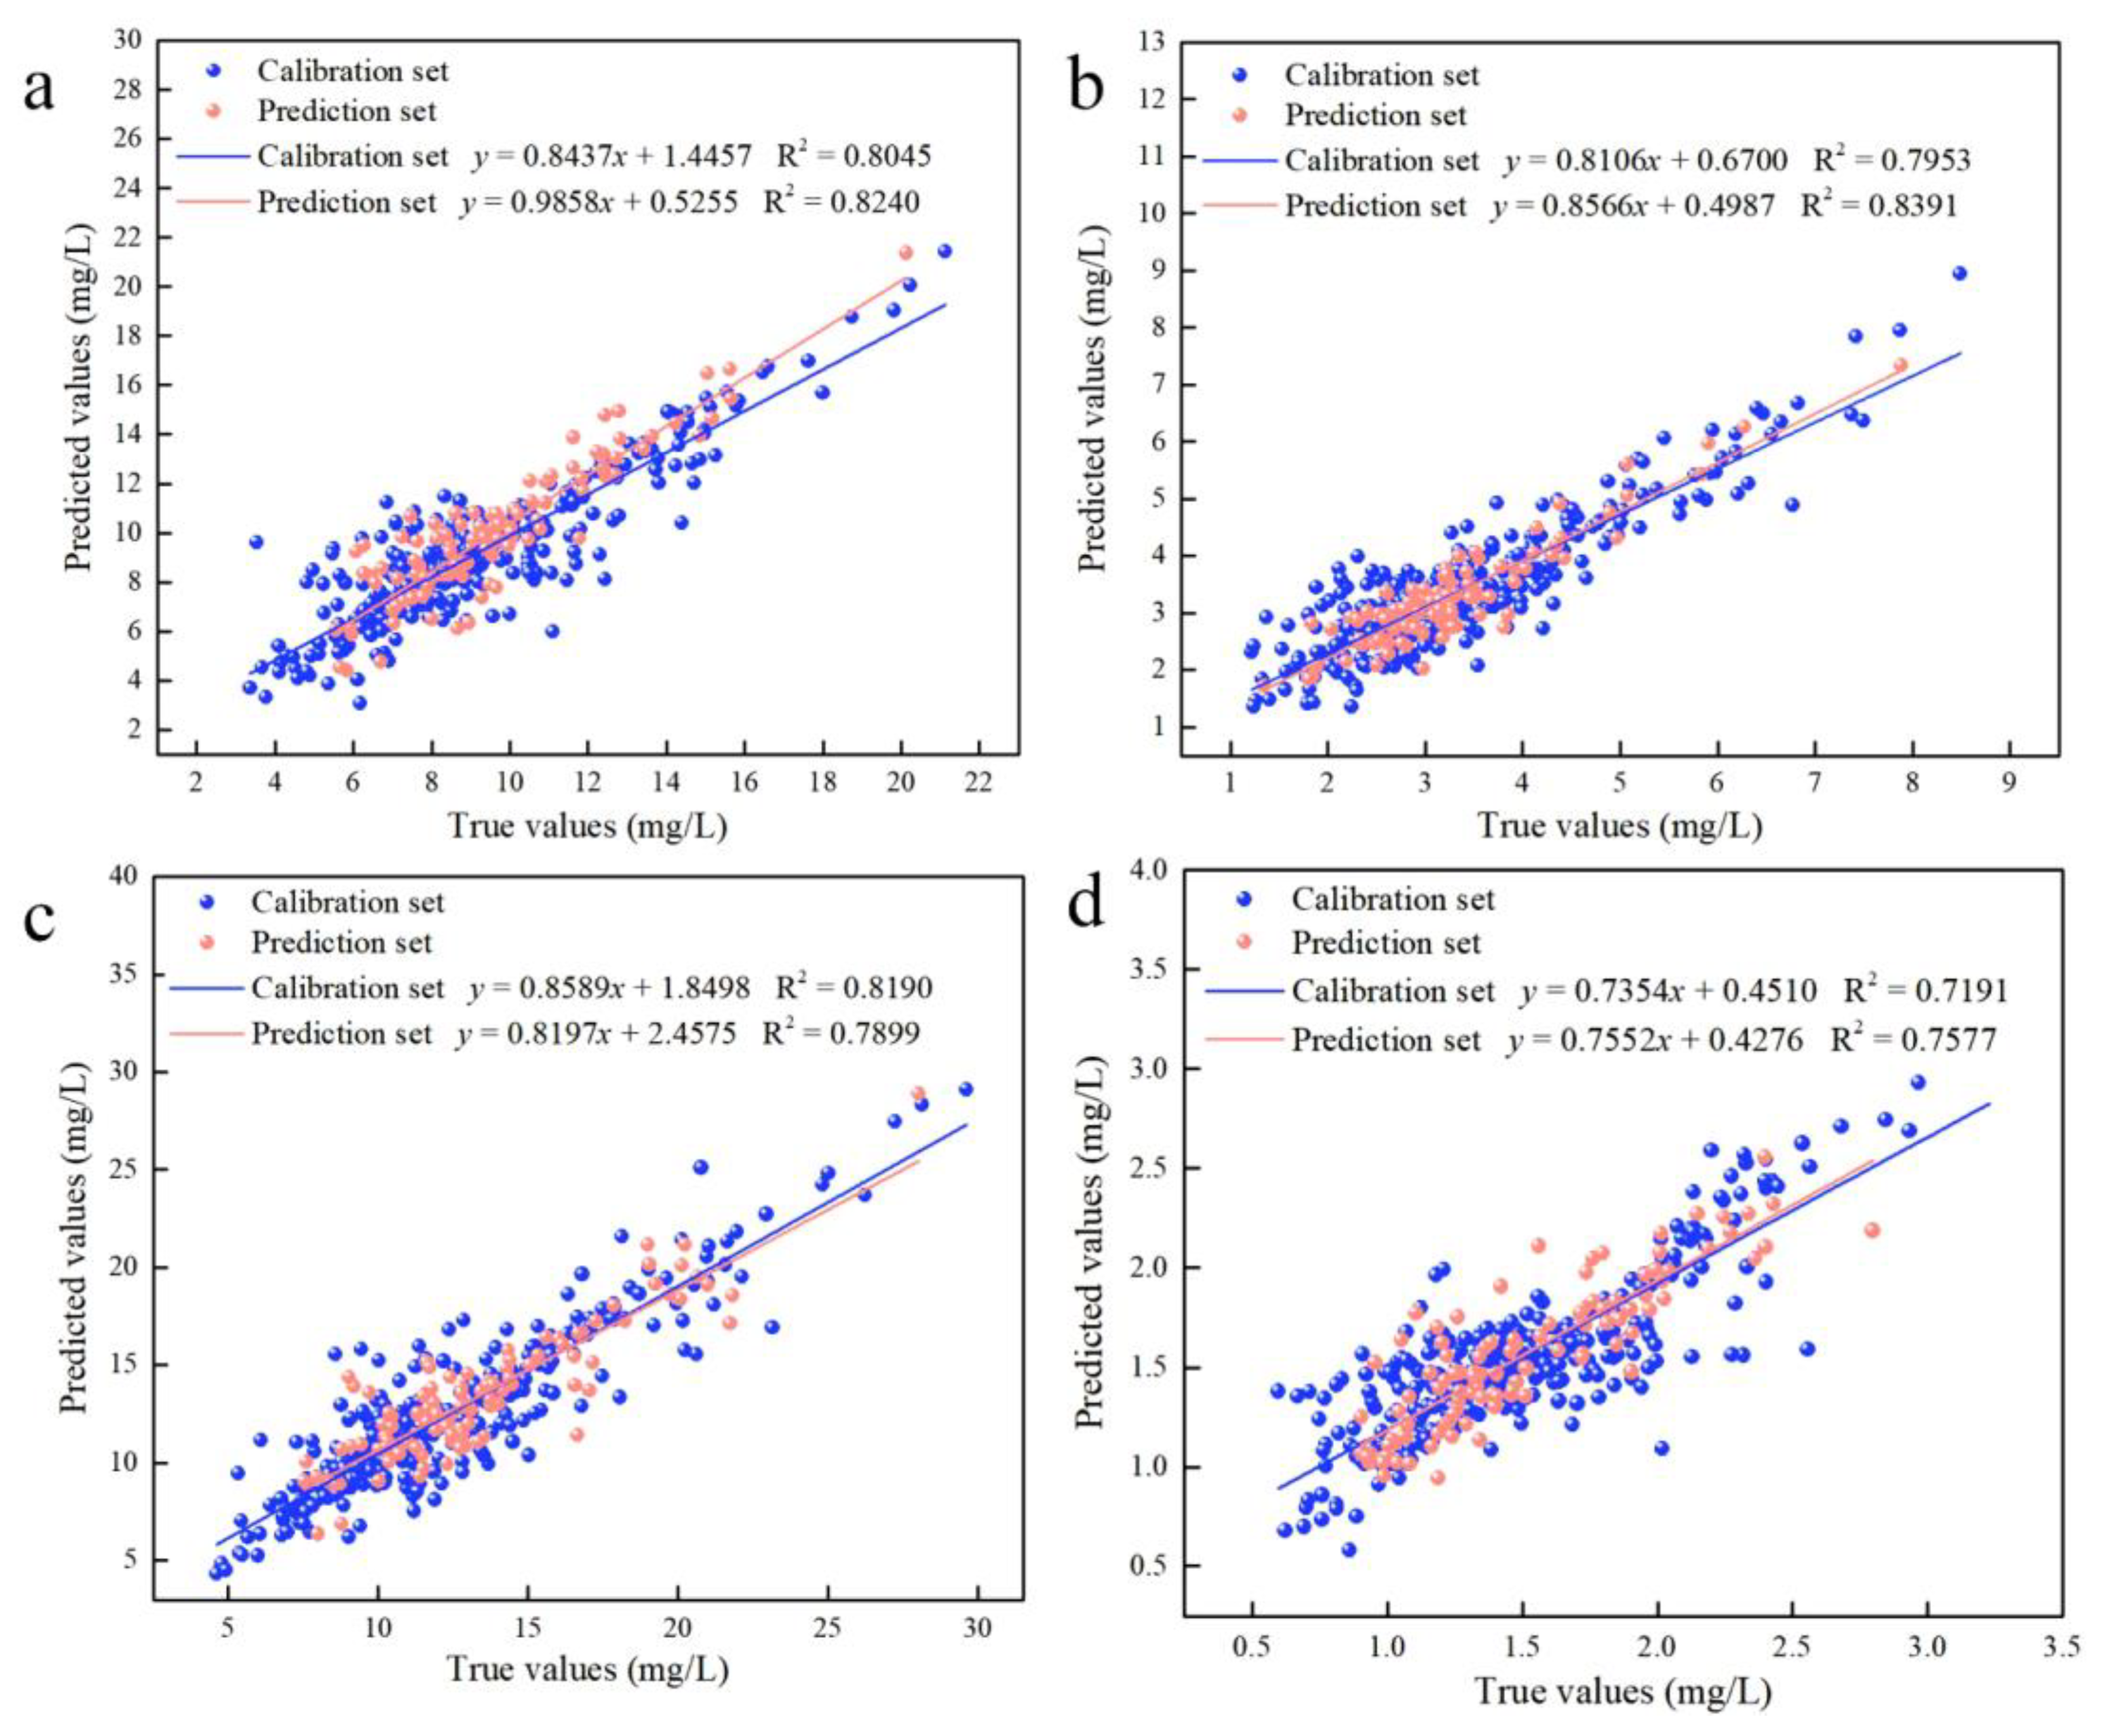
| Chla | PLS | 0.7877 | 1.88 | 0.8064 | 1.49 | 2.27 |
| CARS–PLS | 0.8040 | 1.81 | 0.8168 | 1.45 | 2.34 | |
| CARS–IRIV–PLS | 0.8045 | 1.81 | 0.8240 | 1.43 | 2.38 | |
| Chlb | PLS | 0.7790 | 0.79 | 0.8286 | 0.54 | 2.42 |
| CARS–PLS | 0.7899 | 0.77 | 0.8302 | 0.54 | 2.43 | |
| CARS–IRIV–PLS | 0.7953 | 0.74 | 0.8391 | 0.53 | 2.49 | |
| Chls | PLS | 0.7964 | 2.53 | 0.7776 | 2.25 | 2.12 |
| CARS–PLS | 0.8185 | 2.41 | 0.7869 | 2.25 | 2.17 | |
| CARS–IRIV–PLS | 0.8190 | 2.40 | 0.7899 | 2.24 | 2.18 | |
| Cars | PLS | 0.6768 | 0.35 | 0.7294 | 0.29 | 1.92 |
| CARS–PLS | 0.7170 | 0.33 | 0.7532 | 0.28 | 2.01 | |
| CARS–IRIV–PLS | 0.7191 | 0.33 | 0.7577 | 0.27 | 2.03 | |
Disclaimer/Publisher’s Note: The statements, opinions and data contained in all publications are solely those of the individual author(s) and contributor(s) and not of MDPI and/or the editor(s). MDPI and/or the editor(s) disclaim responsibility for any injury to people or property resulting from any ideas, methods, instructions or products referred to in the content. |
© 2023 by the authors. Licensee MDPI, Basel, Switzerland. This article is an open access article distributed under the terms and conditions of the Creative Commons Attribution (CC BY) license (https://creativecommons.org/licenses/by/4.0/).
Share and Cite
Zhao, J.; Chen, N.; Zhu, T.; Zhao, X.; Yuan, M.; Wang, Z.; Wang, G.; Li, Z.; Du, H. Simultaneous Quantification and Visualization of Photosynthetic Pigments in Lycopersicon esculentum Mill. under Different Levels of Nitrogen Application with Visible-Near Infrared Hyperspectral Imaging Technology. Plants 2023, 12, 2956. https://doi.org/10.3390/plants12162956
Zhao J, Chen N, Zhu T, Zhao X, Yuan M, Wang Z, Wang G, Li Z, Du H. Simultaneous Quantification and Visualization of Photosynthetic Pigments in Lycopersicon esculentum Mill. under Different Levels of Nitrogen Application with Visible-Near Infrared Hyperspectral Imaging Technology. Plants. 2023; 12(16):2956. https://doi.org/10.3390/plants12162956
Chicago/Turabian StyleZhao, Jiangui, Ning Chen, Tingyu Zhu, Xuerong Zhao, Ming Yuan, Zhiqiang Wang, Guoliang Wang, Zhiwei Li, and Huiling Du. 2023. "Simultaneous Quantification and Visualization of Photosynthetic Pigments in Lycopersicon esculentum Mill. under Different Levels of Nitrogen Application with Visible-Near Infrared Hyperspectral Imaging Technology" Plants 12, no. 16: 2956. https://doi.org/10.3390/plants12162956
APA StyleZhao, J., Chen, N., Zhu, T., Zhao, X., Yuan, M., Wang, Z., Wang, G., Li, Z., & Du, H. (2023). Simultaneous Quantification and Visualization of Photosynthetic Pigments in Lycopersicon esculentum Mill. under Different Levels of Nitrogen Application with Visible-Near Infrared Hyperspectral Imaging Technology. Plants, 12(16), 2956. https://doi.org/10.3390/plants12162956


