Abstract
One of the most important effects of climatic changes is increasing temperatures and expanding water deficit stress in tropical and subtropical regions. As the fourth most important cereal crop, barley (Hordeum vulgare L.) is crucial for food and feed security, as well as for a sustainable agricultural system. The present study investigates 56 promising barley genotypes, along with four local varieties (Norooz, Oxin, Golchin, and Negin) in four locations to identify high-yielding and adapted genotypes in the warm climate of Iran. Genotypes were tested in an alpha lattice design with six blocks, which were repeated three times. Traits measured were the number of days to heading and maturity, plant height, thousand kernels weight, and grain yield. A combined analysis of variance showed the significant effects of genotypes (G), environments (E), and their interaction (GEI) on all measured traits. Application of the additive main-effect and multiplicative interaction (AMMI) model to the grain yield data showed that GEI was divided into three significant components (IPCAs), and each accounted for 50.93%, 30.60%, and 18.47%, respectively. Two selection indices [Smith–Hazel (SH) and multiple trait selection index (MTSI)] identified G18, G24, G29, and G57 as desirable genotypes at the four test locations. Using several BLUP-based indices, such as the harmonic mean of genotypic values (HMGV), the relative performance of genotypic values (RPGV), and the harmonic mean of the relative performance of genotypic values (HMRPGV), genotypes G6, G11, G22, G24, G29, G38, G52, and G57 were identified as superior genotypes. The application of GGE analysis identified G6, G24, G29, G52, and G57 as the high-yielding and most stable genotypes. Considering all statistical models, genotypes G24, G29, and G57 can be used, as they are well-adapted to the test locations in warm regions of Iran.
1. Introduction
Barley (Hordeum vulgare L.) is an ancient and important cereal crop. It ranks fourth among all cereal crops produced in the world today, behind wheat, rice, and maize [1]. Along with wheat, barley was one of the first domesticated agricultural crops, dating from about 10,000 years ago in the Fertile Crescent in the Middle East [2]. Among cereal crops, barley in particular is genetically very diverse. It can be classified as a winter or spring, hulled or hulless grain [3], six-row or two-row, and malting or feed by end-use type. Based on grain composition, it is further classified as normal, waxy, high amylose starch types, high β-glucan, high lysine, and proanthocyanidin-free [2]. In addition, it has been shown that barley grains can be considered to be a wholesome food commodity, as they provide various minerals, phosphorus and calcium; a moderate amount of protein and fiber; and a small amount of some types of B vitamin [4]. Barley is known as a significant multi-use cereal crop, grown on more than 500 million hectares worldwide for grain, feed, fodder, and straw. It is not highly selective for soils and climate, and can therefore be grown in infertile soils and in a wide range of climates [5]. In addition, barley is one of the most well-adapted and significant cereal crops in Iran. It is also one of the key forage crops grown in different regions of the country. However, accounting for the differential response of genotypes to environmental conditions, especially climatic factors, is one of the key challenges for breeders and farmers [6].
By analyzing the genotype–environment interaction (GEI), new varieties adapted to multiple environments can be identified [7,8]. For quantitative variables such as yield, a strong GEI significantly limits the ability to select superior genotypes, as it can limit the accuracy of conclusions that would otherwise hold true [9,10,11,12,13]. Indeed, the GEI effect reduces the correlation between genotypic and phenotypic values, and hinders genetic progress in plant breeding programs. Therefore, minimizing the GEI effects is one of the main goals of any breeding program [14]. The degree of GEI can be analyzed using various graphical and numerical approaches. Among the statistical approaches, the additive main effects and multiplicative interaction (AMMI) model, and the genotype (G) main effect plus GEI (GGE) models are of great interest, as these models help breeders understand GEI patterns and evaluate the performance of genotypes under different environmental conditions. Indeed, these models allow breeders to select stable and adaptable genotypes for many environments [7,15]. The use of AMMI and GGE models has several advantages over other approaches. For example, using the AMMI model, phenotypic variation can be estimated easily and separately by separating it into the main effects of genotypes (G) and environments (E), as well as their interactions (GEI). Moreover, the model provides a path to predictive accuracy through a family member model. Furthermore, the model gives breeders the opportunity to use its valuable results of agricultural recommendations to exploit both general and specific adaptations to increase productivity [16]. The GGE biplot model, which provides graphical images of the data, is very useful for GEI interpretation. Using this model, breeders can select a high-performing genotype in a target production environment, as well as identify the target environment for a specific genotype, determine the discriminatory ability and representativeness of environments for further multi-environment trials (METs), unravel correlations between test environments, and identify ideal genotypes in terms of both yield performance and stability [17].
Genetic improvement is accelerating with the study of diverse genetic materials in many environments. Since grain yield is quantitatively inherited and depends mainly on genotypic and environmental factors, indirect selection through other agronomic traits can be useful in identifying superior genotypes [18]. Accordingly, several selection indices have been proposed based on various plant features, such as the selection index for ideal genotype (SIIG) [18], the Smith–Hazel index [19,20], the multiple trait selection index (MTSI) [21], the genotype–ideotype distance index (MGIDI) [22], and the FAI-BLUP index [23] for selecting ideal genotypes based on traits measured by multiple methods in the MET. Several studies have reported the successful use of these indices in selecting desirable genotypes [18,24,25,26,27,28]. Therefore, the use of these indicators, along with stability analysis methods, makes it possible to improve the selection process in breeding programs. In Iran, the Seed and Plant Improvement Institute (SPII) has initiated various breeding programs over the past few decades to improve and develop new cultivars for cultivation in different climates in the country. However, the implementation of newly introduced genotypes into new target environments requires a basic understanding of their yield performance, and the identification of the most suitable environments for future research and characterization of barley cultivars. In this study, we tested a set of new barley breeding genotypes that were selected from the preliminary regional barley yield trial (PBYT). Therefore, the objectives of this study were to determine the magnitude of GEI and identify ideal genotypes with high grain yield in a multi-location experiment.
2. Results
2.1. Analysis of Variance and Genetic Parameters
The results of analysis of variance showed the significant effects of genotypes (G), environments (E), and genotype by environment interaction (GEI) in terms of grain yield and other agronomic traits in the four test environments (Table 1). Of the traits measured, grain yield showed the highest phenotypic coefficient of variance (CVp) values (GY: 11.87%), followed by plant height (PLH: 5.75%), thousand kernels weight (TKW: 4.37%), the number of days to maturity (DMA: 3.23%), and the number of days to heading (DHE: 1.49%). On the other hand, GY, followed by PLH, TKW, DHE, and DMA, showed the highest genotypic coefficient of variance (CVg), (3.98, 3.28, 2.52, 1.23, and 1.18, respectively). Moreover, the GEI variance was high for all measured traits except for MDA. The broad-sense heritability (h2) values ranged from 0.10 (for GY) to 0.17 (for DHE). However, heritability based on the mean (h2gm) showed the highest values and ranged from 0.22 to 0.57. Of the traits measured, GY and DHE showed the lowest and highest values for this genetic parameter. The correlation between genotype and environment (RGE) ranged from 0.12 to 0.53, with the highest values recorded for GY, TKW, and DHE, respectively. In addition, selection accuracy (Acc) for all measured traits was high, and ranged from 0.47 (for GY) to 0.76 (for DHE).

Table 1.
Results of two-way analysis of variance, along with the estimated genetic parameters for measured traits.
2.2. Identification of Best Genotypes Using Selection Indices
The mean values of grain yield and other measured traits at the four test locations are shown in Table 2. GY ranged from 3545.80 kg ha−1 to 5434.90 kg ha−1. PLH ranged from 77 to 94.17 cm, while TKW ranged from 36.12 g to 41.71 g. DHE showed a low index of variation and ranged from 100 to 106.50 days, while DMA showed a high index of variation and ranged from 127.17 to 143.58 days. The Smith–Hazel index (SH) and multiple trait selection index (MTSI) were used to select desirable genotypes in terms of grain yield and other agronomic traits. According to the results, SH values ranged from 2161 to 2449. As shown in Figure 1A, genotypes G2, G57 [Oxin: reference genotype], G6, G11, G24, G7, G26, G29, and G38 were identified as the best genotypes compared to other genotypes. The MTSI values for the test genotypes ranged from 5.44 to 9.77, and genotypes G29, G8, G27, G10, G18, G41, G25, G42, and G30 were identified as the best genotypes (Figure 1B). We used a Venn diagram to compare the results obtained by these indices. As shown in Figure 1C, we found that G18, G24, G29, and G57 could be selected as desirable barley genotypes based on grain yield and other agronomic traits.
Table 2.
Mean values of measured traits across four test locations, along with estimated values of selection and BLUP-based indices.
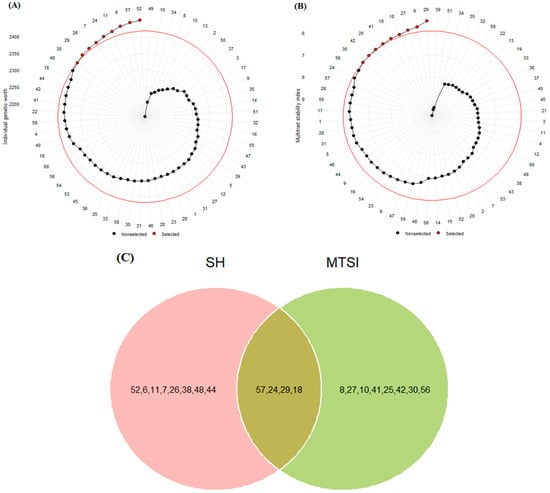
Figure 1.
Selected barley genotypes using Smith–Hazel (A) and multiple trait selection (B) indices. The red circle represents the point separating the desired genotypes, which is marked with a red point. Venn diagram (C) for selected genotypes based on both SH and MTSI indices. The numbers indicate the genotype codes.
2.3. BLUP-Based Adaptability and Stability Indices
The results of the estimated BLUP-based adaptability and stability indices, along with the average grain yield for each genotype tested, are shown in Table 2. The harmonic mean of genotypic values (HMGV) index selects genotypes with stable yield under the mixed-effect model. Among the genotypes tested, genotypes G6, G11, G22, G24, G29, G38, G41, G52, G48, and G57 [Oxin: reference genotype] with the highest values were identified as the most stable genotypes compared to other genotypes. The relative performance of genotypic values (RPGV) describes the point of adaptation. Indeed, this indicator is valuable for identifying the specific adaptability of genotypes, and can take advantage of the response of genotypes to improved growing conditions. As shown in Table 2, genotypes G52, followed by G11, G6, G24, G57 [Oxin: reference genotype], G26, G29, G38, G7, and G22 showed the highest values and were selected as adaptive genotypes. The harmonic mean of the relative performance of genotypic values (HMRPGV) has the advantage of showing the randomness of genotypic effects plus GEI effects, and provides a viewpoint of ranking patterns for genotypes according to their performance based on genetic effects. In other words, this index simultaneously shows the adaptability and stability of genotypes. Based on the HMRPGV index, the top 10 ranked genotypes are G52, G6, G24, G57 [Oxin: reference genotype], G11, G29, G38, G48, G18, and G22, respectively.
2.4. AMMI
The result of the AMMI analysis for the grain yield data showed that the effects of G, E, and GEI were highly significant (Table 3). The main effect of E, G, and GEI accounted for 50.22%, 9.87%, and 23.02% of the total variation, respectively. The GEI effect was divided into three significant IPCAs, each of which accounted for 50.93%, 30.60%, and 18.47%, respectively. The first four genotypes recommended for each test location were identified using the AMMI2 model. As shown in Table 3, genotype G4, G60 [Nobahar: reference genotype], G59 [Norooz: reference genotype], and G52 were identified as the four highest ranked in the Zabol location; genotypes G26, G22, G38, and G6 was observed as the highest ranking in the Gonbad location; genotypes G11, G43, G7, and G52 were dominant in the Ahvaz location; and genotypes G25, G7, G26, and G57 [Oxin: reference genotype] ranked first in the Darab location.
Table 3.
The results of AMMI analysis for grain yield data.
2.5. GGE Biplot Analysis
The results of the GGE biplot methodology showed that the first two components (PCAs) explained 70.26% of the total GY variation at the four test locations. The GGE biplot separated the test locations into two of the ten sectors (Figure 2A). The Ahvaz (E1), Gonbadm (E2), and Darab (E4) locations were placed in one sector, and the apex genotype for this sector was G57 [Oxin: reference genotype]. The Zabol (E3) location was placed in another sector with G60 [Nobahar: reference genotype] as the apex genotype. The “mean vs. stability” biplot viewpoint showed that genotypes G57 [Oxin: reference genotype], G44, G52, and G29 had the highest average grain yield in the locations tested. Genotype G44 showed the grain yield closest to the average value due to its position in the biplot. Genotypes G52 and G57 with a high average grain yield were the most stable, while G4, G7, and G26 showed significant yield variability across locations. However, some genotypes, such as G6, G24, G33, G32, and G45 with low average grain yield indicated high stability (Figure 2B). Figure 2C indicates the representativeness and discriminatory power of the locations. Based on this biplot, the Zabol (E3) and Darab (E4) test locations with the long environment vectors showed the highest discrimination power values. Moreover, the representative ability of the test locations was investigated using the angle between the test location vectors and the AEC (average environment coordinate). Accordingly, the Ahvaz (E1) and Gonbad (E2) locations with smaller angles indicated relatively weak representativeness, while E3 and E4 showed relatively strong representativeness. A comparative view of the GGE biplot was used to select the ideal genotypes (Figure 2D). Among the genotypes tested, G44, followed by G57 [Oxin: reference genotype], G52, G29, G38, G48, G6, G24, G18, G36, G56, G59 [Norooz: reference genotype], and G4 were near the average environment axis (AEA) and were selected as ideal genotypes. Of these, genotypes G29, G38, G48, and G6 showed specific adaptability to the E1 and E2 locations.
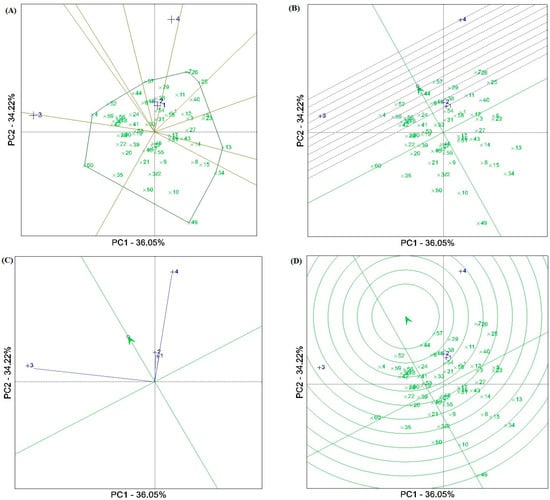
Figure 2.
(A) View of the GGE ‘which–won–where’ biplot of winning genotypes for grain yield in each sector. (B) Biplot for simultaneous selection of grain yield and stability of barley genotypes tested. (C) A view of the ‘discriminating power and representativeness’ of the GGE biplot. (D) Comparison of promising barley genotypes with the ‘ideal’ genotype in terms of grain yield and stability at four test locations. Numbers indicade the genotype codes.
3. Discussion
In recent decades, climatic changes have affected a significant portion of agricultural fields, and agricultural products have been drastically reduced by various environmental stresses [29]. One of the most important effects of climatic changes is increasing temperatures and expanding drought stress in tropical and subtropical regions [5]. Under such circumstances, screening plant genetic materials, with an emphasis on developing high-yielding and stable varieties for cultivation in different target environments, is one of the most important breeding tasks in the world. Consequently, the development of superior genotypes requires an understanding of the GEI pattern in studies conducted at multiple locations. Progress in breeding programs to develop new varieties often depends on the performance of the genotypes tested during breeding cycles. Since grain yield is a quantitative trait, it is usually influenced by genotype, environment, and other growth traits; hence, selecting better genotypes through indirect selection using other traits can increase genetic progress [18]. Previously, most breeders applied classic stability models to identify a stable genotype [25]. These models are often determined only by grain yield data, and ignore other agronomic traits. To solve this challenge, several multi-trait-based selection indices have been proposed. One of these indices is the multiple trait selection index (MTSI) [21].
In this study, we examined a set of barley genotypes in four target locations in warm regions of Iran. Our results indicated the significant effects of genotypes (G), environments (E), and their interaction (GEI) for all measured traits. Among the sources of variation, the effects of E and GEI showed the highest total sum of squares (TSS), indicating significant differences in the genotypic response of barley to environmental conditions in the warm regions of Iran. In line with our results, previous reports also showed that the two mentioned effects were the main sources of variation in barley and other crops under different environmental conditions [30,31,32,33,34,35,36,37,38,39,40]. Among the measured traits, grain yield showed the highest phenotypic variability, while this trait showed the lowest heritability at the four test locations (Table 1). In addition, the results of AMMI analysis showed significant effects for G, E, and GEI on grain yield (Table 3). To identify desirable genotypes, two multi-trait selection indices were used, such as Smith–Hazel and MTSI. In these indices, different traits will directly play a significant role in the selection of genotypes [18]. Since the present study was conducted in warm regions, dwarfing, early earing, and maturity were taken into account as selection criteria for choosing desirable genotypes. On the other hand, the highest values of thousand grain weight and grain yield traits were taken into account in selecting desirable genotypes. Our results showed that each selection index identified different genotypes (Figure 1A,B). However, the four genotypes G18, G24, G29, and G57 were highlighted as desirable genotypes in terms of grain yield and other agronomic traits (Figure 1C). Similarly, Pour-Aboughadareh and Poczai [26,27], Selami et al. [41], Costa et al. [42], Hussain [43], and Zali et al. [18] confirmed the effectiveness of these selection indices in various crops such as wheat, lentil, mango, chickpea, and barley, respectively.
In the METs, breeders commonly use various statistical models to recommend genotypes for the target environments. One of the most important models is the best linear unbiased prediction (BLUP). This model determines the breeding values of genotypes evaluated in multiple environments, and can be used in the selection process. Moreover, the model provides a way to compare genotypes evaluated in different environments [44]. In this regard, several BLUP-based indices have been proposed to compare the genotypes evaluated in MTE experiments. One of these indicators is the harmonic mean of genotypic values (HMGV). According to Borges et al. [45], this index adjusts the predicted genetic values for the genotypes under evaluation and penalizes them based on their instability in the target environments. Relative yield of genotypic values (RPGV) is another BLUP-based index that can be used to identify the specific adaptability of each genotype, due to its ability to exploit the genotypic response to their improvements in the growing environment [46]. The third BLUP-based index is the harmonic mean of the relative performance of genotypic values (HMRPGV). This index is based on the genetic values predicted by the BLUP model, and combines estimates of adaptability and stability. Hence, HMPRGV can provides a ranking pattern for evaluated genotypes in different test environments [45]. With this in mind, the highest values of these indices can identify desirable genotypes with high stability and adaptability in MET experiments. In this regard, our results showed that genotypes G6, G11, G22, G24, G29, G38, G52, and G57 [Oxin: reference genotype] were selected as desirable compared to other genotypes.
The results of the GGE biplot analysis showed that three test locations, including Ahvaz, Darab, and Gonbad were placed in the same sector, and genotype G57 was identified as the best genotype in the sector (Figure 2A). Moreover, this genotype along with G44, G52, and G29 showed the highest yield and yield stability compared to the other genotypes (Figure 2B). A comparative view of the GGE biplot revealed that G44, followed by G57 [Oxin: reference genotype], G52, G29, G38, G48, G6, G24, G18, G36, G56, G59 [Norooz: reference genotype], and G4 were near the average environment axis (AEA) and were selected as ideal genotypes. From the viewpoint of representativeness and discrimination power of the test locations, the Zabol (E3) and Darab (E4) locations with long environmental vectors and Ahvaz (E1) and Gonbad (E2) with smaller angles on the AEC vector (average environment coordinate) showed the highest values of discrimination power and representativeness ability, respectively (Figure 2C). Hence, according to Yan’s theory [47], the Zabol and Darab locations can be classified as a Type III environment, as they are useful for eliminating unstable genotypes in breeding programs. On the other hand, although Ahvaz and Gonbad showed a short vector, they showed small angles with the AEC vector. Therefore, more information on these locations is needed to provide analysis of their role in breeding programs.
4. Materials and Methods
4.1. Plant Materials and Experiment Layouts
A set of 56 promising barley genotypes, along with four introduced local varieties (Norooz, Oxin, Golchin, and Nobahar) used as reference genotypes were tested through trials at multiple locations. All genetic materials were obtained from hybridization between national and international parents. More information on their pedigrees is shown in Supplementary Table S1. Field experiments were carried out at four warm weather test stations (including Ahvaz [31°19′13″ N, 48°40′09″ E], Darab [28°45′07″ N, 54°32′40″ E], Zabol [31°01′43″ N, 61°30′04″ E], and Gonbad [37°15′00″ N, 55°10′02″ E) in Iran during the growing seasons (2022–2023). Of these, Gonbad has warm and humid conditions and is located in the northern parts of the country, while other locations have warm and dry conditions and are located in the southern parts of Iran. In all test environments, field layouts were carried out using an alpha lattice design with three replications and six blocks. The experimental plots consisted of 6 rows, each 5 m long, with 15 cm spacing between rows. The sowing density in each plot was 300 seeds per m2. An experimental planter (Wintersteiger, Ried, Austria) was used for sowing. At each location, basic fertilizers such as P2O5 and N were applied at 100 and 32 kg ha−1, respectively, before sowing. During the growing season, five irrigations were applied at growth stages 00, 32, 51, 75, and 85 Zadoks’ [48] in all test environments. At the ZGS 31 stage, 40 kg ha−1 N was again applied to improve stem elongation. Based on the time of physiological maturity in each test environment, a combine harvester (Wintersteiger, Ried, Austria) was used to harvest the experimental plots. Grain yield was determined for each genotype in the test environment. Other agronomic traits measured were the number of days to heading (DHE) and maturity (DMA), plant height (PLH), and thousand kernels weight (TKW).
4.2. Data Analysis
The experimental data collected from the four locations were subjected to analysis of variance based on the following model using META-R software [49]:
where, Yijk is the trait of interest, μ is the overall mean effect, Loci is the effect of the location, Repj is the effect of the jth replicate, Repj(Loci) is the effect of the jth replication within the ith location, Blockk is the effect of the kth block, Genl is the effect of lth genotype, and εijk is the effect of the error.
Several genetic parameters were estimated, such as the phenotypic and genotypic coefficient of variation in percent, broad-sense heritability and heritability on the mean basis, correlation between genotype and environment, and selection accuracy for all measured traits. To select desirable genotypes based on all measured traits, two multi-traits selection indices, such as the Smith–Hazel (SH) index and multiple trait selection index (MTSI) were calculated using R software ver. 4.3.1. Moreover, several BLUP-based indices were calculated to examine the adaptability and stability of the genotypes studied, as follows:
where, E is the number of environments and Gvij is the genotypic value (BLUP) for the ith genotype in the jth environment.
All these analyses were calculated using the ‘metan’ package [50] in R software [51]. To analyze the effect of GEI on grain yield data, AMMI analysis and GGE biplot analysis were performed. The biplots were rendered based on the first two principal components (PCA1 and PCA2). These analyses were computed using GenStat softwares ver. 23 [VSN International 2023].
5. Conclusions
In this study, we used several biometric models to select undesirable barley genotypes, analyze the impact of GEI, and identify high-performing genotypes in four warm regions of Iran. Ultimately, the results of this study suggest the potential of using the models as valuable tools in barley breeding programs. To conclude, our results identified genotypes G24, G29, and G57 as the superior genotypes based on all models. These genotypes can be used as well-adapted to the test locations in warm regions of Iran. Therefore, comprehensive research on these genotypes is needed before their commercial introduction.
Supplementary Materials
The following supporting information can be downloaded at: https://www.mdpi.com/article/10.3390/plants12223837/s1, Table S1: The pedigree of the 56 promising genotypes of barley, along with four reference genotypes across four locations in the warm climate in Iran.
Author Contributions
Conceptualization, A.P.-A.; methodology, S.K., H.Z., A.M. and A.G.; software, A.P.-A. and J.B.; validation, A.P.-A. and A.B.; formal analysis, A.P.-A. and J.B.; investigation, S.K., H.Z., A.M., A.G., M.K. and A.A.-K.; resources, A.P.-A.; data curation, A.P.-A. and J.B.; writing—original draft preparation, A.P.-A. and J.B.; writing—review and editing, A.P.-A. and J.B.; visualization, A.P.-A.; project administration, A.P.-A.; funding acquisition, J.B. All authors have read and agreed to the published version of the manuscript.
Funding
This research received no external funding.
Data Availability Statement
The data in this manuscript are available from the corresponding authors upon reasonable request.
Acknowledgments
The authors acknowledge the Seed and Plant Improvement Institute (SPII), Agricultural Research, Education and Extension Organization (AREEO), Iran, for providing plant genetic material and supporting the research facilities (Project number: 0-03-03-123-010848).
Conflicts of Interest
The authors declare no conflict of interest.
References
- FAOSTAT Statistical Database. Available online: http://www.fao.org/faostat/en/#home (accessed on 1 October 2023).
- Baik, B.K.; Ullrich, S.E. Barley for food: Characteristics, improvement, and renewed interest. J. Cereal Sci. 2008, 48, 233–242. [Google Scholar] [CrossRef]
- Bocianowski, J.; Warzecha, T.; Nowosad, K.; Bathelt, R. Genotype by environment interaction using AMMI model and estimation of additive and epistasis gene effects for 1000-kernel weight in spring barley (Hordeum vulgare L.). J. Appl. Genet. 2019, 60, 127–135. [Google Scholar] [CrossRef] [PubMed]
- Fatemi, F.; Kianersi, F.; Pour-Aboughadareh, A.; Poczai, P.; Jadidi, O. Overview of identified genomic regions associated with various agronomic and physiological traits in barley under abiotic stresses. Appl. Sci. 2022, 12, 5189. [Google Scholar] [CrossRef]
- Pour-Aboughadareh, A.; Ghazvini, H.; Jasemi, S.S.; Mohammadi, S.; Razavi, S.A.; Chaichi, M.; Ghasemi Kalkhoran, M.; Monirifar, H.; Tajali, H.; Fathihafshjani, A.; et al. Selection of high-yielding and stable genotypes of barley for the cold climate in Iran. Plants 2023, 12, 2410. [Google Scholar] [CrossRef]
- Nykiel, M.; Gietler, M.; Fidler, J.; Graska, J.; Rybarczyk-Płońska, A.; Prabucka, B.; Muszyńska, E.; Bocianowski, J.; Labudda, M. Differential water deficit in leaves is a principal factor modifying barley response to drought stress. Int. J. Mol. Sci. 2022, 23, 15240. [Google Scholar] [CrossRef] [PubMed]
- Ebem, E.C.; Afuape, S.O.; Chukwu, S.C.; Ubi, B.E. Genotype × environment interaction and stability analysis for root yield in sweet potato [Ipomoea batatas (L.) Lam]. Front. Agron. 2021, 3, 665564. [Google Scholar] [CrossRef]
- Linus, R.A.; Olanrewaju, O.S.; Oyatomi, O.; Idehen, E.O.; Abberton, M. Assessment of yield stability of bambara groundnut (Vigna subterranea (L.) Verdc.) using genotype and genotype–environment interaction biplot analysis. Agronomy 2023, 13, 2558. [Google Scholar] [CrossRef]
- Anderson, T.; Lee, C.-R. Strong Selection Genome-Wide Enhances Fitness Trade-Offs Across Environments and Episodes of Selection. Evolution 2014, 68, 16–31. [Google Scholar] [CrossRef]
- Rodrigues, P.C.; Malosetti, M.; Gauch, H.G.; van Eeuwijk, F.A. A Weighted AMMI Algorithm to Study Genotype-by-Environment Interaction and QTL-by-Environment Interaction. Crop Sci. 2014, 54, 1555–1570. [Google Scholar] [CrossRef]
- Van Eeuwijk, F.A.; Bustos-Korts, D.V.; Malosetti, M. What should students in plant breeding know about the statistical aspects of genotype × Environment interactions? Crop Sci. 2016, 56, 2119–2140. [Google Scholar] [CrossRef]
- Oladosu, Y.; Rafii, M.Y.; Abdullah, N.; Magaji, U.; Miah, G.; Hussin, G.; Ramli, A. Genotype × Environment interaction and stability analyses of yield and yield components of established and mutant rice genotypes tested in multiple locations in Malaysia. Acta Agric. Scand. Sect. B—Soil Plant Sci. 2017, 67, 590–606. [Google Scholar] [CrossRef]
- Wodebo, K.Y.; Tolemariam, T.; Demeke, S.; Garedew, W.; Tesfaye, T.; Zeleke, M.; Gemiyu, D.; Bedeke, W.; Wamatu, J.; Sharma, M. AMMI and GGE biplot analyses for mega-environment identification and selection of some high-yielding oat (Avena sativa L.) genotypes for multiple environments. Plants 2023, 12, 3064. [Google Scholar] [CrossRef]
- Amelework, A.B.; Bairu, M.W.; Marx, R.; Laing, M.; Venter, S.L. Genotype × environment interaction and stability analysis of selected cassava cultivars in South Africa. Plants 2023, 12, 2490. [Google Scholar] [CrossRef] [PubMed]
- Hossain, M.A.; Sarker, U.; Azam, M.G.; Kobir, M.S.; Roychowdhury, R.; Ercisli, S.; Ali, D.; Oba, S.; Golokhvast, K.S. Integrating BLUP, AMMI, and GGE models to explore GE interactions for adaptability and stability of winter lentils (Lens culinaris Medik.). Plants 2023, 12, 2079. [Google Scholar] [CrossRef]
- Gauch, H.G. A simple protocol for AMMI analysis of yield trials. Crop Sci. 2013, 53, 1860–1869. [Google Scholar] [CrossRef]
- Gauch, H.G. Statistical analysis of yield trials by AMMI and GGE. Crop Sci. 2006, 46, 1488–1500. [Google Scholar] [CrossRef]
- Zali, H.; Barati, A.; Pour-Aboughadareh, A.; Gholipour, A.; Koohkan, S.; Marzoghiyan, A.; Bocianowski, J.; Bujak, H.; Nowosad, K. Identification of superior barley genotypes using selection index of ideal genotype (SIIG). Plants 2023, 12, 1843. [Google Scholar] [CrossRef] [PubMed]
- Smith, H.F. A discriminant function for plant selection. Ann. Eugen. 1936, 7, 240–250. [Google Scholar] [CrossRef]
- Hazel, L.N. The genetic basis for constructing selection indexes. Genetics 1943, 28, 476–490. [Google Scholar] [CrossRef] [PubMed]
- Olivoto, T.; Licio, A.D.C.; Ada Silva, J.G.; Marchioro, V.S.; de Souza, V.Q.; Jost, E. Mean performance and stability in multi-environment trials I: Combining features of AMMI and BLUP techniques. Agron. J. 2019, 111, 2949–2960. [Google Scholar] [CrossRef]
- Olivoto, T.; Nardino, M. MGIDI: A novel multi-trait index for genotype selection in plant breeding. Bioinformatics 2021, 37, 1383–1389. [Google Scholar] [CrossRef] [PubMed]
- Rocha, J.; Machado, J.C.; Carneiro, P.C.S. Multi trait index based on factor analysis and ideotype-design: Proposal and application on elephant grass breeding for bioenergy. Glob. Chang. Biol. Bioeng. 2018, 10, 52–60. [Google Scholar] [CrossRef]
- Bizari, E.H.; Val, B.H.P.; Pereira, E.M.; Mauro, A.O.D.; Trevisoli, S.H.U. Selection indices for agronomic traits in segregation populations of soybean. Rev. Cienc. Agron. 2017, 48, 110–117. [Google Scholar] [CrossRef]
- Benakanahalli, N.K.; Sridhara, S.; Ramesh, N.; Olivoto, T.; Sreekantappa, G.; Tamam, N.; Abdelbacki, A.M.M.; Elansary, H.O.; Abdelmohsen, S.A.M. A Framework for identification of stable genotypes based on MTSI and MGDII Indexes: An example in guar (Cymopsis tetragonoloba L.). Agronomy 2021, 11, 1221. [Google Scholar] [CrossRef]
- Pour-Aboughadareh, A.; Poczai, P. Dataset on the use of MGIDI index in screening drought-tolerant wild wheat accessions at the early growth stage. Data Brief 2021, 36, 107096. [Google Scholar] [CrossRef]
- Pour-Aboughadareh, A.; Poczai, P.A. A dataset on multi-trait selection approaches for screening desirable wild relatives of wheat. Data Brief 2021, 39, 107541. [Google Scholar] [CrossRef] [PubMed]
- Pour-Aboughadareh, A.; Sanjani, S.; Nikkhah-Chamanabad, H.; Asadi, A.; Amini, A. Identification of salt-tolerant barley genotypes using multiple-traits index and yield performance at the early growth and maturity stages. Bull. Natl. Res. Cent. 2021, 45, 117. [Google Scholar] [CrossRef]
- Ghaffari, M.; Gholizadeh, A.; Andarkhor, S.A.; Zareei Siahbidi, A.; Ahmadi, S.A.; Shariati, F.; Rezaeizad, A. Stability and genotype × environment analysis of oil yield of sunflower single cross hybrids in diverse environments of Iran. Euphytica 2021, 217, 187. [Google Scholar] [CrossRef]
- Ghazvini, H.; Bagherikia, S.; Pour-Aboughadareh, A.; Sharifalhossaini, M.; Razavi, S.A.; Mohammadi, S.; GhasemiKalkhoran, M.; Fathihafshejani, A.; Khakizade, G. GGE biplot analysis of promising barley lines in the cold regions of Iran. J Crop Improv. 2021, 36, 461–472. [Google Scholar] [CrossRef]
- Ahakpaz, F.; Abdi, H.; Neyestani, E.; Hesami, A.; Mohammadi, B.; Nader Mahmoudi, K.; Abedi-Asl, G.; Jazayeri Noshabadi, M.R.; Ahakpaz, F.; Alipour, H. Genotype-by-environment interaction analysis for grain yield of barley genotypes under dryland conditions and the role of monthly rainfall. Agric. Water Manag. 2021, 245, 10665. [Google Scholar] [CrossRef]
- Hilmarsson, H.S.; Rio, S.; Sanchez, J.I.Y. Genotype by environment interaction analysis of agronomic spring barley traits in Iceland using AMMI, Factorial Regression Model and Linear Mixed Model. Agronomy 2021, 11, 499. [Google Scholar] [CrossRef]
- Pour-Aboughadareh, A.; Barati, A.; Koohkan, S.A.; Jabari, M.; Marzoghian, A.; Gholipoor, A.; Shahbazi-Homonloo, K.; Zali, H.; Poodineh, O.; Kheirgo, M. Dissection of genotype-by-environment interaction and yield stability analysis in barley using AMMI model and stability statistics. Bull. Natl. Res. Cent. 2022, 46, 19. [Google Scholar] [CrossRef]
- Mortazavian, S.M.M.; Nikkhah, H.R.; Hassani, F.A.; Hosseini, S.; Taheri, M.; Mahloohi, M. GGE biplot and AMMI analysis of yield performance of barley genotypes across different environments in Iran. J. Agric. Sci. Technol. 2014, 16, 609–622. [Google Scholar]
- Dehghani, H.; Ebadi, A.; Yousefi, A. Biplot analysis of genotype by environment interaction for barley yield in Iran. Agron. J. 2006, 98, 388–393. [Google Scholar] [CrossRef]
- Moussa, S.A.M.; Hala, A.A.E.; Nashwa, I.A.E. Stability study of sweet potato yield and its component characters under different environments by joint regression analysis. J. Hortic. Sci. Ornam. Plants 2011, 3, 43–54. [Google Scholar]
- Hasan, M.J.; Kulsum, M.U.; Sarker, U.; Matin, M.Q.I.; Shahin, N.H.; Kabir, M.S.; Ercisli, S.; Marc, R.A. Assessment of GGE, AMMI, Regression, and Its Deviation Model to Identify Stable Rice Hybrids in Bangladesh. Plants 2022, 11, 2336. [Google Scholar] [CrossRef]
- Francis, T.R.; Kannenberg, L.W. Yield Stability Studies in Short-Season Maize. I. A Descriptive Method for Grouping Genotypes. Can. J. Plant Sci. 1978, 58, 1029–1034. [Google Scholar] [CrossRef]
- Tekalign, A.; Sibiya, J.; Derera, J.; Fikre, A. Analysis of Genotype × Environment Interaction and Stability for Grain Yield and Chocolate Spot (Botrytis Fabae) Disease Resistance in Faba Bean (Vicia Faba). Aust. J. Crop Sci. 2017, 11, 1228–1235. [Google Scholar] [CrossRef]
- Farshadfar, E. Incorporation of AMMI Stability Value and Grain Yield in a Single Non-Parametric Index (GSI) in Bread Wheat. Pak. J. Biol. Sci. 2008, 11, 1791. [Google Scholar] [CrossRef] [PubMed]
- Sellami, M.H.; Pulvento, C.; Lavini, A. Selection of suitable genotypes of lentil (Lens culinaris Medik.) under rainfed conditions in south italy using multi-trait stability index (MTSI). Agronomy 2021, 11, 1807. [Google Scholar] [CrossRef]
- Costa, C.S.R.; Lima, M.A.C.; Neto, F.P.L.N.; Costa, A.E.S.; Vilvert, J.C.; Martins, L.S.S.; Musser, R.S. Genetic parameters and selection of mango genotypes using the FAI-BLUP multitraits index. Sci Hortic. 2023, 317, 112049. [Google Scholar] [CrossRef]
- Hussain, T.; Akram, Z.; Shabbir, G.; Manaf, A.; Ahmed, M. Identification of drought tolerant chickpea genotypes through multi trait stability index. Saudi J. Biol Sci. 2021, 28, 6818–6828. [Google Scholar] [CrossRef] [PubMed]
- Daba, S.D.; Kiszonas, A.M.; McGee, R.J. Selecting high-performing and stable pea genotypes in multi-environmental trial (MET): Applying AMMI, GGE-biplot, and BLUP procedures. Plants 2023, 12, 2343. [Google Scholar] [CrossRef] [PubMed]
- Borges, V.; Soares, A.A.; Reis, M.S.; Resende, M.D.V.; Cornélio, V.M.O.; Leite, N.A.; Vieira, A.R. Desempenho genotipico de linhagens de arroz de terras altas utilizando metodologia de modelos mistos. Bragantia 2010, 69, 833–841. [Google Scholar] [CrossRef]
- Resende, M.D.V.; de Duarte, J.B. Precisão e controle de qualidade em experimentos de avaliação de cultivares. Pesqui Agropecu Trop. 2007, 37, 182–194. [Google Scholar]
- Yan, W.; Kang, M.S. GGE Biplot Analysis: A Graphical Tool for Breeders, Geneticists, and Agronomists; CRC Press: Boca Raton, FL, USA, 2002; p. 287. [Google Scholar]
- Zadoks, J.C.; Chang, T.T.; Konzak, C.F. A decimal code for the growth stages of cereals. Weed Res. 1974, 14, 415–421. [Google Scholar] [CrossRef]
- Alvarado, G.; Rodriguez, F.M.; Burgueno, J.; Crossa, J.; Vargas, M.; Rodriguez, P.P.; Lopez-Cruz, M.A. META-R: A software to analyze data from multi-environment plant breeding trials. Crop J. 2020, 8, 745–756. [Google Scholar] [CrossRef]
- Olivoto, T.; Lucio, A.D. Metan: An R package for multi-environment trial analysis. Methods Ecol. Evol. 2020, 11, 783–789. [Google Scholar] [CrossRef]
- R Core Team. R: A Language and Environment for Statistical Computing; R Foundation for Statistical Computing: Vienna, Austria, 2018. [Google Scholar]
Disclaimer/Publisher’s Note: The statements, opinions and data contained in all publications are solely those of the individual author(s) and contributor(s) and not of MDPI and/or the editor(s). MDPI and/or the editor(s) disclaim responsibility for any injury to people or property resulting from any ideas, methods, instructions or products referred to in the content. |
© 2023 by the authors. Licensee MDPI, Basel, Switzerland. This article is an open access article distributed under the terms and conditions of the Creative Commons Attribution (CC BY) license (https://creativecommons.org/licenses/by/4.0/).