Article

Effects of Low-Light Environments on the Growth and Physiological and Biochemical Parameters of Indocalamus and Seasonal Variations in Leaf Active Substance Contents

College of Landscape Architecture, Sichuan Agricultural University, Chengdu 611130, China
*
Author to whom correspondence should be addressed.
Plants 2023, 12(23), 3993; https://doi.org/10.3390/plants12233993
Submission received: 17 October 2023 / Revised: 10 November 2023 / Accepted: 26 November 2023 / Published: 27 November 2023
(This article belongs to the Section Plant Response to Abiotic Stress and Climate Change)

Abstract

:
Indocalamus, characterized by its expansive leaves, low height, strong reproductive capacity, and abundant bioactive compounds, has extensive utility in the realms of food processing, the manufacturing of packaging materials, and the advancement of novel pharmaceuticals. Two light environments, CK (100% full light) and ST (50% full light), were established to explore the effects of low-light environments on the reproductive ability, morphological characteristics, photosynthetic properties, and leaf active substances of 14 Indocalamus species. The findings revealed that in comparison to the CK treatment, for 14 species of Indocalamus under the ST treatment, (1) the diameter, single leaf area, and leaf area index increased by 8.27%, 8.14%, and 17.88%, respectively; (2) the net photosynthetic rate decreased by 15.14%, and the total chlorophyll contents increased by 20.25%; and (3) the total flavonoid contents increased by 18.28% in autumn, the total polyphenol contents increased by 48.96% in spring, and the total polysaccharide contents increased by 31.44% and 30.81% in summer and winter, respectively. In summary, Indocalamus are adapted to survive in low-light environments; the growth and physiological indices differ significantly between the two light environments, and the low-light environment can effectively promote the growth and development of the leaves. Furthermore, the leaves are rich in flavonoids, polyphenols, polysaccharides, and active substances, which are affected by the light intensity and the season to varying degrees, and autumn and winter are the best times for harvesting the leaves. The leaves of I. hunanensis and I. lacunosus are richest in flavonoids and polyphenols, while the leaves of I. kunmingensis cv. fuminer are richest in polysaccharides. The main findings of this study demonstrate that Indocalamus has strong shade tolerance and tremendous leaf value, laying the foundation for broadening the application of their leaves and for their industrial development in understory composite planting systems.

1. Introduction

Indocalamus belongs to the Bambusoideae (Gramineae), which is a class of dwarf bamboo with large evergreen leaves and landscaping value [1]. They have rapid growth rates, high yields, and high reproductive capacity, and are easy to manage after planting [2]. Indocalamus has a wide range of uses; their culms can be used to make bamboo chopsticks, pen culms, and broom handles, among other things, and they are regarded as one of the most significant resources for the development of flavonoid products due to the high flavonoid contents in their leaves and the ease with which the flavonoids can be extracted, isolated, and purified [3,4]. Moreover, the leaves of Indocalamus are a rich source of bioactive compounds such as polyphenols, polysaccharides, chlorophylls, and various aromatic components [5,6] with anticancer, antitumor, and antioxidant effects as well as antibacterial properties [7,8]. In recent years, Indocalamus leaves have been extensively utilized in food processing, packaging material manufacturing, and the development of new drugs [9,10]. Indocalamus is not only a group of bamboo species with excellent leaf uses but also ideal greening plants for understory planting, with broad application value and development potential.
Understory planting enhances land utilization by maximizing vertical space, which not only reduces planting costs but also improves soil biodiversity and ecosystem function [11]. Whereas the light transmission rate in gaps within the forest is an important factor affecting the survival, growth, regeneration, and ultimate productivity of understory plants, light is an environmental signal that regulates the growth, development, and morphogenesis of plants [12]. Common groundcover bamboo species, Indocalamus, are adaptive to changes in light [13], producing a series of regulatory mechanisms to improve light capture efficiency in low light, allowing plants to adapt to low light quantum densities and maintain normal biological functions [14,15,16]. The leaves of the Indocalamus are large, and the leaves are the main organs for various physiological and metabolic activities. Due to phenotypic plasticity, the leaves usually show significant morphological and physiological regulation under different light environments [17], and the regulation of light intensity within an appropriate range can aid Indocalamus leaf growth [18].
The production of bioactive compounds in plants is believed to be influenced by numerous factors, with individual plant development being the most significant [19]. Light intensity can affect individual plant development by influencing life activities such as photosynthesis and respiration, and modulation of light conditions can influence the synthesis and catabolic processes of plant active substances [20]. The accumulation of bioactive compounds in plants is closely related to seasonal changes, which alter the climatic factors of the plant growth environment, thereby affecting the growth and physiological and metabolic activities of plants, and plants alter their types and contents of bioactive compounds in their structures in response to climate change [21]. Light intensity and seasonal changes can synergistically inhibit or stimulate the ability of Indocalamus to synthesize bioactive compounds, affecting the production of leaf active substances and the time at which the leaf active substance contents reach their annual peak, thereby delaying or advancing the optimal harvesting period for leaves [22].
This study was closely integrated with the potential application environment of Indocalamus and was carried out to investigate the growth physiology and leaf active substances of 14 species of Indocalamus in two categories of light environments. The aim was to reveal the growth, physiological, and biochemical responses of these species to the low-light environment and the dynamic change patterns in leaf active substances and to determine the optimal harvest time of the leaves.

2. Materials and Methods

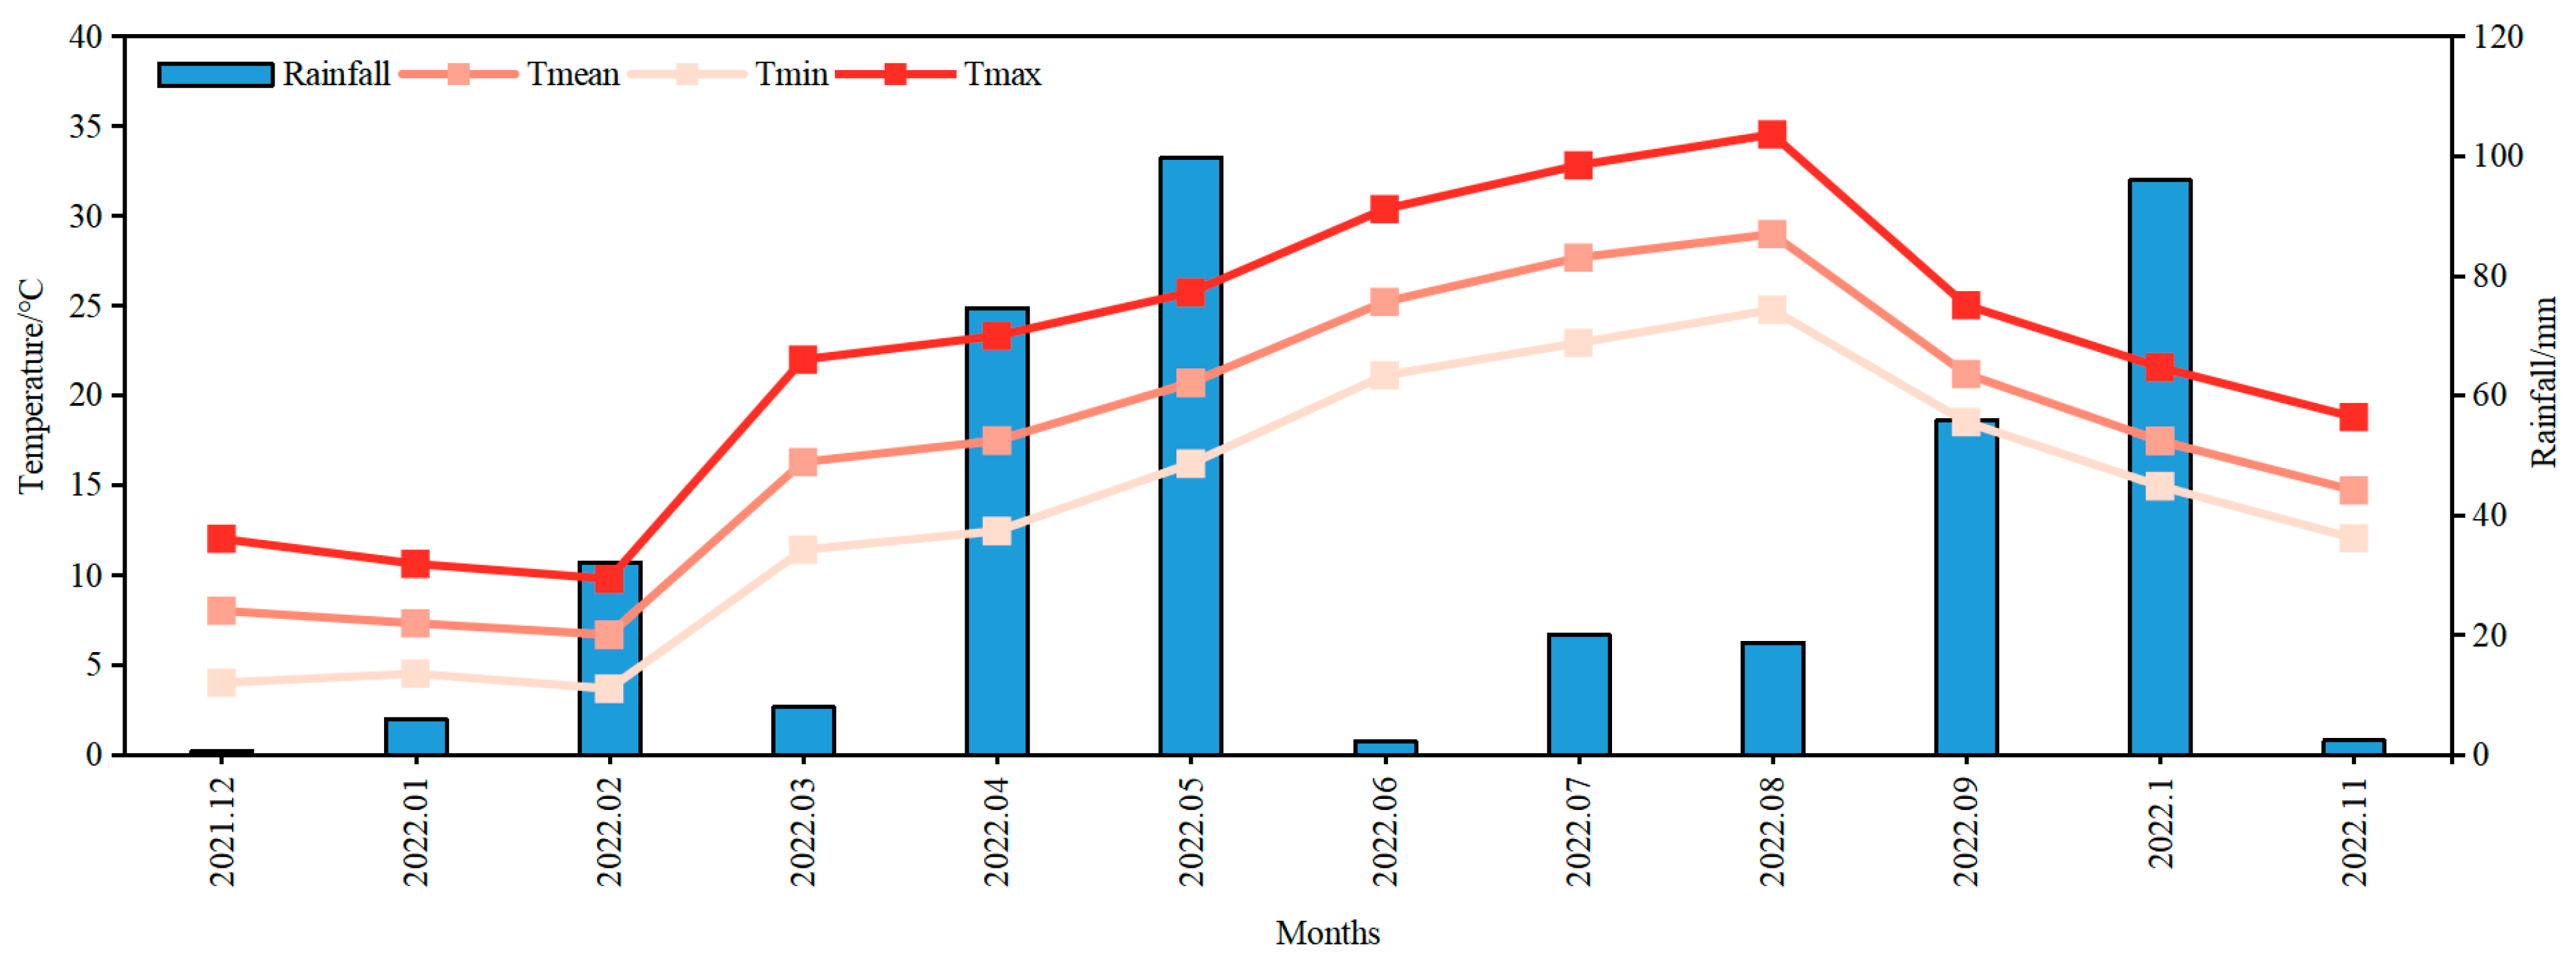
2.1. Plant Materials and Growth Conditions

The 14 Indocalamus species used in the experiment were all from Asia (Table A1). For all species, 2 year old split seedlings were used. The experimental site is located in the southwestern region of China (30°42′35.58″ N, 103°47′49.06″ E), which has a humid subtropical monsoon climate characterized by four distinct and pleasant seasons, with high temperatures and rainfall during the summer, while the winter season is mild and humid (Figure 1). The nursery consisted of a raised bed comprising a total of 28 planting plots, with each species of Indocalamus occupying two plots. Each planting plot measured 3 m in length and 1.2 m in width, resulting in a total area of 3.6 m2. Additionally, an isolation ditch with a width of 50 cm and a depth of 20 cm was established between each planting plot. Each plot was planted with 3 clusters of identical species of Indocalamus, and the number of standing bamboos (i.e., maternal bamboo) per cluster was 10–12. The maternal bamboos of different species exhibited variations in body volumes, consequently resulting in varying quantities of maternal bamboos during the planting process. A total of 28 planting plots were divided into two groups, with 14 plots receiving the 100% full light treatment and the remaining 14 plots receiving the 50% full light treatment. Shade nets were used to shade the top and periphery of the 14 planting plots in the shade treatment, and the shade effect in the 50% full light treatment was achieved by adjusting the light transmission slits of the nets. The soil in the nursery is composed of yellow loam with a pH of 6.82, containing 20.3 mg·kg−1 of organic matter, 238.0 mg·kg−1 of effective nitrogen, 116.3 mg·kg−1 of fast-acting phosphorus, and 76.1 mg·kg−1 of fast-acting potassium.

2.2. Experimental Design

From December 2021 to November 2022, two light environments, CK (100% full light) and ST (50% full light), were set up for 14 species of Indocalamus. In October 2022, the number of newly grown bamboos of Indocalamus was counted after a single growth cycle, and the heights, diameters, area of a single leaf, leaf area index (LAI), net photosynthetic rate (Pn), total chlorophyll contents (TChl), and chlorophyll a/b ratio (Chl a/b ratio) were determined. The investigation conducted during the dynamic observation phase involved the determination of the total flavonoid (TFC), total polyphenol (TPC), and total polysaccharide (TPS) contents of each bamboo species in winter (January 2022), spring (April 2022), summer (July 2022), and autumn (October 2022).

2.3. Measurement Methods

2.3.1. Observation of the Number of Bamboo Shoots

The young bamboos aged 2 to 3 years with good growth were the maternal bamboos; new bamboo shoots were grown during the shooting period (February to May), and the number of new bamboos was counted after the new shoots had become bamboos. New bamboo rate = (the number of new bamboos per clump ÷ the number of maternal bamboos per clump) × 100%.

2.3.2. Leaf Morphology and Quantification

Fully grown bamboo with fully extended leaves and uniform growth in four directions was randomly selected per treatment. A total of 12 new bamboos were selected for this study. Specifically, the median leaves from the middle and upper twigs that were healthy and undamaged were chosen. The outlines of these leaves were then meticulously drawn, and their areas were measured using AutoCAD software (Ver. 2019, Autodesk Corp., San Francisco, CA, USA). The LAI was quantified using the LAI-2200 canopy analyzer (America, LI-COR Corp., Lincoln, NE, USA).

2.3.3. Photosynthetic Parameters

The Pn (μmol CO2·m−2·s−1) was determined for 28 treatments and 14 species of Indocalamus using the LI-6400XT portable photosynthesis measurement system (America, LI-COR Corp.). The TChl contents and Chl a/b of leaves were calculated using the equations of Lichtenthaler and Wellburn [23], and the tested leaves were selected in the same manner as in Section 2.3.2.

2.3.4. Leaf Active Substances

The rutin colorimetric method described by Chen [24], the Folin–Ciocalteu method described by Ainsworth [25], and the phenol-concentrated sulfuric acid method described by Gao [26] were used, and the TFC, TPC, and TPS contents were calculated for each treatment based on the corresponding standard curves. TFC and TPC contents were determined using dry leaves, while TPS contents were determined using fresh leaves. The tested leaves were selected in the same manner as described in Section 2.3.2.

2.4. Statistical Analysis

Data were processed by SPSS (Ver. 26.0, IBM Corp.). One-way ANOVA and Duncan’s multiple comparison analysis test (p ≤ 0.05) were used to test for significant differences; Pearson correlation analysis was used to test for associations between variables; and Excel (Ver. 2019, Microsoft Corp., Redmond, WA, USA) and Origin (Ver. 2023b, OriginLab, Northampton, MA, USA) were used to construct graphs.

3. Results

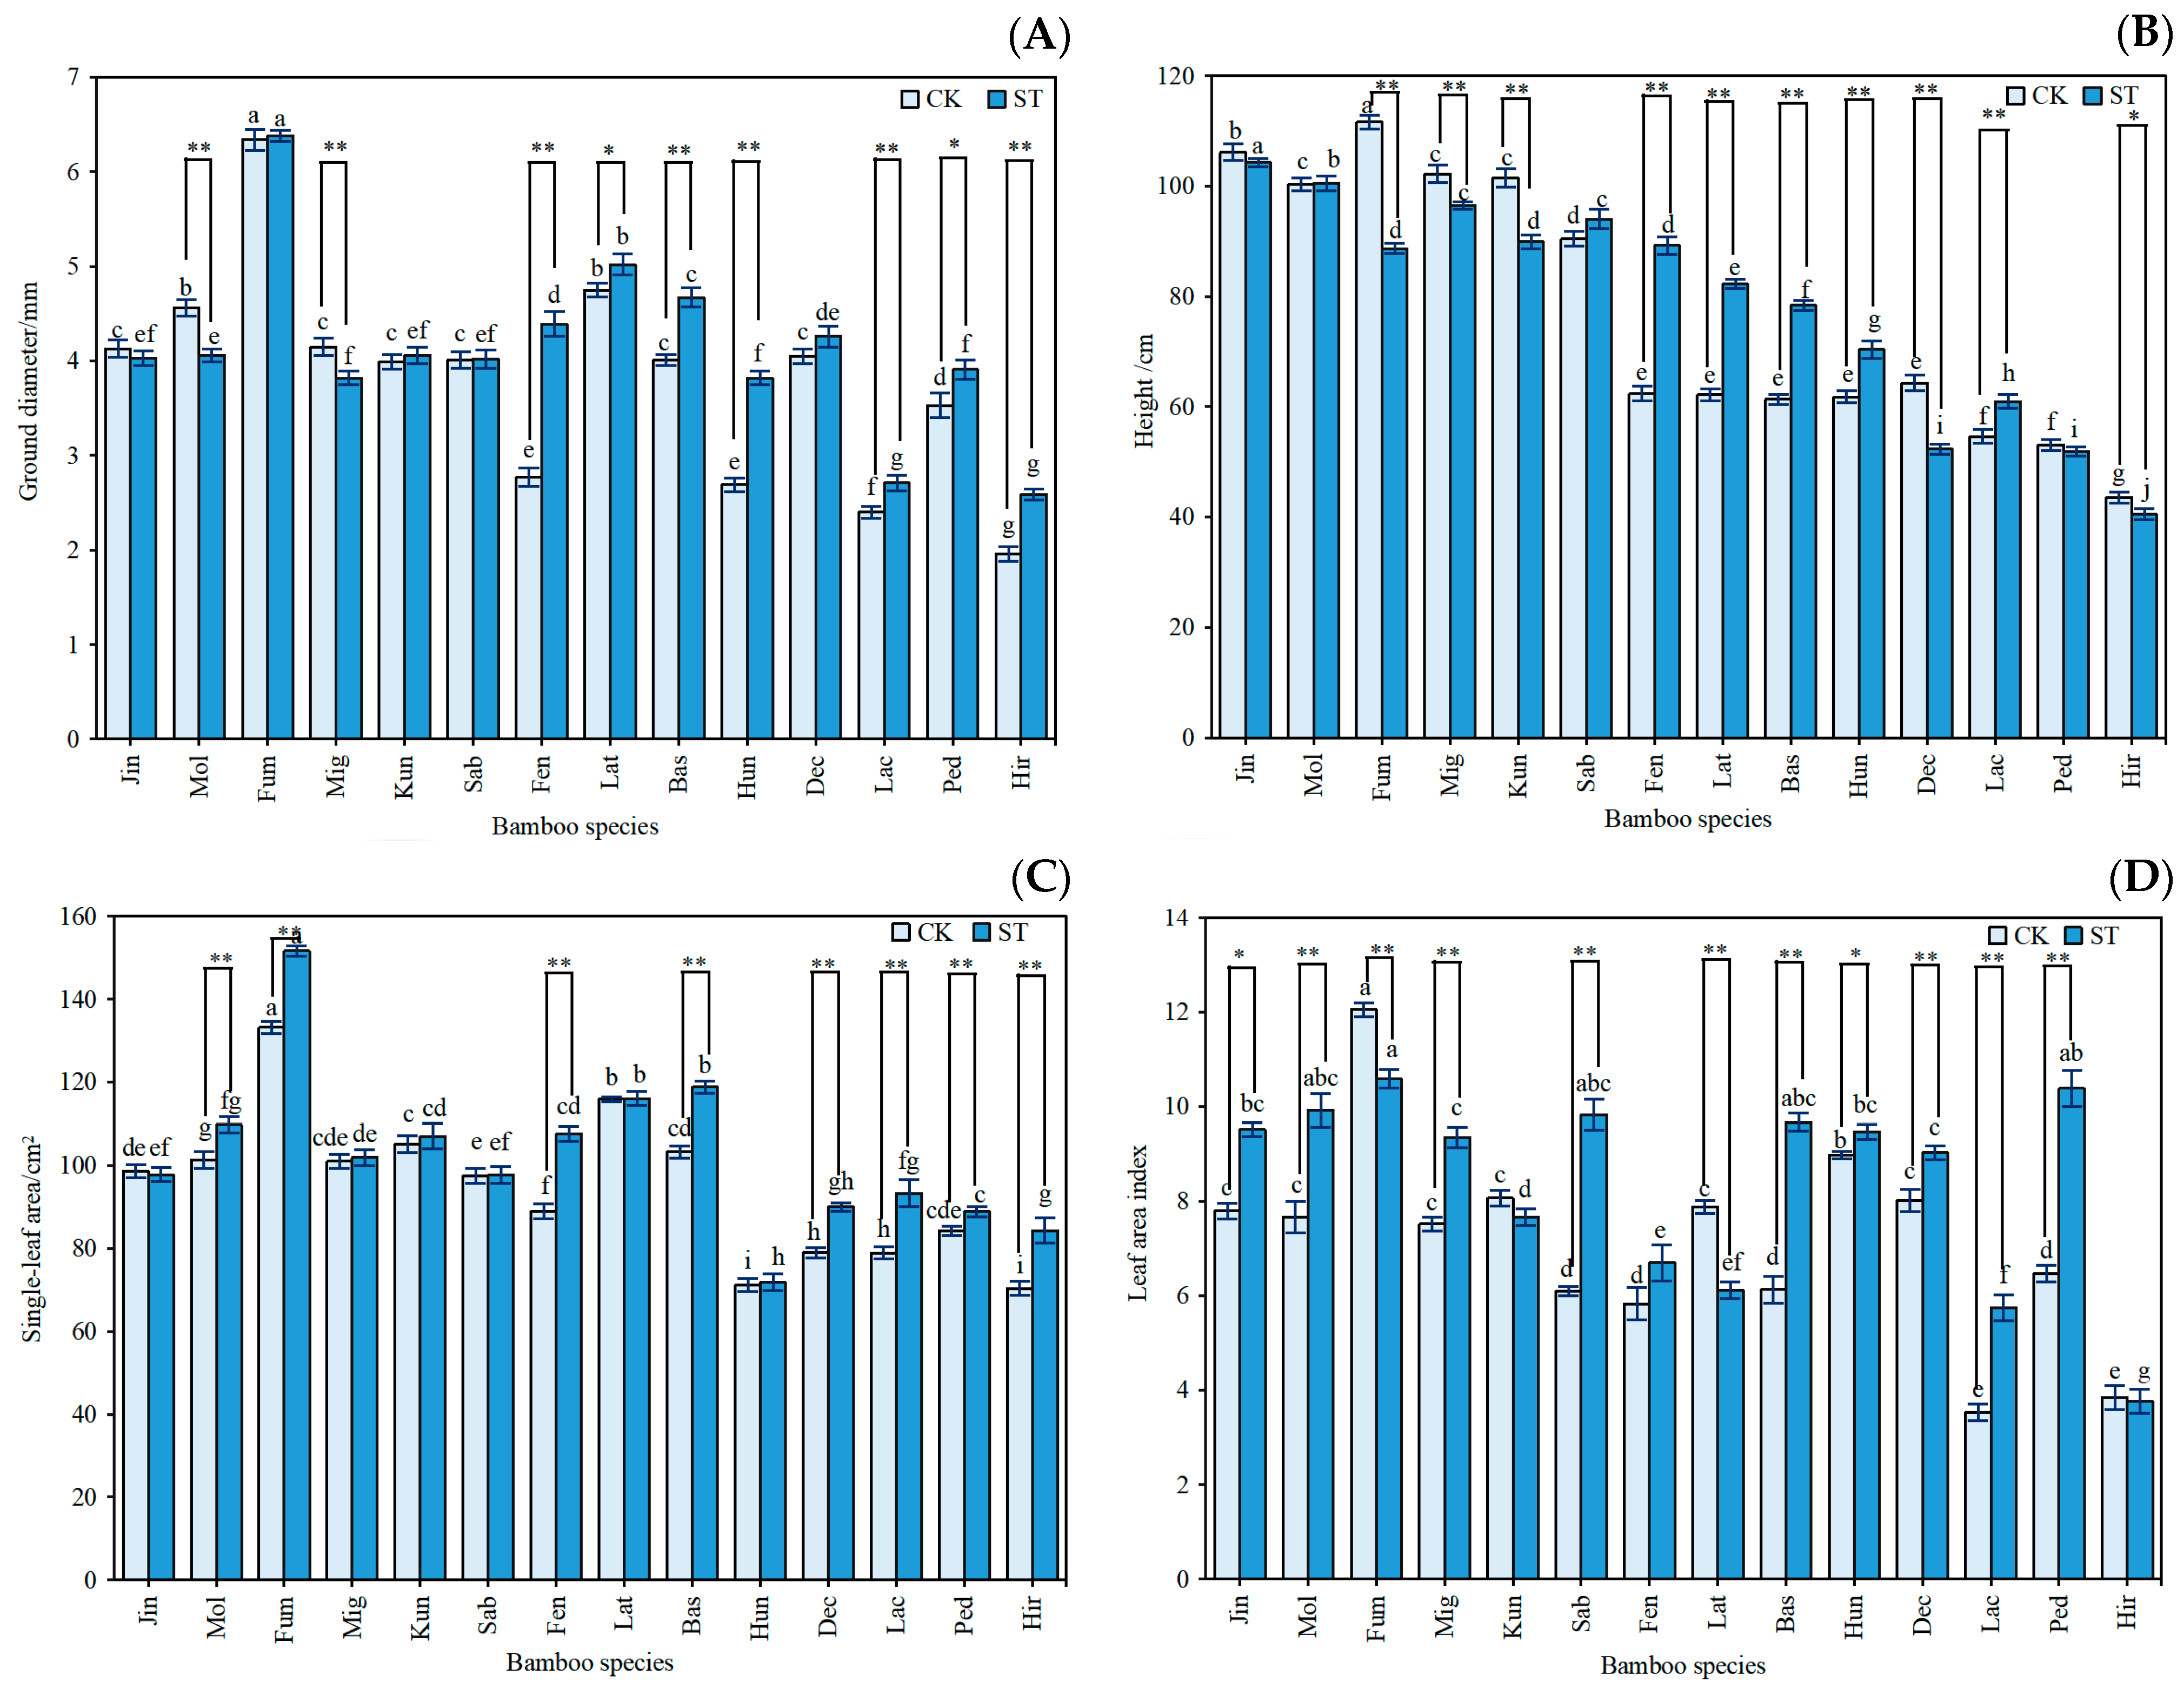
3.1. Growth Characteristics and Photosynthetic Capacity of Indocalamus

Figure 2 depicts the effects of the two light environments on the rate of new bamboo and the photosynthetic capacity of Indocalamus. Compared with those in the CK treatment, the new bamboo rates of the 14 species of Indocalamus under the ST treatment differed by −46.03% to 43.34%, with a large difference between bamboo species. Under the ST treatment, the average Pn of the 14 species of Indocalamus decreased by 15.14% compared with that of the CK treatment, and the Pn of only four species of Indocalamus increased. Except for Fum and Dec, the TChl contents were higher in the bamboo under the ST treatment than under the CK treatment. The Chl a/b ratio of Indocalamus was less than three in both light environments, and the ST treatment reduced the Chl a/b ratio by 1.35% compared with that in the CK treatment, and all bamboo species were able to use dispersed light effectively.

3.2. Morphological Characteristics of Indocalamus

Figure 3 depicts the effects of the two light environments on the morphological characteristics of Indocalamus. Under the ST treatment, the average ground diameter and the average height of the 14 species of Indocalamus increased by 8.27% and 2.26%, respectively, compared with the CK treatment. Except for Mol, Mig, and Jin, the ground diameter of the bamboo species was larger under the ST treatment than under the CK treatment. The coefficient of variation was moderate at 10% to 20%, higher at 20% to 30%, and very high at greater than 30% [27]. Under the CK treatment, the coefficients of variation in the ground diameter (29.47%) and height (30.38%) of Indocalamus were larger, showing higher abundance, which indicated that the thickness and height of the bamboo poles varied greatly, whereas the coefficients of variation in the ground diameter (22.92%) and height (25.40%) of Indocalamus in the ST treatment were reduced, indicating that the low-light environment reduced the degree of morphometric variation.
For all 14 species of Indocalamus, the single leaf areas were larger under the ST treatment than under the CK treatment; the coefficient of variation was moderate (19.44%), and the degree of difference in the single leaf area was lower than that for the height and diameter, indicating that it was more stable. Under the ST treatment, the single leaf areas of 10 species were larger than 100.00 cm2, indicating that these species are suitable for food packaging material manufacturing. Except for Lat, Fum, and Kun, the LAI of the bamboo species increased by 5.46% to 62.89% under the ST treatment compared with the CK treatment, and the LAIs of 12 species of Indocalamus under the ST treatment were larger than six, with significant numbers of leaves.

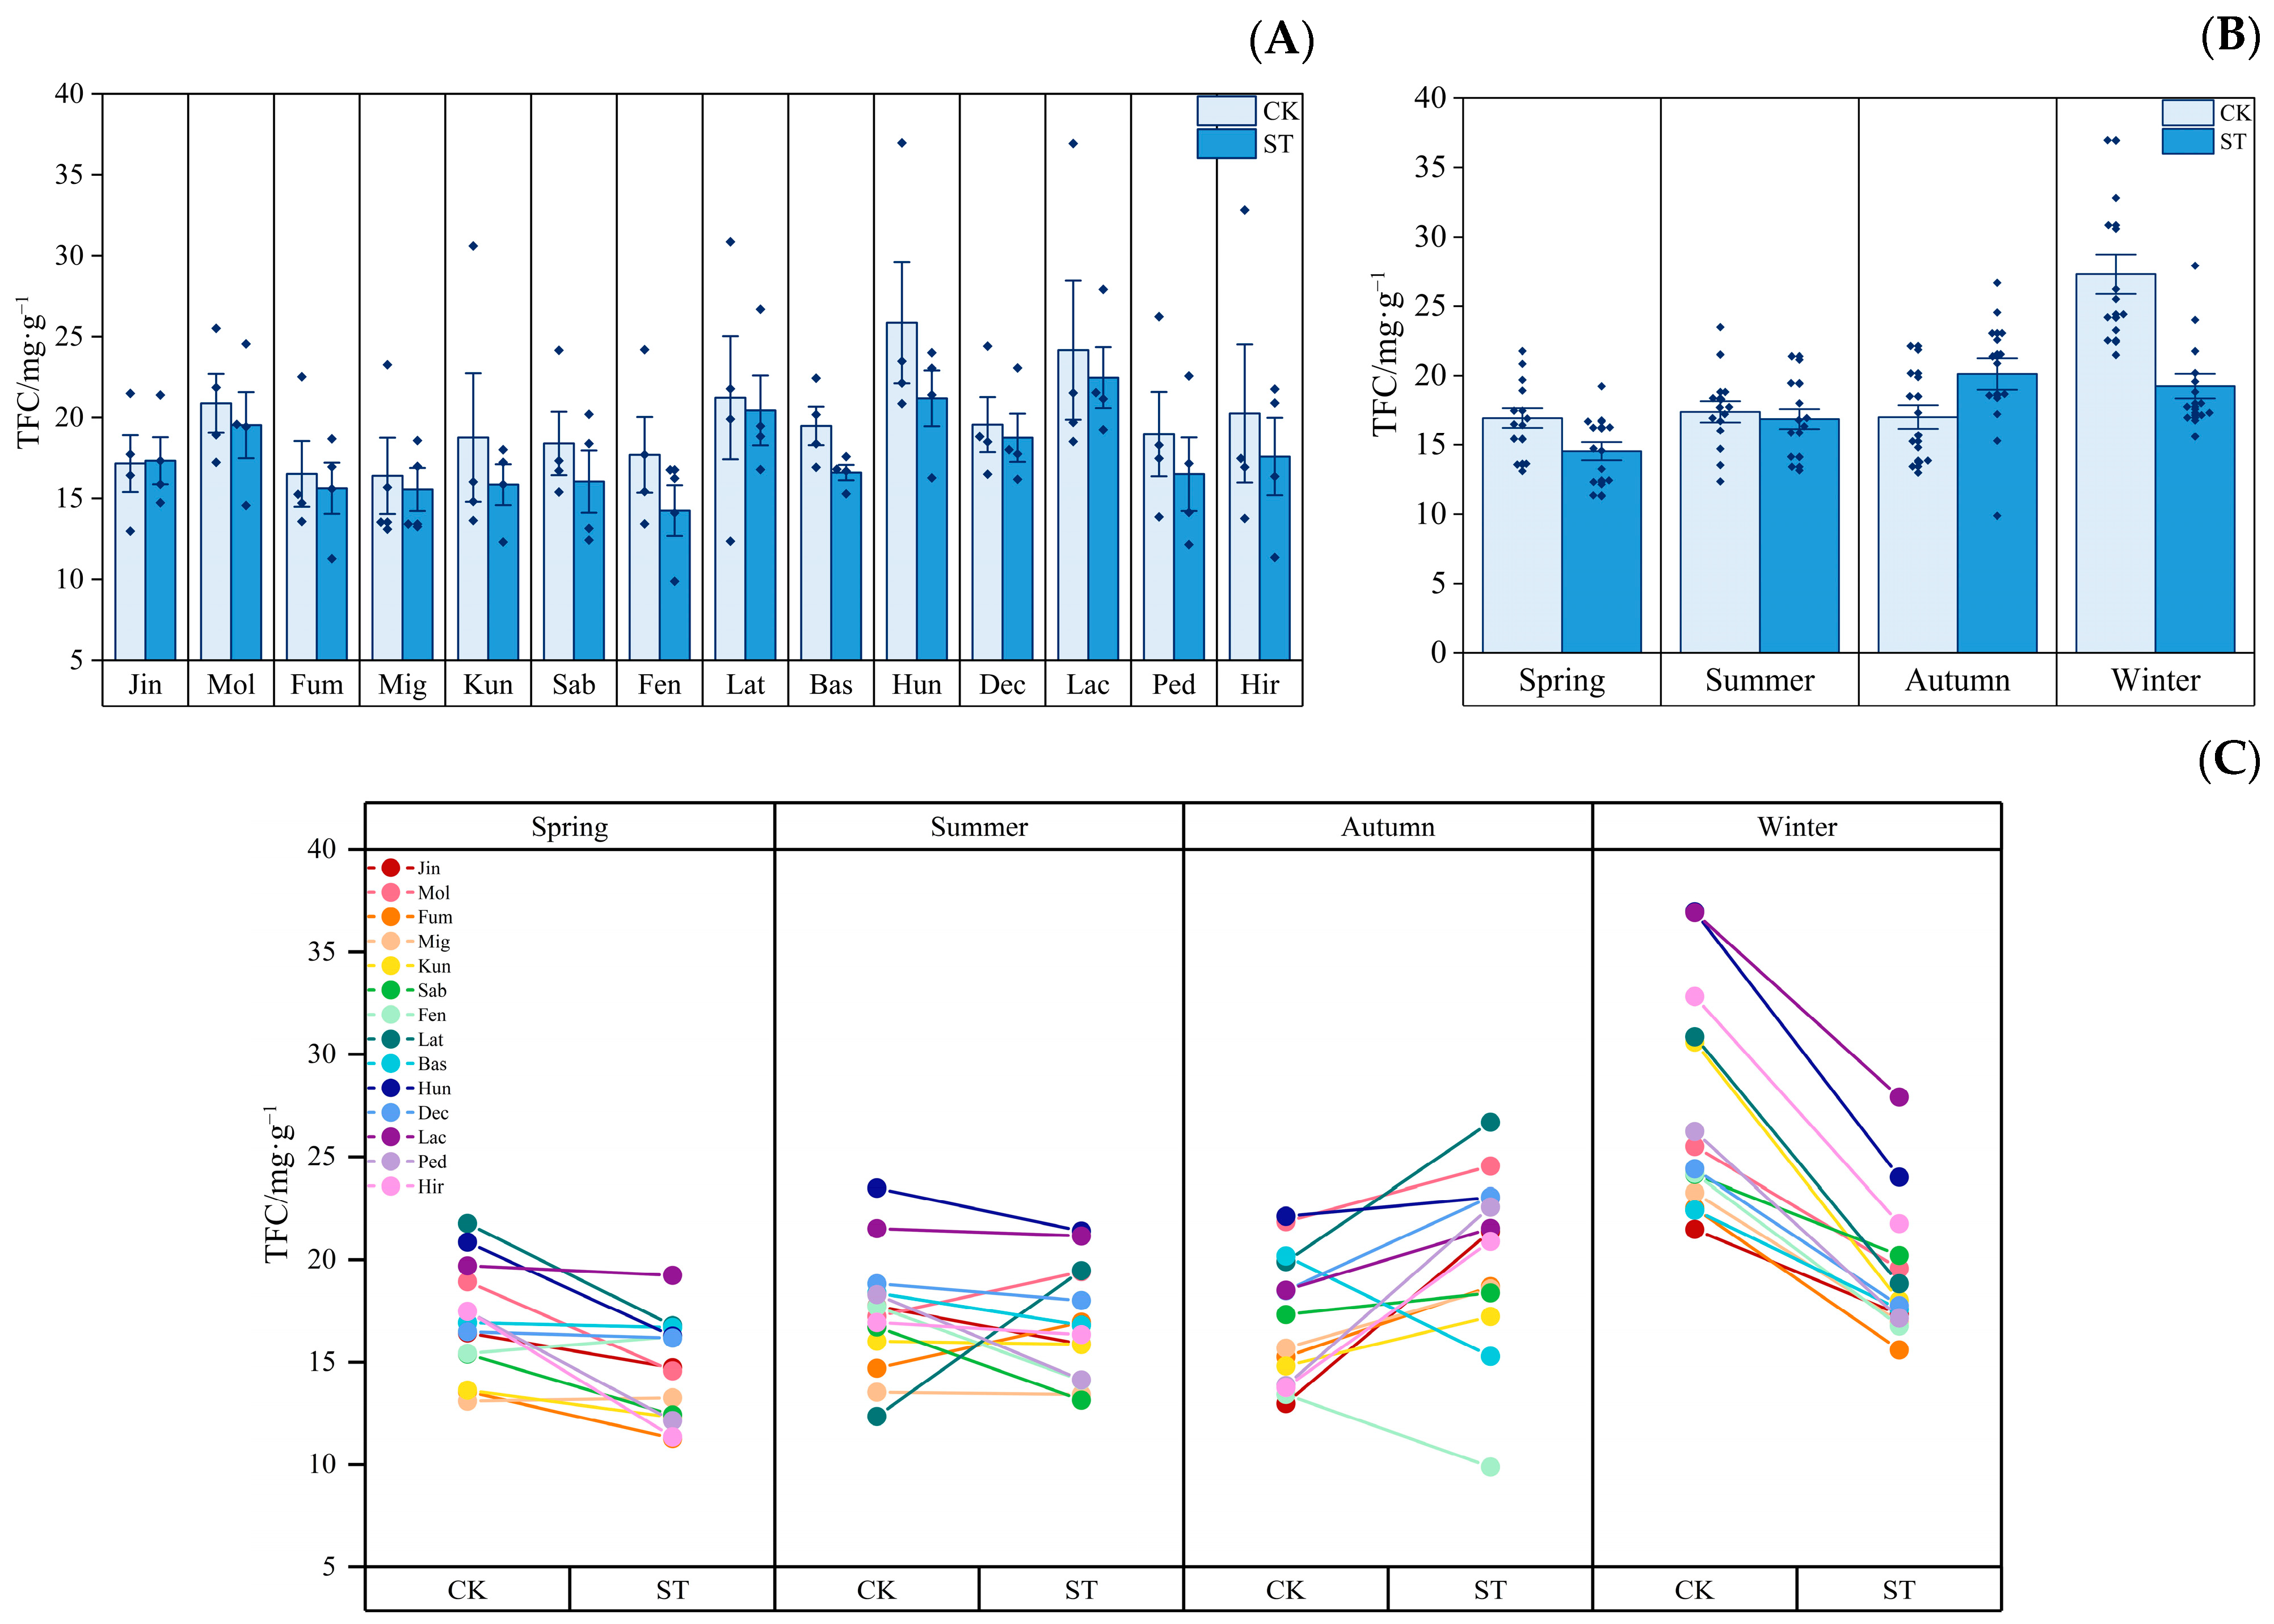
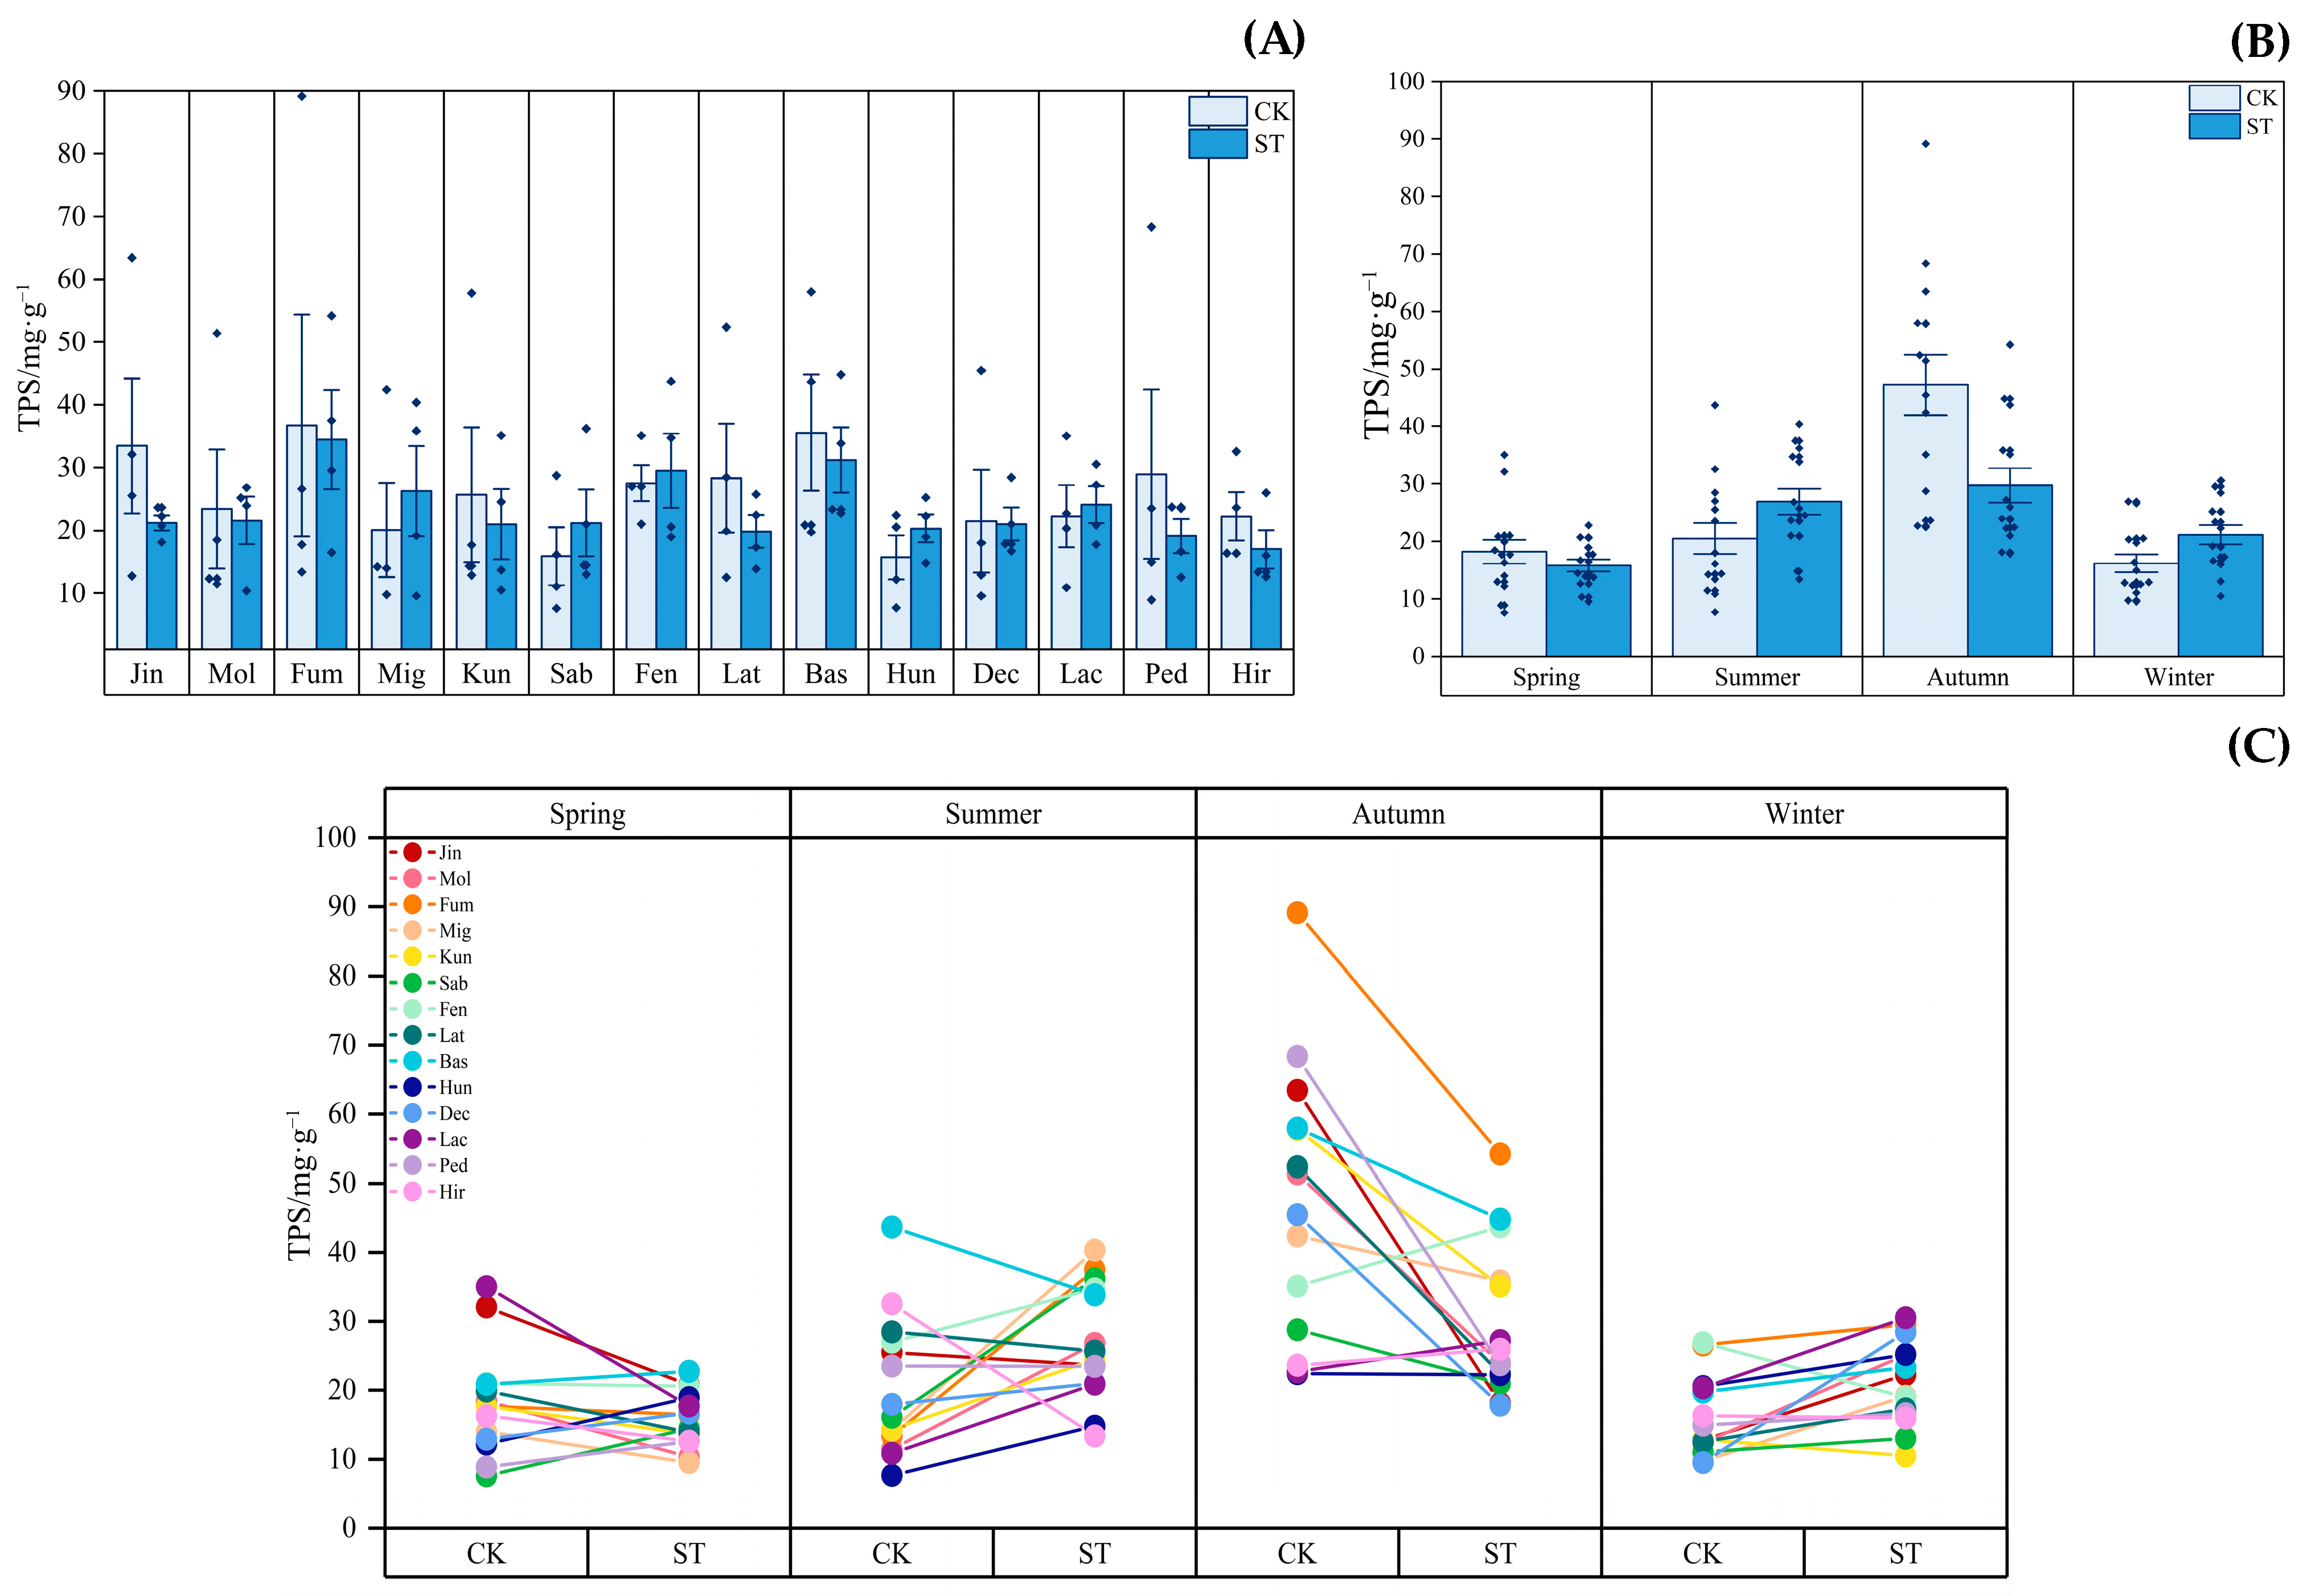
3.3. Dynamics of Leaf Active Substances

Figure 4 depicts the seasonal dynamics of the TFC contents of Indocalamus in two light environments. Figure 4A shows that under the ST treatment, the average annual TFC contents of all the Indocalamus except Jin were reduced by 3.68% to 19.45% compared with those under the CK treatment. Figure 4B shows that the average TFC contents of the 14 species of Indocalamus in the CK treatment reached their peak in winter (27.31 mg·g−1), the ST treatment promoted the accumulation of average TFC (20.13 mg·g−1) in the 14 species of Indocalamus in autumn, which was 18.28% higher than that in the CK treatment, and suppressed the accumulation of TFC in the other three seasons, and the accumulation of average TFC in winter was the most affected and decreased by 29.53% compared with that in the CK treatment. Figure 4C shows that under the ST treatment, the TFC contents of 12 species of Indocalamus, excluding Fen and Bas, in autumn increased by 4.14% to 64.78% compared with the CK treatment.
Figure 5 depicts the seasonal dynamics of the TPC contents of Indocalamus in two light environments. Figure 5A shows that, compared with the CK treatment, the annual average TPC contents of eight species of Indocalamus increased by 4.75% to 16.29% under the ST treatment. Figure 5B shows that under the CK and ST treatments, the average TPC contents of 14 species of Indocalamus peaked in winter, with values of 4.429 mg·g−1 and 4.110 mg·g−1, respectively. Under the ST treatment, the average TPC contents of 14 species of Indocalamus increased by 48.96% in spring compared with that in the CK treatment, while it decreased significantly in the other three seasons; in particular, the TPC contents accumulation in summer was inhibited significantly and was 14.56% lower than that in the CK treatment. Figure 5C shows that, compared with the CK treatment, the TFC contents of 13 species of Indocalamus (excluding Kun) in spring increased by 2.57% to 119.96% under the ST treatment.
Figure 6 depicts the seasonal dynamics of the TPS contents in Indocalamus in two light environments. Figure 6A shows that the annual average TPS contents of nine species of Indocalamus were reduced by 7.91% to 45.96% under the ST treatment compared with those under the CK treatment. Figure 6B shows the average TPS contents of 14 species of Indocalamus peaked in autumn under both the CK and ST treatments, with high values of 47.206 mg·g−1 and 29.736 mg·g−1, respectively. The average TPS contents of 14 species of Indocalamus increased by 31.44% and 30.81% in summer and winter, respectively, under the ST treatment, and in autumn, those were significantly reduced by 37.02% compared with those in the CK treatment. Figure 6C shows that, compared with the CK treatment, under the ST treatment, the TPS contents of 11 species of Indocalamus decreased by 0.63% to 71.45% in autumn and the TPS contents of 10 species of Indocalamus increased by 11.16% to 198.05% in winter.

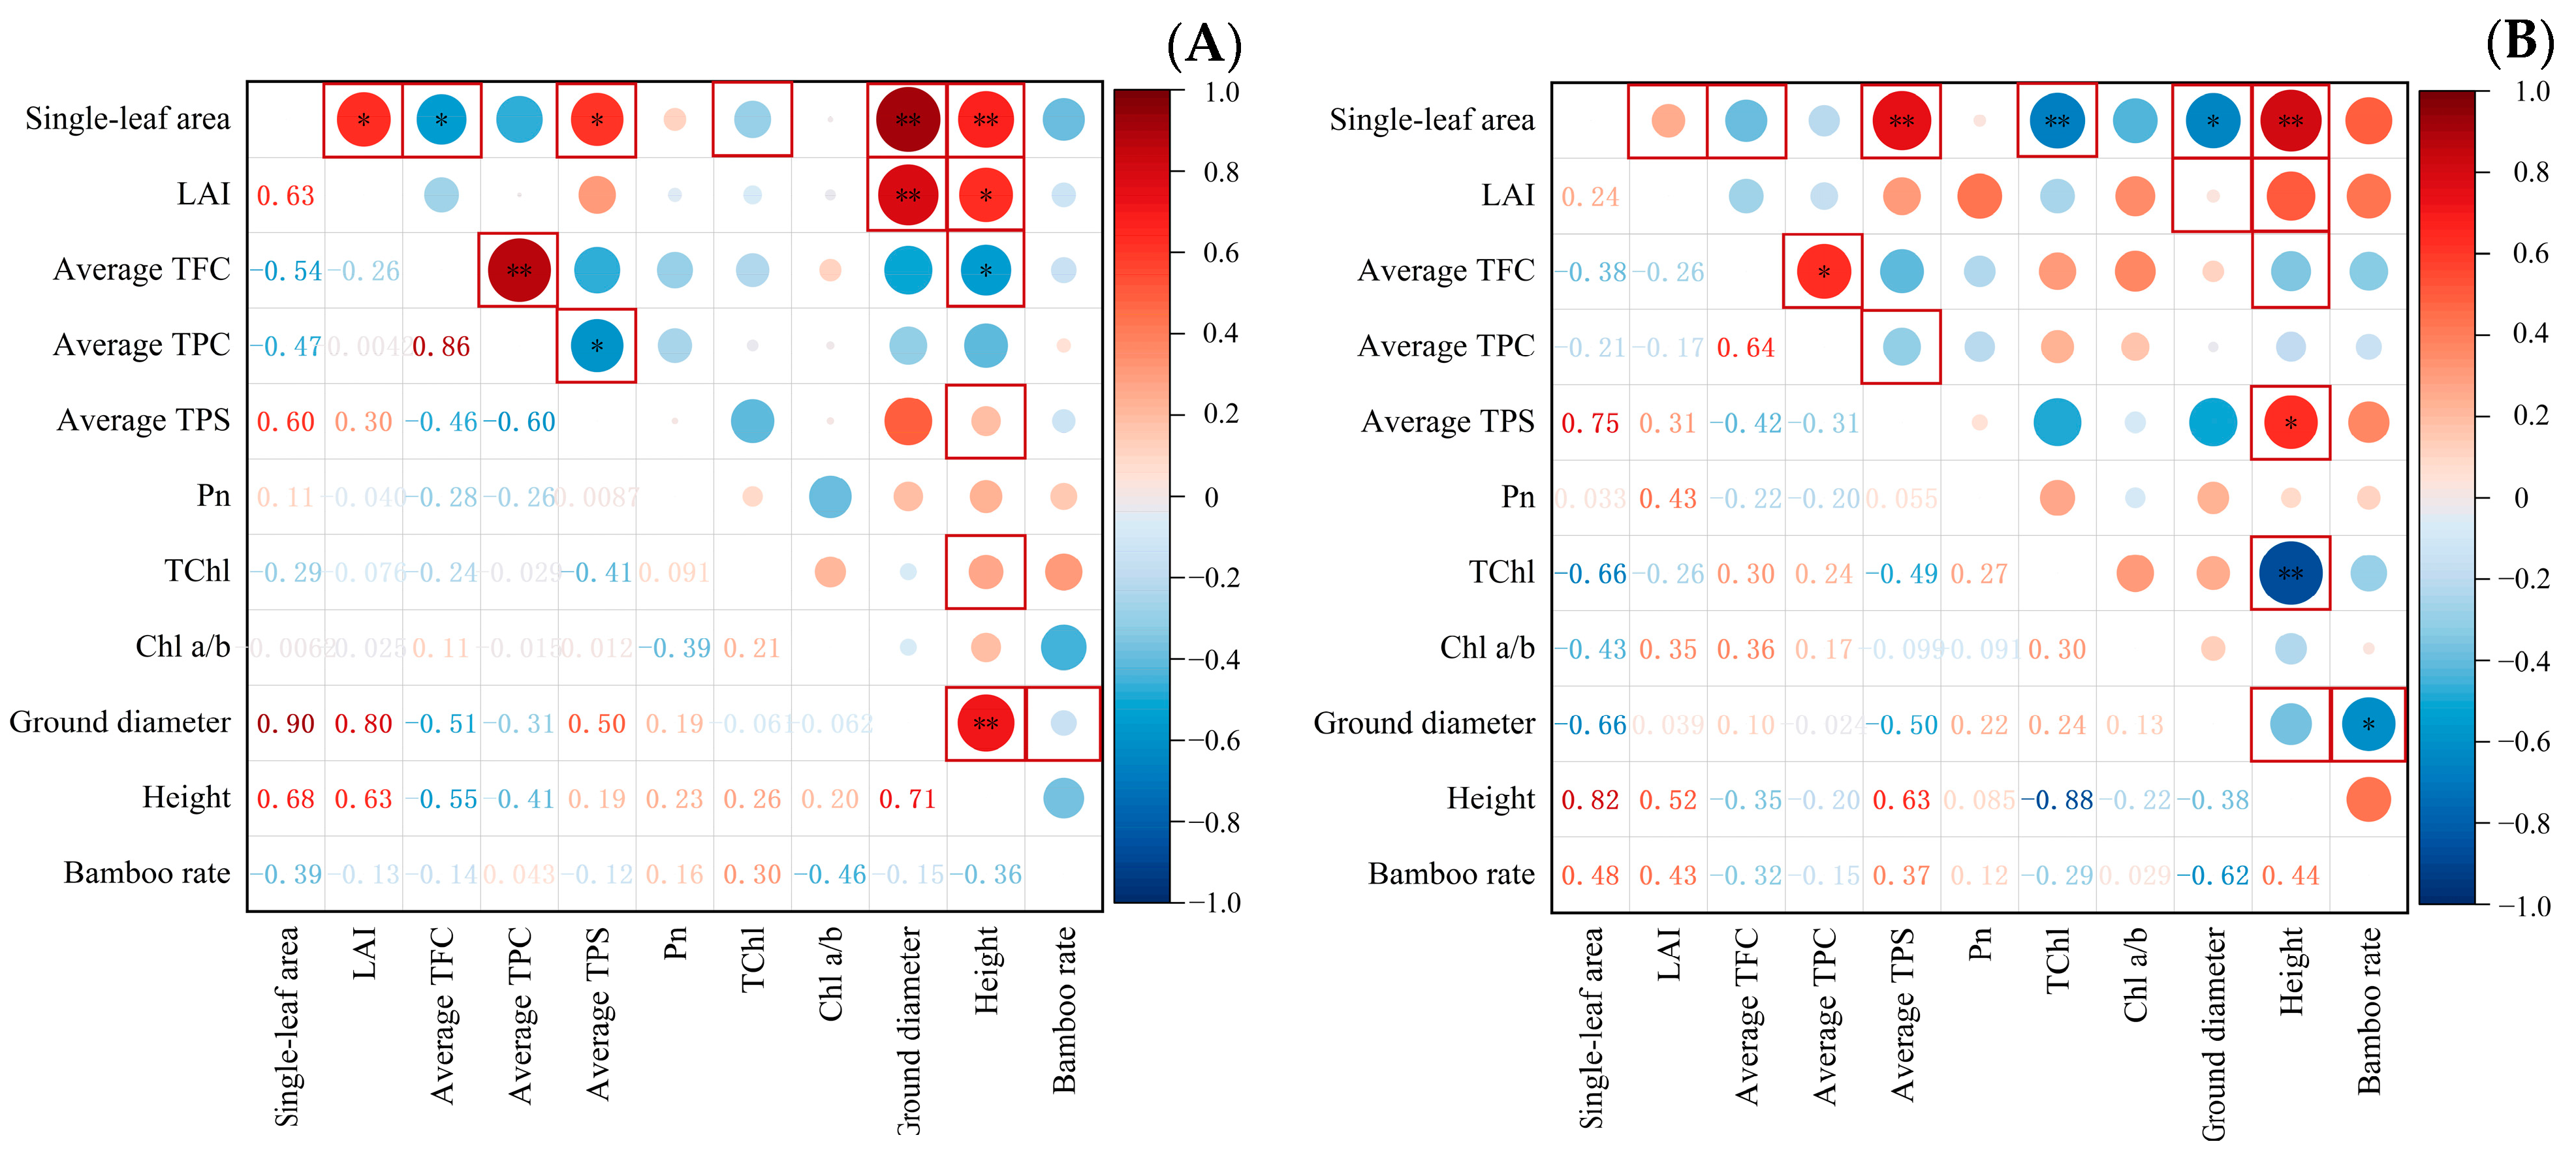
3.4. Correlation Analysis among Indicators

Figure 7 depicts the results of the correlation analysis among the indicators of Indocalamus. After ST treatment, the single leaf area was no longer correlated with LAI and TPC contents and had a significant negative correlation with TChl contents (r = −0.66); the highly significant positive correlation with ground diameter (r = 0.90) changed to a significant negative correlation (r = −0.66); and LAI was no longer correlated with ground diameter or height. Furthermore, the correlation between the TFC and TPC contents (r = 0.64) was weakened, while TPC and TPS contents were no longer correlated, and TPS contents and height (r = 0.64) were no longer correlated. The correlation between TFC and TPC contents (r = 0.64) was weakened, while TPC and TPS contents were no longer correlated and TPS contents and height (r = 0.63) were significantly positively correlated; TChl contents and height (r = −0.88) were significantly negatively correlated, and ground diameter and height were no longer correlated but were significantly negatively correlated with the new bamboo rate (r = −0.62).

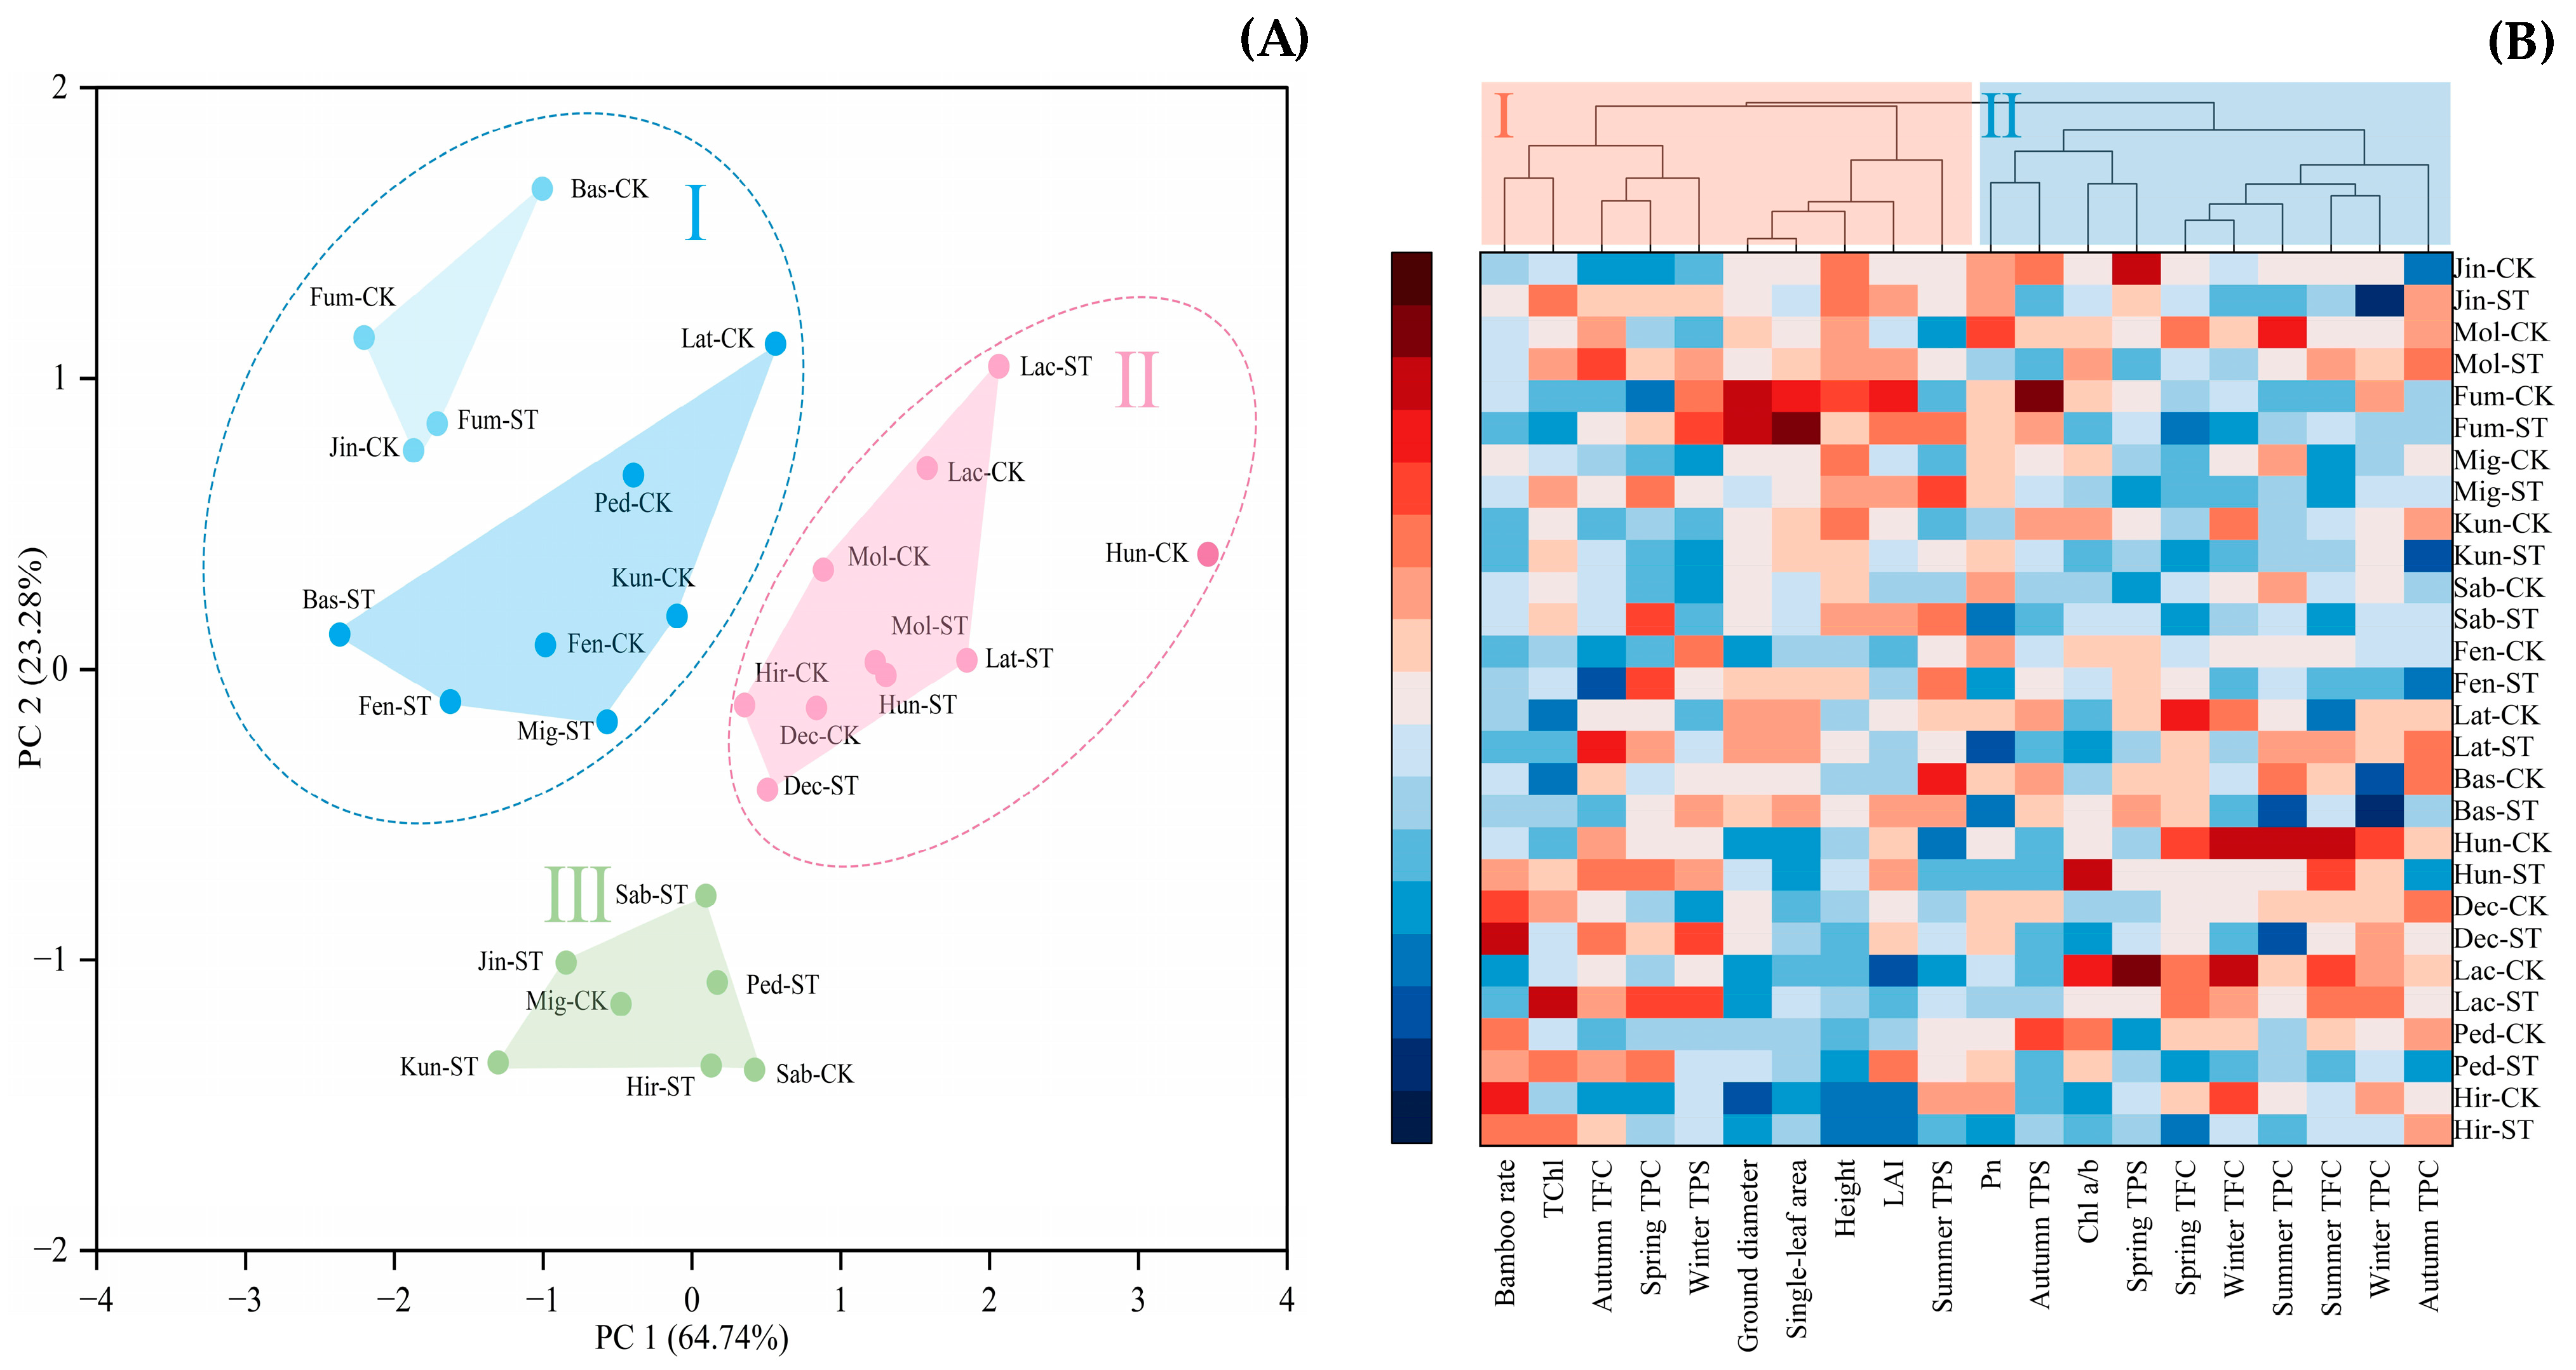
3.5. Principal Component Analysis of the Active Substances and Cluster Analysis of the Indicators

Figure 8 depicts the principal component analysis of the active substances of Indocalamus and the cluster analysis of the samples and traits under the two light environments. Figure 8A shows that, by principal component analysis, Indocalamus was classified into three clusters, of which clusters I and II contained two subgroups. Eleven samples were classified as class II, with a higher abundance of TPS and average levels of the other two active ingredients; ten samples were classified as class II, which was characterized by higher abundances of TFC and TPC and a lower abundance of TPS; and seven samples were classified as class III, with no obvious advantage among the active substances. The CK-treated and ST-treated samples of six species of Indocalamus (Jin, Mig, Kun, Lat, Ped, and Hir) were located in two different clusters, suggesting that the active substances in vivo fluctuated under different light environments, whereas the remaining species of Indocalamus (Mol, Fum, Sab, Fen, Bas, Hun, Dec, and Lac) were close to each other and located in the same clusters, indicating that the ST treatment had less effect on the contents and compositions of their active substances.
The clustered heatmap analysis of Indocalamus revealed the differences in growth and physiological indices in the two light environments. Based on Figure 8B, class I comprises 10 indices that experienced a certain degree of increase under the ST treatment, and class II comprises 10 indices that experienced a certain degree of decrease under the ST treatment. Under both treatments, Hun and Lac had a significant advantage in the contents of active substances, and Fum had a significant advantage in terms of reproductive capacity and morphological indicators.

4. Discussion

4.1. Growth Morphology and Photosynthetic Capacity of Indocalamus in Response to Different Light Environments

Light is not only a necessary prerequisite for plants to photosynthesize but also has a regulatory effect on plant growth, affecting the production of certain hormones in plant structures as well as the morphology, physiology, metabolism, and gene regulation of plant growth [28,29]. Indocalamus plants have low growth rates, and their growth is affected by environmental influences, particularly light intensity [30]. The period in which new bamboo is generated is an essential stage in the bamboo growth cycle, and the rate of new bamboo generation is one of the most significant indicators for assessing the reproductive ability of bamboo plants [31]. In the present study, the reduction in the new bamboo rate of some Indocalamus species under the ST treatment compared with that under the CK treatment may be due to the effect of the low light availability on the photosynthetic carbon sequestration capacity of leaves at the late stage of new shoot growth, leading to insufficient nutrient resources for the generation of new bamboo [32].
Shade-tolerant plants will allocate more of their limited energy to the aboveground parts to obtain more light quanta, thus enabling them to adapt to low-light environments. Usually, plant height and leaf area increase under low light conditions to allow plants to obtain more light energy and decrease light energy absorption under high light conditions to reduce or prevent photoinhibition. In this study, all the Indocalamus in the low-light environment showed an increase in leaf area; the heights and diameters of the bamboo generally increased, but there were some differences in the trends of the morphological indices of Indocalamus. These results are similar to those of March [33], who analyzed the effects of a low-light environment on the bamboo species of three bamboo subfamilies, and Mulkey [34] and Yang [35], who also found that the low-light environment could increase the leaf area and the number of understory dwarf bamboos of the species Streptochaeta sodiroana and Sinarundinaria nitida.
Leaves growing in the understory adapted to the reduced light intensity by increasing their light absorption capacity, and the low-light environment in this study could significantly promote the synthesis of TChl in Indocalamus, which increased the green landscaping value to some extent. In contrast, Pn in the low-light environment was lower than that in the full light treatment, similar to the findings of Terashima [36] and Fan [37]. Since TChl in bamboo plants is in a constant dynamic of synthesis and catabolism, the concentration at which synthesis and catabolism attain equilibrium is lower in high light than in low light, leading to an increase in TChl contents with decreasing light intensity. Lei [38] found that an understory-grown dwarf bamboo, Sasa senanensis, exhibited a lower Chl a/b ratio during the summer season, and Smith [39] discovered that the leaf Chl a/b ratio of plants adapted to low-light conditions was lower than 3:1. These results are similar to the findings of the current study. The low-light conditions likely caused the PSI-light-harvesting complex I (LHCI) supercomplex of the shade plants to contain more LHC proteins and the maximal quantum efficiency of PSII to increase, resulting in a low level of Chl a/b ratio in the leaf [40].

4.2. Response of Active Substances in the Leaves of Indocalamus to Different Light Environments

There were several significant correlations between growth indices and leaf active compounds (TFC, TPC, and TPS) of Indocalamus in this study, which suggests that biological compounds related to the growth of Indocalamus may be involved in the same biological activities and vary as a result of light exposure. Su [41] has demonstrated that the leaf total flavonoid contents of the three species of Indocalamus ranged between 1.7% and 2.7% in different seasons. Similarly, this study showed that the TFC contents of 14 species of Indocalamus in different seasons ranged from 9.88 mg·g−1 to 36.97 mg·g−1. Flavonoids guard plant tissues from high-energy wavelengths, thus protecting PSII and chloroplasts of shade plants from high-intensity sunlight [42,43,44]. Angmo [45], Martínez-Lüscher [46], and Szymborska-Sandhu [47] have shown that TFC accumulation decreases when plants are in low-light environments and increases when light intensity increases. However, it has also been shown that there exists an optimum light intensity for TFC accumulation, with Lithocarpus litseifolius having the highest TFC contents in leaves at 40% shade [48]. In this study, the annual average TFC contents of 12 species of Indocalamus (excluding Lat and Jin) under the ST treatment were reduced compared to those of plants under the CK treatment, probably because these bamboo species do not need to produce more TFC to protect themselves from radiation when the light intensity is low, and 50% full light may be the ideal light intensity to promote the accumulation of TFC in Lat and Jin. The results of the study by Ni [49] showed that the peak contents of active compounds such as TFC in bamboo leaves were generally higher in autumn and winter than in spring and summer and that the best season for harvesting was winter; Ko [50] found a gradual increase in TFC contents in the dwarf bamboo Sasa quelpaertensis starting in October and that the TFC contents reached the highest level in December. In this study, under the CK treatment, the 14 species of Indocalamus accumulated the most TFC in the winter. Under the ST treatment, the TFC contents of seven species of Indocalamus (Dec, Jin, Ped, Fum, Mig, Lat, and Mol) were highest in autumn, and the TFC contents of the remaining species of Indo bamboo peaked in winter, which indicated that the low-light environment affected the complex metabolism of TFC in Indocalamus, resulting in differences in TFC accumulation in the leaves of different bamboo species. Phenolics are known to act as protective substances or elicitors that regulate plant–environment interactions, effectively controlling various steps of cell growth and differentiation [51,52]. Zhang [53] has shown that the total polyphenol contents of the 11 species of Indocalamus ranged from 0.17% to 0.62%. This study found similar results: the TPC contents of 14 species of Indocalamus in different seasons ranged between 1.27 mg·g−1 and 5.41 mg·g−1. Ntobela [54] demonstrated that low-light environments induced an increase in the contents of volatiles and phenolics, and Formisano [55] found that a low-light environment can promote the accumulation of total phenolic compounds. In this study, after the ST treatment, the annual average TPS contents of eight species of Indocalamus increased significantly compared to those under the CK treatment, with Jin, Dec, and Hir showing a lesser degree of decrease and only Kun, Bas, and Hun exhibiting significant decreases. These differences in response may be attributed to the decomposition rate of polyphenolics and leaf cell activity in different bamboo species. The study by Neményi [56] demonstrated that the TPC of four species of Moso bamboo peaked from September to November. In this study, under the CK treatment, the TPC contents of all 14 species of Indocalamus were highest in winter, which is consistent with the results of the related studies cited above. Under the ST treatment, the TPC of four species of Indocalamus (Fen, Sab, Jin, and Bas) was highest in spring, and the TPC contents of the remaining ten species of Indocalamus peaked in winter. The higher contents of active compounds in winter could be attributed to the lower temperature in the winter season, low-temperature stress promoting the accumulation of secondary metabolites, and cold taming leading to an increase in active compounds [57], which was consistent with the general pattern of secondary metabolite transformation and accumulation. The TPC contents of the leaves of some Indocalamus species peaked in spring, indicating that the low-light environment can reduce the defense mechanisms of these bamboo species when they are exposed to a cold environment to a certain extent, resulting in a weaker response of their metabolic activities to low-temperature stress [58].
Plant polysaccharides are carbohydrates composed of many different types and several distinct forms of monosaccharides [59,60]. Li [61] has pointed out that the total polysaccharide contents of the three species of Indocalamus in winter and summer ranged from 3.59% to 5.95%. This study involved more species and variables, so there are differences in the findings that the TPS contents of 14 species of Indocalamus in different seasons ranged between 7.57 mg·g−1 and 89.13 mg·g−1. Research such as that by Yu [62], Ma [63], and Zheng [64] has demonstrated that the accumulation of polysaccharides is considerably increased in low-light environments. In this study, compared with the CK treatment, the low-light environment increased the average TPS contents and annual average TPS contents of 14 species of Indocalamus in summer and winter, probably due to the lower light saturation point of Indocalamus. The weaker light intensity is more suitable for the primary metabolism of these species, which is more favorable to the accumulation of carbohydrates. Excluding Fen, Lac, and Hir, the TPS contents of the other 11 species of Indocalamus were significantly reduced under the ST treatment in autumn, probably due to the higher precipitation, increase in cloudy and rainy weather, reduction in sunlight hours, and weaker light intensity in autumn; the resulting shading further weakened photosynthesis, inhibiting the synthesis and accumulation of TPS [65]. Under the CK treatment, the TPS of 12 species of Indocalamus was highest in autumn, and the TPS contents of Lac and Hir peaked in spring and summer, respectively, which might be caused by the differences in the growth characteristics of these species. After the ST treatment, the time of peak TPS accumulation in the leaves of Indocalamus was highly differentiated, with five species of Indocalamus (Mol, Jin, Sab, Lat, and Mig) accumulating the most TPS in summer, three species of Indocalamus (Dec, Hun, and Lac) accumulating the most TPS in winter, and the remaining six species accumulating the most TPS in autumn. The reason for the peak TPS contents of some bamboo species occurring in summer may be that the ST treatment increased the environmental humidity and soil moisture contents, which reduced the inhibitory effect of high temperature on their photosynthetic assimilation as well as leaf scorching and improved their photosynthetic efficiency, resulting in an increase in synthesized TPS [66].

5. Conclusions

This study investigated the effects of a low-light environment on the growth adaptability (reproductive ability, morphological characteristics, and photosynthetic properties) and leaf-active substance (TFC, TPC, and TPS) accumulation of 14 species of Indocalamus, as well as the seasonal variations in leaf active substance contents in two light environments. The 50% full light treatment enhanced the diameter, height, area per leaf, and LAI of Indocalamus, indicating that Indocalamus has strong growth adaptability to the low-light environment in the understory space. Different light environments and harvesting times had significant effects on the active substance contents of the leaves of Indocalamus. The 50% full light treatment increased the average TFC in autumn, the average TPC in spring, and the average TPS in summer and winter, and the contents of active components in leaves were generally higher in autumn and winter, which was the best season for harvesting leaves. The leaves of Hun and Lac had the highest TFC and TPC contents, while the leaves of Fum had the highest TPS contents. This study provides a theoretical basis for the further development of the leaf resources of Indocalamus and their application to sustainable cultivation in the understory, which can help breeders develop unique programs and highlight their potential economic value.

Author Contributions

Conceptualization, M.J. and W.Y.; funding acquisition and supervision, M.J.; methodology, W.Y. and M.J.; writing—original draft, W.Y.; formal analysis and investigation, W.Y., Q.Y., Y.Y., Z.L., B.L., R.H., S.F. and M.Y.; writing—review and editing, M.J. All authors have read and agreed to the published version of the manuscript.

Funding

This work (the design of the study and the collection and analysis) was supported by the Natural Science Foundation of Sichuan Province (2022NSFSC0097).

Data Availability Statement

Data are contained within the article.

Conflicts of Interest

The authors declare no conflict of interest.

Nomenclature

LAIleaf area index
Pnnet photosynthetic rate (μmol CO2·m−2·s−1)
TChltotal chlorophyll (mg·g−1)
Chl a/b ratiochlorophyll a/b ratio
TFCtotal flavonoid (mg·g−1)
TPCtotal polyphenol (mg·g−1)
TPStotal polysaccharide (mg·g−1)

Appendix A

Table A1. Detailed description of 14 species of Indocalamus.
OriginBamboo SpecieAbbreviationsPhotosCharacterisation
Songming County, Yunnan, ChinaI. jinpingensisJinPlants 12 03993 i001
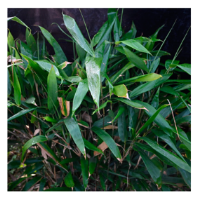
Culms 1.5–2.0 m tall, 0.4–0.8 cm in diameter; leaf blades oblong-lanceolate, 17–27 cm long, 3.5–5.5 cm wide
I. guangdongensis var. mollisMolPlants 12 03993 i002Culms 1.5–3.0 m tall, 0.9–1.5 cm in diameter; leaf blades broadly lanceolate, 15–35 cm long, 4.0–6.5 cm wide
I. kunmingensis cv. fuminerFumPlants 12 03993 i003Culms 2.0–3.0 m tall, 0.8–1.8 cm in diameter; leaf blades oblong-lanceolate, 14–40 cm long, 2.2–7.0 cm wide
I. migoiMigPlants 12 03993 i004Culms 1.5–2.5 m tall, 0.5–1.2 cm in diameter; leaf blades oblong-lanceolate, 20–38 cm long, 3.5–8.0 cm wide
I. kunmingensisKunPlants 12 03993 i005
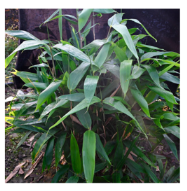
Culms 1.5–2.5 m tall, 0.5–1.0 cm in diameter; leaf blades oblong-lanceolate, 15–35 cm long, 3.0–6.0 cm wide
I. sabaensisSabPlants 12 03993 i006
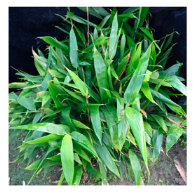
Culms 1.0–1.8 m tall, 0.5–1.0 cm in diameter; leaf blades broadly lanceolate, 20–38 cm long, 3.0–7.5 cm wide
I. fengsaliensisFenPlants 12 03993 i007
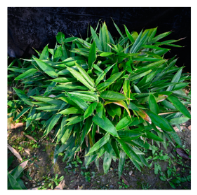
Culms 1.2–2.0 m tall, 0.7–1.0 cm in diameter; leaf blades broadly lanceolate, 25–38 cm long, 3.5–8.0 cm wide
I. pedalisPedPlants 12 03993 i008Culms 30–60 cm tall, 0.2–0.4 cm in diameter; leaf blades oblong-lanceolate, 6.5–28 cm long, 1.0–4.0 cm wide
Anji County, Zhejiang Province, ChinaI. latifoliusLatPlants 12 03993 i009
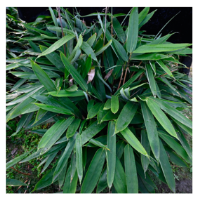
Culms 1.2–2.0 m tall, 0.5–1.5 cm in diameter; leaf blades oblong-lanceolate, 10–45 cm long, 2.0–9.0 cm wide
I. bashanensisBasPlants 12 03993 i010
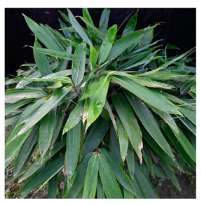
Culms 1.5–3.0 m tall, 1.0–1.5 cm in diameter; leaf blades oblong-lanceolate, 25–36 cm long, 3.0–8.0 cm wide
I. hunanensisHunPlants 12 03993 i011
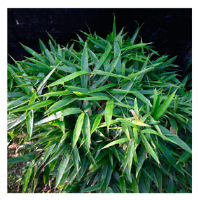
Culms 1.0–1.8 m tall, 0.4–0.8 cm in diameter; leaf blades linear-lanceolate, 10–28 cm long, 4.5–7.5 cm wide
I. decorusDecPlants 12 03993 i012
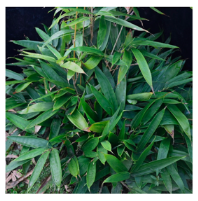
Culms 35–80 cm tall, 0.3–0.5 cm in diameter; leaf blades oblong-lanceolate, 15–35 cm long, 3.0–5.5 cm wide
I. lacunosusLacPlants 12 03993 i013Culms 30–70 cm tall, 0.4–0.6 cm in diameter; leaf blades linear-lanceolate, 10–20 cm long, 3.0–5.0 cm wide
I. hirtinodusHirPlants 12 03993 i014
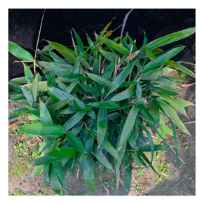
Culms 30–50 cm tall, 0.2–0.4 cm in diameter; leaf blades oblong-lanceolate, 8.0–15 cm long, 3.0–5.0 cm wide

References

  1. Cui, J.; Yue, Y.D.; Tang, F.; Wang, J. HPTLC Analysis of the Flavonoids in Eight Species of Indocalamus Leaves. JPC-J. Planar Chromatogr.-Mod. TLC 2011, 24, 394–399. [Google Scholar] [CrossRef]
  2. Wang, X.F.; Wang, J.F.; Liu, Z.G.; Liu, T.X.; Yue, X.Q.; Yang, J.C. Research of the Processing Technology and Quality Standard of Indocalamus latifolius Leaves. Adv. Mater. Res. 2013, 773, 755–762. [Google Scholar] [CrossRef]
  3. Sun, J.; Yue, Y.; Tang, F.; Guo, X. Simultaneous HPTLC analysis of flavonoids in the leaves of three different species of bamboo. JPC-J. Planar Chromatogr.-Mod. TLC 2010, 23, 40–45. [Google Scholar] [CrossRef]
  4. Jin, S.L.; Yin, Y.G. In vivo antioxidant activity of total flavonoids from Indocalamus leaves in aging mice caused by D-galactose. Food Chem. Toxicol. 2012, 50, 3814–3818. [Google Scholar] [CrossRef] [PubMed]
  5. Santosh, O.; Bajwa, H.K.; Bisht, M.S.; Chongtham, N. Application of Bamboo in the Food and Pharmaceutical Industry. In Biotechnological Advances in Bamboo; Springer: Berlin/Heidelberg, Germany, 2021; pp. 401–429. [Google Scholar]
  6. Zhang, Y.; He, L.; Li, Q.; Cheng, J.; Wang, Y.; Zhao, J.; Yuan, S.; Chen, Y.; Shi, R. Optimization of ultrasonic-assisted deep eutectic solvent for the extraction of polysaccharides from Indocalamus tessellatus leaves and their biological studies. Sustain. Chem. Pharm. 2022, 30, 100855. [Google Scholar] [CrossRef]
  7. Aribam, I.; Oinam, S.; Koul, A.; Chongtham, N. Comparative assessment of the antioxidant potential of bamboo leaves, along with some locally and commercially consumed beverages in India. Adv. Bamboo Sci. 2022, 1, 100007. [Google Scholar]
  8. Gong, J.; Xia, D.; Huang, J.; Ge, Q.; Mao, J.; Liu, S.; Zhang, Y. Functional components of bamboo shavings and bamboo leaf extracts and their antioxidant activities in vitro. J. Med. Food 2015, 18, 453–459. [Google Scholar] [CrossRef]
  9. Zhu, G.; Xiao, Z. Study on creation of an Indocalamus leaf flavor. Food Sci. Technol. 2015, 35, 647–651. [Google Scholar] [CrossRef]
  10. Sun, J.; Xun, H.; Yu, J.; Tang, F.; Yue, Y.; Guo, X. Chemical Constituents and Antibacterial Properties of Indocalamus latifolius McClure Leaves, the Packaging Material for ‘Zongzi’. Molecules 2015, 20, 15686–15700. [Google Scholar] [CrossRef]
  11. Ramovs, B.; Roberts, M. Understory vegetation and environment responses to tillage, forest harvesting, and conifer plantation development. Ecol. Appl. 2003, 13, 1682–1700. [Google Scholar] [CrossRef]
  12. Naidu, S.L.; DeLucia, E.H. Growth, Allocation and Water Relations of Shade-grown Quercus rubra L. Saplings Exposed to a Late-season Canopy Gap. Ann. Bot. 1997, 80, 335–344. [Google Scholar] [CrossRef]
  13. Matesanz, S.; Gianoli, E.; Valladares, F. Global change and the evolution of phenotypic plasticity in plants. Ann. N. Y. Acad. Sci. 2010, 1206, 35–55. [Google Scholar] [CrossRef]
  14. Collins, B.; Wein, G. Stem Elongation Response to Neighbour Shade in Sprawling and Upright Polygonum Species. Ann. Bot. 2000, 86, 739–744. [Google Scholar] [CrossRef]
  15. Mielke, M.S.; Schaffer, B. Leaf gas exchange, chlorophyll fluorescence, and pigment indexes of Eugenia uniflora L. in response to changes in light intensity and soil flooding. Tree Physiol. 2010, 30, 45–55. [Google Scholar] [CrossRef] [PubMed]
  16. Niinemets, U. Photosynthesis and resource distribution through plant canopies. Plant Cell Environ. 2007, 30, 1052–1071. [Google Scholar] [CrossRef] [PubMed]
  17. Sultan, S.E. Phenotypic plasticity for plant development, function, and life history. Trends Plant Sci. 2000, 5, 537–542. [Google Scholar] [CrossRef] [PubMed]
  18. Deng, B.; Fang, S.; Shang, X.; Li, Y. Influence of provenance and shade on biomass production and triterpenoid accumulation in Cyclocarya paliurus. Agrofor. Syst. 2019, 93, 483–492. [Google Scholar] [CrossRef]
  19. Ahmad, E.; Arshad, M.; Khan, M.; Amjad, M.S.; Sadaf, H.; Riaz, I.; Sabir, S.; Ahmad, N.; Sabaoon. Secondary metabolites and their multidimensional prospective in plant life. J. Pharmacogn. Phytochem. 2017, 205, 205–214. [Google Scholar]
  20. Ni, Y.W.; Lin, K.H.; Chen, K.H.; Wu, C.W.; Chang, Y.S. Flavonoid Compounds and Photosynthesis in Passiflora Plant Leaves under Varying Light Intensities. Plants 2020, 9, 633. [Google Scholar] [CrossRef]
  21. Prinsloo, G.; Nogemane, N. The effects of season and water availability on chemical composition, secondary metabolites and biological activity in plants. Sci. Total Environ. 2018, 17, 889–902. [Google Scholar] [CrossRef]
  22. Yang, L.; Zheng, Z.-S.; Cheng, F.; Ruan, X.; Jiang, D.-A.; Pan, C.-D.; Wang, Q. Seasonal Dynamics of Metabolites in Needles of Taxus wallichiana var. mairei. Molecules 2016, 21, 1403. [Google Scholar] [CrossRef]
  23. Lichtenthaler, H.K.; Wellburn, A.R. Determinations of total carotenoids and chlorophylls a and b of leaf extracts in different solvents. Biochem. Soc. Trans. 1983, 11, 591–592. [Google Scholar] [CrossRef]
  24. Chen, S.; Li, X.; Liu, X.; Wang, N.; An, Q.; Ye, X.M.; Zhao, Z.T.; Zhao, M.; Han, Y.; Ouyang, K.H.; et al. Investigation of chemical composition, antioxidant activity, and the effects of alfalfa flavonoids on growth performance. Oxidative Med. Cell. Longev. 2020, 2020, 11. [Google Scholar] [CrossRef]
  25. Ainsworth, E.A.; Gillespie, K.M. Estimation of total phenolic content and other oxidation substrates in plant tissues using Folin-Ciocalteu reagent. Nat. Protoc. 2007, 2, 875–877. [Google Scholar] [CrossRef]
  26. Gao, Y.; Tian, C.; Zhao, L. Extraction, purification, and antioxidant activity of polysaccharides from bamboo leaves. J. For. Res. 2012, 23, 139–143. [Google Scholar] [CrossRef]
  27. Ferreira, J.; Schmildt, E.; Schmildt, O.; Cattaneo, L.; Alexandre, R.; Cruz, C. Comparison of methods for classification of the coefficient of variation in papaya. Rev. Ceres 2016, 63, 138–144. [Google Scholar] [CrossRef]
  28. Chongtham, N.; Bisht, M.S.; Bajwa, H.K.; Santosh, O. Bamboo: A rich source of natural antioxidants and its applications in the food and pharmaceutical industry. Trends Food Sci. Technol. 2018, 77, 91–99. [Google Scholar]
  29. Hallik, L.; Niinemets, U.; Kull, O. Photosynthetic acclimation to light in woody and herbaceous species: A comparison of leaf structure, pigment content, and chlorophyll fluorescence characteristics measured in the field. Plant Biol. 2012, 14, 88–99. [Google Scholar] [CrossRef]
  30. Valladares, F.; Gianoli, E.; Gómez, J.M. Ecological limits to plant phenotypic plasticity. N. Phytol. 2007, 176, 749–763. [Google Scholar] [CrossRef]
  31. Fan, L.; Zhao, T.; Tarin, M.W.K.; Han, Y.; Hu, W.; Rong, J.; He, T.; Zheng, Y. Effect of Various Mulch Materials on Chemical Properties of Soil, Leaves and Shoot Characteristics in Dendrocalamus Latiflorus Munro Forests. Plants 2021, 10, 2302. [Google Scholar] [CrossRef]
  32. Fan, L.; Li, B.; Han, Y.; Chen, L.; He, T.; Zheng, Y.; Rong, J. Lower light intensities increase shoot germination with improved leaf biosynthesis in Ma bamboo (Dendrocalamus latiflorus Munro). Forests 2022, 13, 1723. [Google Scholar] [CrossRef]
  33. March, R.H.; Clark, L.G. Sun-shade variation in bamboo (Poaceae: Bambusoideae) leaves. Telopea 2011, 13, 93–104. [Google Scholar] [CrossRef]
  34. Mulkey, S.S. Photosynthetic Acclimation and Water-Use Efficiency of Three Species of Understory Herbaceous Bamboo (Gramineae) in Panama. Oecologia 1986, 70, 514–519. [Google Scholar] [CrossRef] [PubMed]
  35. Yang, S.-J.; Sun, M.; Zhang, Y.-J.; Cochard, H.; Cao, K.-F. Strong leaf morphological, anatomical, and physiological responses of a subtropical woody bamboo (Sinarundinaria nitida) to contrasting light environments. Plant Ecol. 2014, 215, 97–109. [Google Scholar] [CrossRef]
  36. Terashima, I.; Miyazawa, S.I.; Hanba, Y. Why are sun leaves thicker than shade leaves? Consideration based on analyses of CO2 diffusion in the leaf. J. Plant Res. 2001, 114, 93–105. [Google Scholar] [CrossRef]
  37. Fan, L.; Tarin, M.; Hu, W.; Han, Y.; Rong, J.; Chen, L.; He, T.; Zheng, Y. Changes in light intensity affect leaf gas exchange, chlorophyll fluorescence, and nonstructural carbohydrates of Ma bamboo (Dendrocalamus latiflorus Munro). Appl. Ecol. Environ. Res. 2022, 20, 1269–1284. [Google Scholar] [CrossRef]
  38. Lei, T.T.; Koike, T. Functional leaf phenotypes for shaded and open environments of a dominant dwarf bamboo (Sasa senanensis) in northern Japan. Int. J. Plant Sci. 1998, 159, 977–987. [Google Scholar] [CrossRef]
  39. Smith, M.C.; Mack, R.N. Shade tolerance of temperate Asian bamboos: A harbinger of their naturalization in Pacific Northwest coniferous forests? Biol. Invasions 2013, 15, 2081–2093. [Google Scholar] [CrossRef]
  40. Tanaka, A.; Tanaka, R. Chapter Six-The biochemistry, physiology, and evolution of the chlorophyll cycle. Adv. Bot. Res. 2019, 90, 183–212. [Google Scholar]
  41. Su, C.H.; Liu, G.H.; Wang, F.S.; Ding, Y.L.; Xue, J.H. Several changes of Indocalamus leaf active ingredients contents. J. Appl. Ecol. 2011, 22, 2471–2476. [Google Scholar]
  42. Kitamura, S. Transport of Flavonoids: From Cytosolic Synthesis to Vacuolar Accumulation. In The Science of Flavonoid; Springer: Berlin/Heidelberg, Germany, 2006; pp. 123–146. [Google Scholar]
  43. Petrussa, E.; Braidot, E.; Zancani, M.; Peresson, C.; Bertolini, A.; Patui, S.; Vianello, A. Plant Flavonoids—Biosynthesis, Transport and Involvement in Stress Responses. Int. J. Mol. Sci. 2013, 14, 14950–14973. [Google Scholar] [CrossRef] [PubMed]
  44. Idris, A.; Linatoc, A.C.; Abu Bakar, M.F.; Ibrahim, Z.T.; Audu, Y. Effect of Light Quality and Quantity on the Accumulation of Flavonoid in Plant Species. J. Sci. Technol. 2018, 10, 3. [Google Scholar] [CrossRef]
  45. Angmo, P.; Phuntsog, N.; Namgail, D.; Chaurasia, O.P.; Stobdan, T. Effect of shading and high temperature amplitude in greenhouse on growth, photosynthesis, yield and phenolic contents of tomato (Lycopersicum esculentum Mill.). Physiol. Mol. Biol. Plants 2021, 27, 1539–1546. [Google Scholar] [CrossRef] [PubMed]
  46. Martínez-Lüscher, J.; Chen, C.C.L.; Brillante, L.; Kurtural, S.K. Partial Solar Radiation Exclusion with Color Shade Nets Reduces the Degradation of Organic Acids and Flavonoids of Grape Berry (Vitis vinifera L.). J. Agric. Food Chem. 2017, 65, 10693–10702. [Google Scholar] [CrossRef] [PubMed]
  47. Szymborska-Sandhu, I.; Przybył, J.L.; Pióro-Jabrucka, E.; Jędrzejuk, A.; Węglarz, Z.; Bączek, K. Effect of Shading on Development, Yield and Quality of Bastard Balm Herb (Melittis melissophyllum L.). Molecules 2020, 25, 2142. [Google Scholar] [CrossRef] [PubMed]
  48. Li, A.; Li, S.; Wu, X.; Zhang, J.; He, A.; Zhao, G.; Yang, X. Effect of Light Intensity on Leaf Photosynthetic Characteristics and Accumulation of Flavonoids in Lithocarpus litseifolius (Hance) Chun. (Fagaceae). Open J. For. 2016, 6, 445–459. [Google Scholar] [CrossRef]
  49. Ni, Q.; Zhang, Y.; Xu, G.; Gao, Q.; Gong, L.; Zhang, Y. Influence of Harvest Season and Drying Method on the Antioxidant Activity and Active Compounds of Two Bamboo Grass Leaves. J. Food Process. Preserv. 2014, 38, 1565–1576. [Google Scholar] [CrossRef]
  50. Ko, H.C.; Lee, J.Y.; Jang, M.G.; Song, H.; Kim, S.J. Seasonal variations in the phenolic compounds and antioxidant activity of Sasa quelpaertensis. Ind. Crops Prod. 2018, 122, 506–512. [Google Scholar] [CrossRef]
  51. Verma, N.; Shukla, S. Impact of various factors responsible for fluctuation in plant secondary metabolites. J. Appl. Res. Med. Aromat. Plants 2015, 2, 105–113. [Google Scholar] [CrossRef]
  52. Figueiredo, A.C.; Barroso, J.G.; Pedro, L.G.; Scheffer, J.J.C. Factors affecting secondary metabolite production in plants: Volatile components and essential oils. Flavour Fragr. J. 2008, 23, 213–226. [Google Scholar] [CrossRef]
  53. Zhang, Y.; Zhao, J.; Yang, Z.; Shi, R.; Li, Q.; Wang, Y.; He, L.; Chen, Y. Analysis of Biochemical Components and Antioxidant Capacity of Indocalamus Leaves of Different Varieties. Sci. Technol. Food Ind. 2022, 43, 93–100. [Google Scholar]
  54. Ntobela, B.; Oguntibeju, O.O.; Rautenbach, F.; Etsassala, N.G.; Akinpelu, E.A.; Nchu, F. Evaluating the effect of 40% and 0% shading levels on the secondary metabolites, antifungal and anti-insect activities of extracts of Allium porrum cultivated hydroponically under greenhouse conditions. J. Med. Plants Econ. Dev. 2022, 6, a144. [Google Scholar] [CrossRef]
  55. Formisano, L.; Ciriello, M.; El-Nakhel, C.; Poledica, M.; Starace, G.; Graziani, G.; Ritieni, A.; De Pascale, S.; Rouphael, Y. Pearl Grey Shading Net Boosts the Accumulation of Total Carotenoids and Phenolic Compounds That Accentuate the Antioxidant Activity of Processing Tomato. Antioxidants 2021, 10, 1999. [Google Scholar] [CrossRef] [PubMed]
  56. Neményi, A.; Stefanovitsné-Bányai, É.; Burján, S.S.; Pék, Z.; Hegedus, A.; Gyuricza, C.; Helyes, L. Seasonal Variations in Total Antioxidant Capacity and Total Phenolics Content of Leaves of Phyllostachys Taxa Using Different Extraction Methods. Not. Bot. Horti Agrobot. Cluj-Napoca 2014, 42, 43–50. [Google Scholar] [CrossRef]
  57. Ni, Q.; Xu, G.; Wang, Z.; Gao, Q.; Wang, S.; Zhang, Y. Seasonal Variations of the Antioxidant Composition in Ground Bamboo Sasa argenteastriatus Leaves. Int. J. Mol. Sci. 2012, 13, 2249–2262. [Google Scholar] [CrossRef]
  58. Zaman, S.; Shen, J.; Wang, S.; Wang, Y.; Ding, Z.; Song, D.; Wang, H.; Ding, S.; Pang, X.; Wang, M. Effects of Shading Nets on Reactive Oxygen Species Accumulation, Photosynthetic Changes, and Associated Physiochemical Attributes in Promoting Cold-Induced Damage in Camellia sinensis (L.) Kuntze. Horticulturae 2022, 8, 637. [Google Scholar] [CrossRef]
  59. Quiñones-Muñoz, T.A.; Villanueva-Rodríguez, S.J.; Torruco-Uco, J.G. Nutraceutical Properties of Medicago sativa L., Agave spp., Zea mays L. and Avena sativa L.: A Review of Metabolites and Mechanisms. Metabolites 2022, 12, 806. [Google Scholar] [CrossRef] [PubMed]
  60. Ren, L.; Zhang, J.; Zhang, T. Immunomodulatory activities of polysaccharides from Ganoderma on immune effector cells. Food Chem. 2021, 340, 127933. [Google Scholar] [CrossRef]
  61. Li, S.J.; Li, J.J. Comparison of Chemical Components in Leaves of Indocalamus. Food Res. Dev. 2008, 29, 7–10. [Google Scholar]
  62. Yu, X.; Ming, X.; Xiong, M.; Zhang, C.; Yue, L.; Yang, L.; Fan, C. Partial shade improved the photosynthetic capacity and polysaccharide accumulation of the medicinal plant Bletilla ochracea Schltr. Photosynthetica 2022, 60, 168–178. [Google Scholar] [CrossRef]
  63. Ma, Q.-H.; Wang, X.-H.; Fan, Y.-G.; Bian, L.-S.; Chen, L.; Liu, H.-H.; Ren, F.; Zhang, Y.-A. Effect of shading and forest type on morphological characteristics and bioactive compounds of fruiting bodies of Songshan Lingzhi Ganoderma tsugae (Agaricomycetes). Int. J. Med. Mushrooms 2020, 22, 705–717. [Google Scholar] [CrossRef] [PubMed]
  64. Zheng, Y.; Jiang, W.; Silva, E.N.; Mao, L.; Hannaway, D.; Lu, H. Optimization of shade condition and harvest time for Dendrobium candidum plants based on leaf gas exchange, alkaloids and polysaccharides contents. Plant Omics 2012, 5, 253–260. [Google Scholar]
  65. Acheampong, K.; Hadley, P.; Daymond, A. Photosynthetic activity and early growth of four cacao genotypes as influenced by different shade regimes under West African dry and wet season conditions. Exp. Agric. 2013, 49, 31–42. [Google Scholar] [CrossRef]
  66. Shiflett, S.A.; Zinnert, J.C.; Young, D.R. Seasonal patterns of light availability and light use of broadleaf evergreens in a deciduous forest understory: Potential mechanisms for expansion. Open J. Ecol. 2013, 3, 151–160. [Google Scholar] [CrossRef]
Figure 1. Mean temperature and precipitation during the experimental period.
Plants 12 03993 g001
Figure 2. Responses of (A) the new bamboo rate, (B) Pn, (C) TChl, and (D) Chl a/b ratio to different light environments in Indocalamus. The data in the graphs are the means ± standard errors (SE); based on Duncan’s multiple comparisons method, different lowercase letters indicate significant differences among different bamboo species under the same light environment (p < 0.05); ** indicates highly significant differences among the same bamboo species under different light environments (p < 0.01), and * indicates significant differences among the same bamboo species under different light environments (p < 0.05).
Plants 12 03993 g002
Figure 3. Response of (A) ground diameter, (B) height, (C) single leaf area, and (D) LAI to different light environments in Indocalamus. The data in the graphs are the means ± standard errors (SE); based on Duncan’s multiple comparisons method, different lowercase letters indicate significant differences among different bamboo species under the same light environment (p < 0.05); ** indicates highly significant differences among the same bamboo species under different light environments (p < 0.01), and * indicates significant differences among the same bamboo species under different light environments (p < 0.05).
Plants 12 03993 g003
Figure 4. (A) Average annual TFC contents of each Indocalamus species in the CK and ST treatments; (B) average TFC contents in each season in the CK and ST treatments; (C) before and after change in the TFC contents in Indocalamus in the CK and ST treatments. The diamond dots in (A) indicate the mean values of each of the 14 species of Indocalamus in the four seasons.
Plants 12 03993 g004
Figure 5. (A) Average annual TPC contents of each Indocalamus species in the CK and ST treatments; (B) average TPC contents in each season in the CK and ST treatments; (C) before and after change in the TPC contents of Indocalamus in the CK and ST treatments. The diamond dots in (A) indicate the mean values of each of the 14 species of Indocalamus in the four seasons.
Plants 12 03993 g005
Figure 6. (A) Average annual TPS contents of each Indocalamus species in the CK and ST treatments; (B) average TPS contents in each season in the CK and ST treatments; (C) before and after change in the TPS contents in Indocalamus in the CK and ST treatments. The diamond dots in (A) indicate the mean values of each of the 14 species of Indocalamus in the four seasons.
Plants 12 03993 g006
Figure 7. Correlation analysis between indicators of Indocalamus under the (A) CK treatment and (B) ST treatment. The numbers show the correlation coefficients and the color intensity is proportional to the correlation coefficients: blue indicates a positive correlation, red indicates a negative correlation, and * and ** indicate significant differences at p < 0.05 and p < 0.01, respectively.
Plants 12 03993 g007
Figure 8. (A) Principal component analysis plot and (B) clustering heatmap for each indicator of the contents of active compounds in Indocalamus in the CK treatment and ST treatment. Indicator data were standardized using the linear normalization method, with each column representing a trait and each row representing a species. Darker red indicates higher values and darker blue indicates lower values.
Plants 12 03993 g008
Disclaimer/Publisher’s Note: The statements, opinions and data contained in all publications are solely those of the individual author(s) and contributor(s) and not of MDPI and/or the editor(s). MDPI and/or the editor(s) disclaim responsibility for any injury to people or property resulting from any ideas, methods, instructions or products referred to in the content.

